trends in commercial auto and general liability joseph m. palmer, fcas, cpcu assistant vice...
TRANSCRIPT

Trends in Commercial Auto and General Liability
Joseph M. Palmer, FCAS, CPCUJoseph M. Palmer, FCAS, CPCUAssistant Vice PresidentAssistant Vice President
Increased Limits & Rating Plans DivisionIncreased Limits & Rating Plans Division
Insurance Services Office, Inc. Insurance Services Office, Inc.

Commercial Automobile Overview Latest Basic Limit TrendsLatest Basic Limit Trends Higher Limits TrendsHigher Limits Trends Recent HistoryRecent History Frequency TrendsFrequency Trends ILF Review TrendsILF Review Trends Loss Layer TrendsLoss Layer Trends

Commercial Auto Liability Severity Trends Trends Based on Calendar Year Data Trends Based on Calendar Year Data
Through Latest Evaluation (9/30/2002)Through Latest Evaluation (9/30/2002) State Data Credibility Weighted With State Data Credibility Weighted With
Multistate Data Multistate Data 24-pt. & 12-pt. (Quarterly) Fits Examined24-pt. & 12-pt. (Quarterly) Fits Examined 12-pt. Fits Generally Used 12-pt. Fits Generally Used Incurred Data Also Examined Incurred Data Also Examined

Commercial AutomobileBodily Injury
Data Through 9/30/2002Data Through 9/30/2002 Paid Loss Data --- $25,000 LimitPaid Loss Data --- $25,000 Limit
12-point:12-point: + 3.8%+ 3.8% 24-point:24-point: + 3.0%+ 3.0%

Commercial AutomobileBodily Injury
Data Through 6/30/2002Data Through 6/30/2002 Incurred Loss Data --- $25,000 Limit Incurred Loss Data --- $25,000 Limit
12-point:12-point: + 3.9%+ 3.9% 24-point:24-point: + 3.9%+ 3.9%

Commercial AutomobileBodily Injury
Data Through 9/30/2002Data Through 9/30/2002 Paid Loss Data --- $100,000 LimitPaid Loss Data --- $100,000 Limit
12-point:12-point: + 4.9%+ 4.9% 24-point:24-point: + 4.1%+ 4.1%

Commercial AutomobileBodily Injury
Data Through 6/30/2002Data Through 6/30/2002 Incurred Loss Data --- $100,000 Limit Incurred Loss Data --- $100,000 Limit
12-point:12-point: + 5.7%+ 5.7% 24-point:24-point: + 5.2%+ 5.2%

Commercial Auto Bodily InjuryHistory of 25K and 100K Trends
March, 1999 through Oct. 2002
0.0%
1.0%
2.0%
3.0%
4.0%
5.0%
6.0%
7.0%
25,000100,000

Commercial AutomobileBodily Injury
Data Through 9/30/2002Data Through 9/30/2002 Paid Loss Data --- $1 Million LimitPaid Loss Data --- $1 Million Limit
12-point:12-point: + 6.8%+ 6.8% 24-point:24-point: + 6.7%+ 6.7%

Commercial AutomobileBodily Injury
Data Through 9/30/2002Data Through 9/30/2002 Paid Loss Data --- Total LimitsPaid Loss Data --- Total Limits
12-point:12-point: + 7.5%+ 7.5% 24-point:24-point: + 7.1%+ 7.1%

Commercial AutomobileBodily Injury
Data Through 6/30/2002Data Through 6/30/2002 Incurred Loss Data --- Total LimitsIncurred Loss Data --- Total Limits
12-point:12-point: + 6.6%+ 6.6% 24-point:24-point: + 6.5%+ 6.5%

Commercial Auto Bodily InjuryHistory of 1 Million and Total Limits Trends
March, 1999 through Oct. 2002
0.0%
2.0%
4.0%
6.0%
8.0%
10.0%
12.0%
1 Mill.Total

Commercial AutomobileProperty Damage
Data Through 9/30/2002Data Through 9/30/2002 Paid Loss Data --- Total LimitsPaid Loss Data --- Total Limits
12-point:12-point: + 6.8%+ 6.8% 24-point:24-point: + 5.7%+ 5.7%

Commercial AutomobileProperty Damage
Data Through 6/30/2002Data Through 6/30/2002 Incurred Loss Data --- Total LimitsIncurred Loss Data --- Total Limits
12-point:12-point: + 5.4%+ 5.4% 24-point:24-point: + 5.0%+ 5.0%

Commercial Auto Property DamageHistory of Total Limits Trends
March, 1999 through Oct. 2002
0.0%
1.0%
2.0%
3.0%
4.0%
5.0%
6.0%
7.0%

Commercial AutomobileStatewide Variation
Bodily Injury Severity Bodily Injury Severity Low Statewide CredibilityLow Statewide Credibility All Commercial Auto Data used in All Commercial Auto Data used in
analysesanalyses Only 4 States with Greater than 15% Only 4 States with Greater than 15%
CredibilityCredibility Limited Variation between States after Limited Variation between States after
Trends are Credibility-WeightedTrends are Credibility-Weighted

Commercial Automobile Bodily Injury Frequency Trends
3/31/1996 through 12/31/2001
0
0.2
0.4
0.6
0.8
1
1.2
1.4
1.6
1.8

Commercial Automobile Property Damage Frequency Trends
3/31/1996 through 12/31/2001
4.2
4.4
4.6
4.8
5
5.2
5.4
5.6
5.8

Commercial AutomobilePolicy Limit Distribution
ISO Database Composition:ISO Database Composition: 70% at $1 Million Limit70% at $1 Million Limit 5% at $300,000 Limit5% at $300,000 Limit 15% at $500,000 Limit15% at $500,000 Limit 5% at $2 Million Limit5% at $2 Million Limit
Varies by TableVaries by Table

Commercial AutomobileILF Review Trends
0.0%
1.0%
2.0%
3.0%
4.0%
5.0%
6.0%
7.0%
8.0%
1994 1995 1996 1997 1998 1999 2000 2001 2002

Commercial AutomobileBodily Injury Excess Trends
Data Through 9/30/2002Data Through 9/30/2002 Paid Loss Data --- Excess LimitsPaid Loss Data --- Excess Limits $400,000 xs $100,000$400,000 xs $100,000
12-point:12-point: + 9.0%+ 9.0% 24-point:24-point: + 9.4%+ 9.4%

Commercial AutomobileBodily Injury Excess Trends
Data Through 9/30/2002Data Through 9/30/2002 Paid Loss Data --- Excess LimitsPaid Loss Data --- Excess Limits $500,000 xs $500,000$500,000 xs $500,000
12-point:12-point: + 11.0%+ 11.0% 24-point:24-point: + 14.9%+ 14.9%

General LiabilityOverview
Latest Trends --- Basic, Total, ALAELatest Trends --- Basic, Total, ALAE Recent HistoryRecent History Frequency TrendsFrequency Trends ILF Review TrendsILF Review Trends
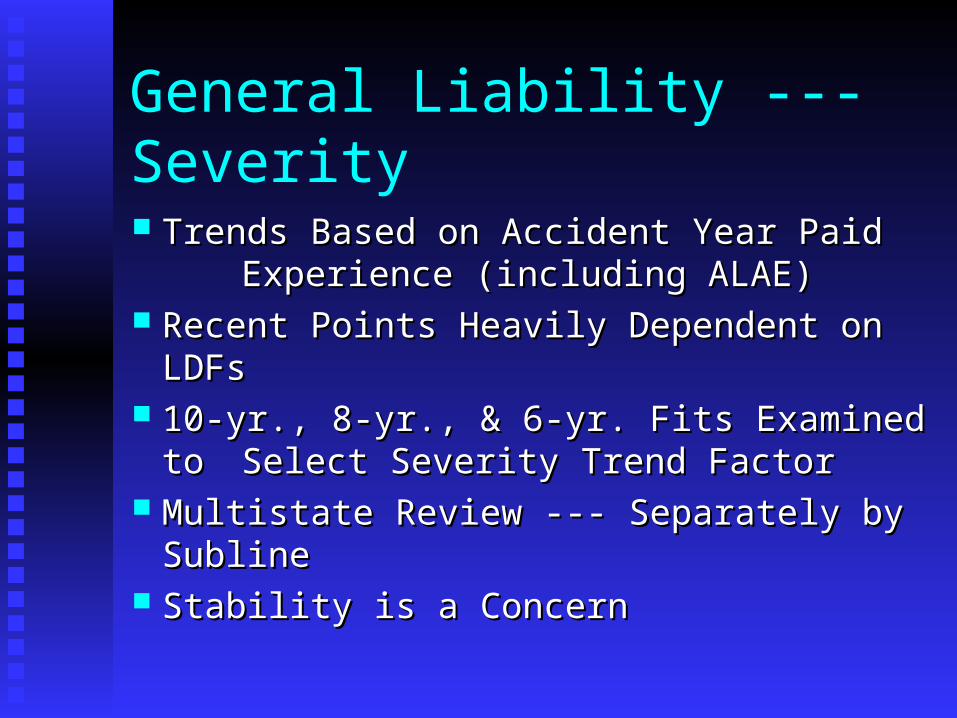
General Liability --- Severity
Trends Based on Accident Year Paid Trends Based on Accident Year Paid Experience (including ALAE)Experience (including ALAE)
Recent Points Heavily Dependent on LDFs Recent Points Heavily Dependent on LDFs 10-yr., 8-yr., & 6-yr. Fits Examined to 10-yr., 8-yr., & 6-yr. Fits Examined to
Select Severity Trend FactorSelect Severity Trend Factor Multistate Review --- Separately by Subline Multistate Review --- Separately by Subline Stability is a ConcernStability is a Concern

General Liability --- OL&TBI Severity Trends (10 yr.)
$100,000 Indemnity $100,000 Indemnity + 3.1%+ 3.1%
ALAE ALAE + 6.3%+ 6.3%
Losses and ALAELosses and ALAE $100,000 Limit: + 4.0%$100,000 Limit: + 4.0% Total Limits:Total Limits: + 5.4%+ 5.4%

General Liability --- OL&TPD Severity Trends (10 yr.)
$100,000 Indemnity $100,000 Indemnity + 6.1%+ 6.1%
ALAE ALAE + 10.5%+ 10.5%
Losses and ALAELosses and ALAE $100,000 Limit: + 8.2%$100,000 Limit: + 8.2% Total Limits:Total Limits: + 8.6%+ 8.6%

General LiabilityOL&T Severity TrendsCalendar 1997 through Fiscal 2003
0
1
2
3
4
5
6
7
8
9
BIPD

General Liability --- M&CBI Severity Trends (10 yr.)
$100,000 Indemnity $100,000 Indemnity + 2.3%+ 2.3%
ALAE ALAE + 5.6%+ 5.6%
Losses and ALAELosses and ALAE $100,000 Limit: + 3.6%$100,000 Limit: + 3.6% Total Limits:Total Limits: + 4.7%+ 4.7%

General Liability --- M&CPD Severity Trends (10 yr.)
$100,000 Indemnity $100,000 Indemnity + 6.7%+ 6.7%
ALAE ALAE + 7.1%+ 7.1%
Losses and ALAELosses and ALAE $100,000 Limit: + 6.8%$100,000 Limit: + 6.8% Total Limits:Total Limits: + 7.2%+ 7.2%

General LiabilityM&C Severity TrendsCalendar 1997 through Fiscal 2003
0
1
2
3
4
5
6
7
8
BIPD

General Liability --- Products BI Severity Trends (10 yr.) $100,000 Indemnity $100,000 Indemnity
+ 2.3%+ 2.3% ALAE ALAE
+ 7.8%+ 7.8% Losses and ALAELosses and ALAE
$100,000 Limit: + 5.2%$100,000 Limit: + 5.2% Total Limits:Total Limits: + 4.3%+ 4.3%

General Liability --- Products (a)BI Severity Trends (10 yr.)
$100,000 Indemnity $100,000 Indemnity + 2.6%+ 2.6%
ALAE ALAE + 12.4%+ 12.4%
Losses and ALAELosses and ALAE $100,000 Limit: + 8.2%$100,000 Limit: + 8.2% Total Limits:Total Limits: + 7.1%+ 7.1%

General Liability --- Products PD Severity Trends (10 yr.) $100,000 Indemnity $100,000 Indemnity
+ 4.2%+ 4.2% ALAE ALAE
+ 7.4%+ 7.4% Losses and ALAELosses and ALAE
$100,000 Limit: + 5.8%$100,000 Limit: + 5.8% Total Limits:Total Limits: + 5.4%+ 5.4%

General Liability --- Products (a) PD Severity Trends (10 yr.)
$100,000 Indemnity $100,000 Indemnity + 7.0%+ 7.0%
ALAE ALAE + 10.6%+ 10.6%
Losses and ALAELosses and ALAE $100,000 Limit: + 8.8%$100,000 Limit: + 8.8% Total Limits:Total Limits: + 10.2%+ 10.2%

General LiabilityProducts Severity Trends
0.0%
1.0%
2.0%
3.0%
4.0%
5.0%
6.0%
1999 2000 2001 2002 2003
BIPD

General Liability --- LP/CO BI Severity Trends (10 yr.) $100,000 Indemnity $100,000 Indemnity
+ 3.7%+ 3.7% ALAE ALAE
+ 9.3%+ 9.3% Losses and ALAELosses and ALAE
$100,000 Limit: + 6.3%$100,000 Limit: + 6.3% Total Limits:Total Limits: + 8.7%+ 8.7%

General Liability --- LP/CO (a)BI Severity Trends (10 yr.) $100,000 Indemnity $100,000 Indemnity
- 2.4%- 2.4% ALAE ALAE
- 0.8%- 0.8% Losses and ALAELosses and ALAE
$100,000 Limit: - 1.5%$100,000 Limit: - 1.5% Total Limits:Total Limits: - 2.4%- 2.4%
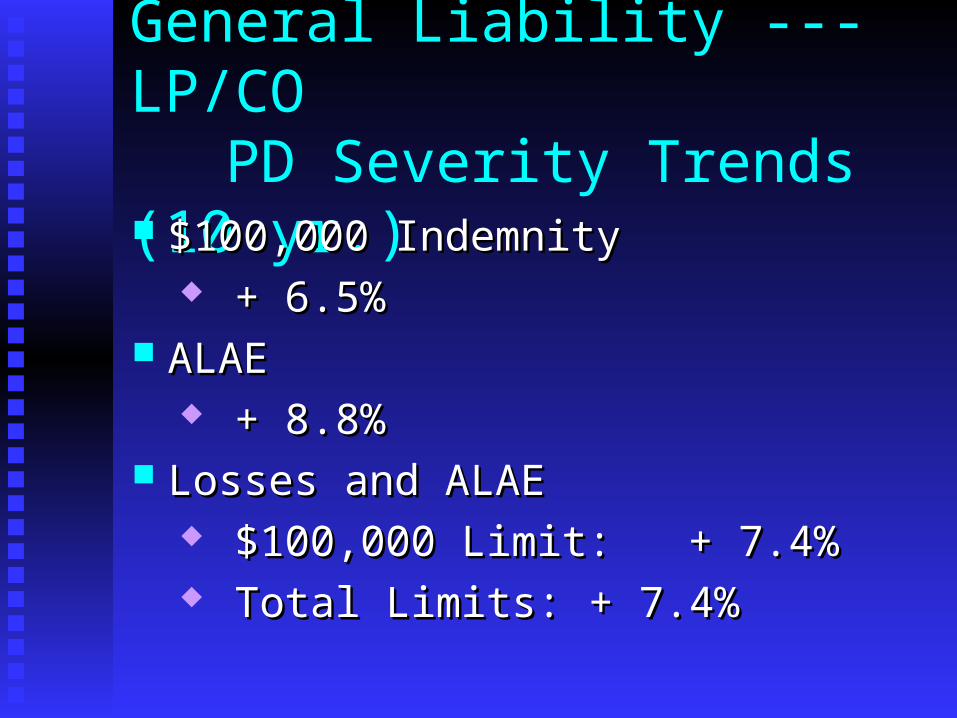
General Liability --- LP/CO PD Severity Trends (10 yr.) $100,000 Indemnity $100,000 Indemnity
+ 6.5%+ 6.5% ALAE ALAE
+ 8.8%+ 8.8% Losses and ALAELosses and ALAE
$100,000 Limit: + 7.4%$100,000 Limit: + 7.4% Total Limits:Total Limits: + 7.4%+ 7.4%

General Liability --- LP/CO (a) PD Severity Trends (10 yr.) $100,000 Indemnity $100,000 Indemnity
+ 9.8%+ 9.8% ALAE ALAE
+ 12.1%+ 12.1% Losses and ALAELosses and ALAE
$100,000 Limit: + 10.9%$100,000 Limit: + 10.9% Total Limits:Total Limits: + 9.8%+ 9.8%
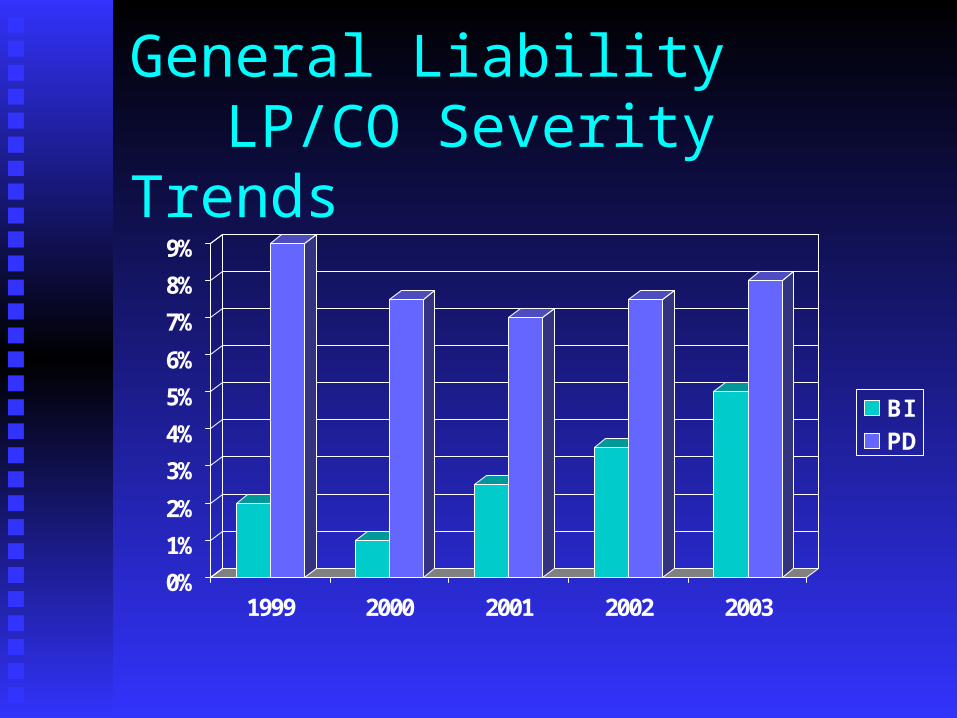
General LiabilityLP/CO Severity Trends
0%
1%
2%
3%
4%
5%
6%
7%
8%
9%
1999 2000 2001 2002 2003
BIPD
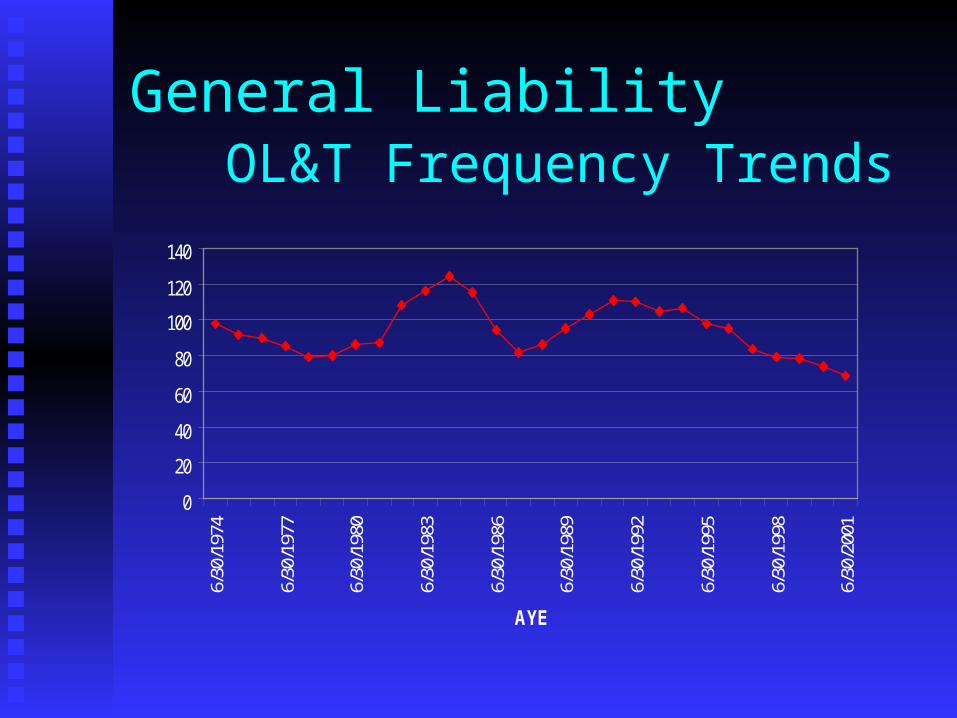
General LiabilityOL&T Frequency Trends
0
20
40
60
80
100
120
140
6/30
/197
4
6/30
/197
7
6/30
/198
0
6/30
/198
3
6/30
/198
6
6/30
/198
9
6/30
/199
2
6/30
/199
5
6/30
/199
8
6/30
/200
1
AYE

General LiabilityM&C Frequency Trends
0
20
40
60
80
100
120
140
1606/
30/1
971
6/30
/197
4
6/30
/197
7
6/30
/198
0
6/30
/198
3
6/30
/198
6
6/30
/198
9
6/30
/199
2
6/30
/199
5
6/30
/199
8
6/30
/200
1
AYE
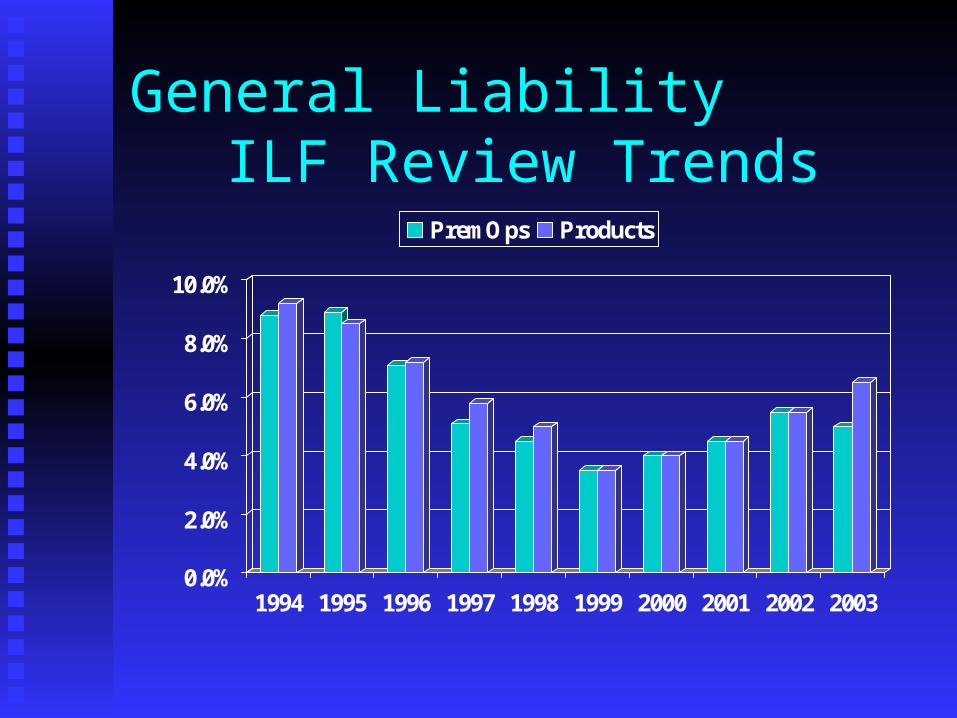
General LiabilityILF Review Trends
0.0%
2.0%
4.0%
6.0%
8.0%
10.0%
1994 1995 1996 1997 1998 1999 2000 2001 2002 2003
PremOps Products

General LiabilityPolicy Limit Distribution
ISO Database Composition:ISO Database Composition: 85% at $1 Million Limit85% at $1 Million Limit 4% at $500,000 Limit4% at $500,000 Limit 5-6% at $2 Million Limit5-6% at $2 Million Limit 1-2% at $5 Million Limit 1-2% at $5 Million Limit

Sample Definition of Construction Defects
A construction defect is “the failure of the A construction defect is “the failure of the building or any building component to be building or any building component to be erected in a reasonably workman like erected in a reasonably workman like manner or to perform in the manner intended manner or to perform in the manner intended by the manufacturer or reasonably expected by the manufacturer or reasonably expected by the buyer, which proximately causes by the buyer, which proximately causes damage to the structure.” (CA State Jury damage to the structure.” (CA State Jury Instructions)Instructions)

Types of Defects
Many courts have recognized twoMany courts have recognized two
primary categories of defects for whichprimary categories of defects for which
damages are recoverable:damages are recoverable: Defects in design, workmanship and Defects in design, workmanship and
materialsmaterials Landslide and earth settlement problemsLandslide and earth settlement problems

Examples of Design Defects
Faulty drainageFaulty drainage Improper landscaping Improper landscaping
and irrigationand irrigation Improper materialsImproper materials Structural failure or Structural failure or
collapsecollapse Defective plumbingDefective plumbing Faulty electrical wiringFaulty electrical wiring
Inadequate Inadequate environmental environmental controlscontrols
Defective lighting Defective lighting or securityor security
Insufficient Insufficient insulationinsulation
Poor sound Poor sound protectionprotection

Landslide Problems
Expansive soilsExpansive soils Underground water or Underground water or
streamsstreams Ancient land slidesAncient land slides Vertical settlementVertical settlement Horizontal movementHorizontal movement
Land slidingLand sliding Surface failuresSurface failures Improper compactionImproper compaction Inadequate grading Inadequate grading
and drainageand drainage

Completed Operations DataISO DataISO Data
Data does not identify construction defects Data does not identify construction defects claimsclaims
Completed OperationsCompleted Operations
Looked at latest 5 years (1997 – 2001)Looked at latest 5 years (1997 – 2001)
California data is not includedCalifornia data is not included
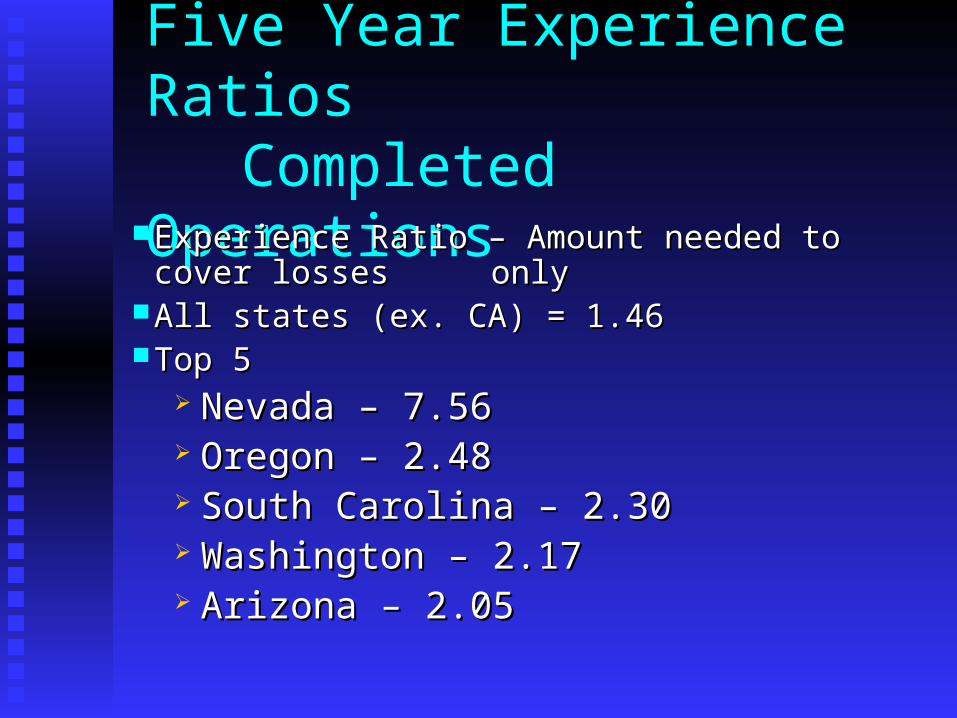
Five Year Experience RatiosCompleted Operations
Experience Ratio – Amount needed to cover losses Experience Ratio – Amount needed to cover losses onlyonly
All states (ex. CA) = 1.46All states (ex. CA) = 1.46 Top 5Top 5
Nevada – 7.56Nevada – 7.56 Oregon – 2.48Oregon – 2.48 South Carolina – 2.30South Carolina – 2.30 Washington – 2.17Washington – 2.17 Arizona – 2.05Arizona – 2.05

Trends in Commercial Auto and General Liability
Joseph M. Palmer, FCAS, CPCUJoseph M. Palmer, FCAS, CPCUAssistant Vice PresidentAssistant Vice President
Increased Limits & Rating Plans DivisionIncreased Limits & Rating Plans Division
Insurance Services Office, Inc. Insurance Services Office, Inc.
201-469-2599201-469-2599