trends in cancer incidence in singapore - nrdo.gov.sg
TRANSCRIPT
1
Singapore Cancer Registry
Interim Annual Registry Report
Trends in Cancer Incidence in Singapore
2009-2013
National Registry of Diseases Office
(NRDO) 1
st July 2014

2
Acknowledgement
This report was produced with joint effort from the following:
Singapore Cancer Registry Advisory Committee
Prof Lee Hin Peng Chairman Saw Swee Hock School of Public
Health, NUS
Health Promotion Board
Research & Strategic Planning Division
Dr Chew Ling Director
National Registry Of Diseases Office
Dr Chow Khuan Yew Deputy Director
Khaing Tin Tin Executive (Cancer Registry)
Ms Loy En Yun Manager (Epidemiology)
Mr William Ho Manager (Data Management)

3
TABLE OF CONTENTS
1 GLOSSARY ................................................................................................................... 6
2 EXECUTIVE SUMMARY ............................................................................................. 7
3 INTRODUCTION .......................................................................................................... 8
4 SOURCE OF DATA AND DATA PROCESSING ......................................................... 8
5 OVERALL FINDINGS ................................................................................................ 11
5.1 Notifications by Year of Diagnosis ..........................................................................................11
Table 1: Number of Incident Cancers by Year of Diagnosis, 2009-2013 ............................................11
5.2 Incidence of Cancers for the Period, 2009-2013 ......................................................................11
Table 2: Incidence of Cancers by Gender, 2009-2013 ........................................................................11
Table 3: Age-Standardised Incidence Rates for All Cancers by Ethnic Groups and Gender, 2009-
2013 ........................................................................................................................................12
5.3 Ten Most Frequent Cancers, 2009-2013 ..................................................................................12
Table 4: Ten Most Frequent Cancers in Males, 2009-2013 ...........................................................12
Figure 1: Ten Most Frequent Cancers (%) in Males, 2009 -2013 ....................................................13
Table 5: Ten Most Frequent Cancers in Females, 2009-2013 ........................................................13
Figure 2: Ten Most Frequent Cancers in Singapore Females (%), 2009 – 2013 .............................14
5.4 Highest Ranking Cancers in Different Ethnic Groups, 2009-2013 ..........................................14
Table 6: Highest Ranking Cancers among Chinese Residents, 2009-2013 ....................................15
Table 7: Highest Ranking Cancers among Malay Residents, 2009-2013 .......................................15
Table 8: Highest Ranking Cancers among Indian Residents, 2009-2013 .......................................16
5.5 Mortality Rates by Gender, 2009-2013 ....................................................................................17
Table 9: Ten Most Frequent Cancer Deaths in Males, 2009-2013 ................................................17
(Source: RBD, MHA) ...........................................................................................................................17
Table 10: Ten Most Frequent Cancer Deaths in Females, 2009-2013 ............................................17
(Source: RBD, MHA) ...........................................................................................................................17
6. COMMENTARY ON SELECTED CANCER SITES .................................................................. 18
6.1 Breast Cancer ..........................................................................................................................................18
Figure 1: Age-Standardised Incidence Rates for Breast Cancer, 1974-2013 ......................................18
Table 1: Crude and Age-Standardised Incidence Rates for Breast Cancer by Ethnic Group, 2009-
2013 ........................................................................................................................................18
Figure 2: Age-Specific Incidence Rates for Breast Cancer, 2009-2013 ..............................................19
Figure 3: Age-Standardised Mortality Rates for Breast Cancer, 1974-2013 ......................................20
Table 2: Ethnic distribution of breast cancer patients, 2004-2013 .....................................................20

4
Table 3: Age distribution of breast cancer patients, 2004-2013 ..........................................................20
Table 4: 5-year Age-Standardised Observed Survival of Breast Cancer by Ethnicity and Age Group
2004-2013 ...............................................................................................................................21
6.2 Cervical Cancer .......................................................................................................................................22
Figure 4: Age-Standardised Incidence Rates for Cervical Cancer, 1974-2013 ..................................22
Table 5: Crude and Age-Standardised Incidence Rates for Cervical Cancer by Ethnic Group, 2009-
2013 ........................................................................................................................................22
Figure 5: Age-Specific Incidence Rate for Cervical Cancer, 2009-2013 ............................................23
Figure 6: Age-standardised Mortality Rates for Cervical Cancer, 1974-2013 ...................................24
Table 6: Ethnic distribution of cervical cancer patients, 2004-2013 ...................................................24
Table 7: Age distribution of cervical cancer patients, 2004-2013 .......................................................24
Table 8: 5-year Age-Standardised Observed Survival of Cervical Cancer by Ethnicity and Age Group,
2004-2013 ...............................................................................................................................25
6.3 Colorectal Cancer ....................................................................................................................................26
Figure 7: Age-standardised Incidence Rate for Colorectal Cancer by Gender, 1974-2013 ...............26
Table 9: Crude and Age-standardised Incidence Rates for Colorectal Cancer by Ethnic Group,
2009-2013 ...............................................................................................................................27
Figure 8: Age-Specific Incidence Rate for Colorectal Cancer, 2009-2013 .........................................27
Figure 9: Age-standardised Mortality Rates for Colorectal Cancer, 1974-2013 ................................28
Table 10: Ethnic distribution of colorectal cancer patients, 2004-2013 .............................................28
Table 11: Age distribution of colorectal cancer patients, 2004-2013 ..................................................29
Table 12: 5-year Age-Standardised Observed Survival of Colorectal Cancer by Ethnicity and Age
Group 2004-2013.................................................................................................. ...................30
6.4 Ovarian Cancer ........................................................................................................................................31
Figure 10: Age-standardised Incidence Rate for Ovarian Cancer, 1974-2013 ...................................31
Table 13: Crude and Age-Standardised Incidence Rates for Ovarian Cancer by Ethnic Group, 2009-
2013 ........................................................................................................................................31
Figure 11: Age-Specific Incidence Rate for Ovarian Cancer, 2009-2013 ...........................................32
Figure 12: Age-standardised Mortality Rates for Ovarian Cancer, 1974-2013 ..................................33
Table 14: Ethnic distribution of ovarian cancer patients, 2004-2013 .................................................33
Table 15: Age distribution of ovarian cancer patients, 2004-2013 .....................................................34
Table 16: 5-year Age-Standardised Observed Survival of Ovarian Cancer by Ethnicity and Age
Group, 2004-2013 ...................................................................................................................34
6.5 Uterine Cancer .........................................................................................................................................35
Figure 13: Age-standardised Incidence Rate for Uterine Cancer, 1974-2013 ....................................35
Table 17: Crude and Age-Standardised Incidence Rates for Uterine Cancer by Ethnic Group, 2009-
2013 ........................................................................................................................................35

5
Figure 14: Age-Specific Incidence Rate for Uterine Cancer, 2009-2013 ............................................36
Figure 15: Age-standardised Mortality Rates for Uterine Cancer, 1974-2013 ...................................37
Table 18: Ethnic distribution of uterine cancer patients, 2004-2013 ..................................................37
Table 19: Age distribution of uterine cancer patients, 2004-2013 ......................................................38
Table 20: 5-year Age-Standardised Observed Survival of Uterine Cancer by Ethnicity and Age
Group, 2004-2013 ...................................................................................................................38
6.6 Prostate Cancer ........................................................................................................................................39
Figure 16: Age-standardised Incidence Rate for Prostate Cancer, 1974-2013 ...................................40
Table 21: Crude and Age-Standardised Incidence Rates for Prostate Cancer by Ethnic Group, 2009-
2013 ........................................................................................................................................40
Figure 17: Age-Specific Incidence Rate for Prostate Cancer, 2009-2013 ..........................................41
Figure 18: Age-standardised Mortality Rates for Prostate Cancer, 1974-2013 .................................41
Table 22: Ethnic distribution of prostate cancer patients, 2004-2013 ................................................42
Table 23: Age distribution of prostate cancer patients, 2004-2013 .....................................................42
Table 24: 5-year Age-Standardised Observed Survival of Prostate Cancer by Ethnicity and Age
Group, 2004-2013 ...................................................................................................................42
6.7 Lung Cancer ............................................................................................................................................43
Figure 19: Age-standardised Incidence Rate for Lung Cancer by Gender, 1974-2013 ......................43
Table 25: Crude and Age-standardised Incidence Rates for Lung Cancer by Ethnic Group, 2009-
2013 ........................................................................................................................................44
Figure 20: Age-Specific Incidence Rate for Lung Cancer, 2009-2013 ................................................44
Figure 21: Age-Standardised Mortality Rate for Lung Cancer, Singapore 2009-2013.......................45
Table 26: Ethnic distribution of lung cancer patients, 2004-2013 ......................................................45
Table 27: Age distribution of lung cancer patients, 2004-2013 ...........................................................46
Table 28: 5-year Age-Standardised Observed Survival of Lung Cancer by Ethnicity and Age Group,
2004-2013 ...............................................................................................................................47

6
CANCER REGISTRY REPORT FOR THE YEARS 2009 – 2013
1 GLOSSARY
Crude rate (CR): Crude incidence or mortality rate is the number of cancer cases
or deaths divided by the mid-year general population respectively.
Age-standardised rate (ASR): Age-standardised incidence or mortality rate is the
rate that would be observed if the general population had the age structure of an
external world standard population. Age standardisation facilitates the
comparison of rates across time, and also across countries. In this report, Segi’s
world population was used in direct age-standardisation.
Internally age-standardised rate (IASR): The internally age-standardised
incidence rate is used to age-standardise incidence against the age structure of
Singapore’s population as at the 2010 Census. This metric is used to compare
the incidence rates in Singapore over time.
The CR, ASR and IASR figures in this report are stated as per 100,000
population.
Observed Survival: Percentage of patients that survive after a specific time
period. This estimate includes death from cancer and also from other causes.

7
2 EXECUTIVE SUMMARY
A total number of 58,654 incident cancer cases were diagnosed among the
Resident population during the period 2009-2013 (Table 1). Of these 28,475
(48.5%) were reported in males and 30,179 (51.5%) in females (Table 2).
The crude incidence rates for total male and female cancer patients for the
period 2009-2013 were 304.7 and 314 per 100,000 Singapore resident
populations per year respectively (Table 2). The corresponding age-standardised
incidence rates were 228.9 and 213.4 per 100,000 person-years.
In both males and females, the crude and age-standardised rates were highest in
Chinese followed by Malays and Indians (Table 3).
Colorectal, lung and prostate cancer were the top ranked cancers among the
male resident population (Table 4). Among female residents, breast, colorectal
and lung cancers were the most common (Table 5).
The incidence (number and rates) of cancer for the period 2009-2013 has
increased compared to the incidence reported for the period 2008-2012 though
the type and order of top ranked cancers have remained the same.
Lung cancer and breast cancer had the highest mortality rates in males and
females respectively (Tables 9, 10).

8
3 INTRODUCTION
The Singapore Cancer Registry provides information on cancer patterns and
trends in Singapore. The comprehensive population-based cancer registration in
Singapore began in January 1968. In April 2001, the Cancer Registry came
under the auspices of the National Registry of Diseases Office (NRDO).
MOH enacted the National Registry of Diseases Act in 2007 to enable the
disease registries to access medical information while safeguarding data
confidentiality. Cancer was the first disease to be covered by the Act.
4 SOURCE OF DATA AND DATA PROCESSING
Comprehensive cancer registration was achieved through data obtained from a
combination of sources, viz., (a) notifications by the medical profession, (b)
pathology records, (c) hospital records, and (d) mortality data from the Registry
of Births and Deaths (RBD), Ministry of Home Affairs (MHA). Notifications were
mandatory since 2009.
For cancer cases obtained from sources other than physician’s notifications, the
data were checked against known registered cases in the registry. For missed
notifications, the doctors-in-charge would be informed and reminded to notify.
About 10% of cases were not notified by physicians, and would need to be
registered by the Registry staff.
9
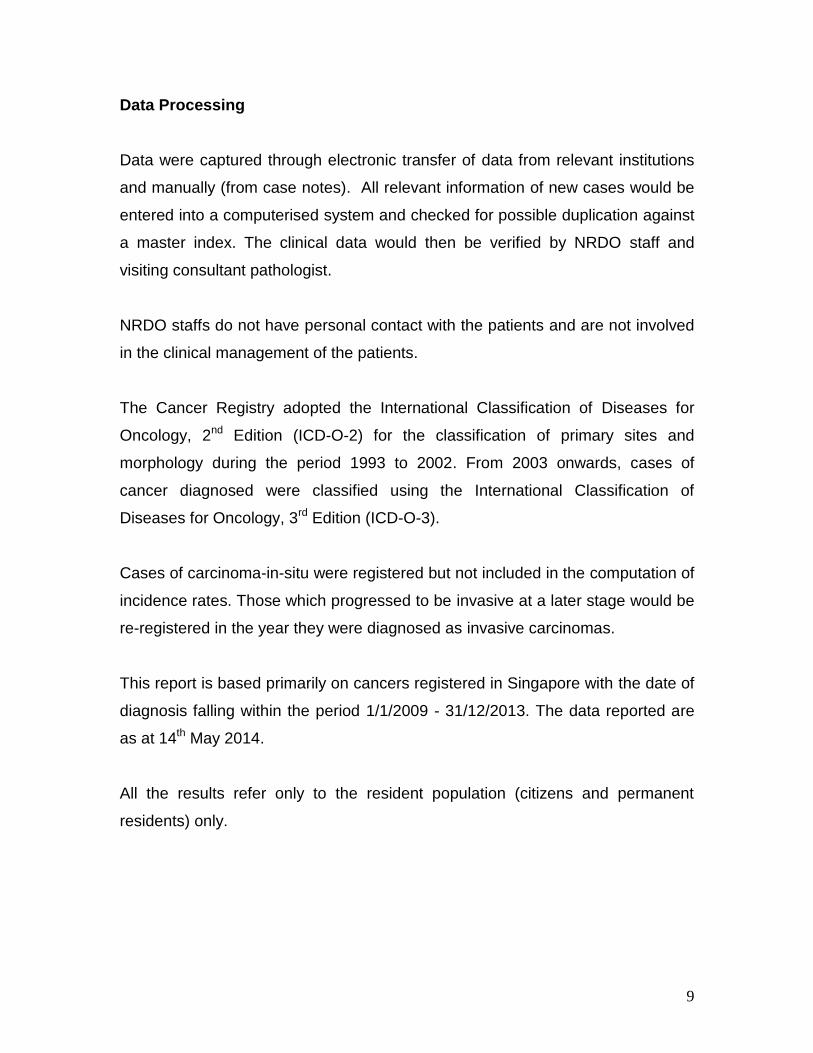
Data Processing
Data were captured through electronic transfer of data from relevant institutions
and manually (from case notes). All relevant information of new cases would be
entered into a computerised system and checked for possible duplication against
a master index. The clinical data would then be verified by NRDO staff and
visiting consultant pathologist.
NRDO staffs do not have personal contact with the patients and are not involved
in the clinical management of the patients.
The Cancer Registry adopted the International Classification of Diseases for
Oncology, 2nd Edition (ICD-O-2) for the classification of primary sites and
morphology during the period 1993 to 2002. From 2003 onwards, cases of
cancer diagnosed were classified using the International Classification of
Diseases for Oncology, 3rd Edition (ICD-O-3).
Cases of carcinoma-in-situ were registered but not included in the computation of
incidence rates. Those which progressed to be invasive at a later stage would be
re-registered in the year they were diagnosed as invasive carcinomas.
This report is based primarily on cancers registered in Singapore with the date of
diagnosis falling within the period 1/1/2009 - 31/12/2013. The data reported are
as at 14th May 2014.
All the results refer only to the resident population (citizens and permanent
residents) only.

10
Population Denominators
In this report, we have used the population denominators obtained from
Department of Statistics (DOS) to compute the rates. DOS releases mid-year
population estimates annually and these population denominators are widely
used in official publications in Singapore, including those published by the
Ministry of Health. Segi’s World Population was used for direct standardisation to
calculate age-standardised rates.
Survival
Calculation of survival follows the methodology in ‘Cancer Survival in Singapore,
1968-2007’ except that the life table used to generate expected survival for 2003-
2013 were obtained from DOS.
In addition, the Brenner method is now used for age-standardisation1. This was
done so that age-standardised survival could still be obtained even if none of the
patients within one or more age strata was followed up over the entire period of
interest. Furthermore, this method also assures that age-adjustment using the
study’s population own age-distribution yields exactly the same result as
obtained in the crude analysis.
The site-specific age groups in the distribution tables were based on the age
categories for weights used to obtain age-standardised survival.
1 H. Brenner et al. An alternative approach to age adjustment of cancer survival rates. European Journal of Cancer 40
(2004), 2317–2322.

11
5 OVERALL FINDINGS
5.1 Notifications by Year of Diagnosis
For the period 2009 to 2013, the number of notifications per year had increased
year on year (Table 1).
Table 1: Number of Incident Cancers by Year of Diagnosis, 2009-2013
Year of diagnosis 2009 2010 2011 2012 2013 2009-2013
No. of notifications 10,817 11,367 11,653 12,124 12,693 58,654
5.2 Incidence of Cancers for the Period, 2009-2013
A total number of 58,654 incident cases were diagnosed among the Resident
population during the period 2009-2013. Of these, 28,475 (48.5%) and 30,179
(51.5%) were reported in males and females respectively (Table 2).
Table 2: Incidence of Cancers by Gender, 2009-2013
Gender Number % CR (95% CI) ASR (95% CI)
Male 28,475 48.55 304.7 (301.2-308.2) 228.9 (226.2-231.7)
Female 30,179 51.45 314.0 (310.4-317.5) 213.4 (210.9-215.9)
The crude incidence rates for total male and female cancer patients for the
period 2009-2013 were 304.7 and 314 per 100, 000 Singapore resident
population per year respectively. The corresponding age-standardised incidence
rates were 228.9 and 213.4 per 100,000 person-years.
Among the males, the crude and age-standardised rates were highest in Chinese
followed by Malays and Indians. This was also seen in the females (Table 3).

12
Table 3: Age-Standardised Incidence Rates for All Cancers by Ethnic Groups and Gender, 2009-2013
Gender Race Number CR (95% CI) ASR (95% CI)
Male Chinese 23,947 347.7 (343.3-352.1) 239.4 (236.2-242.5)
Malay 2,454 194.7 (187.0-202.4) 188.9 (181.2-196.6)
Indian 1,265 140.5 (132.7-148.2) 139.9 (131.8-148.1)
All 28,475 304.7 (301.2-308.2) 228.9 (226.2-231.7)
Female Chinese 24,890 347.1 (342.8-351.4) 218.2 (215.4-221.1)
Malay 3,038 238.9 (230.4-247.4) 199.4 (192.0-206.7)
Indian 1,555 184.6 (175.4-193.8) 170.5 (161.8-179.2)
All 30,179 314.0 (310.4-317.5) 213.4 (210.9-215.9)
5.3 Ten Most Frequent Cancers, 2009-2013
Similar to the findings of the trend report for the period 2008-2012, colorectal,
lung and prostate cancer were the most common cancers among the male
resident population (Table 4, Figure 1).
Table 4: Ten Most Frequent Cancers in Males, 2009-2013
Rank Site Number % CR (95% CI) ASR (95% CI)
1 Colo-rectum 4,934 17.3 52.8 (51.3-54.3) 38.7 (37.6-39.8)
2 Lung 4,287 15.1 45.9 (44.5-47.2) 33.8 (32.7-34.8)
3 Prostate 3,456 12.2 37.0 (35.7-38.2) 28.1 (27.1-29.0)
4 Liver 2,110 7.4 22.6 (21.6-23.5) 16.6 (15.8-17.3)
5 Lymphoid neoplasms 1,888 6.6 20.2 (19.3-21.1) 16.7 (15.9-17.5)
6 Skin, including melanoma 1,595 5.6 17.1 (16.2-17.9) 12.5 (11.9-13.1)
7 Stomach 1,407 4.9 15.1 (14.3-15.8) 11.1 (10.5-11.7)
8 Nasopharynx 1,119 3.9 12.0 (11.3-12.7) 8.4 (7.9-8.9)
9 Kidney & Other Urinary 1037 3.7 11.1 (10.4-11.8) 8.1 (7.6-8.6)
10 Myeloid neoplasms 849 3.0 9.1 (8.5-9.7) 7.1 (6.6-7.6)
Others 5,793 20.3
All 28,475 100.0 304.7 (301.2-308.2) 228.9 (226.2-231.7)
*Other urinary refers to renal pelvis, ureter, urethra etc.

13
Figure 1: Ten Most Frequent Cancers (%) in Males, 2009 -2013
Among female residents, breast, colorectal and lung cancer were the top ranked
cancers (Table 5, Figure 2). The findings for both males and females were similar
to the trends reported for the period 2008-2012.
Table 5: Ten Most Frequent Cancers in Females, 2009-2013 Rank Site Number % CR (95% CI) ASR (95% CI)
1 Breast 8,860 29.4 92.2 (90.3-94.1) 63.4 (62.1-64.7)
2 Colo-rectum 3,995 13.2 41.6 (40.3-42.8) 26.3 (25.5-27.1)
3 Lung 2,271 7.5 23.6 (22.7-24.6) 14.9 (14.2-15.5)
4 Corpus uteri 1,910 6.3 19.9 (19.0-20.8) 13.7 (13.1-14.3)
5 Ovary, etc. 1,640 5.4 17.1 (16.2-17.9) 12.4 (11.8-13.0)
6 Skin, including melanoma 1,331 4.4 13.8 (13.1-14.6) 8.4 (8.0-8.9)
7 Lymphoid neoplasms 1,320 4.4 13.7 (13.0-14.5) 10.8 (10.1-11.4)
8 Stomach 1,083 3.6 11.3 (10.6-11.9) 6.9 (6.4-7.3)
9 Thyroid 1,077 3.6 11.2 (10.5-11.9) 8.4 (7.8-8.9)
10 Cervix uteri 958 3.2 10.0 (9.3-10.6) 6.9 (6.4-7.3)
Others 5,734 19.0
All 30,179 100.0 314.0 (310.4-317.5) 213.4 (210.9-215.9)

14
Figure 2: Ten Most Frequent Cancers in Singapore Females (%), 2009 – 2013
5.4 Highest Ranking Cancers in Different Ethnic Groups, 2009-2013
During the period 2009-2013, colorectal, lung and prostate cancer were the three
most common male cancers among the Chinese and Indian residents. Among
the Malay male residents, lung and colorectal cancer were the two most common
cancers, followed by lymphoid neoplasm and prostate cancer (Tables 6, 7 and 8).
Breast cancer was the most common female cancer in each ethnic group.
Colorectal cancer was the second most common cancer among the Chinese and
Malay females and it was ranked as the third common cancer among Indian
females. Cancer of Corpus uteri was the second common cancer in Indian
females. Lung cancer and lymphoid neoplasms were the third most common
cancers among Chinese and Malay females respectively.
Due to the small numbers of Indian residents, the confidence intervals of the
incidence rates were wider.

15
Table 6: Highest Ranking Cancers among Chinese Residents, 2009-2013
Male Site Number % CR (95% CI) ASR (95% CI)
1 Colo-rectum 4,315 18.0 62.7 (60.8-64.5) 41.9 (40.7-43.2)
2 Lung 3,634 15.2 52.8 (51.1-54.5) 35.3 (34.1-36.4)
3 Prostate 2,974 12.4 43.2 (41.6-44.7) 29.4 (28.4-30.5)
4 Liver 1,821 7.6 26.4 (25.2-27.7) 17.6 (16.8-18.5)
5 Lymphoid neoplasms 1,365 5.7 19.8 (18.8-20.9) 15.4 (14.5-16.3)
6 Stomach 1,263 5.3 18.3 (17.3-19.4) 12.3 (11.6-13.0)
7 Skin, including melanoma 1,260 5.3 18.3 (17.3-19.3) 12.4 (11.7-13.1)
8 Nasopharynx 1,015 4.2 14.7 (13.8-15.6) 9.9 (9.2-10.5)
9 Kidney & Other Urinary 881 3.7 12.8 (11.9-13.6) 8.6 (8.0-9.2)
10 Pancreas 683 2.8 9.9 (9.2-10.7) 6.6 (6.1-7.1)
Others 4,736 19.8
All 23,947 100.0 347.7 (343.3-352.1) 239.4 (236.2-242.5)
Female Site Number % CR (95% CI) ASR (95% CI)
1 Breast 7,100 28.5 99.0 (96.7-101.3) 64.3 (62.8-65.8)
2 Colo-rectum 3,485 14.0 48.6 (47.0-50.2) 27.8 (26.9-28.8)
3 Lung 2,012 8.1 28.1 (26.8-29.3) 16.0 (15.2-16.7)
4 Corpus uteri 1,508 6.1 21.0 (20.0-22.1) 13.6 (12.9-14.3)
5 Ovary, etc. 1,274 5.1 17.8 (16.8-18.7) 12.3 (11.6-13.0)
6 Skin, including melanoma 1,164 4.7 16.2 (15.3-17.2) 8.8 (8.3-9.4)
7 Lymphoid neoplasms 975 3.9 13.6 (12.7-14.4) 9.9 (9.2-10.7)
8 Stomach 973 3.9 13.6 (12.7-14.4) 7.4 (6.9-7.9)
9 Thyroid 852 3.4 11.9 (11.1-12.7) 8.6 (8.0-9.2)
10 Cervix uteri 782 3.1 10.9 (10.1-11.7) 7.0 (6.5-7.6)
Others 4,765 19.2
All 24,890 100.0 347.1 (342.8-351.4) 218.2 (215.4-221.1)
Table 7: Highest Ranking Cancers among Malay Residents, 2009-2013
Male Site Number % CR (95% CI) ASR (95% CI)
1 Lung 444 18.1 35.2 (31.9-38.5) 34.3 (30.9-37.6)
2 Colo-rectum 354 14.4 28.1 (25.2-31.0) 27.0 (24.1-30.0)
3 Lymphoid neoplasms 316 12.9 25.1 (22.3-27.8) 24.6 (21.8-27.4)
4 Prostate 229 9.3 18.2 (15.8-20.5) 19.4 (16.8-21.9)
5 Liver 179 7.3 14.2 (12.1-16.3) 13.6 (11.5-15.7)
6 Myeloid neoplasms 109 4.4 8.6 (7.0-10.3) 8.2 (6.6-9.8)
7 Bladder 85 3.5 6.7 (5.3-8.2) 6.6 (5.2-8.1)
8 Nasopharynx 83 3.4 6.6 (5.2-8.0) 5.5 (4.3-6.8)
9 Kidney & Oth.Urinary 80 3.3 6.3 (5.0-7.7) 6.0 (4.6-7.4)
10 Pancreas 64 2.6 5.1 (3.8-6.3) 5.0 (3.7-6.2)
Others 511 20.8
All 2,454 100.0 194.7 (187.0-202.4) 188.9 (181.2-196.6)

16
Female Site Number % CR (95% CI) ASR (95% CI)
1 Breast 936 30.8 73.6 (68.9-78.3) 58.7 (54.8-62.5)
2 Colo-rectum 339 11.2 26.7 (23.8-29.5) 22.4 (19.9-24.9)
3 Lymphoid neoplasms 234 7.7 18.4 (16.0-20.8) 16.5 (14.3-18.7)
4 Ovary, etc. 233 7.7 18.3 (16.0-20.7) 14.9 (12.9-16.8)
5 Corpus uteri 226 7.4 17.8 (15.5-20.1) 14.3 (12.4-16.2)
6 Lung 176 5.8 13.8 (11.8-15.9) 11.0 (9.3-12.7)
7 Thyroid 121 4.0 9.5 (7.8-11.2) 8.1 (6.6-9.6)
8 Cervix uteri 110 3.6 8.6 (7.0-10.3) 7.2 (5.8-8.6)
9 Myeloid neoplasms 85 2.8 6.7 (5.3-8.1) 5.9 (4.6-7.2)
10 Liver 65 2.1 5.1 (3.9-6.4) 4.5 (3.4-5.6)
Others 513 16.9
All 3,038 100.0 238.9 (230.4-247.4) 199.4 (192.0-206.7)
Table 8: Highest Ranking Cancers among Indian Residents, 2009-2013
Male Site Number % CR (95% CI) ASR (95% CI)
1 Colo-rectum 180 14.2 20.0 (17.1-22.9) 19.5 (16.5-22.5)
2 Prostate 151 11.9 16.8 (14.1-19.4) 18.9 (15.8-22.1)
3 Lung 150 11.9 16.7 (14.0-19.3) 17.1 (14.3-20.0)
4 Lymphoid neoplasms 147 11.6 16.3 (13.7-19.0) 16.3 (13.5-19.1)
5 Liver 76 6.0 8.4 (6.5-10.3) 8.7 (6.6-10.7)
6 Stomach 66 5.2 7.3 (5.6-9.1) 6.9 (5.1-8.7)
7 Kidney & Oth.Urinary 53 4.2 5.9 (4.3-7.5) 5.7 (4.1-7.3)
8 Myeloid neoplasms 48 3.8 5.3 (3.8-6.8) 4.9 (3.4-6.3)
9 Bladder 39 3.1 4.3 (3.0-5.7) 4.4 (3.0-5.9)
10 Pancreas 35 2.8 3.9 (2.6-5.2) 3.7 (2.4-5.0)
Others 320 25.3
All 1,265 100.0 140.5 (132.7-148.2) 139.9 (131.8-148.1)
Female Site Number % CR (95% CI) ASR (95% CI)
1 Female Breast 589 37.9 69.9 (64.3-75.6) 61.4 (56.3-66.5)
2 Corpus uteri 137 8.8 16.3 (13.5-19.0) 15.1 (12.5-17.7)
3 Colo-rectum 108 6.9 12.8 (10.4-15.2) 12.1 (9.7-14.4)
4 Ovary, etc. 101 6.5 12.0 (9.7-14.3) 11.1 (8.9-13.4)
5 Lymphoid neoplasms 81 5.2 9.6 (7.5-11.7) 9.8 (7.6-12.0)
6 Thyroid 63 4.1 7.5 (5.6-9.3) 6.2 (4.6-7.8)
7 Lung 55 3.5 6.5 (4.8-8.3) 6.4 (4.7-8.2)
8 Myeloid neoplasms 37 2.4 4.4 (3.0-5.8) 4.1 (2.7-5.5)
9 Stomach 36 2.3 4.3 (2.9-5.7) 4.1 (2.7-5.5)
10 Pancreas 35 2.3 4.2 (2.8-5.5) 4.1 (2.7-5.5)
Others 313 20.1
All 1,555 100.0 184.6 (175.4-193.8) 170.5 (161.8-179.2)

17
5.5 Mortality Rates by Gender, 2009-2013
Although colorectal cancer and breast cancer were the most common cancers
respectively in the male and female resident population, lung cancer and breast
cancer had the highest mortality rates in males and females respectively, based
on the mortality data from the Registry of Births and Deaths (RBD), Ministry of
Home Affairs (MHA) (Tables 9 and 10).
Table 9: Ten Most Frequent Cancer Deaths in Males, 2009-2013
(Source: RBD, MHA)
Rank Site Number % CR (95% CI) ASR (95% CI)
1 Lung 3,724 27.2 39.8 (38.6-41.1) 29.4 (28.5-30.4)
2 Colo-rectum 1,949 14.2 20.9 (19.9-21.8) 15.5 (14.8-16.2)
3 Liver 1,709 12.5 18.3 (17.4-19.2) 13.4 (12.8-14.0)
4 Stomach 913 6.7 9.8 (9.1-10.4) 7.1 (6.6-7.6)
5 Prostate 700 5.1 7.5 (6.9-8.0) 5.6 (5.2-6.0)
6 Pancreas 700 5.1 7.5 (6.9-8.0) 5.5 (5.1-5.9)
7 Nasopharynx 556 4.1 5.9 (5.5-6.4) 4.2 (3.9-4.6)
8 Lymphomas 415 3.0 4.4 (4.0-4.9) 3.3 (3.0-3.6)
9 Kidney & Oth.Urinary 386 2.8 4.1 (3.7-4.5) 2.9 (2.6-3.2)
10 Oesophagus 370 2.7 4.0 (3.6-4.4) 2.9 (2.6-3.2)
All 13,692 100.0 146.5 (144.1-149.0) 108.4 (106.5-110.2)
Table 10: Ten Most Frequent Cancer Deaths in Females, 2009-2013
(Source: RBD, MHA)
Rank Site Number % CR (95% CI) ASR (95% CI)
1 Breast 2,052 18.1 21.3 (20.4-22.3) 14.2 (13.6-14.8)
2 Lung 1,904 16.8 19.8 (18.9-20.7) 12.0 (11.4-12.6)
3 Colo-rectum 1,715 15.1 17.8 (17.0-18.7) 10.5 (9.9-11.0)
4 Liver 713 6.3 7.4 (6.9-8.0) 4.3 (4.0-4.7)
5 Stomach 690 6.1 7.2 (6.6-7.7) 4.2 (3.9-4.5)
6 Pancreas 663 5.8 6.9 (6.4-7.4) 4.2 (3.9-4.5)
7 Ovary, etc. 583 5.1 6.1 (5.6-6.6) 4.0 (3.6-4.3)
8 Cervix uteri 350 3.1 3.6 (3.3-4.0) 2.3 (2.1-2.6)
9 Leukaemias 280 2.5 2.9 (2.6-3.3) 2.0 (1.8-2.3)
10 Lymphomas 257 2.3 2.7 (2.3-3.0) 1.7 (1.5-1.9)
All 11,368 100.0 118.3 (116.1-120.4) 73.5 (72.1-74.9)

18
6. Commentary on Selected Cancer Sites
6.1 Breast Cancer
Incidence The age-standardised incidence rate of newly diagnosed breast cancers in
females had increased significantly over the years. It had increased almost three-
fold from 22.6 per 100,000 in 1974-1978 to 63.4 per 100,000 in 2009-2013
(Figure 1). The age-standardised incidence rate of non-invasive (in situ) breast
cancer was 11.6 per 100,000 in 2004-08 and 10.9 per 100,000 in 2009-13
respectively.
Figure 1: Age-Standardised Incidence Rates for Breast Cancer, 1974-2013
Table 1: Crude and Age-Standardised Incidence Rates for Breast Cancer by Ethnic Group, 2009-2013
Ethnic Group No. CIR (95% CI) ASIR (95% CI)
Chinese 7100 99.0 (96.7-101.3) 64.3 (62.8-65.8)
Malay 936 73.6 (68.9-78.3) 58.7 (54.8-62.5)
Indian 589 69.9 (64.3-75.6) 61.4 (56.3-66.5)
Others 235 72.0 (62.8-81.2) 73.3 (62.3-84.2)
All 8860 92.2 (90.3-94.1) 63.4 (62.1-64.7)

19
Age at Diagnosis
In the period of 2009-2013, the age-specific incidence rate increased sharply
from age 30 onwards, and peaked in the 60-69 age group. The rate then
gradually declined in the 70 and above age groups (Figure 2).
Figure 2: Age-Specific Incidence Rates for Breast Cancer, 2009-2013

20
Mortality Rates
The age-standardised mortality rates have remained relatively stable since 1989-1993.
Figure 3: Age-Standardised Mortality Rates for Breast Cancer, 1974-2013
Table 2: Ethnic distribution of breast cancer patients, 2004-2013
Period 2004-2008 2009-2013
Ethnicity No. of cases Percent No. of cases Percent
Chinese 5,892 81.9 7,100 80.1
Malay 784 10.9 936 10.6
Indian 392 5.4 589 6.6
Others 126 1.8 235 2.7
Total 7,194 100.0 8,860 100.0
Table 3: Age distribution of breast cancer patients, 2004-2013
Period 2004-2008 2009-2013
Age Group No. of cases Percent No. of cases Percent
0-14 1 0.01 1 0.01
15-44 1,601 22.3 1,638 18.5
45-54 2,468 34.3 2,679 30.2
55-64 1,675 23.3 2,512 28.4
65-74 876 12.2 1,235 13.9
75+ 573 7.9 795 9.0
Total 7,194 100.0 8,860 100.0

21
Table 4: 5-year Age-Standardised Observed Survival of Breast Cancer by Ethnicity and Age Group 2004-2013
There was a significant increase in the survival of all breast cancer patients and
among all ethnicities.
There was a significant increase in the survival of breast cancer patients aged
55-64 and aged 75+.
2004-2008
2009-2013
Ethnicity 5yr ASOS 95% CI 5yr ASOS 95% CI
All 67.23 66.13,68.30 70.25 69.30, 71.17
Chinese 68.97 67.78,70.13 72.14 71.11, 73.14
Malay 50.11 46.52,53.58 54.76 51.62, 57.78
Indian 66.11 56.70,73.79 67.15 62.90, 71.03
Age Group 5yr OS 95% CI 5yr OS 95% CI
15-44 86.47 84.65,88.08 89.20 87.59, 90.62
45-54 85.14 83.61,86.55 85.62 84.22, 86.90
55-64 78.78 76.54,80.84 80.91 79.12, 82.57
65-74 73.01 69.69,76.03 74.21 71.39, 76.79
75+ 46.34 41.64,50.90 53.47 49.50, 57.27

22
6.2 Cervical Cancer
Incidence A total of 958 new cases of cervical cancer were diagnosed from 2009-2013. The
incidence for cancer of the cervix has significantly declined since 1994-1998. The
age-standardised incidence rates (ASR) dropped from 16.8 per 100,000 in 1974-
1978 to 6.9 per 100,000 in 2009-2013 (Figure 4). Indian women had lower risk of
developing cervical cancer compared to Chinese and Malay women (Table 5).
Figure 4: Age-Standardised Incidence Rates for Cervical Cancer, 1974-2013
Table 5: Crude and Age-Standardised Incidence Rates for Cervical Cancer by Ethnic Group, 2009-2013
Ethnic Group No. CIR (95% CI) ASIR(95% CI)
Chinese 782 10.9 (10.1-11.7) 7.0 (6.5-7.6)
Malay 110 8.6 (7.0-10.3) 7.2 (5.8-8.6)
Indian 33 3.9 (2.6-5.3) 3.7 (2.4-5.0)
Others 33 10.1 (6.7-13.6) 8.5 (5.2-11.7)
All 958 10.0 (9.3-10.6) 6.9 (6.4-7.3)

23
Age at Diagnosis The age-specific incidence rate was lowest in the age group of 0-19, at 0.1 per
100,000 compared to 27.9 per 100,000 in women aged 70-79 (Figure 5).
Figure 5: Age-Specific Incidence Rate for Cervical Cancer, 2009-2013
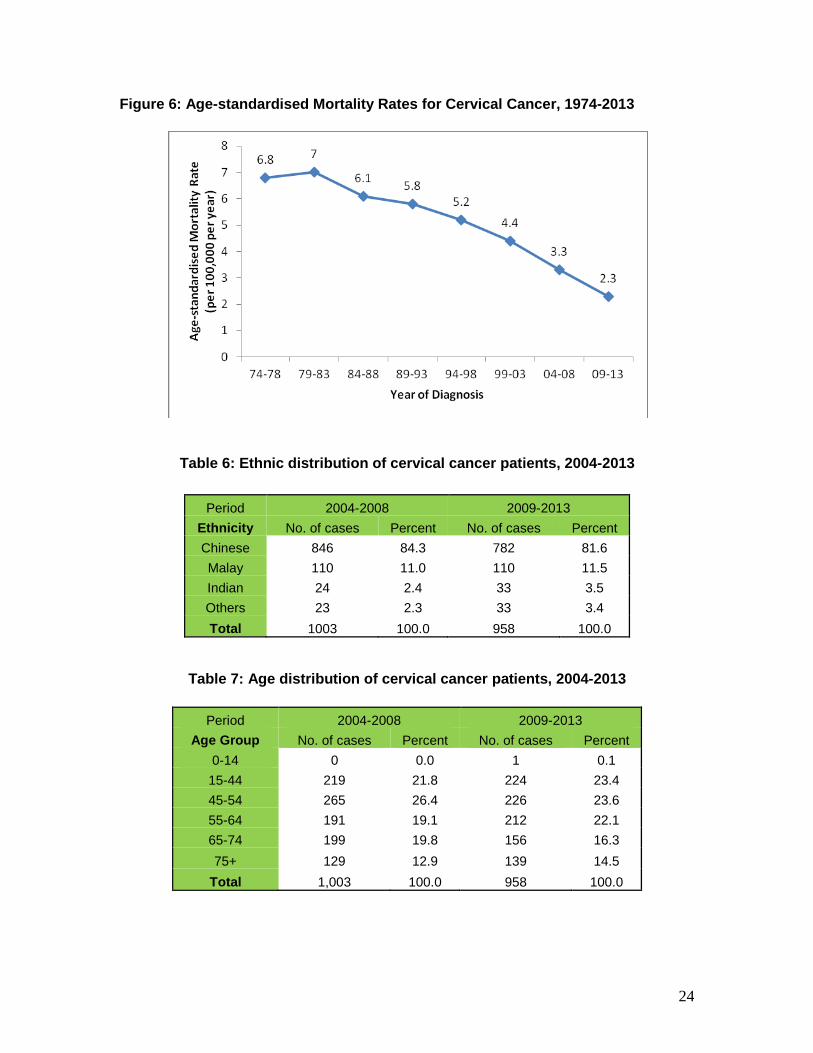
Mortality Rates Cervical cancer has the 8th highest cancer mortality rate in Singapore. The age-
standardised mortality rate for cervical cancer was 6.8 per 100,000 per year for
the period 1974-1978, and this decreased progressively to 2.3 per 100,000 for
the period 2009-2013 (Figure 6). There were 350 deaths from cervical cancer in
the period 2009-2013.
24
Figure 6: Age-standardised Mortality Rates for Cervical Cancer, 1974-2013
Table 6: Ethnic distribution of cervical cancer patients, 2004-2013
Period 2004-2008 2009-2013
Ethnicity No. of cases Percent No. of cases Percent
Chinese 846 84.3 782 81.6
Malay 110 11.0 110 11.5
Indian 24 2.4 33 3.5
Others 23 2.3 33 3.4
Total 1003 100.0 958 100.0
Table 7: Age distribution of cervical cancer patients, 2004-2013
Period 2004-2008 2009-2013
Age Group No. of cases Percent No. of cases Percent
0-14 0 0.0 1 0.1
15-44 219 21.8 224 23.4
45-54 265 26.4 226 23.6
55-64 191 19.1 212 22.1
65-74 199 19.8 156 16.3
75+ 129 12.9 139 14.5
Total 1,003 100.0 958 100.0

25
Table 8: 5-year Age-Standardised Observed Survival of Cervical Cancer by Ethnicity and Age Group, 2004-2013
There was a significant decrease in the survival of cervical cancer patients
among all ethnicities from 2004-2008 to 2009-2013.
2004-2008
2009-2013
Ethnicity 5yr ASOS 95% CI 5yr ASOS 95% CI
All 58.03 55.14, 60.80 54.43 51.46, 57.29
Chinese 59.78 56.68, 62.73 56.31 53.08,59.41
Malay 42.93 33.73,51.79 41.08 31.90, 50.03
Indian 49.65 29.44,66.97 37.87 21.21, 54.44
Age Group 5yr OS 95% CI 5yr OS 95% CI
15-44 81.25 75.58,85.73 80.14 74.09, 84.92
45-54 70.56 64.88,75.49 71.36 65.01, 76.77
55-64 62.56 55.40,68.90 65.35 58.10, 71.65
65-74 57.18 49.66,64.00 52.60 44.79, 59.82
75+ 31.31 22.60,40.39 27.86 20.80, 35.35

26
6.3 Colorectal Cancer
Incidence
A total of 8,929 new cases of colorectal cancer were diagnosed from 2009-2013.
The age-standardised incidence rates for colorectal cancer for both males and
females have climbed consistently since 1974. However, the rates appeared to
have plateaued since 2004-2008 (Figure 7).
Amongst the 3 ethnic groups, the age-standardised incidence rate was highest
among the Chinese (Table 9).
Figure 7: Age-standardised Incidence Rate for Colorectal Cancer by Gender, 1974-2013

27
Table 9: Crude and Age-standardised Incidence Rates for Colorectal Cancer by Ethnic Group, 2009-2013
Ethnic Group No. CIR (95% CI) ASIR (95% CI)
Chinese 7800 55.5 (54.3-56.7) 34.3 (33.5-35.1)
Malay 693 27.4 (25.3-29.4) 24.6 (22.7-26.5)
Indian 288 16.5 (14.6-18.4) 15.7 (13.8-17.5)
Others 148 23.7 (19.9-27.6) 30.9 (25.5-36.4)
All 8929 47.1 (46.1-48.1) 32.1 (31.4-32.8)
Age at Diagnosis The age-specific incidence rate was lowest in the age group of 0-19, at 0.2 per
100,000 compared to 419.1 per 100,000 in the age group of 80 and above
(Figure 8).
Figure 8: Age-Specific Incidence Rate for Colorectal Cancer, 2009-2013

28
Mortality Rates
Colorectal cancer has the 2nd highest cancer mortality rate among males and 3rd
highest cancer mortality rate among females in Singapore. The age-standardised
mortality rate for colorectal cancer appeared to have declined for both males and
females. This is mainly due to advances in treatment such as adjuvant therapy
combining chemo and radiotherapy, and total mesorectal excision (Figure 9).
There were 3,664 deaths from colorectal cancer for the period 2009-2013.
Figure 9: Age-standardised Mortality Rates for Colorectal Cancer, 1974-2013
Table 10: Ethnic distribution of colorectal cancer patients, 2004-2013
Period 2004-2008 2009-2013
Ethnicity (Males) No. of cases Percent No. of cases Percent
Chinese 3,616 87.9 4,315 87.5
Malay 299 7.3 354 7.2
Indian 149 3.6 180 3.6
Others 50 1.2 85 1.7
Total 4,114 100.0 4,934 100.0

29
Period 2004-2008 2009-2013
Ethnicity (Females) No. of cases Percent No. of cases Percent
Chinese 3,238 90.1 3,485 87.2
Malay 232 6.5 339 8.5
Indian 88 2.4 108 2.7
Others 36 1.0 63 1.6
Total 3,594 100.0 3,995 100.0
Table 11: Age distribution of colorectal cancer patients, 2004-2013
Males 2004-2008 2009-2013
Age Group No. of cases Percent No. of cases Percent
0-14 0 0.0 1 0.02
15-44 231 5.6 228 4.6
45-54 638 15.5 708 14.3
55-64 1,037 25.2 1,405 28.5
65-74 1,191 29.0 1,380 28.0
75+ 1,017 24.7 1,212 24.6
Total 4,114 100.0 4,934 100.0
Females 2004-2008 2009-2013
Age Group No. of cases Percent No. of cases Percent
0-14 0 0.0 1 0.03
15-44 185 5.2 217 5.4
45-54 522 14.5 532 13.3
55-64 764 21.3 949 23.8
65-74 898 25.0 914 22.9
75+ 1,225 34.1 1,382 34.6
Total 3,594 100.0 3,995 100.0

30
Table 12: 5-year Age-Standardised Observed Survival of Colorectal Cancer by Ethnicity and Age Group 2004-2013 Females 2004-2008 2009-2013
There was a significant increase in the survival of both male and female
colorectal cancer patients.
There was a significant increase in the survival of Chinese male and female
colorectal cancer patients.
There was a significant increase in the survival of colorectal cancer patients
among both males and females aged 55-74.
2004-2013
Males 2004-2008
2009-2013
Ethnicity 5yr ASOS 95% CI 5yr ASOS 95% CI
All 44.97 43.38,46.54 50.32 48.86, 51.75
Chinese 45.11 43.42,46.78 50.45 48.90,51.98
Malay 38.81 32.76,44.82 43.83 38.29,49.23
Indian 51.54 42.70,59.68 56.19 48.67,63.03
Age Group 5yr OS 95% CI 5yr OS 95% CI
15-44 61.80 55.02,67.86 66.04 59.20, 72.01
45-54 59.72 55.58,63.61 65.21 61.53, 68.63
55-64 56.50 53.18,59.68 62.13 59.33, 64.79
65-74 46.39 43.38, 49.34 52.78 49.96, 55.53
75+ 30.90 27.86, 33.98 35.49 32.59, 38.40
Ethnicity 5yr ASOS 95% CI 5yr ASOS 95% CI
All 49.87 48.12,51.59 53.50 51.91, 55.07
Chinese 50.58 48.73,52.39 54.32 52.61,55.99
Malay 36.80 30.53,43.07 40.35 34.77,45.86
Indian 48.18 37.31,58.22 51.91 42.22,60.73
Age Group 5yr OS 95% CI 5yr OS 95% CI
15-44 60.24 52.84,66.85 69.28 62.48,75.09
45-54 62.83 58.36,66.96 65.79 61.45,69.77
55-64 60.48 56.54,64.18 64.69 61.39,67.78
65-74 54.04 50.59,57.36 60.20 56.88,63.34
75+ 35.15 32.18,38.13 37.15 34.52,39.78

31
6.4 Ovarian Cancer
Incidence
A total of 1,640 new cases of ovarian cancer were diagnosed from 2009-2013.
The age-standardised incidence rate for ovarian cancer had climbed consistently
over the last forty years from 6.7 per 100,000 in 1974-1978 to 12.4 per 100,000
in 2009-2013 (Figure 10).
Amongst the ethnic groups, the age-standardised incidence rate was the highest
among the Chinese and Malays (Table 13).
Figure 10: Age-standardised Incidence Rate for Ovarian Cancer, 1974-2013
Table 13: Crude and Age-Standardised Incidence Rates for Ovarian Cancer by Ethnic Group, 2009-2013
Ethnic Group No. CIR (95% CI) ASIR (95% CI)
Chinese 1274 17.8 (16.8-18.7) 12.3 (11.6-13.0)
Malay 233 18.3 (16.0-20.7) 14.9 (12.9-16.8)
Indian 101 12.0 (9.7-14.3) 11.1 (8.9-13.4)
Others 32 9.8 (6.4-13.2) 8.4 (5.0-11.8)
All 1640 17.1 (16.2-17.9) 12.4 (11.8-13.0)
32
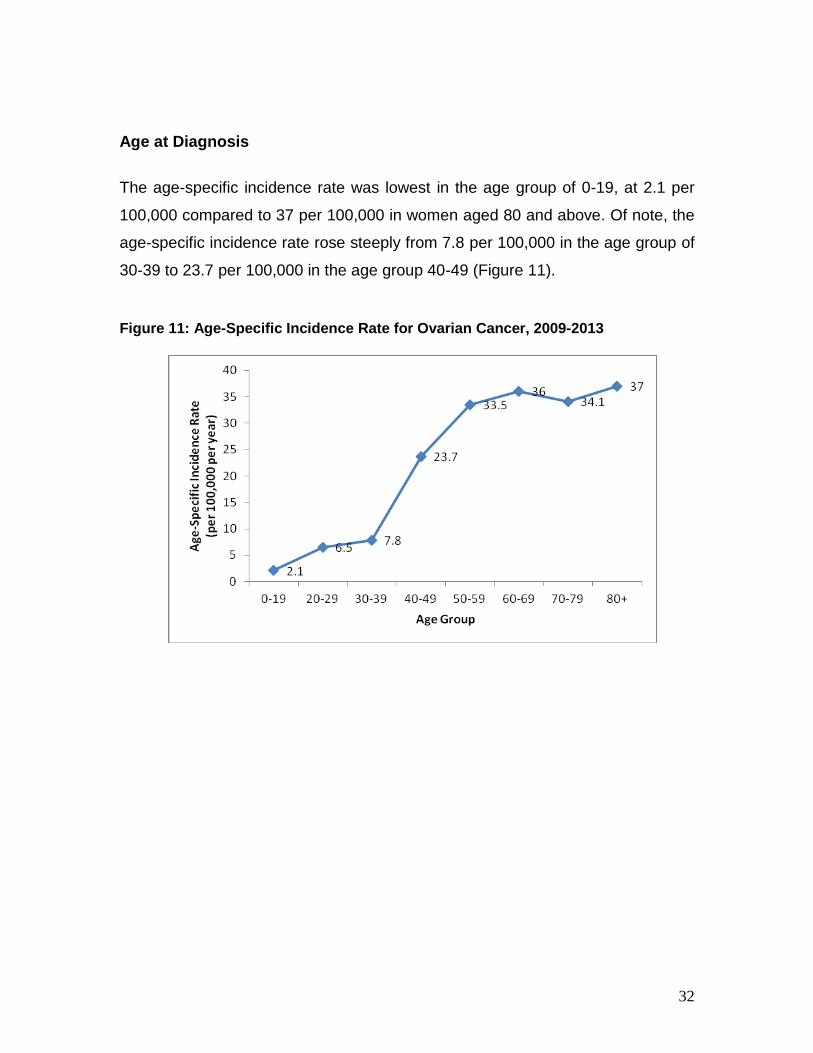
Age at Diagnosis
The age-specific incidence rate was lowest in the age group of 0-19, at 2.1 per
100,000 compared to 37 per 100,000 in women aged 80 and above. Of note, the
age-specific incidence rate rose steeply from 7.8 per 100,000 in the age group of
30-39 to 23.7 per 100,000 in the age group 40-49 (Figure 11).
Figure 11: Age-Specific Incidence Rate for Ovarian Cancer, 2009-2013

33
Mortality Rates Ovarian cancer has the 7th highest cancer mortality in females in Singapore. The
age-standardised mortality rate for ovarian cancer had remained fairly stable
from 1994-1998 to 2009-2013 (Figure 12). There were 583 deaths from ovarian
cancer for the period 2009-2013.
Figure 12: Age-standardised Mortality Rates for Ovarian Cancer, 1974-2013
Table 14: Ethnic distribution of ovarian cancer patients, 2004-2013
Period 2004-2008 2009-2013
Ethnicity No. of cases Percent No. of cases Percent
Chinese 1140 80.6 1274 77.7
Malay 171 12.1 233 14.2
Indian 80 5.6 101 6.2
Others 24 1.7 32 1.9
Total 1415 100.0 1640 100.0

34
Table 15: Age distribution of ovarian cancer patients, 2004-2013
Table 16: 5-year Age-Standardised Observed Survival of Ovarian Cancer by Ethnicity and Age Group, 2004-2013
The survival for ovarian cancer seems to have remained stable.
Period 2004-2008 2009-2013
Age Group No. of cases Percent No. of cases Percent
0-14 11 0.8 17 1.0
15-44 395 27.9 397 24.2
45-54 414 29.3 458 27.9
55-64 295 20.9 410 25.0
65-74 170 12.0 207 12.6
75+ 130 9.2 151 9.2
Total 1,415 100.0 1,640 100.0
2004-2008
2009-2013
Ethnicity 5yr ASOS 95% CI 5yr ASOS 95% CI
All 43.74 41.33, 46.12 45.81 43.63, 47.97
Chinese 44.86 42.16, 47.53 48.34 45.84, 50.79
Malay 31.85 25.84, 38.00 30.10 25.01, 35.34
Indian 49.71 39.28, 59.28 35.91 28.13, 43.74
Age Group 5yr OS 95% CI 5yr OS 95% CI
15-44 81.25 75.58, 85.73 80.14 74.09, 84.92
45-54 70.56 64.88, 75.49 71.36 65.01, 76.77
55-64 62.56 55.40, 68.90 65.35 58.10, 71.65
65-74 57.18 49.66, 64.00 52.60 44.79, 59.82
75+ 31.31 22.60, 40.39 27.86 20.80, 35.35
35
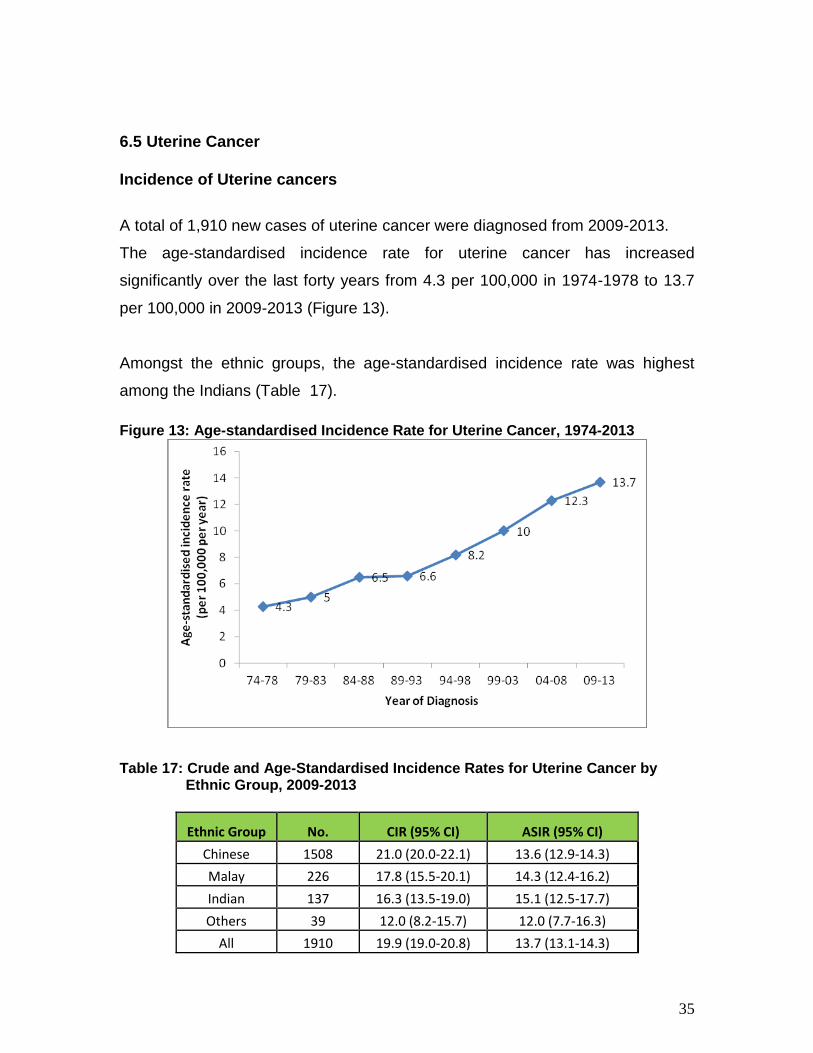
6.5 Uterine Cancer
Incidence of Uterine cancers
A total of 1,910 new cases of uterine cancer were diagnosed from 2009-2013.
The age-standardised incidence rate for uterine cancer has increased
significantly over the last forty years from 4.3 per 100,000 in 1974-1978 to 13.7
per 100,000 in 2009-2013 (Figure 13).
Amongst the ethnic groups, the age-standardised incidence rate was highest
among the Indians (Table 17).
Figure 13: Age-standardised Incidence Rate for Uterine Cancer, 1974-2013
Table 17: Crude and Age-Standardised Incidence Rates for Uterine Cancer by Ethnic Group, 2009-2013
Ethnic Group No. CIR (95% CI) ASIR (95% CI)
Chinese 1508 21.0 (20.0-22.1) 13.6 (12.9-14.3)
Malay 226 17.8 (15.5-20.1) 14.3 (12.4-16.2)
Indian 137 16.3 (13.5-19.0) 15.1 (12.5-17.7)
Others 39 12.0 (8.2-15.7) 12.0 (7.7-16.3)
All 1910 19.9 (19.0-20.8) 13.7 (13.1-14.3)

36
Age at Diagnosis The age-specific incidence rate was the lowest in the age group of 0-19, at 0.1
per 100,000 and the highest in aged 50-69 women at 52 per 100,000 (Figure 14).
Figure 14: Age-Specific Incidence Rate for Uterine Cancer, 2009-2013

37
Mortality Rates Uterine cancer has the 11th highest cancer mortality in females in Singapore.
There were 215 deaths from uterine cancer for the period 2009-2013.
Figure 15: Age-standardised Mortality Rates for Uterine Cancer, 1974-2013
Table 18: Ethnic distribution of uterine cancer patients, 2004-2013
Period 2004-2008 2009-2013
Ethnicity No. of cases Percent No. of cases Percent
Chinese 1,195 82.3 1,508 79
Malay 147 10.1 226 11.8
Indian 96 6.6 137 7.2
Others 15 1.0 39 2
Total 1,453 100.0 1,910 100.0

38
Table 19: Age distribution of uterine cancer patients, 2004-2013
Period 2004-2008 2009-2013
Age Group No. of cases Percent No. of cases Percent
0-14 0 0 0 0
15-44 232 16.0 296 15.5
45-54 494 34.0 585 30.6
55-64 392 27.0 641 33.6
65-74 231 15.9 266 13.9
75+ 104 7.1 122 6.4
Total 1,453 100.0 1,910 100.0
Table 20: 5-year Age-Standardised Observed Survival of Uterine Cancer by Ethnicity and Age Group, 2004-2013
2004-2008
2009-2013
Ethnicity 5yr ASOS 95% CI 5yr ASOS 95% CI
All 61.93 59.34, 64.41 65.08 62.92, 67.14
Chinese 64.51 61.68, 67.20 67.39 65.01, 69.65
Malay 55.39 47.23, 62.80 47.37 40.52, 53.90
Indian 46.24 34.53, 57.16 75.71 67.68, 82.01
Age Group 5yr OS 95% CI 5yr OS 95% CI
15-44 94.33 90.23, 96.74 92.00 87.85, 94.78
45-54 87.60 84.11, 90.38 87.53 84.37, 90.10
55-64 78.97 74.02, 83.10 79.35 75.62, 82.57
65-74 65.02 57.46, 71.58 66.14 59.76, 71.75
75+ 37.94 27.51, 48.30 46.80 37.12, 55.89
There was a significant increase in survival for rall, Chinese and Indian uterine
cancer patients.

39
6.6 Prostate Cancer
Incidence
A total of 3,456 new cases of prostate cancer were diagnosed from 2009-2013.
The age-standardised incidence rate for prostate cancer has increased
significantly over the last forty years from 5.7 per 100,000 in 1974-1978 to 28.1
per 100,000 in 2009-2013 (Figure 16).
The rapid rise in prostate cancer incidence in the 90s can be partly attributed to
the advent of the PSA test. The rates of prostate cancer overdiagnosis due to
PSA testing for cases diagnosed in the US between 1988 and 1998 were
estimated by a simulation model2.
Overdiagnosis in the study was defined as the detection of prostate cancer
through PSA testing that otherwise would not have been diagnosed within the
patient’s lifetime. Overdiagnosis rates were found to be approximately 29% for
white men and 44% for black men.
Amongst the ethnic groups, the age-standardised incidence rate was highest
among the Chinese (Table 21).
2 Etzioni R, Penson DF, Legler JM et al. (2002) Overdiagnosis due to prostate-specific antigen screening:
Lessons from US Prostate Cancer Incidence Trends. JNCI 94(13): 981-990.

40
Figure 16: Age-standardised Incidence Rate for Prostate Cancer, 1974-2013
Table 21: Crude and Age-Standardised Incidence Rates for Prostate Cancer by Ethnic Group, 2009-2013
Ethnic Group No. CIR (95% CI) ASIR (95% CI)
Chinese 2974 43.2 (41.6-44.7) 29.4 (28.4-30.5)
Malay 229 18.2 (15.8-20.5) 19.4 (16.8-21.9)
Indian 151 16.8 (14.1-19.4) 18.9 (15.8-22.1)
Others 102 34.3 (27.7-41.0) 48.4 (38.6-58.2)
All 3456 37.0 (35.7-38.2) 28.1 (27.1-29.0)
Age at Diagnosis The age-specific incidence rate was the lowest in the age group under 49, at 3.2
per 100,000 which rose steeply to 341.3 per 100,000 in the age group 70 and
above (Figure 17).

41
Figure 17: Age-Specific Incidence Rate for Prostate Cancer, 2009-2013
Mortality Rates Prostate cancer has the 5th highest cancer mortality in Singapore. Overall, there
was an increase in the age-standardised mortality rate for prostate cancer. This
is probably due to the increased incidence of prostate cancer (Figure 18). There
were 700 deaths from prostate cancer for the period 2009-2013.
Figure 18: Age-standardised Mortality Rates for Prostate Cancer, 1974-2013

42
Table 22: Ethnic distribution of prostate cancer patients, 2004-2013
Period 2004-2008 2009-2013
Ethnicity No. of cases Percent No. of cases Percent
Chinese 2,115 84.7 2,974 86.1
Malay 188 7.5 229 6.6
Indian 133 5.3 151 4.4
Others 62 2.5 102 2.9
Total 2,498 100.0 3,456 100.0
Table 23: Age distribution of prostate cancer patients, 2004-2013
Period 2004-2008 2009-2013
Age Group No. of cases Percent No. of cases Percent
0-14 0 0.0 0 0.0
15-54 106 4.2 162 4.7
55-64 629 25.2 880 25.5
65-74 1,011 40.5 1,400 40.5
75+ 752 30.1 1,014 29.3
Total 2,498 100.0 3,456 100.0
Table 24: 5-year Age-Standardised Observed Survival of Prostate Cancer by Ethnicity and Age Group, 2004-2013
Males 2004-2008
2009-2013 Ethnicity 5yr ASOS 95% CI 5yr ASOS 95% CI
All 70.77 68.59, 72.83 74.86 73.25, 76.38
Chinese 71.83 69.45, 74.07 76.43 74.73, 78.04
Malay 55.03 47.05, 62.30 59.01 51.88, 65.44
Indian 70.95 60.83, 78.90 63.32 54.95, 70.55
Age Group 5yr OS 95% CI 5yr OS 95% CI
15-54 85.41 75.53, 91.52 91.00 84.67, 94.80
55-64 84.61 80.69, 87.80 86.97 84.35, 89.19
65-74 75.37 72.04, 78.37 79.80 77.39, 81.98
75+ 47.60 43.40, 51.68 53.07 49.68, 56.33
There was a significant increase in survival for all and for Chinese prostate cancer patients. There was a significant increase in survival for prostate cancer patients aged 65 and above.

43
6.7 Lung Cancer
Incidence A total of 6,558 new cases of lung cancer were diagnosed from 2009-2013.
Overall, the age-standardised incidence rate for male lung cancer has decreased
significantly since 1988 while that for female lung cancer has declined
consistently since 1998 (Fig. 19).
Amongst the ethnic groups, the age-standardised incidence rate was highest
among the Chinese (Table 25).
Figure 19: Age-standardised Incidence Rate for Lung Cancer by Gender, 1974-2013
44
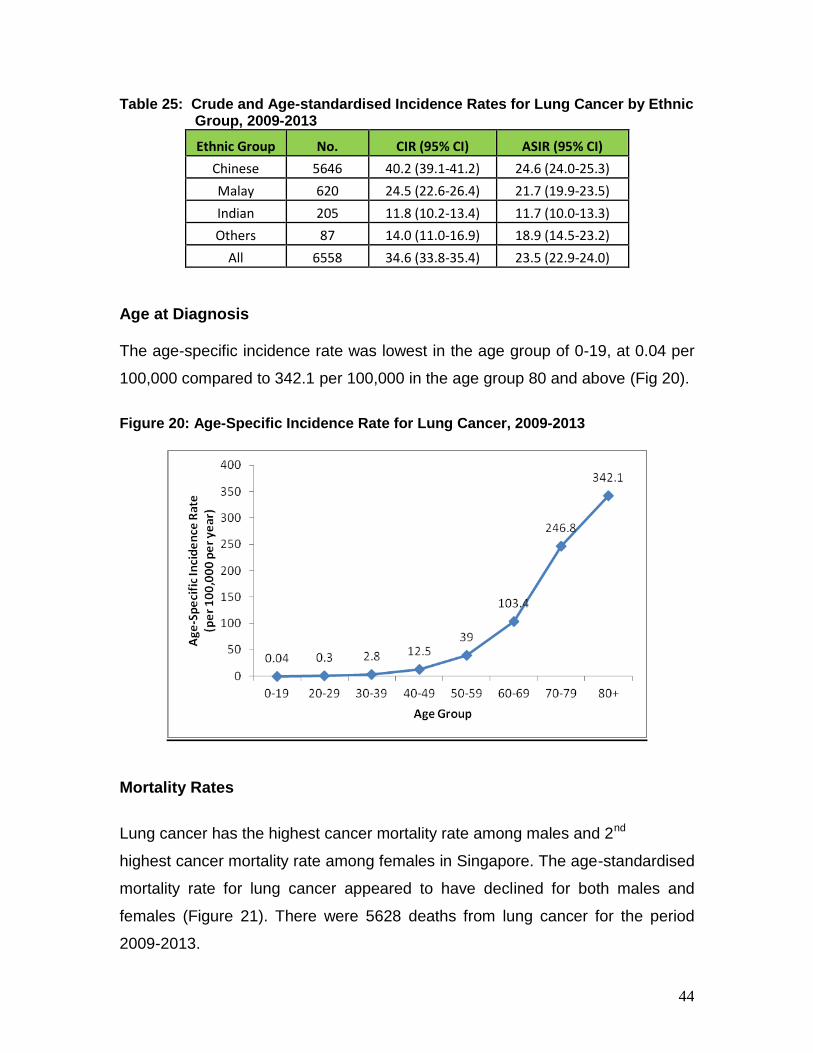
Table 25: Crude and Age-standardised Incidence Rates for Lung Cancer by Ethnic Group, 2009-2013
Ethnic Group No. CIR (95% CI) ASIR (95% CI)
Chinese 5646 40.2 (39.1-41.2) 24.6 (24.0-25.3)
Malay 620 24.5 (22.6-26.4) 21.7 (19.9-23.5)
Indian 205 11.8 (10.2-13.4) 11.7 (10.0-13.3)
Others 87 14.0 (11.0-16.9) 18.9 (14.5-23.2)
All 6558 34.6 (33.8-35.4) 23.5 (22.9-24.0)
Age at Diagnosis The age-specific incidence rate was lowest in the age group of 0-19, at 0.04 per
100,000 compared to 342.1 per 100,000 in the age group 80 and above (Fig 20).
Figure 20: Age-Specific Incidence Rate for Lung Cancer, 2009-2013
Mortality Rates
Lung cancer has the highest cancer mortality rate among males and 2nd
highest cancer mortality rate among females in Singapore. The age-standardised
mortality rate for lung cancer appeared to have declined for both males and
females (Figure 21). There were 5628 deaths from lung cancer for the period
2009-2013.

45
Figure 21: Age-Standardised Mortality Rate for Lung Cancer, Singapore 2009-2013
Table 26: Ethnic distribution of lung cancer patients, 2004-2013
Period 2004-2008 2009-2013
Ethnicity (Males) No. of cases Percent No. of cases Percent
Chinese 3431 86.5 3634 84.8
Malay 368 9.3 444 10.3
Indian 133 3.3 150 3.5
Others 34 0.9 59 1.4
Total 3966 100.0 4287 100.0
Period 2004-2008 2009-2013
Ethnicity (Females) No. of cases Percent No. of cases Percent
Chinese 1784 90.0 2012 88.6
Malay 153 7.7 176 7.8
Indian 25 1.3 55 2.4
Others 20 1.0 28 1.2
Total 1982 100.0 2271 100.0
46
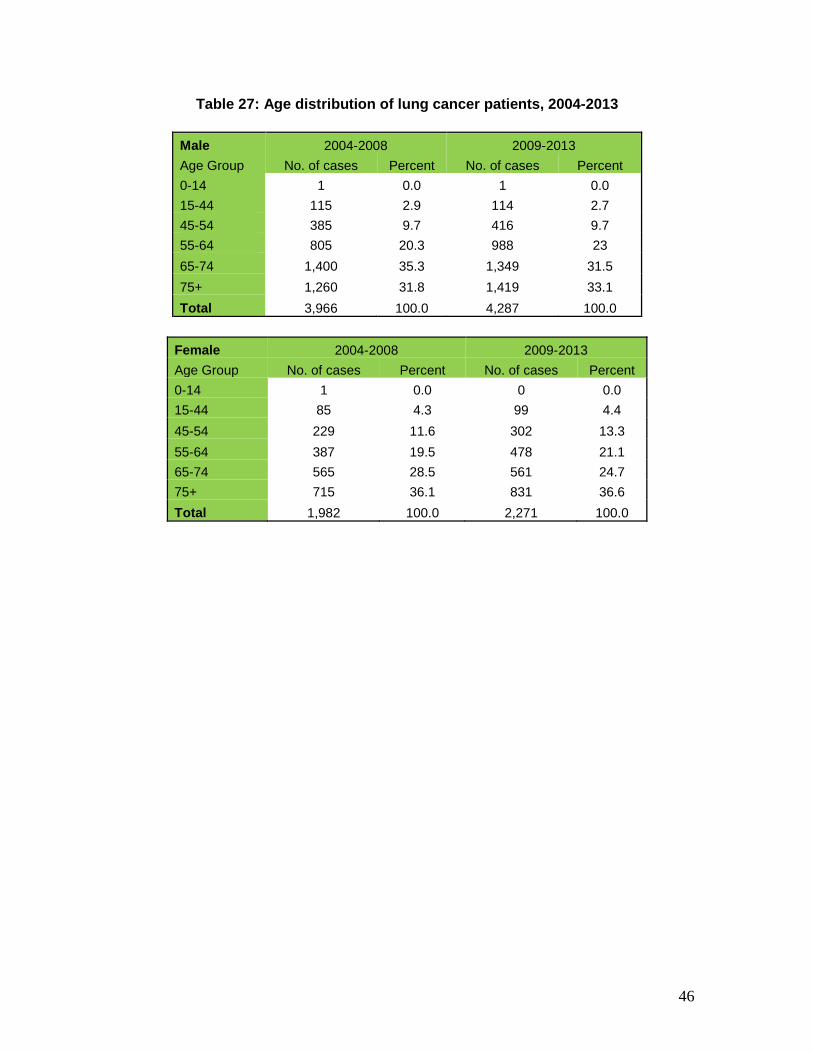
Table 27: Age distribution of lung cancer patients, 2004-2013
Male 2004-2008 2009-2013
Age Group No. of cases Percent No. of cases Percent
0-14 1 0.0 1 0.0
15-44 115 2.9 114 2.7
45-54 385 9.7 416 9.7
55-64 805 20.3 988 23
65-74 1,400 35.3 1,349 31.5
75+ 1,260 31.8 1,419 33.1
Total 3,966 100.0 4,287 100.0
Female 2004-2008 2009-2013
Age Group No. of cases Percent No. of cases Percent
0-14 1 0.0 0 0.0
15-44 85 4.3 99 4.4
45-54 229 11.6 302 13.3
55-64 387 19.5 478 21.1
65-74 565 28.5 561 24.7
75+ 715 36.1 831 36.6
Total 1,982 100.0 2,271 100.0
47
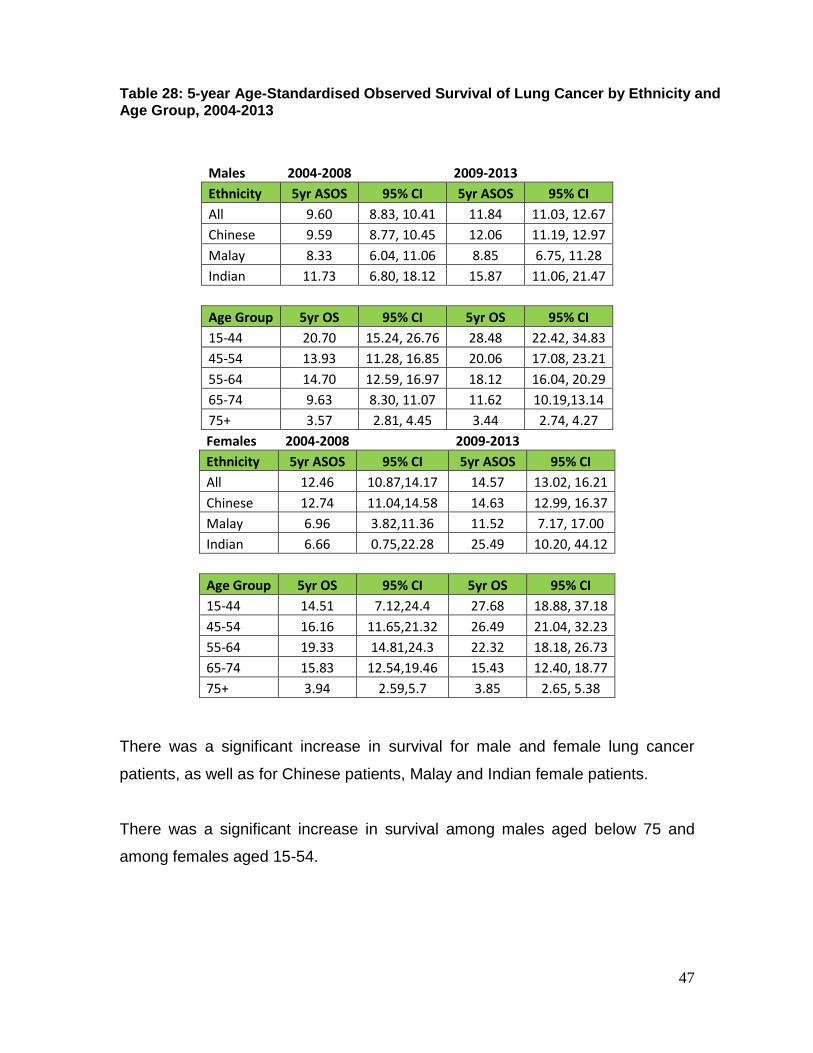
Females 2004-2008
2009-2013 Ethnicity 5yr ASOS 95% CI 5yr ASOS 95% CI
All 12.46 10.87,14.17 14.57 13.02, 16.21
Chinese 12.74 11.04,14.58 14.63 12.99, 16.37
Malay 6.96 3.82,11.36 11.52 7.17, 17.00
Indian 6.66 0.75,22.28 25.49 10.20, 44.12
Age Group 5yr OS 95% CI 5yr OS 95% CI
15-44 14.51 7.12,24.4 27.68 18.88, 37.18
45-54 16.16 11.65,21.32 26.49 21.04, 32.23
55-64 19.33 14.81,24.3 22.32 18.18, 26.73
65-74 15.83 12.54,19.46 15.43 12.40, 18.77
75+ 3.94 2.59,5.7 3.85 2.65, 5.38
There was a significant increase in survival for male and female lung cancer
patients, as well as for Chinese patients, Malay and Indian female patients.
There was a significant increase in survival among males aged below 75 and
among females aged 15-54.
Males 2004-2008
2009-2013 Ethnicity 5yr ASOS 95% CI 5yr ASOS 95% CI
All 9.60 8.83, 10.41 11.84 11.03, 12.67
Chinese 9.59 8.77, 10.45 12.06 11.19, 12.97
Malay 8.33 6.04, 11.06 8.85 6.75, 11.28
Indian 11.73 6.80, 18.12 15.87 11.06, 21.47
Age Group 5yr OS 95% CI 5yr OS 95% CI
15-44 20.70 15.24, 26.76 28.48 22.42, 34.83
45-54 13.93 11.28, 16.85 20.06 17.08, 23.21
55-64 14.70 12.59, 16.97 18.12 16.04, 20.29
65-74 9.63 8.30, 11.07 11.62 10.19,13.14
75+ 3.57 2.81, 4.45 3.44 2.74, 4.27
Table 28: 5-year Age-Standardised Observed Survival of Lung Cancer by Ethnicity and Age Group, 2004-2013