trends in aerosol optical depth in the russian arctic and their links with synoptic climatology
TRANSCRIPT
www.elsevier.com/locate/scitotenv
Science of the Total Environm
Trends in aerosol optical depth in the Russian Arctic and their
links with synoptic climatology
Maria Shahgedanova*, Mikhail Lamakin
Department of Geography, The University of Reading, Whiteknights, P.O. Box 227, Reading RG6 6AB, UK
Received 25 November 2003; received in revised form 10 August 2004; accepted 2 September 2004
Abstract
Temporal and spatial variability of aerosol optical depth (AOD) are examined using observations of direct solar radiation in
the Eurasian Arctic for 1940–1990. AOD is estimated using empirical methods for 14 stations located between 66.28N and
80.68N, from the Kara Sea to the Chukchi Sea. While AOD exhibits a well-known springtime maximum and summertime
minimum at all stations, atmospheric turbidity is higher in spring in the western (Kara–Laptev) part of the Eurasian Arctic.
Between June and August, the eastern (East Siberian–Chukchi) sector experiences higher transparency than the western part.
A statistically significant positive trend in AOD was observed in the Kara–Laptev sector between the late 1950s and the
early 1980s predominantly in spring when pollution-derived aerosol dominates the Arctic atmosphere but not in the eastern
sector. Although all stations are remote, those with positive trends are located closer to the anthropogenic sources of air
pollution. By contrast, a widespread decline in AOD was observed between 1982 and 1990 in the eastern Arctic in spring but
was limited to two sites in the western Arctic. These results suggest that the post-1982 decline in anthropogenic emissions in
Europe and the former Soviet Union has had a limited effect on aerosol load in the Arctic. The post-1982 negative trends in
AOD in summer, when marine aerosol is present in the atmosphere, were more common in the west.
The relationships between AOD and atmospheric circulation are examined using a synoptic climatology approach. In spring,
AOD depends primarily on the strength and direction of air flow. Thus strong westerly and northerly flows result in low AOD
values in the East Siberian–Chukchi sector. By contrast, strong southerly flow associated with the passage of depressions results
in high AOD in the Kara–Laptev sector and trajectory analysis points to the contribution of industrial regions of the sub-Arctic.
In summer, low pressure gradient or anticyclonic conditions result in high atmospheric turbidity. The frequency of this weather
type has declined significantly since the early 1980s in the Kara–Laptev sector, which partly explains the decline in summer
AOD values.
D 2004 Elsevier B.V. All rights reserved.
Keywords: Aerosol optical depth; Air pollution; Trends; Climatic variability; Synoptic climatology; Arctic
0048-9697/$ - s
doi:10.1016/j.sc
* Correspondi
E-mail addr
ent 341 (2005) 133 –148
ee front matter D 2004 Elsevier B.V. All rights reserved.
itotenv.2004.09.018
ng author. Tel.: +44 118 37887745; fax: +44 118 9755865.
ess: [email protected] (M. Shahgedanova).
M. Shahgedanova, M. Lamakin / Science of the Total Environment 341 (2005) 133 –148134
1. Introduction
Atmospheric aerosol is a potent agent of climate
change (IPCC, 2001). It exerts strong influence on
radiative processes through scattering and absorption
of solar radiation and causes an indirect radiative
forcing by changing properties of clouds and concen-
trations of other climatically important constituents of
the atmosphere such as greenhouse gases (Schwartz et
al., 1995). The quantification of aerosol forcing
remains difficult partly because aerosol concentrations
vary significantly in time and space (IPCC, 2001). In
response to this problem, ground-based and airborne
monitoring of atmospheric aerosol began in many
regions in the 1970s (Holben et al., 2001) and satellite
observations began in 1980 (King et al., 1999). While
satellite observations are particularly suited for anal-
ysis of regional and global variations, ground-based
observations of aerosol burden are more accurate and
easier to perform. Estimating aerosol optical depth
(AOD) is the most frequently used way to assess
aerosol load from the ground. AOD is an index of the
attenuation of solar radiation due to the presence of
aerosol derived from measurements of direct solar
radiation. It is a spectral characteristic and in aerosol
studies, AOD at 500 nm is usually considered. In
urban or arid environments, AOD in this spectral
interval can approach unity that implies almost a
100% probability that direct solar radiation is scat-
tered or absorbed before reaching the surface. Under
background conditions, AOD values vary between
0.02 and 0.08 (Shaw, 1982). An important obstacle on
the way to a better understanding of spatial and
temporal variability in AOD is a lack of long-term
continuous records. As Holben et al. (2001) point out,
Fig. 1. Location o
bthe vast majority [of observations] are site-specific,
short-term investigations with little relevance for
seasonal, annual, or long-term trend analysisQ.This paper investigates a unique long-term data set
of AOD derived from the measurements of direct
solar radiation conducted in the Russian Arctic
between 1940 and 1994 (Fig. 1). For comparison,
AOD observations at Barrow, Alaska date back to
1976 (Bodhaine and Dutton, 1993) and observations
in northern Canada date back to 1979 (Barrie and
Hoff, 1984). The Arctic region has been given special
attention because of the high concentrations of
pollution-derived aerosol, which is transported to the
Arctic mainly from Eurasia (Rahn and Lowenthal,
1984; Ottar, 1981). Concentrations of aerosol and,
consequently, AOD values in the Arctic exhibit a
pronounced seasonal cycle, being an order of magni-
tude higher at the end of winter and the beginning of
spring than in summer and autumn. Two main factors
are responsible for the continuous accumulation of
aerosol throughout the winter: polar night and the
absence of photochemical reactions; and low deposi-
tion rates controlled by atmospheric stability and
precipitation. Barrie (1986a), Shaw and Khalil (1989),
and Shaw (1982, 1995) provide comprehensive
reviews of climatology of Arctic aerosol.
While AOD observations from Alaska and Canada
have been extensively analysed with regard to
seasonal (Lowenthal and Rahn, 1985; Shao-Meng et
al., 1993) and long-term trends (Bodhaine and Dutton,
1993), and synoptic conditions (Shaw, 1985; Smirnov
et al., 1996), discussion of changes in AOD over the
Russian Arctic focused primarily on the impacts of
volcanic eruptions (Marshunova and Mishin, 1988;
Marshunova and Radionov, 1988). Radionov et al.
f the sites.
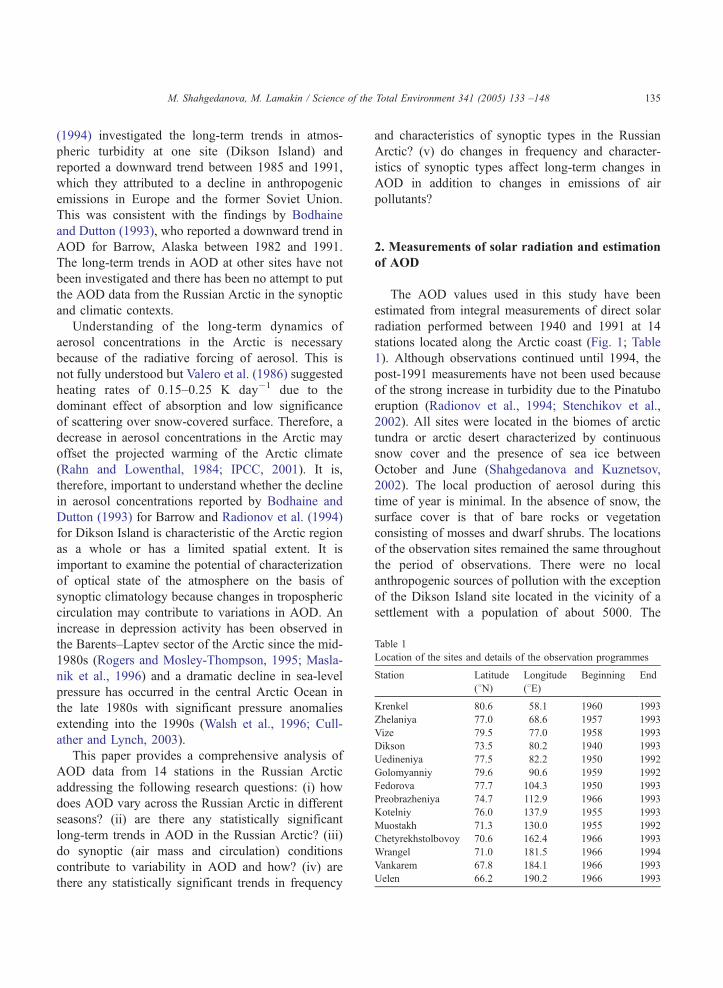
Table 1
Location of the sites and details of the observation programmes
Station Latitude
(8N)Longitude
(8E)Beginning End
Krenkel 80.6 58.1 1960 1993
Zhelaniya 77.0 68.6 1957 1993
Vize 79.5 77.0 1958 1993
Dikson 73.5 80.2 1940 1993
Uedineniya 77.5 82.2 1950 1992
Golomyanniy 79.6 90.6 1959 1992
Fedorova 77.7 104.3 1950 1993
Preobrazheniya 74.7 112.9 1966 1993
Kotelniy 76.0 137.9 1955 1993
Muostakh 71.3 130.0 1955 1992
Chetyrekhstolbovoy 70.6 162.4 1966 1993
Wrangel 71.0 181.5 1966 1994
Vankarem 67.8 184.1 1966 1993
Uelen 66.2 190.2 1966 1993
M. Shahgedanova, M. Lamakin / Science of the Total Environment 341 (2005) 133 –148 135
(1994) investigated the long-term trends in atmos-
pheric turbidity at one site (Dikson Island) and
reported a downward trend between 1985 and 1991,
which they attributed to a decline in anthropogenic
emissions in Europe and the former Soviet Union.
This was consistent with the findings by Bodhaine
and Dutton (1993), who reported a downward trend in
AOD for Barrow, Alaska between 1982 and 1991.
The long-term trends in AOD at other sites have not
been investigated and there has been no attempt to put
the AOD data from the Russian Arctic in the synoptic
and climatic contexts.
Understanding of the long-term dynamics of
aerosol concentrations in the Arctic is necessary
because of the radiative forcing of aerosol. This is
not fully understood but Valero et al. (1986) suggested
heating rates of 0.15–0.25 K day�1 due to the
dominant effect of absorption and low significance
of scattering over snow-covered surface. Therefore, a
decrease in aerosol concentrations in the Arctic may
offset the projected warming of the Arctic climate
(Rahn and Lowenthal, 1984; IPCC, 2001). It is,
therefore, important to understand whether the decline
in aerosol concentrations reported by Bodhaine and
Dutton (1993) for Barrow and Radionov et al. (1994)
for Dikson Island is characteristic of the Arctic region
as a whole or has a limited spatial extent. It is
important to examine the potential of characterization
of optical state of the atmosphere on the basis of
synoptic climatology because changes in tropospheric
circulation may contribute to variations in AOD. An
increase in depression activity has been observed in
the Barents–Laptev sector of the Arctic since the mid-
1980s (Rogers and Mosley-Thompson, 1995; Masla-
nik et al., 1996) and a dramatic decline in sea-level
pressure has occurred in the central Arctic Ocean in
the late 1980s with significant pressure anomalies
extending into the 1990s (Walsh et al., 1996; Cull-
ather and Lynch, 2003).
This paper provides a comprehensive analysis of
AOD data from 14 stations in the Russian Arctic
addressing the following research questions: (i) how
does AOD vary across the Russian Arctic in different
seasons? (ii) are there any statistically significant
long-term trends in AOD in the Russian Arctic? (iii)
do synoptic (air mass and circulation) conditions
contribute to variability in AOD and how? (iv) are
there any statistically significant trends in frequency
and characteristics of synoptic types in the Russian
Arctic? (v) do changes in frequency and character-
istics of synoptic types affect long-term changes in
AOD in addition to changes in emissions of air
pollutants?
2. Measurements of solar radiation and estimation
of AOD
The AOD values used in this study have been
estimated from integral measurements of direct solar
radiation performed between 1940 and 1991 at 14
stations located along the Arctic coast (Fig. 1; Table
1). Although observations continued until 1994, the
post-1991 measurements have not been used because
of the strong increase in turbidity due to the Pinatubo
eruption (Radionov et al., 1994; Stenchikov et al.,
2002). All sites were located in the biomes of arctic
tundra or arctic desert characterized by continuous
snow cover and the presence of sea ice between
October and June (Shahgedanova and Kuznetsov,
2002). The local production of aerosol during this
time of year is minimal. In the absence of snow, the
surface cover is that of bare rocks or vegetation
consisting of mosses and dwarf shrubs. The locations
of the observation sites remained the same throughout
the period of observations. There were no local
anthropogenic sources of pollution with the exception
of the Dikson Island site located in the vicinity of a
settlement with a population of about 5000. The
M. Shahgedanova, M. Lamakin / Science of the Total Environment 341 (2005) 133 –148136
measurements of solar radiation were accompanied by
standard meteorological observations.
Direct solar radiation was measured using thermo-
electric pyrheliometers (AT-50 model produced in the
former Soviet Union) with 108 view field angle and
spectral response of 0.4–4.0 Am. These instruments
were analogous to the Angstrom pyrheliometer
recommended by the WMO (WMO, 1971) and were
calibrated once a month against an Angstrom pyrheli-
ometer. The accuracy of the measurement of the flux
of direct solar radiation was F10 W m�2 with
measured signal ranging between 600 and 1000 W
m�2. The resulting error of AOD estimation is in the
order of 0.001. These pyrheliometers have been used
at all sites and throughout the period of observations,
thus providing internal consistency of the data set. All
measurements were taken manually under the dclearskyT conditions defined as the area of clear sky aroundthe solar disk equal to twice the area of the solar disk,
and for solar elevations above 108. The measure-
ments, usually three to seven per day, were made at
different times of day and these did not necessarily
correspond to the standard meteorological times.
The permanent location of the observation sites,
simplicity of the instruments (suited to the routine
operations in contrast to sun photometers operated in
the BAPMoN network) and consistency in their use
make this AOD data set particularly suitable for
analysis of spatial patterns and long-term trends.
However, one should compare these data with other
data sets with care as different instruments and
methods of AOD estimation are used elsewhere. The
main disadvantage is that observations are limited to
the polar day (March–October) and to the dclear skyTconditions (infrequent in September and October).
This effectively restricted observations to March–
August. Each month, there were on average about 10
days with observations of solar radiation from which
AOD values were derived. These data, as all ground-
based observations, do not allow one to distinguish
between tropospheric and stratospheric aerosol.
Impacts of the eruptions of El Chichon and Pinatubo
on AOD have been discussed by Radionov et al.
(1994) and Stenchikov et al. (2002) and will be
addressed in this paper briefly.
In this study, two sets of AOD data are used.
Spatial distribution and long-term trends have been
analysed using monthly time series of AOD for 500
nm (s500). Analysis of the links between AOD and
synoptic conditions has been performed with regard to
two sites, Dikson Island and Wrangel Island, using
daily AOD statistics for 550 nm (s550). The values ofs550 are marginally lower than the values of s500(Angstrom, 1929, 1961). The difference is inversely
proportional to the size of aerosol and the largest
differences are observed in summer when fine aerosol
dominates the Arctic atmosphere. Daily means have
been calculated using all AOD estimates available on
the day and this varied between days.
s500 has been estimated using a regression model
derived from the simultaneous integral measurements
of direct solar radiation by pyrheliometers and spectral
measurements by sun photometer:
s500 ¼ � 0:110� 0:892ln P2 ð1Þ
where P2 is the transmission coefficient of the
atmosphere with two optical air masses (i.e., solar
elevation of 308). P2 is estimated from the flux of
direct solar radiation using the equation derived by
Evnevich and Savikovsky (1989):
P2 ¼
S
1:367
!sin hð Þþ0:250:41
ð2Þ
where S is direct solar radiation (W m�2) and h is
solar elevation (8). Eq. (2) represents an improved
version of Sivkov’s (1960) empirical model based on
more than 13,000 observations. The calculation of P2
is similar to the procedure for the estimation of
dapparent transmissionT first introduced by Ellis and
Pueschel (1971) and widely used in radiation studies
(e.g., Bodhaine et al., 2002). The concurrent spectral
and integral measurements, used to derive Eq. (1),
have been conducted at different locations in the
Arctic (Sakunov et al., 1988; Radionov et al., 1994).
Values of the coefficient of determination (R2) ranged
between 0.67 and 0.82 for the atmosphere with high
transparency and 0.96 for the atmosphere contami-
nated by volcanic aerosol following the El Chichon
eruption (1983). Regression coefficients for 1983
were significantly different from those for other years
and data for 1983 were not used. Lower values of R2
(0.67–0.70) were characteristic of March–May while
higher values (0.70–0.82) were typical of June–
September.
M. Shahgedanova, M. Lamakin / Science of the Total Environment 341 (2005) 133 –148 137
While the error associated with accuracy of solar
radiation measurements is insignificant, the attenu-
ation of solar radiation by other atmospheric
constituents and their variability may contribute to
the uncertainty of s500 estimation. The value of P2,
upon which s500 is based, is estimated from a wide
range of wavelengths between 0.4 and 4 Am and,
therefore, depends on Rayleigh scattering (which
accounted for about 50% of the total attenuation of
solar radiation), aerosol scattering, and absorption by
water vapour, O2, O3, CO2 and NO2. Marshunova
and Radionov (1988) and Marshunova and Mishin
(1988) analyzed the relative contributions of these
factors into the variability in P2 over the Arctic
Ocean and concluded that atmospheric aerosol and
water vapour were the most important contributors
while other influences were less important (e.g., O3
optical depth at 500 nm for the total ozone of 300
D.U. is 0.009) or negligible. In March and April, the
attenuation of solar radiation by aerosol and water
vapour accounted for 38% and 16% of total
attenuation, respectively. Between May and Septem-
ber aerosol accounted for 21–29% and water vapour
for 24–30%. The strong correlations between the
s500 time series estimated from integral and spectral
measurements confirm that variability in precipitable
water does not affect the performance of the
regression model significantly. The west–east gra-
dient in precipitable water is small and does not
introduce significant uncertainty in the analysis of
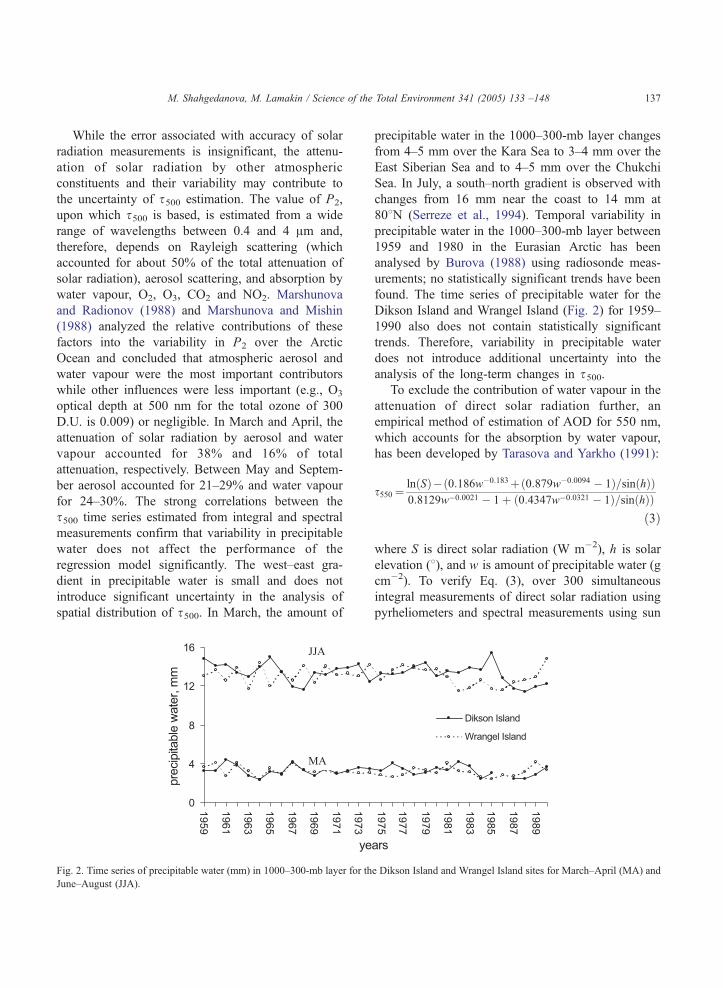
spatial distribution of s500. In March, the amount of
Fig. 2. Time series of precipitable water (mm) in 1000–300-mb layer for th
June–August (JJA).
precipitable water in the 1000–300-mb layer changes
from 4–5 mm over the Kara Sea to 3–4 mm over the
East Siberian Sea and to 4–5 mm over the Chukchi
Sea. In July, a south–north gradient is observed with
changes from 16 mm near the coast to 14 mm at
808N (Serreze et al., 1994). Temporal variability in
precipitable water in the 1000–300-mb layer between
1959 and 1980 in the Eurasian Arctic has been
analysed by Burova (1988) using radiosonde meas-
urements; no statistically significant trends have been
found. The time series of precipitable water for the
Dikson Island and Wrangel Island (Fig. 2) for 1959–
1990 also does not contain statistically significant
trends. Therefore, variability in precipitable water
does not introduce additional uncertainty into the
analysis of the long-term changes in s500.To exclude the contribution of water vapour in the
attenuation of direct solar radiation further, an
empirical method of estimation of AOD for 550 nm,
which accounts for the absorption by water vapour,
has been developed by Tarasova and Yarkho (1991):
s550 ¼ln Sð Þ� 0:186w�0:183þ 0:879w�0:0094 � 1ð Þ=sin hð Þð Þ0:8129w�0:0021 � 1þ 0:4347w�0:0321 � 1ð Þ=sin hð ÞÞ
ð3Þ
where S is direct solar radiation (W m�2), h is solar
elevation (8), and w is amount of precipitable water (g
cm�2). To verify Eq. (3), over 300 simultaneous
integral measurements of direct solar radiation using
pyrheliometers and spectral measurements using sun
e Dikson Island and Wrangel Island sites for March–April (MA) and
M. Shahgedanova, M. Lamakin / Science of the Total Environment 341 (2005) 133 –148138
photometers were performed at a number of back-
ground locations with negligible concentrations of
tropospheric NO2 and O3 (Tarasova and Yarkho,
personal communication; Radionov et al., 1999). The
s550 values derived from integral measurements
using Eq. (3) were in close agreement with s550derived from spectral measurements with a correlation
coefficient of 0.95. This method has been recommen-
ded for the estimation of AOD at those Russian
stations where spectral observations of solar radiation
are not available. However, in this study it has been
used for two sites only because precipitable water (or
vapour pressure used in its estimation) data were not
available for other sites at daily resolution.
The network of radiosonde stations does not
always correspond to the network of stations measur-
ing solar radiation, and to overcome this problem,
amounts of precipitable water to be used in the Eq. (3)
have been estimated from actual vapour pressure
measured at the ground level using an approximation
suggested by Sivkov (1968) and adapted for the
Russian Arctic by Burova (1983):
w ¼ 0:33e0:775 ð4Þ
where w is precipitable water (g cm�2) and e is
actual vapour pressure (mb). This equation has been
verified using independent data sets of precipitable
water derived from radiosonde measurements and
estimated using Eq. (4) for the Dikson Island and
Wrangel Island sites. The agreement was very close
for March–April with correlation coefficients of 0.91
and 0.85, respectively, and average differences
between pairs of estimates of 0.6 and 0.3 mm. This
close agreement reflects the fact that in spring the bulk
of water vapour is typically found in the lower
troposphere, below 700 mb (Serreze et al., 1995).
The lower correlation coefficient of 0.77 for both sites
and average differences of 1.6 and 0.6 were obtained
for June–August. Note that a change in precipitable
water from 13 to 16 mm (twice the average difference
for the Dikson Island site and typical July values)
results in the s550 estimation error of 0.008 at solar
elevation of 308 and solar radiation flux of 700 W
m�2 while the typical June–August values of s550range mainly between 0.05 and 0.10. Potential
uncertainty is associated with radiosonde measure-
ments too because humidity data are often not
transmitted at temperatures below �408C. However,this error is small in spring and summer (F5% for
vertically integrated vapour flux) because air temper-
atures below �408C are not common at low levels
during these seasons (Serreze et al., 1995).
3. Spatial distribution of AOD
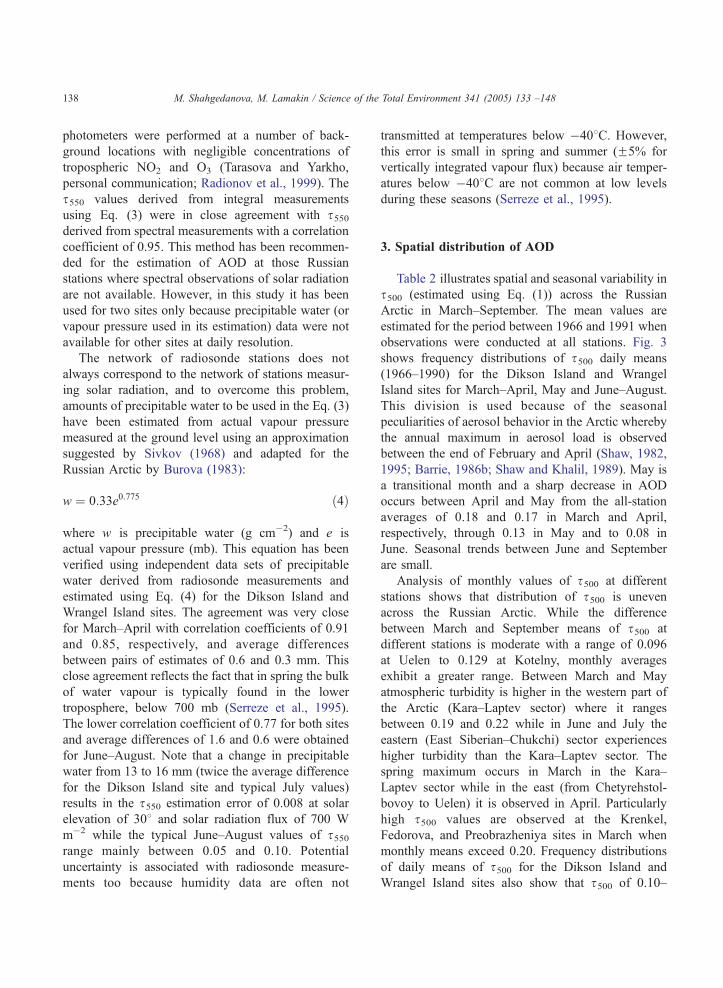
Table 2 illustrates spatial and seasonal variability in
s500 (estimated using Eq. (1)) across the Russian
Arctic in March–September. The mean values are
estimated for the period between 1966 and 1991 when
observations were conducted at all stations. Fig. 3
shows frequency distributions of s500 daily means
(1966–1990) for the Dikson Island and Wrangel
Island sites for March–April, May and June–August.
This division is used because of the seasonal
peculiarities of aerosol behavior in the Arctic whereby
the annual maximum in aerosol load is observed
between the end of February and April (Shaw, 1982,
1995; Barrie, 1986b; Shaw and Khalil, 1989). May is
a transitional month and a sharp decrease in AOD
occurs between April and May from the all-station
averages of 0.18 and 0.17 in March and April,
respectively, through 0.13 in May and to 0.08 in
June. Seasonal trends between June and September
are small.
Analysis of monthly values of s500 at different
stations shows that distribution of s500 is uneven
across the Russian Arctic. While the difference
between March and September means of s500 at
different stations is moderate with a range of 0.096
at Uelen to 0.129 at Kotelny, monthly averages
exhibit a greater range. Between March and May
atmospheric turbidity is higher in the western part of
the Arctic (Kara–Laptev sector) where it ranges
between 0.19 and 0.22 while in June and July the
eastern (East Siberian–Chukchi) sector experiences
higher turbidity than the Kara–Laptev sector. The
spring maximum occurs in March in the Kara–
Laptev sector while in the east (from Chetyrehstol-
bovoy to Uelen) it is observed in April. Particularly
high s500 values are observed at the Krenkel,
Fedorova, and Preobrazheniya sites in March when
monthly means exceed 0.20. Frequency distributions
of daily means of s500 for the Dikson Island and
Wrangel Island sites also show that s500 of 0.10–
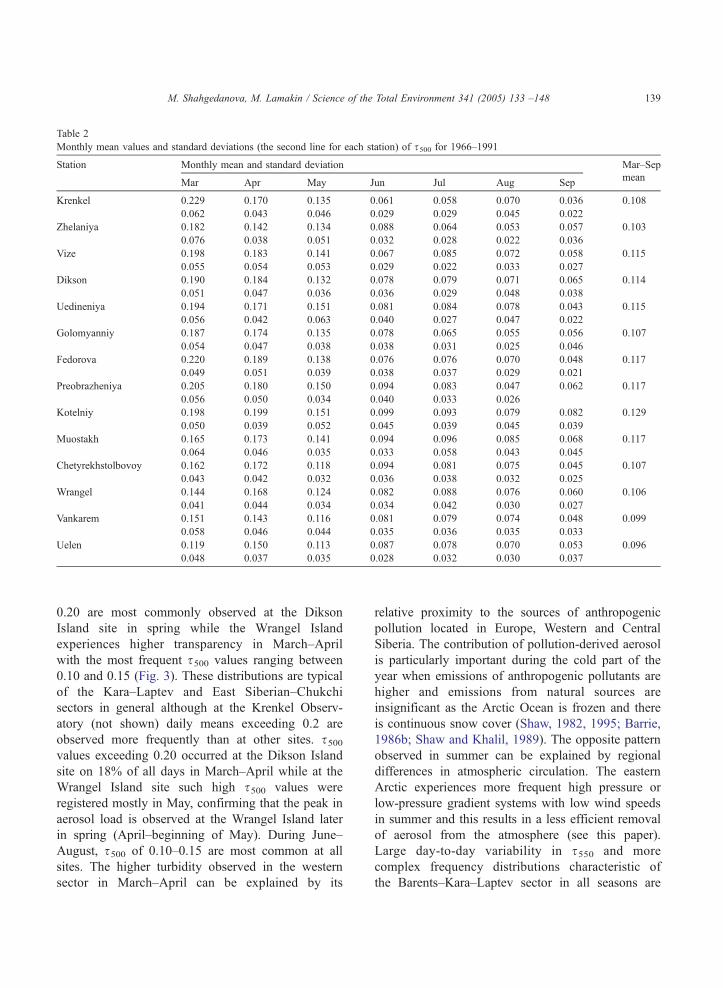
Table 2
Monthly mean values and standard deviations (the second line for each station) of s500 for 1966–1991
Station Monthly mean and standard deviation Mar–Sep
Mar Apr May Jun Jul Aug Sepmean
Krenkel 0.229 0.170 0.135 0.061 0.058 0.070 0.036 0.108
0.062 0.043 0.046 0.029 0.029 0.045 0.022
Zhelaniya 0.182 0.142 0.134 0.088 0.064 0.053 0.057 0.103
0.076 0.038 0.051 0.032 0.028 0.022 0.036
Vize 0.198 0.183 0.141 0.067 0.085 0.072 0.058 0.115
0.055 0.054 0.053 0.029 0.022 0.033 0.027
Dikson 0.190 0.184 0.132 0.078 0.079 0.071 0.065 0.114
0.051 0.047 0.036 0.036 0.029 0.048 0.038
Uedineniya 0.194 0.171 0.151 0.081 0.084 0.078 0.043 0.115
0.056 0.042 0.063 0.040 0.027 0.047 0.022
Golomyanniy 0.187 0.174 0.135 0.078 0.065 0.055 0.056 0.107
0.054 0.047 0.038 0.038 0.031 0.025 0.046
Fedorova 0.220 0.189 0.138 0.076 0.076 0.070 0.048 0.117
0.049 0.051 0.039 0.038 0.037 0.029 0.021
Preobrazheniya 0.205 0.180 0.150 0.094 0.083 0.047 0.062 0.117
0.056 0.050 0.034 0.040 0.033 0.026
Kotelniy 0.198 0.199 0.151 0.099 0.093 0.079 0.082 0.129
0.050 0.039 0.052 0.045 0.039 0.045 0.039
Muostakh 0.165 0.173 0.141 0.094 0.096 0.085 0.068 0.117
0.064 0.046 0.035 0.033 0.058 0.043 0.045
Chetyrekhstolbovoy 0.162 0.172 0.118 0.094 0.081 0.075 0.045 0.107
0.043 0.042 0.032 0.036 0.038 0.032 0.025
Wrangel 0.144 0.168 0.124 0.082 0.088 0.076 0.060 0.106
0.041 0.044 0.034 0.034 0.042 0.030 0.027
Vankarem 0.151 0.143 0.116 0.081 0.079 0.074 0.048 0.099
0.058 0.046 0.044 0.035 0.036 0.035 0.033
Uelen 0.119 0.150 0.113 0.087 0.078 0.070 0.053 0.096
0.048 0.037 0.035 0.028 0.032 0.030 0.037
M. Shahgedanova, M. Lamakin / Science of the Total Environment 341 (2005) 133 –148 139
0.20 are most commonly observed at the Dikson
Island site in spring while the Wrangel Island
experiences higher transparency in March–April
with the most frequent s500 values ranging between
0.10 and 0.15 (Fig. 3). These distributions are typical
of the Kara–Laptev and East Siberian–Chukchi
sectors in general although at the Krenkel Observ-
atory (not shown) daily means exceeding 0.2 are
observed more frequently than at other sites. s500values exceeding 0.20 occurred at the Dikson Island
site on 18% of all days in March–April while at the
Wrangel Island site such high s500 values were
registered mostly in May, confirming that the peak in
aerosol load is observed at the Wrangel Island later
in spring (April–beginning of May). During June–
August, s500 of 0.10–0.15 are most common at all
sites. The higher turbidity observed in the western
sector in March–April can be explained by its
relative proximity to the sources of anthropogenic
pollution located in Europe, Western and Central
Siberia. The contribution of pollution-derived aerosol
is particularly important during the cold part of the
year when emissions of anthropogenic pollutants are
higher and emissions from natural sources are
insignificant as the Arctic Ocean is frozen and there
is continuous snow cover (Shaw, 1982, 1995; Barrie,
1986b; Shaw and Khalil, 1989). The opposite pattern
observed in summer can be explained by regional
differences in atmospheric circulation. The eastern
Arctic experiences more frequent high pressure or
low-pressure gradient systems with low wind speeds
in summer and this results in a less efficient removal
of aerosol from the atmosphere (see this paper).
Large day-to-day variability in s550 and more
complex frequency distributions characteristic of
the Barents–Kara–Laptev sector in all seasons are
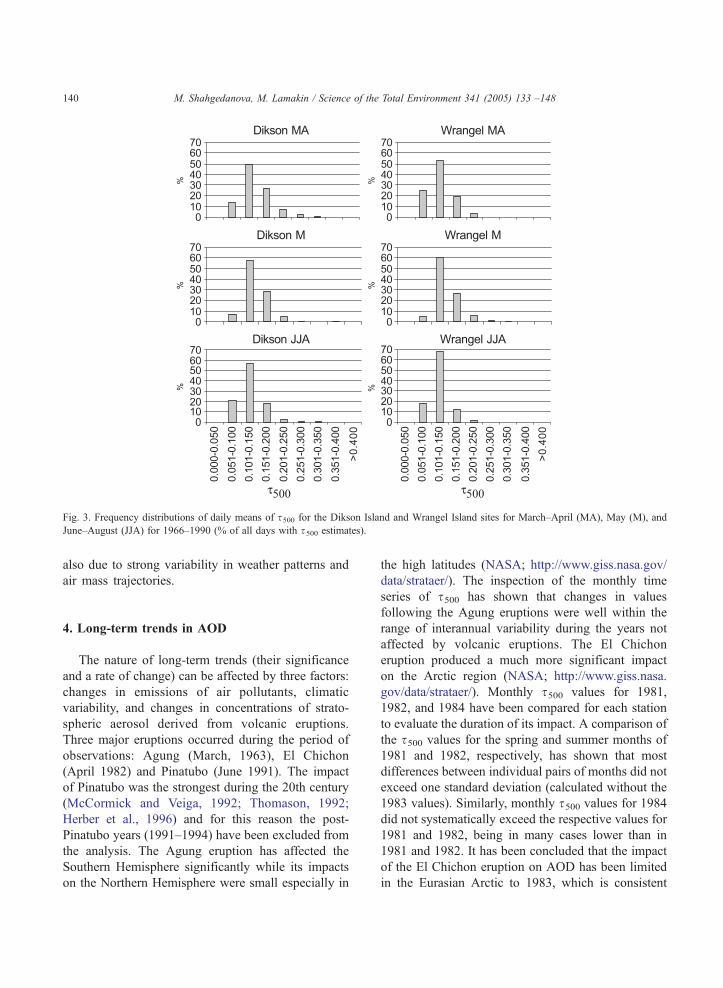
Fig. 3. Frequency distributions of daily means of s500 for the Dikson Island and Wrangel Island sites for March–April (MA), May (M), and
June–August (JJA) for 1966–1990 (% of all days with s500 estimates).
M. Shahgedanova, M. Lamakin / Science of the Total Environment 341 (2005) 133 –148140
also due to strong variability in weather patterns and
air mass trajectories.
4. Long-term trends in AOD
The nature of long-term trends (their significance
and a rate of change) can be affected by three factors:
changes in emissions of air pollutants, climatic
variability, and changes in concentrations of strato-
spheric aerosol derived from volcanic eruptions.
Three major eruptions occurred during the period of
observations: Agung (March, 1963), El Chichon
(April 1982) and Pinatubo (June 1991). The impact
of Pinatubo was the strongest during the 20th century
(McCormick and Veiga, 1992; Thomason, 1992;
Herber et al., 1996) and for this reason the post-
Pinatubo years (1991–1994) have been excluded from
the analysis. The Agung eruption has affected the
Southern Hemisphere significantly while its impacts
on the Northern Hemisphere were small especially in
the high latitudes (NASA; http://www.giss.nasa.gov/
data/strataer/). The inspection of the monthly time
series of s500 has shown that changes in values
following the Agung eruptions were well within the
range of interannual variability during the years not
affected by volcanic eruptions. The El Chichon
eruption produced a much more significant impact
on the Arctic region (NASA; http://www.giss.nasa.
gov/data/strataer/). Monthly s500 values for 1981,
1982, and 1984 have been compared for each station
to evaluate the duration of its impact. A comparison of
the s500 values for the spring and summer months of
1981 and 1982, respectively, has shown that most
differences between individual pairs of months did not
exceed one standard deviation (calculated without the
1983 values). Similarly, monthly s500 values for 1984did not systematically exceed the respective values for
1981 and 1982, being in many cases lower than in
1981 and 1982. It has been concluded that the impact
of the El Chichon eruption on AOD has been limited
in the Eurasian Arctic to 1983, which is consistent
M. Shahgedanova, M. Lamakin / Science of the Total Environment 341 (2005) 133 –148 141
with the conclusions by Post et al. (1996) who
estimated that the enhancement of scattering caused
by the products of the El Chichon eruption continued
for about 200 days after the eruption. The year of
1983 has been excluded from the analysis.
The long-term trends in s500 have been estimated
for two parts of the record, the beginning of record
(which differs between stations) and 1981, and 1982–
1990 (without 1983), because at many sites two
different trends were evident with a change in
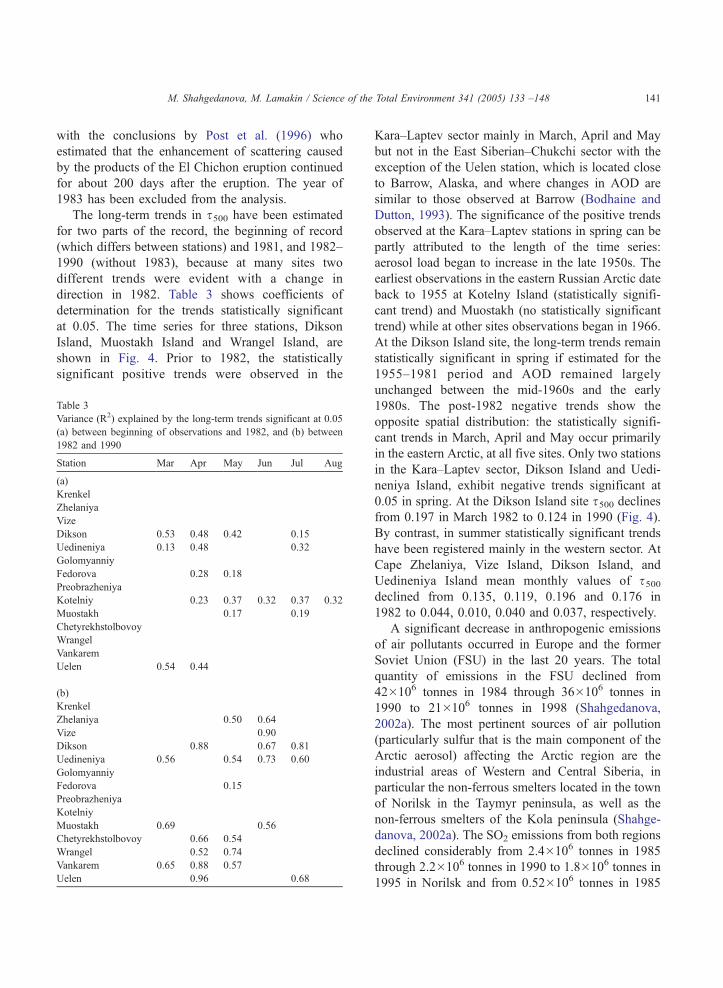
direction in 1982. Table 3 shows coefficients of
determination for the trends statistically significant
at 0.05. The time series for three stations, Dikson
Island, Muostakh Island and Wrangel Island, are
shown in Fig. 4. Prior to 1982, the statistically
significant positive trends were observed in the
Table 3
Variance (R2) explained by the long-term trends significant at 0.05
(a) between beginning of observations and 1982, and (b) between
1982 and 1990
Station Mar Apr May Jun Jul Aug
(a)
Krenkel
Zhelaniya
Vize
Dikson 0.53 0.48 0.42 0.15
Uedineniya 0.13 0.48 0.32
Golomyanniy
Fedorova 0.28 0.18
Preobrazheniya
Kotelniy 0.23 0.37 0.32 0.37 0.32
Muostakh 0.17 0.19
Chetyrekhstolbovoy
Wrangel
Vankarem
Uelen 0.54 0.44
(b)
Krenkel
Zhelaniya 0.50 0.64
Vize 0.90
Dikson 0.88 0.67 0.81
Uedineniya 0.56 0.54 0.73 0.60
Golomyanniy
Fedorova 0.15
Preobrazheniya
Kotelniy
Muostakh 0.69 0.56
Chetyrekhstolbovoy 0.66 0.54
Wrangel 0.52 0.74
Vankarem 0.65 0.88 0.57
Uelen 0.96 0.68
Kara–Laptev sector mainly in March, April and May
but not in the East Siberian–Chukchi sector with the
exception of the Uelen station, which is located close
to Barrow, Alaska, and where changes in AOD are
similar to those observed at Barrow (Bodhaine and
Dutton, 1993). The significance of the positive trends
observed at the Kara–Laptev stations in spring can be
partly attributed to the length of the time series:
aerosol load began to increase in the late 1950s. The
earliest observations in the eastern Russian Arctic date
back to 1955 at Kotelny Island (statistically signifi-
cant trend) and Muostakh (no statistically significant
trend) while at other sites observations began in 1966.
At the Dikson Island site, the long-term trends remain
statistically significant in spring if estimated for the
1955–1981 period and AOD remained largely
unchanged between the mid-1960s and the early
1980s. The post-1982 negative trends show the
opposite spatial distribution: the statistically signifi-
cant trends in March, April and May occur primarily
in the eastern Arctic, at all five sites. Only two stations
in the Kara–Laptev sector, Dikson Island and Uedi-
neniya Island, exhibit negative trends significant at
0.05 in spring. At the Dikson Island site s500 declinesfrom 0.197 in March 1982 to 0.124 in 1990 (Fig. 4).
By contrast, in summer statistically significant trends
have been registered mainly in the western sector. At
Cape Zhelaniya, Vize Island, Dikson Island, and
Uedineniya Island mean monthly values of s500declined from 0.135, 0.119, 0.196 and 0.176 in
1982 to 0.044, 0.010, 0.040 and 0.037, respectively.
A significant decrease in anthropogenic emissions
of air pollutants occurred in Europe and the former
Soviet Union (FSU) in the last 20 years. The total
quantity of emissions in the FSU declined from
42�106 tonnes in 1984 through 36�106 tonnes in
1990 to 21�106 tonnes in 1998 (Shahgedanova,
2002a). The most pertinent sources of air pollution
(particularly sulfur that is the main component of the
Arctic aerosol) affecting the Arctic region are the
industrial areas of Western and Central Siberia, in
particular the non-ferrous smelters located in the town
of Norilsk in the Taymyr peninsula, as well as the
non-ferrous smelters of the Kola peninsula (Shahge-
danova, 2002a). The SO2 emissions from both regions
declined considerably from 2.4�106 tonnes in 1985
through 2.2�106 tonnes in 1990 to 1.8�106 tonnes in
1995 in Norilsk and from 0.52�106 tonnes in 1985
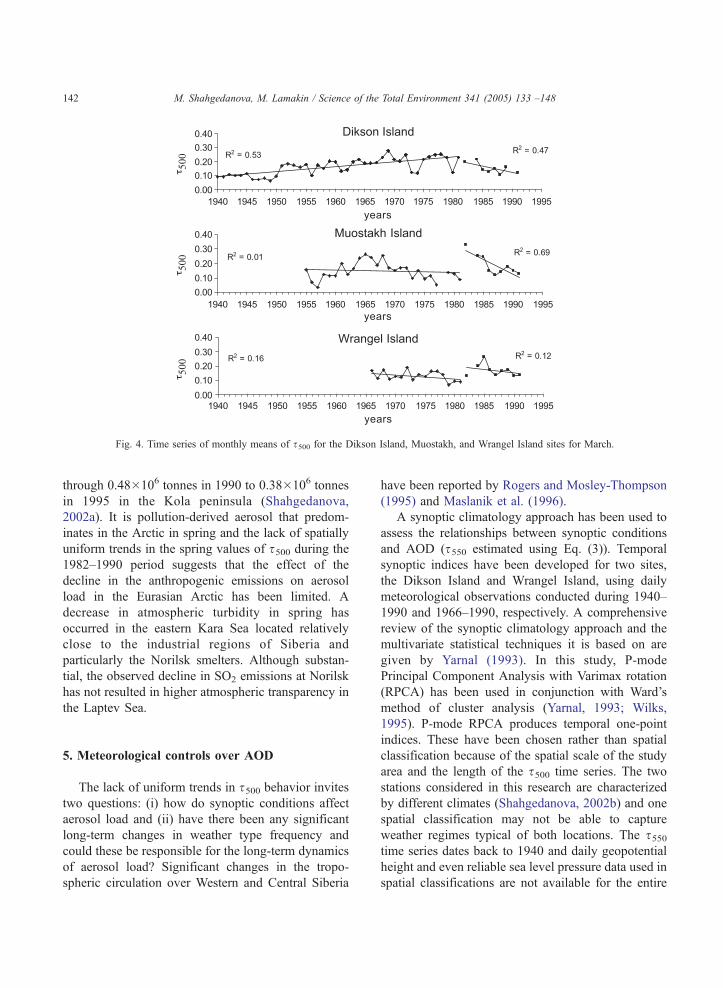
Fig. 4. Time series of monthly means of s500 for the Dikson Island, Muostakh, and Wrangel Island sites for March.
M. Shahgedanova, M. Lamakin / Science of the Total Environment 341 (2005) 133 –148142
through 0.48�106 tonnes in 1990 to 0.38�106 tonnes
in 1995 in the Kola peninsula (Shahgedanova,
2002a). It is pollution-derived aerosol that predom-
inates in the Arctic in spring and the lack of spatially
uniform trends in the spring values of s500 during the
1982–1990 period suggests that the effect of the
decline in the anthropogenic emissions on aerosol
load in the Eurasian Arctic has been limited. A
decrease in atmospheric turbidity in spring has
occurred in the eastern Kara Sea located relatively
close to the industrial regions of Siberia and
particularly the Norilsk smelters. Although substan-
tial, the observed decline in SO2 emissions at Norilsk
has not resulted in higher atmospheric transparency in
the Laptev Sea.
5. Meteorological controls over AOD
The lack of uniform trends in s500 behavior invitestwo questions: (i) how do synoptic conditions affect
aerosol load and (ii) have there been any significant
long-term changes in weather type frequency and
could these be responsible for the long-term dynamics
of aerosol load? Significant changes in the tropo-
spheric circulation over Western and Central Siberia
have been reported by Rogers and Mosley-Thompson
(1995) and Maslanik et al. (1996).
A synoptic climatology approach has been used to
assess the relationships between synoptic conditions
and AOD (s550 estimated using Eq. (3)). Temporal
synoptic indices have been developed for two sites,
the Dikson Island and Wrangel Island, using daily
meteorological observations conducted during 1940–
1990 and 1966–1990, respectively. A comprehensive
review of the synoptic climatology approach and the
multivariate statistical techniques it is based on are
given by Yarnal (1993). In this study, P-mode
Principal Component Analysis with Varimax rotation
(RPCA) has been used in conjunction with Ward’s
method of cluster analysis (Yarnal, 1993; Wilks,
1995). P-mode RPCA produces temporal one-point
indices. These have been chosen rather than spatial
classification because of the spatial scale of the study
area and the length of the s500 time series. The two
stations considered in this research are characterized
by different climates (Shahgedanova, 2002b) and one
spatial classification may not be able to capture
weather regimes typical of both locations. The s550time series dates back to 1940 and daily geopotential
height and even reliable sea level pressure data used in
spatial classifications are not available for the entire
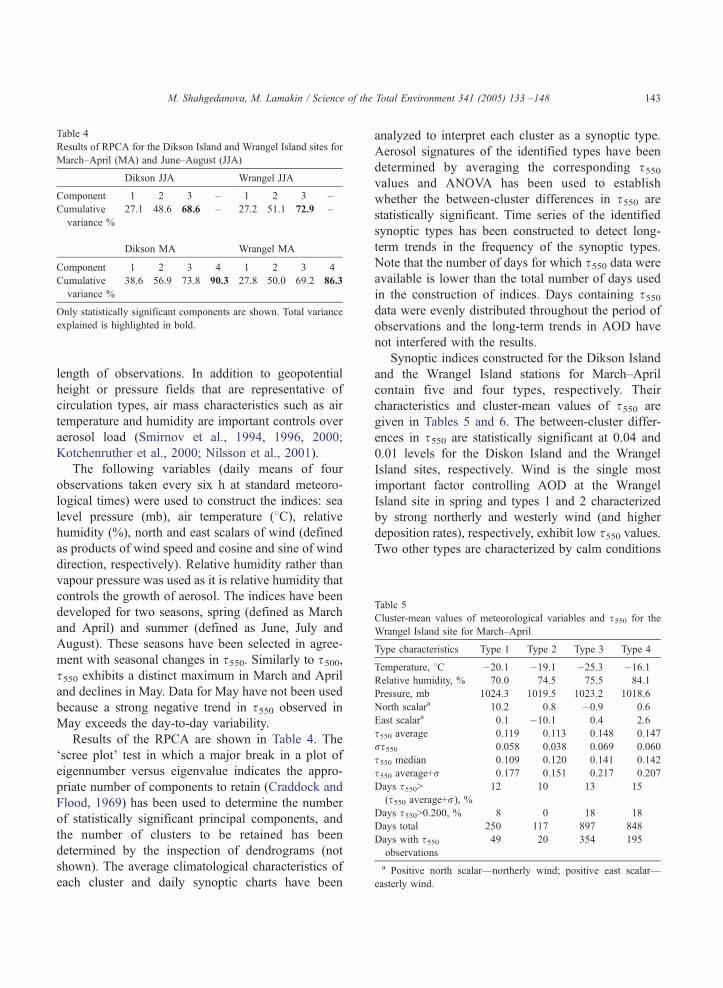
Table 4
Results of RPCA for the Dikson Island and Wrangel Island sites for
March–April (MA) and June–August (JJA)
Dikson JJA Wrangel JJA
Component 1 2 3 – 1 2 3 –
Cumulative
variance %
27.1 48.6 68.6 – 27.2 51.1 72.9 –
Dikson MA Wrangel MA
Component 1 2 3 4 1 2 3 4
Cumulative
variance %
38.6 56.9 73.8 90.3 27.8 50.0 69.2 86.3
Only statistically significant components are shown. Total variance
explained is highlighted in bold.
Table 5
Cluster-mean values of meteorological variables and s550 for the
Wrangel Island site for March–April
Type characteristics Type 1 Type 2 Type 3 Type 4
Temperature, 8C �20.1 �19.1 �25.3 �16.1
Relative humidity, % 70.0 74.5 75.5 84.1
Pressure, mb 1024.3 1019.5 1023.2 1018.6
North scalara 10.2 0.8 �0.9 0.6
East scalara 0.1 �10.1 0.4 2.6
s550 average 0.119 0.113 0.148 0.147
rs550 0.058 0.038 0.069 0.060
s550 median 0.109 0.120 0.141 0.142
s550 average+r 0.177 0.151 0.217 0.207
Days s550N(s550 average+r), %
12 10 13 15
Days s550N0.200, % 8 0 18 18
Days total 250 117 897 848
Days with s550observations
49 20 354 195
a Positive north scalar—northerly wind; positive east scalar—
easterly wind.
M. Shahgedanova, M. Lamakin / Science of the Total Environment 341 (2005) 133 –148 143
length of observations. In addition to geopotential
height or pressure fields that are representative of
circulation types, air mass characteristics such as air
temperature and humidity are important controls over
aerosol load (Smirnov et al., 1994, 1996, 2000;
Kotchenruther et al., 2000; Nilsson et al., 2001).
The following variables (daily means of four
observations taken every six h at standard meteoro-
logical times) were used to construct the indices: sea
level pressure (mb), air temperature (8C), relative
humidity (%), north and east scalars of wind (defined
as products of wind speed and cosine and sine of wind
direction, respectively). Relative humidity rather than
vapour pressure was used as it is relative humidity that
controls the growth of aerosol. The indices have been
developed for two seasons, spring (defined as March
and April) and summer (defined as June, July and
August). These seasons have been selected in agree-
ment with seasonal changes in s550. Similarly to s500,s550 exhibits a distinct maximum in March and April
and declines in May. Data for May have not been used
because a strong negative trend in s550 observed in
May exceeds the day-to-day variability.
Results of the RPCA are shown in Table 4. The
dscree plotT test in which a major break in a plot of
eigennumber versus eigenvalue indicates the appro-
priate number of components to retain (Craddock and
Flood, 1969) has been used to determine the number
of statistically significant principal components, and
the number of clusters to be retained has been
determined by the inspection of dendrograms (not
shown). The average climatological characteristics of
each cluster and daily synoptic charts have been
analyzed to interpret each cluster as a synoptic type.
Aerosol signatures of the identified types have been
determined by averaging the corresponding s550values and ANOVA has been used to establish
whether the between-cluster differences in s550 are
statistically significant. Time series of the identified
synoptic types has been constructed to detect long-
term trends in the frequency of the synoptic types.
Note that the number of days for which s550 data wereavailable is lower than the total number of days used
in the construction of indices. Days containing s550data were evenly distributed throughout the period of
observations and the long-term trends in AOD have
not interfered with the results.
Synoptic indices constructed for the Dikson Island
and the Wrangel Island stations for March–April
contain five and four types, respectively. Their
characteristics and cluster-mean values of s550 are
given in Tables 5 and 6. The between-cluster differ-
ences in s550 are statistically significant at 0.04 and
0.01 levels for the Diskon Island and the Wrangel
Island sites, respectively. Wind is the single most
important factor controlling AOD at the Wrangel
Island site in spring and types 1 and 2 characterized
by strong northerly and westerly wind (and higher
deposition rates), respectively, exhibit low s550 values.Two other types are characterized by calm conditions
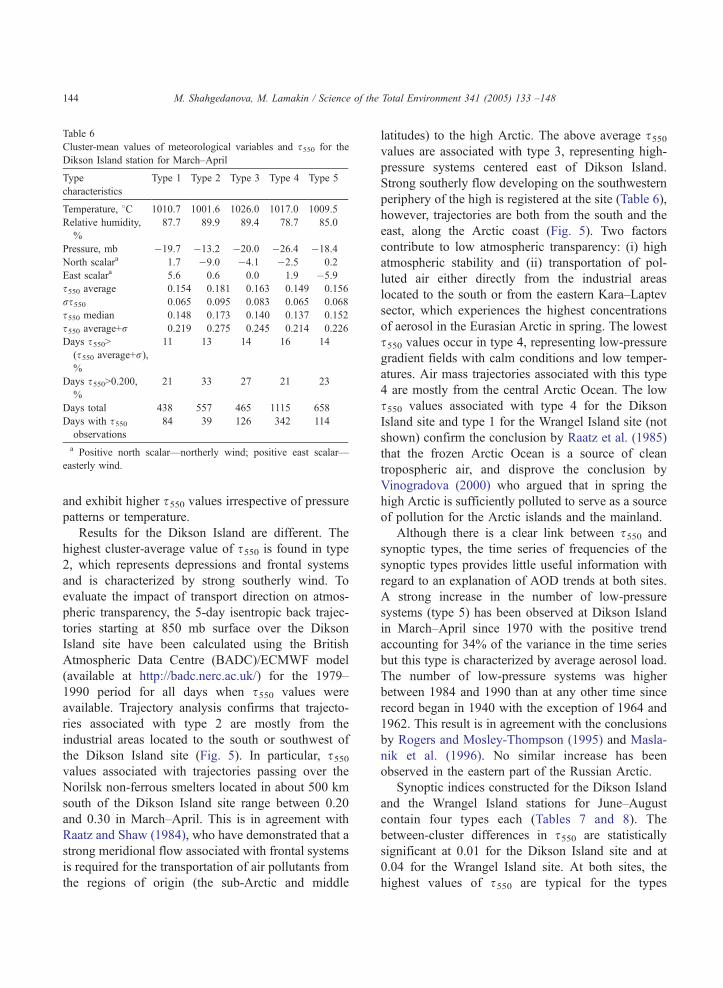
Table 6
Cluster-mean values of meteorological variables and s550 for the
Dikson Island station for March–April
Type
characteristics
Type 1 Type 2 Type 3 Type 4 Type 5
Temperature, 8C 1010.7 1001.6 1026.0 1017.0 1009.5
Relative humidity,
%
87.7 89.9 89.4 78.7 85.0
Pressure, mb �19.7 �13.2 �20.0 �26.4 �18.4
North scalara 1.7 �9.0 �4.1 �2.5 0.2
East scalara 5.6 0.6 0.0 1.9 �5.9
s550 average 0.154 0.181 0.163 0.149 0.156
rs550 0.065 0.095 0.083 0.065 0.068
s550 median 0.148 0.173 0.140 0.137 0.152
s550 average+r 0.219 0.275 0.245 0.214 0.226
Days s550N(s550 average+r),%
11 13 14 16 14
Days s550N0.200,%
21 33 27 21 23
Days total 438 557 465 1115 658
Days with s550observations
84 39 126 342 114
a Positive north scalar—northerly wind; positive east scalar—
easterly wind.
M. Shahgedanova, M. Lamakin / Science of the Total Environment 341 (2005) 133 –148144
and exhibit higher s550 values irrespective of pressurepatterns or temperature.
Results for the Dikson Island are different. The
highest cluster-average value of s550 is found in type
2, which represents depressions and frontal systems
and is characterized by strong southerly wind. To
evaluate the impact of transport direction on atmos-
pheric transparency, the 5-day isentropic back trajec-
tories starting at 850 mb surface over the Dikson
Island site have been calculated using the British
Atmospheric Data Centre (BADC)/ECMWF model
(available at http://badc.nerc.ac.uk/) for the 1979–
1990 period for all days when s550 values were
available. Trajectory analysis confirms that trajecto-
ries associated with type 2 are mostly from the
industrial areas located to the south or southwest of
the Dikson Island site (Fig. 5). In particular, s550values associated with trajectories passing over the
Norilsk non-ferrous smelters located in about 500 km
south of the Dikson Island site range between 0.20
and 0.30 in March–April. This is in agreement with
Raatz and Shaw (1984), who have demonstrated that a
strong meridional flow associated with frontal systems
is required for the transportation of air pollutants from
the regions of origin (the sub-Arctic and middle
latitudes) to the high Arctic. The above average s550values are associated with type 3, representing high-
pressure systems centered east of Dikson Island.
Strong southerly flow developing on the southwestern
periphery of the high is registered at the site (Table 6),
however, trajectories are both from the south and the
east, along the Arctic coast (Fig. 5). Two factors
contribute to low atmospheric transparency: (i) high
atmospheric stability and (ii) transportation of pol-
luted air either directly from the industrial areas
located to the south or from the eastern Kara–Laptev
sector, which experiences the highest concentrations
of aerosol in the Eurasian Arctic in spring. The lowest
s550 values occur in type 4, representing low-pressure
gradient fields with calm conditions and low temper-
atures. Air mass trajectories associated with this type
4 are mostly from the central Arctic Ocean. The low
s550 values associated with type 4 for the Dikson
Island site and type 1 for the Wrangel Island site (not
shown) confirm the conclusion by Raatz et al. (1985)
that the frozen Arctic Ocean is a source of clean
tropospheric air, and disprove the conclusion by
Vinogradova (2000) who argued that in spring the
high Arctic is sufficiently polluted to serve as a source
of pollution for the Arctic islands and the mainland.
Although there is a clear link between s550 and
synoptic types, the time series of frequencies of the
synoptic types provides little useful information with
regard to an explanation of AOD trends at both sites.
A strong increase in the number of low-pressure
systems (type 5) has been observed at Dikson Island
in March–April since 1970 with the positive trend
accounting for 34% of the variance in the time series
but this type is characterized by average aerosol load.
The number of low-pressure systems was higher
between 1984 and 1990 than at any other time since
record began in 1940 with the exception of 1964 and
1962. This result is in agreement with the conclusions
by Rogers and Mosley-Thompson (1995) and Masla-
nik et al. (1996). No similar increase has been
observed in the eastern part of the Russian Arctic.
Synoptic indices constructed for the Dikson Island
and the Wrangel Island stations for June–August
contain four types each (Tables 7 and 8). The
between-cluster differences in s550 are statistically
significant at 0.01 for the Dikson Island site and at
0.04 for the Wrangel Island site. At both sites, the
highest values of s550 are typical for the types
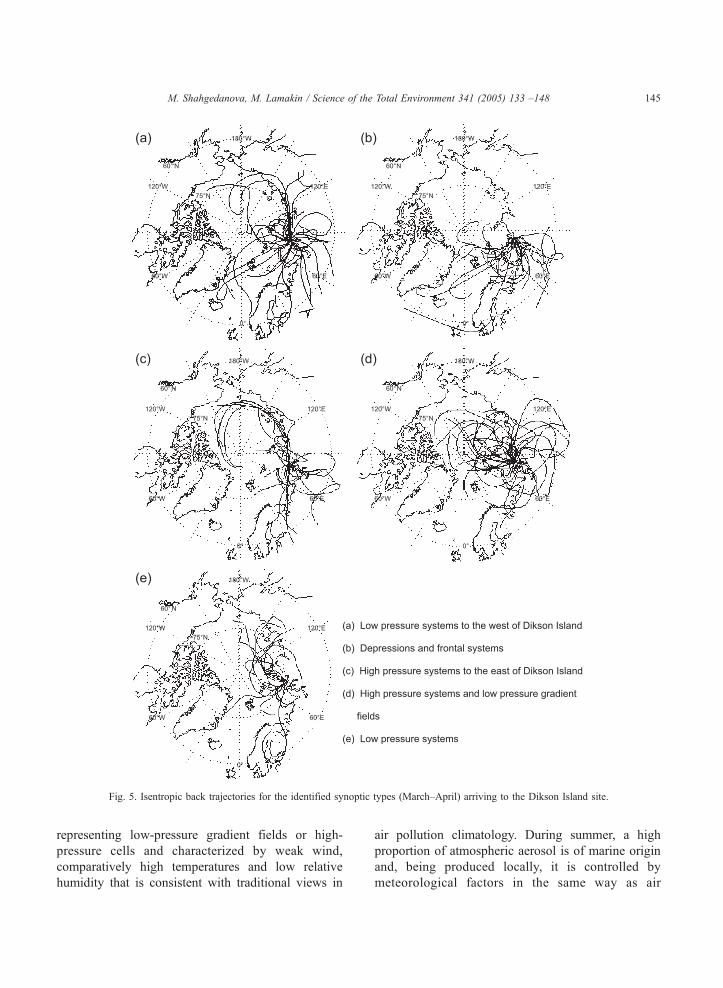
Fig. 5. Isentropic back trajectories for the identified synoptic types (March–April) arriving to the Dikson Island site.
M. Shahgedanova, M. Lamakin / Science of the Total Environment 341 (2005) 133 –148 145
representing low-pressure gradient fields or high-
pressure cells and characterized by weak wind,
comparatively high temperatures and low relative
humidity that is consistent with traditional views in
air pollution climatology. During summer, a high
proportion of atmospheric aerosol is of marine origin
and, being produced locally, it is controlled by
meteorological factors in the same way as air
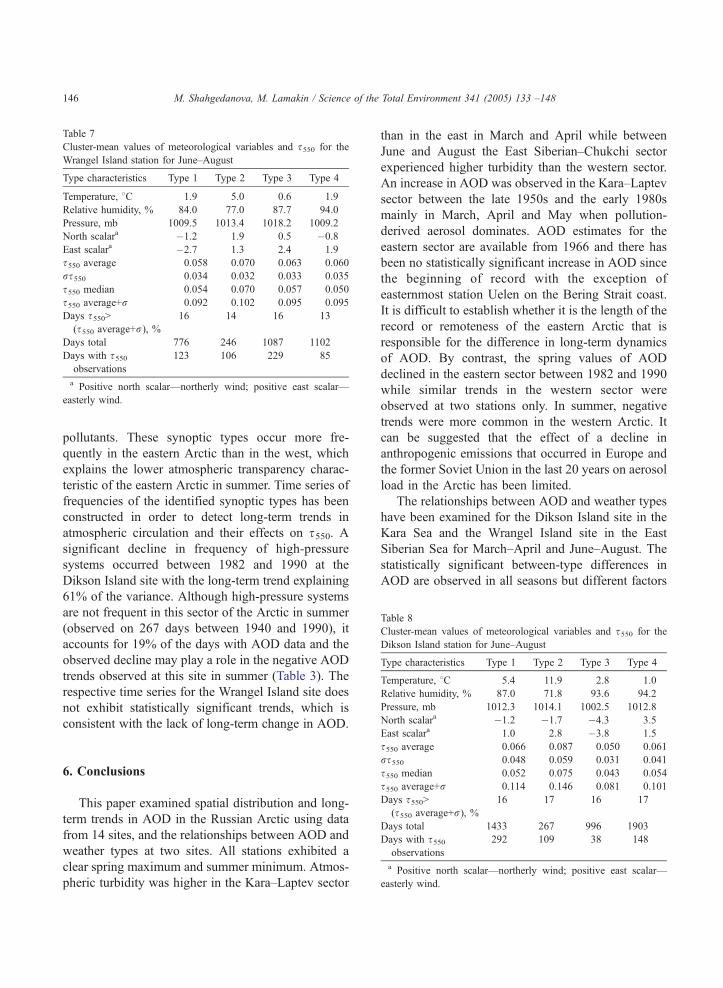
Table 7
Cluster-mean values of meteorological variables and s550 for the
Wrangel Island station for June–August
Type characteristics Type 1 Type 2 Type 3 Type 4
Temperature, 8C 1.9 5.0 0.6 1.9
Relative humidity, % 84.0 77.0 87.7 94.0
Pressure, mb 1009.5 1013.4 1018.2 1009.2
North scalara �1.2 1.9 0.5 �0.8
East scalara �2.7 1.3 2.4 1.9
s550 average 0.058 0.070 0.063 0.060
rs550 0.034 0.032 0.033 0.035
s550 median 0.054 0.070 0.057 0.050
s550 average+r 0.092 0.102 0.095 0.095
Days s550N(s550 average+r), %
16 14 16 13
Days total 776 246 1087 1102
Days with s550observations
123 106 229 85
a Positive north scalar—northerly wind; positive east scalar—
easterly wind.
Table 8
Cluster-mean values of meteorological variables and s550 for the
Dikson Island station for June–August
Type characteristics Type 1 Type 2 Type 3 Type 4
Temperature, 8C 5.4 11.9 2.8 1.0
Relative humidity, % 87.0 71.8 93.6 94.2
Pressure, mb 1012.3 1014.1 1002.5 1012.8
North scalara �1.2 �1.7 �4.3 3.5a
M. Shahgedanova, M. Lamakin / Science of the Total Environment 341 (2005) 133 –148146
pollutants. These synoptic types occur more fre-
quently in the eastern Arctic than in the west, which
explains the lower atmospheric transparency charac-
teristic of the eastern Arctic in summer. Time series of
frequencies of the identified synoptic types has been
constructed in order to detect long-term trends in
atmospheric circulation and their effects on s550. Asignificant decline in frequency of high-pressure
systems occurred between 1982 and 1990 at the
Dikson Island site with the long-term trend explaining
61% of the variance. Although high-pressure systems
are not frequent in this sector of the Arctic in summer
(observed on 267 days between 1940 and 1990), it
accounts for 19% of the days with AOD data and the
observed decline may play a role in the negative AOD
trends observed at this site in summer (Table 3). The
respective time series for the Wrangel Island site does
not exhibit statistically significant trends, which is
consistent with the lack of long-term change in AOD.
East scalar 1.0 2.8 �3.8 1.5s550 average 0.066 0.087 0.050 0.061
rs550 0.048 0.059 0.031 0.041
s550 median 0.052 0.075 0.043 0.054
s550 average+r 0.114 0.146 0.081 0.101
Days s550N(s550 average+r), %
16 17 16 17
Days total 1433 267 996 1903
Days with s550observations
292 109 38 148
a Positive north scalar—northerly wind; positive east scalar—
easterly wind.
6. Conclusions
This paper examined spatial distribution and long-
term trends in AOD in the Russian Arctic using data
from 14 sites, and the relationships between AOD and
weather types at two sites. All stations exhibited a
clear spring maximum and summer minimum. Atmos-
pheric turbidity was higher in the Kara–Laptev sector
than in the east in March and April while between
June and August the East Siberian–Chukchi sector
experienced higher turbidity than the western sector.
An increase in AOD was observed in the Kara–Laptev
sector between the late 1950s and the early 1980s
mainly in March, April and May when pollution-
derived aerosol dominates. AOD estimates for the
eastern sector are available from 1966 and there has
been no statistically significant increase in AOD since
the beginning of record with the exception of
easternmost station Uelen on the Bering Strait coast.
It is difficult to establish whether it is the length of the
record or remoteness of the eastern Arctic that is
responsible for the difference in long-term dynamics
of AOD. By contrast, the spring values of AOD
declined in the eastern sector between 1982 and 1990
while similar trends in the western sector were
observed at two stations only. In summer, negative
trends were more common in the western Arctic. It
can be suggested that the effect of a decline in
anthropogenic emissions that occurred in Europe and
the former Soviet Union in the last 20 years on aerosol
load in the Arctic has been limited.
The relationships between AOD and weather types
have been examined for the Dikson Island site in the
Kara Sea and the Wrangel Island site in the East
Siberian Sea for March–April and June–August. The
statistically significant between-type differences in
AOD are observed in all seasons but different factors
M. Shahgedanova, M. Lamakin / Science of the Total Environment 341 (2005) 133 –148 147
are responsible for the intraseasonal variability. The
directions of airflow and wind speed are the main
controls over AOD in spring. High atmospheric
transparency is associated with strong northerly and
westerly flows at the Wrangel Island site while strong
southerly flow associated with the passage of depres-
sions and frontal systems results in low atmospheric
transparency at the Dikson Island site. Trajectory
analysis has confirmed that the latter is due to the
contribution of industrial sources located in the sub-
Arctic and middle latitudes. In summer, low-pressure
gradient fields or high-pressure cells bring about
higher AOD values. A decline in frequency of this
weather type has occurred in the western Arctic in
summer and this might have contributed to the
negative trend in AOD, in addition to the decline in
anthropogenic pollution.
Acknowledgements
The authors wish to thank Dr. V.F. Radionov
(Institute of Arctic and Antarctic Research, St.
Petersburg, Russia) for providing the data and
Professor K.P. Shine (Department of Meteorology,
The University of Reading, UK) for useful discus-
sions. M. Lamakin has been supported by The
University of Reading Postgraduate Studentship for
Overseas Students.
References
Angstrom A. On the atmospheric transmission of sun radiation and
on dust in the air. Geograf Ann Deut 1929;11:156–66.
Angstrom A. Techniques of determining the turbidity of the
atmosphere. Tellus 1961;XIII(2):214–23.
Barrie LA. Arctic air chemistry: an overview. In: Stonehouse B,
editor. Arctic air pollution. Cambridge7 Cambridge University
Press; 1986a. p. 5–23.
Barrie LA. Arctic air pollution: an overview of current knowledge.
Atmos Environ 1986b;20:643–63.
Barrie LA, Hoff RM. The oxidation rate and residence time of
sulphur dioxide in the Arctic atmosphere. Atmos Environ 1984;
18(12):2711–22.
Bodhaine BA, Dutton EG. A long-term decrease in Arctic Haze at
Barrow, Alaska. Geophys Res Lett 1993;20(10):947–50.
Bodhaine BA, AndersonG, Carbaugh G, Dutton E, Halter B, Jackson
D, et al, 2002. In: King DB, Schnell RC, Rosson RM, Sweet C,
editors. Solar and thermal atmospheric radiation. CMDL Sum-
mary Report, vol. 26. Boulder, CO7 CMDL; 2002. p. 184.
Burova LP. Vlagooborot v atmosfere Arktiki. Leningrad7 Gidrome-
teoizdat; 1983. 128 pp., in Russian.
Burova LP. Sovremennye izmeneniya integralnogo vlagosoderzha-
niya atmosfery Arktiki. In: Voskresensky AI, editor. Monitoring
klimata arktiki. Leningrad7 Gidrometeoizdat; 1988. p. 69–87.
in Russian.
Craddock JM, Flood CR. Eigenvectors for representing the 500 mb
geopotential surface over the Northern Hemisphere. Q J Royal
Meteorol Soc 1969;95:570–93.
Cullather RI, Lynch AH. The annual cycle and interannual
variability of atmospheric pressure in the vicinity of the North
Pole. Int J Climatol 2003;23:1161–83.
Ellis HT, Pueschel RF. Solar radiation: absence of air pollution
trends at Mauna Loa. Science 1971;172:845–6.
Evnevich TV, Savikovsky IA. Raschet pryamoy solnechnoy
radiatzii i koeffitzient prozrachnozti atmosfery. Meteorol Gidrol
1989;5:106–9 [In Russian].
Herber A, Radionov VF, Leiterer U, Thomason LW, Dethloff K,
Viterbo P. Volcanic perturbation of the atmosphere in both
polar regions: 1991–1994. J Geophys Res 1996;101(D2):
3921–8.
Holben BN, Tantre D, Smirnov A, Eck TF, Slutsker I, Abuhassan N,
et al. An emerging ground-based aerosol climatology: aerosol
optical depth from AERONET. J Geophys Res 2001;
106(D11):12067–97.
IPCC. Climate Change 2001: The Scientific Basis. Cambridge7
Cambridge Universtity Press; 2001. 944 pp.
King MD, Kaufman Y, Tanre D, Nakajima T. Remote sensing of
tropospheric aerosols from space: past, present and future. Bull
Am Meteorol Soc 1999;80(11):2229–59.
Kotchenruther RA, Hobbs PV, Hegg DA. Humidification factors for
atmospheric aerosols off the mid-Atlantic coast of the United
States. J Geophys Res 2000;104(D):2239–51.
Lowenthal DH, Rahn KA. Regional sources of pollution aerosol at
Barrow, Alaska during winter 1979–80 as deduced from
elemental tracers. Atmos Environ 1985;19(12):2011–24.
Marshunova MS, Mishin AA. Monitoring prozrachnosti atmosfery
v polyarnykh oblastyakh. In: Voskresensky AI, editor.
Monitoring klimata arktiki. Leningrad7 Gidrometeoizdat;
1988. p. 132–40. In Russian.
Marshunova MS, Radionov VF. Izmeneniya integralnykh kharak-
teristik atmosfernoy prozrachnosti v polyarnykh rayonakh.
Meteorol Gidrol 1988;11:71–80 [In Russian].
Maslanik JA, Serreze MC, Barry RG. Recent decreases in Arctic
summer ice cover and linkages to atmospheric circulation
anomalies. Geophys Res Lett 1996;23:1677–80.
McCormick MP, Veiga RE. SAGE II measurements of early
Pinatubo aerosols. Geophys Res Lett 1992;19:155–8.
NASA. NASA GISS Stratospheric Aerosol and Gas Experiment II.
http://www.giss.nasa.gov/data/strataer/.
Nilsson ED, Paatero J, Boy M. Effects of air masses and synoptic
weather on aerosol formation in the continental boundary layer.
Tellus, Ser B Chem Phys Meteorol 2001;53(4):462–78.
Ottar B. The transfer of airborne pollutants to the Arctic region
(Europe, USSR). Atmos Environ 1981;15(8):1439–45.
Post JM, Grund CJ, Weickmann AM, Healy KR, Willis RJ.
Comparison of Mount Pinatubo and El Chichon volcanic
M. Shahgedanova, M. Lamakin / Science of the Total Environment 341 (2005) 133 –148148
events: lidar observations at 106 and 069 mkm. J Geophys Res
1996;101(D2):3929–40.
Raatz WE, Shaw GE. Long-range tropospheric transport of
pollution aerosols into the Alaskan Arctic. J Clim Appl
Meteorol 1984;23:1052–64.
Raatz WE, Schnell RC, Bodhaine BA. The distribution and transport
of pollution aerosols over the Norwegian Arctic on 31March and
4 April 1983. Atmos Environ 1985;19(12):2135–42.
Radionov VF, Marshunova MS, Rusina EN, Lubo-Lesnichenko KE,
Pimanova YE. Aerozolnaya mutnost atmosfery v polyarnykh
rayonakh. Izv Akad Nauk SSSR 1994;30(6):797–801 [In
Russian].
Radionov VF, Rusina EN, Lamakin MV, Leiterer U, Shalamyanskiy
AM. Eksperimentalye issledovaniya aerozolnoy opticheskoy
tolschiny i ozona vblizi bolshogo goroda. Izv Akad Nauk SSSR,
Fiz Atmos Okeana 1999;35(5):596–601 [In Russian].
Rahn KA, Lowenthal DH. Elemental tracers of distant regional
pollution aerosols. Science 1984;223:132–9.
Rogers JC, Mosley-Thompson E. Atlantic arctic wave cyclones and
the mild Siberian winters of the 1980s. Geophys Res Lett 1995;
22(7):799–802.
Sakunov GG, Barteneva OD, Timerev AA. Izmenchivost aerozolno-
opticheskikh kharakteristik atmosfery nad Arkticheskim bassey-
nom. In: Voskresensky AI, editor. Monitoring klimata arktiki.
Leningrad7 Gidrometeoizdat; 1988. p. 140–53. In Russian.
Schwartz SE, Arnold F, Blanchet JP, Durkee PA, Hofmann DJ,
Hoppel WA, et al. Group report: connections between aerosol
properties and forcing of climate. In: Heintzenberg RJCJ, editor.
Aerosol forcing of climate. New York7 John Wiley and Sons;
1995. p. 251–80.
Serreze MC, Rehder MC, Barry RG, Kahl JD. A climatological data
base of Arctic water vapor characteristics. Polar Geogr Geol
1994;18(1):63–75.
Serreze MC, Rehder MC, Barry RG, Kahl JD, Zaitseva N. The
distribution and transport of atmospheric water vapour over the
Arctic Basin. Int J Climatol 1995;15:709–27.
Shahgedanova M. Air pollution. In: Shahgedanova M, editor. The
physical geography of Northern Eurasia. Oxford University
Press; 2002a. p. 476–96.
Shahgedanova M. Climate at present and in the historical past. In:
Shahgedanova M, editor. The physical geography of Northern
Eurasia. Oxford7 Oxford University Press; 2002b. p. 70–102.
Shahgedanova M, Kuznetsov M. The Arctic environments. In:
Shahgedanova M, editor. The physical geography of Northern
Eurasia: Russia and neighbouring states. Oxford7 Oxford
University Press; 2002. p. 191–217.
Shao-Meng L, Barrie LA, Sirois A. Biogenic sulfur aerosol in the
Arctic troposphere: trends and seasonal variations. J Geophys
Res 1993;98(D11):20623–31.
Shaw GE. Atmospheric turbidity in the polar regions. J Appl
Meteorol 1982;21(8):1080–8.
Shaw GE. Aerosol measurements in central Alaska, 1982–1984.
Atmos Environ 1985;19(12):2025–31.
Shaw GE. The Arctic haze phenomenon. Bull Am Meteorol Soc
1995;76(12):2403–13.
Shaw GE, Khalil MAK. Arctic haze. In: Hutzinger O, editor. The
handbook of environmental chemistry. Berlin7 Springer-Verlag;
1989. p. 70–111.
Sivkov SI. Obobshenie empiricheskoi zavisimosti mezhdu solnech-
noi radiatsiei, vysotoi solntsa i prozrachnostiyu atmosphery.
Trudy GGO 1960;115:95–103 [In Russian].
Sivkov SI. Metody Rascheta Kharakteristik Solnechnoy Radiatzii.
Leningrad7 Gidrometeoizdat; 1968. 232 pp., In Russian.
Smirnov A, Royer A, O’Neill NT, Tarussov A. A study of the link
between synoptic air mass type and atmospheric optical
parameters. J Geophys Res 1994;99(D10):20967–82.
Smirnov A, McArthur B, O’Neill NT, Royer A, Tarussov A.
Aerosol optical depth over Canada and the link with synoptic air
mass types. J Geophys Res 1996;D14:19299–318.
Smirnov A, Holben BN, Dubovik O, O’Neil NT, Remer LA, Eck
TF, et al. Measurements of atmospheric optical parameters on
the US Atlantic coast sites, ships, and Bermuda during
TARFOX. J Geophys Res 2000;105(D):9887–901.
Stenchikov G, Robock A, Ramaswamy V, Schwarzkopf MD,
Hamilton K, Ramachandran S. Arctic Oscillation response to
the 1991 Mount Pinatubo eruption: effects of volcanic
aerosols and ozone depletion. J Geophys Res 2002;
107(D24) [art. no. 4803].
Tarasova TA, Yarkho YV. Opredelenie aerozolnoy opticheskoy
tolschiny atmosfery po nazemnym izmereniyam pryamoy
solnechnoy radiatzii. Meteorol Hydrol 1991;12:66–71 [In
Russian].
Thomason LW. Observations of a new SAGE II aerosol extinction
mode following the eruption of Mt Pinatubo. Geophys Res Lett
1992;19:2179–82.
Valero FPJ, Gore WJY, Weil ML, Ackerman TP. Measurements of
the absorption of solar radiation by aerosols and optical depths
in the Arctic atmosphere. EOS 1986;67.
Vinogradova AA. Anthropogenic pollutants in the Russian Arctic
atmosphere: sources and sinks in spring and summer. Atmos
Environ 2000;34:5151–60.
Walsh JE, Chapman WL, Shy L. Recent decrease of sea level
pressure in the central Arctic. J Clim 1996;9:480–5.
Wilks DS. Statistical methods in the atmospheric sciences. London7
Academic Press; 1995. 469 pp.
WMO. Guide to Meteorological Instrument and Observing
Practices. Geneva7 World Meteorological Organization; 1971.
Yarnal B. Synoptic climatology in environmental analysis. London7
Belhaven Press; 1993. 202 pp.