trends for fiscal year 2012 · bend county, and montgomery county appraisal districts in april 2011...
TRANSCRIPT

Office of the City Controller
Houston, Texas
Trends for Fiscal Year 2012
Houston, Texas
May 2011
Ronald C. Green
City Controller
1

TrendsFiscal Year 2012
The information on the following pages was compiled by the Controller’s Office
Fiscal Year 2012
The information on the following pages was compiled by the Controller s Officewith the goal of assisting City Council in putting the Administration’s FY12Proposed Budget into historical perspective. The trends presented here givecouncil members a broader picture and, hopefully, will help in the budgetdecision-making process.
Our estimates for General Fund revenues for Fiscal Year 2011 are expected topremain flat from Fiscal Year 2010 revenues. However, Fiscal Year 2012 revenuesare anticipated to decline approximately 2.78% (not including transfers and sale ofassets). Fiscal Year 2012’s projected revenue reflect mostly a decline inIntergovernmental Revenue because of the METRO revenue being allocated tothe Dedicated Drainage and Street Renewal Fund instead of the General Fund.
Of concern, our FY12 projection for General Fund resources is $28 million lessthan the Administration’s FY12 Proposed Budget. To calculate Property Taxrevenue, the Controller’s office used an estimated taxable value of $140.557billion calculated by taking the estimated taxable values from Harris County, FortBend County, and Montgomery County Appraisal Districts in April 2011 andadjusting that value based on the County Appraisal District’s prior overstatementof estimation last year and a 96.8% collection rate. The Administration’sof estimation last year and a 96.8% collection rate. The Administration sprojection returned a value of $141.997 billion using 96.9% collection rate. Forour Sales Tax projection, we assumed growth of 3.44%.
We need to point out that although the 2012 Proposed Budget for the GeneralFund does not anticipate any reductions to fund balance, it does not addressrestoring the fund balance to the preferred level of 7.5%. If our revenueg pprojections occur, the fund balance will be only $62 million, or $57 million lessthan the target fund balance.
In the Enterprise Funds, Aviation revenues are decreasing slightly due to lowerinterest revenue rates. Convention & Entertainment revenues are projected toremain relatively flat. The Combined Utility System’s (CUS) revenues arei i b 19 8% i il d h l d i
1
increasing by 19.8%, primarily due to the annual water and sewer rate increase.
Summary of Graphsy p
The numbers on each page are from the following sources:
1 FY10 d i l l d1. FY10 and prior years are actual results as reported in previous Comprehensive Annual Financial Reports (CAFR).
2. FY11 numbers are the Controller’s Office April pMonthly Financial Operations Report (MFOR) estimates.
3. The FY12 General Fund revenues are the most current projections of the Controller’s Officecurrent projections of the Controller s Office.
4. Unless otherwise noted, all other FY12 numbers
are from the Administration’s FY12 Proposed
Budget.Budget.
2

General Fund Revenues
(amounts expressed in thousands)(amounts expressed in thousands)
FY03 FY04 FY05 FY06 FY07 FY08 FY09 FY10 FY11 FY12 Admin.'s
Controller's Controller's Proposed
Revenues Actual Actual Actual Actual Actual Actual Actual Actual Apr. Projection Projection % Change [a] Budget Difference [a]Property Tax 646,377$ 660,999$ 671,294$ 705,952$ 748,792$ 830,889$ 890,088$ 892,865$ 849,382$ 832,512$ -1.99% [b] 842,478$ (9,966)p y [ ] ( )Industrial Assessments 15,014 15,167 14,635 14,314 15,823 17,787 19,133 15,817 14,800 14,800 0.00% 14,800 - Sales Tax 322,538 347,982 370,583 422,598 461,417 495,173 507,103 468,965 489,600 506,442 3.44% [c] 518,912 (12,470)
Other Taxes 7,817 8,348 8,613 9,279 9,992 10,735 10,813 10,577 10,250 10,760 4.98% 10,806 (46)Electric Franchise 76,605 76,394 77,760 97,274 99,534 98,141 99,612 97,248 98,151 99,694 1.57% 99,694 - Telephone Franchise 56,435 52,926 49,714 50,167 50,434 49,566 48,229 48,263 46,150 44,483 -3.61% 44,483 -
Gas Franchise 14,693 16,535 18,520 21,866 20,790 21,507 21,258 21,729 21,890 22,009 0.54% 22,009 - Other Franchise 12,941 15,524 16,269 17,200 18,793 20,981 21,223 23,628 23,365 23,437 0.31% 24,044 (607)Licenses & Permits 15,335 15,271 17,692 18,086 18,637 20,889 17,511 18,636 18,500 17,896 -3.26% 19,741 (1,845)
Intergovernmental 15,385 11,176 18,958 26,989 41,576 32,950 33,027 32,148 59,719 11,161 -81.31% [d] 11,161 - Charges for Services 37,422 39,875 39,856 41,115 44,844 39,836 35,743 34,156 36,195 38,734 7.01% 40,747 (2,013)g , , , , , , , , , , , ( , )Direct Interfund Services 62,099 57,056 61,233 39,497 42,052 41,395 47,890 46,906 45,271 45,255 -0.04% 45,255 -
Indirect Interfund Services 15,859 14,647 11,031 14,895 12,712 10,950 13,190 16,012 16,110 18,522 14.97% 18,522 - Muni Courts Fines 42,433 45,005 48,827 45,319 44,936 37,140 37,692 38,096 36,379 35,000 -3.79% 35,894 (894)Other Fines 2,185 2,131 2,424 3,681 5,362 4,491 2,692 2,029 2,297 2,297 0.00% 2,562 (265)Interest 6,893 5,130 6,414 8,600 15,059 16,992 8,826 6,858 5,385 4,500 -16.43% 3,000 1,500
Misc/Other 11,057 16,046 16,253 17,016 4,529 12,315 10,276 8,215 9,189 5,555 -39.55% [e] 6,740 (1,185)Total 1,361,088$ 1,400,212$ 1,450,076$ 1,553,848$ 1,655,282$ 1,761,737$ 1,824,306$ 1,782,148$ 1,782,633$ 1,733,057$ -2.78% 1,760,848$ (27,791)$
Transfers from Other Funds 49,440 1,028 4,542 11,219 35,810 38,658 30,392 38,758 27.53% 38,758 - Sale of Capital Assets 6,439 4,757 4,003 4,798 6,548 8,027 10,655 32.74% [f] 13,550 (2,895)
[a] The “Percentage Change” column compares our FY12 projection to our FY11 estimate, while the “Difference”column compares our FY12 projection to the proposed budget
p , , , , , , , [ ] , ( , )Proceeds from Promissory Note 3,922 - - - - - - - - - Disaster Recovery Fund Transfer 6,800 0 - - - - - - - - - Pension Bond Proceeds 48,599 59,000 63,000 35,000 20,000 20,000 - - - - -
Total Revenues and Transfers 1,410,528$ 1,407,012$ 1,499,703$ 1,623,209$ 1,727,581$ 1,811,959$ 1,884,914$ 1,847,354$ 1,821,052$ 1,782,470$ -3.51% 1,813,156$ (30,686)$
column compares our FY12 projection to the proposed budget.
[b] Property Tax revenue is net of refunds and Tax Increment Reinvestment Zone (TIRZ) payments. The Controller’sFY12 projection for Property Tax revenues is based on the taxable values provided by Harris County on April 28,2011. This amount was reduced an additional 1% to reflect the rate of overstatement of the prior years taxablevalues. The projection assumes an estimated $23 million in delinquent collections and an estimated $60 million inTIRZ payments.
[c] Sales Tax revenue uses our FY11 Sales Tax revenue estimate plus Dr Barton Smith’s April 2011 estimated growth[c] Sales Tax revenue uses our FY11 Sales Tax revenue estimate plus Dr. Barton Smith s April 2011 estimated growthrate of 5.44% for FY12. This is then reduced by Dr. Barton Smith’s margin of error of 2%.
[d] METRO funding revenues will be recognized in the Dedicated Drainage and Street Renewal Fund instead of theGeneral Fund.
[e Miscellaneous other revenue in FY12 is lower mainly due to prior year revenue adjustments in FY11 that will not beforthcoming in FY12.
[f] Due to the uncertainty that these sales will take place and the value to be received the Controller’s office anticipates
3
[f] Due to the uncertainty that these sales will take place, and the value to be received, the Controller s office anticipatesthat only about three fourths of the Administration’s budgeted amount of these capital assets will be received.

General Fund Revenues
(amounts expressed in millions)
4 00%
6.00%
8.00%
$1,700
$1,750
$1,800
$1,850
$1,900
Total Revenues
Percent Change (Last FY)
0.00%
2.00%
4.00%
$1,400
$1,450
$1,500
$1,550
$1,600
$1,650 (Last FY)
-4.00%
-2.00%
$1,200
$1,250
$1,300
$1,350
,
FY03 FY04 FY05 FY06 FY07 FY08 FY09 FY10 FY11 FY12
FY12 General Fund revenue is projected to shrink by $50 million, or 2.78%, underour current FY11 estimate. The projected decrease consists mostly of reducedMETRO funding revenue that will be recognized in the Dedicated Drainage andStreet Renewal Fund. We are also projecting a decrease of $16.9 million in PropertyTax, which is offset by an increase of $16.8 million in Sales Tax.
4
, y $

Property Tax Revenue
(amounts expressed in thousands)
6 00%
8.00%
10.00%
12.00%
$800 000
$850,000
$900,000
$950,000 Property Tax Revenue
Percent Change (Last FY)
0.00%
2.00%
4.00%
6.00%
$650,000
$700,000
$750,000
$800,000 (Last FY)
-6.00%
-4.00%
-2.00%
$500,000
$550,000
$600,000
FY03 FY04 FY05 FY06 FY07 FY08 FY09 FY10 FY11 FY12
Property Tax revenue is projected to be lower than the FY11 estimate by 1.99%.TIRZ payments, delinquent tax collections and rebates are expected to remain stableas compared to FY11. Our Property Tax revenue projection is based on a tax rateof 63.875 cents per $100 valuation and a collection rate of 96.8%.
5

Taxable Values Historical & Forecast
(amounts expressed in billions)
8 00%
10.00%
12.00%
14.00%
$140
$150
$160
Property Tax Value, Historical & Projection
Percent Change
0.00%
2.00%
4.00%
6.00%
8.00%
$110
$120
$130
(Last FY)
-6.00%
-4.00%
-2.00%
$80
$90
$100
FY03 FY04 FY05 FY06 FY07 FY08 FY09 FY10 FY11 FY12
The Harris County, Fort Bend County, and Montgomery County Appraisal Districts(the Districts) provide expected taxable values. The actual taxable values for FY11are above the preliminary value estimates provided at this time last year. However,based on the Districts’ projection for FY12, a decrease in valuation of about 0.7% isanticipated. These values are based on the Districts’ preliminary projected values,
6
dated April 28, 2011, and reduced 1% to reflect the over projection of the prior year.

Taxable Values By Property TypeHistorical & Forecast
(amounts expressed in billions)
$61
$71
$81
Residential
Commercial
Other
$31
$41
$51 Other
$1
$11
$21
FY03 FY04 FY05 FY06 FY07 FY08 FY09 FY10 FY11 FY12FY03 FY04 FY05 FY06 FY07 FY08 FY09 FY10 FY11 FY12
Residential and commercial properties in the City of Houston make up 96% of the taxable values reported by the Districts.
7

Sales Taxes Revenue
(amounts expressed in thousands)
10 00%
15.00%
20.00%
$450,000
$500,000
$550,000
Sales Tax Revenues
Percent Change (Last FY)
0.00%
5.00%
10.00%
$300 000
$350,000
$400,000
-10.00%
-5.00%
$200,000
$250,000
$300,000
FY03 FY04 FY05 FY06 FY07 FY08 FY09 FY10 FY11 FY12
Sales tax revenue is projected to be 3.44% higher than FY11 Sales Taxreceipts. This increase is based on the 5.44% estimated growth of Dr. BartonSmith’s April report plus an error rate reduction of 2%.
8

Property Tax Rate
(Tax Rate per $100 Valuation)
0.500
0.550
0.600
0.650
0.700
0.250
0.300
0.350
0.400
0.450
FY03 FY04 FY05 FY06 FY07 FY08 FY09 FY10 FY11 FY12
Debt Service 0.18041 0.16048 0.18427 0.18391 0.18573 0.18178 0.18306 0.18147 0.17539 0.17539
M&O 0.47459 0.49452 0.46573 0.46359 0.45927 0.46198 0.45569 0.45728 0.46336 0.46336
Total 0 65500 0 65500 0 65000 0 64750 0 64500 0 64375 0 63875 0 63875 0 63875 0 63875
0.100
0.150
0.200
Total 0.65500 0.65500 0.65000 0.64750 0.64500 0.64375 0.63875 0.63875 0.63875 0.63875
The FY12 number is a projection. The final rate will be established by a vote ofcouncil in the second quarter of FY12.
9

Total Franchise Revenues
(amounts expressed in thousands)
15%
20%
$180,000
$185,000
$190,000
$195,000 Total Franchise Revenue
Percentage Change
0%
5%
10%
$160,000
$165,000
$170,000
$175,000
$180,000
-10%
-5%
$145,000
$150,000
$155,000
FY03 FY04 FY05 FY06 FY07 FY08 FY09 FY10 FY11 FY12
Franchise revenues are projected to remain relatively stable from FY11. For thep j yseventh year in a row, Telephone Franchise Revenues are expected to decrease.The decrease in Telephone Franchise revenues is projected to be offset by asimilar increase in Electricity Franchise Revenues.
10

Municipal Courts Revenues
(amounts expressed in thousands)
15.00%
20.00%
25.00%
$45,000
$50,000
$55,000
Municipal Courts
Percent Change (Last FY)
-5.00%
0.00%
5.00%
10.00%
$35,000
$40,000
(Last FY)
-20.00%
-15.00%
-10.00%
$20,000
$25,000
$30,000
FY03 FY04 FY05 FY06 FY07 FY08 FY09 FY10 FY11 FY12
Municipal Courts Fines and Forfeits is 3.79% lower than FY11. This number takesinto account uncertainty with the new collection processes.
11
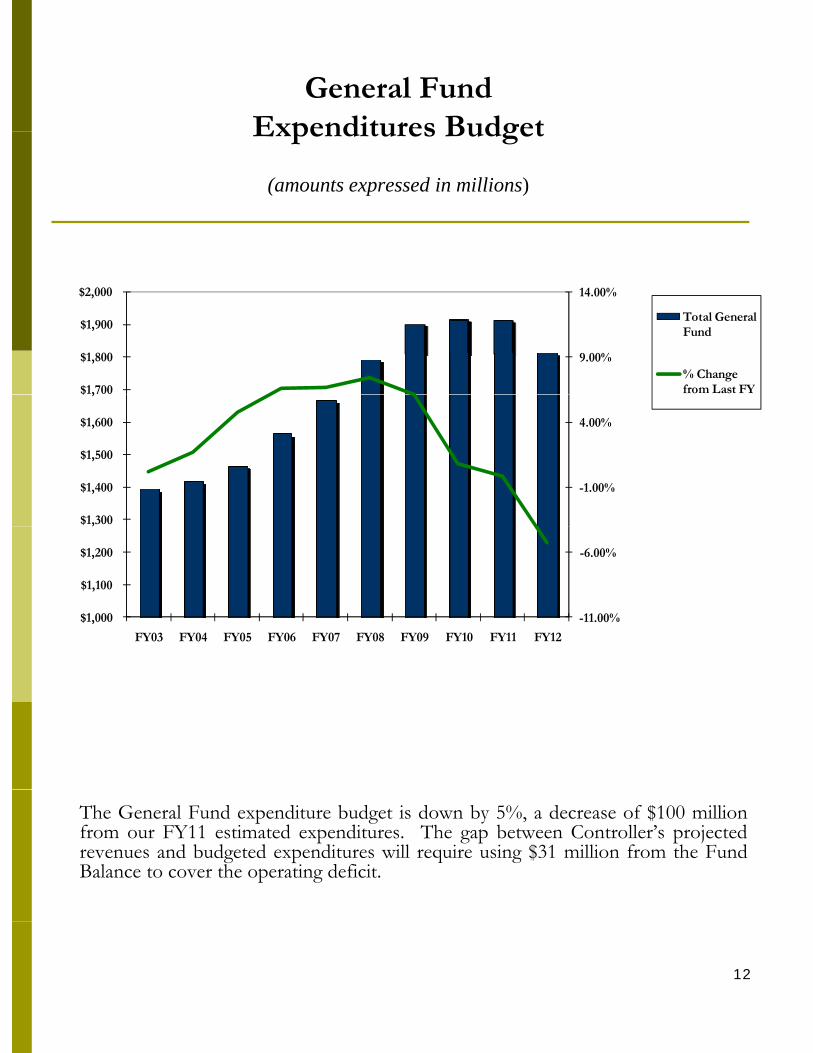
General FundExpenditures BudgetExpenditures Budget
(amounts expressed in millions)
9.00%
14.00%
$1,700
$1,800
$1,900
$2,000
Total General Fund
% Change from Last FY
-1.00%
4.00%
$1,300
$1,400
$1,500
$1,600
$ ,
-11.00%
-6.00%
$1,000
$1,100
$1,200
,
FY03 FY04 FY05 FY06 FY07 FY08 FY09 FY10 FY11 FY12
The General Fund expenditure budget is down by 5%, a decrease of $100 millionfrom our FY11 estimated expenditures. The gap between Controller’s projectedrevenues and budgeted expenditures will require using $31 million from the FundBalance to cover the operating deficit.
12
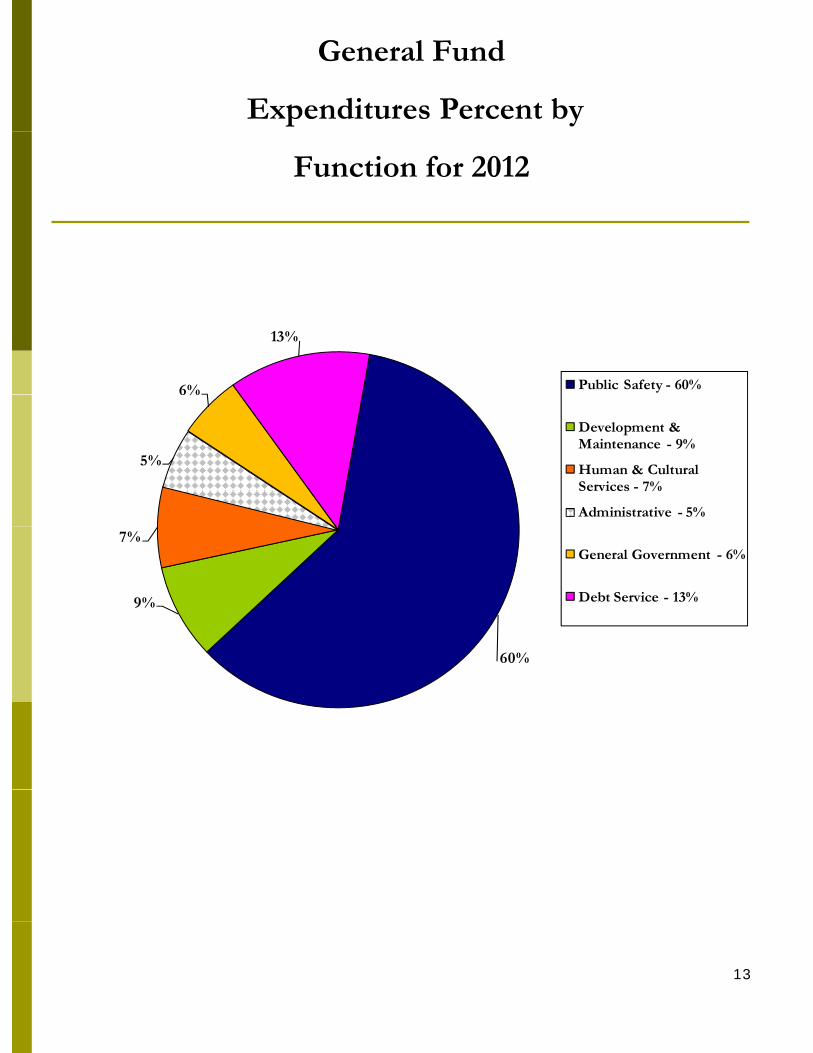
General Fund
Expenditures Percent by
Function for 2012
6%
13%
Public Safety - 60%
5%
6%
Development & Maintenance - 9%
Human & Cultural Services - 7%
Administrative - 5%
60%
9%
7%General Government - 6%
Debt Service - 13%
60%
13

Cash vs. Fund BalanceGeneral Fund
(amounts expressed in thousands)
$250,000
$300,000
Ending Cash Balance
Undesignated Fund Balance
$100,000
$150,000
$200,000
$-
$50,000
FY03 FY04 FY05 FY06 FY07 FY08 FY09 FY10 FY11 FY12
The Undesignated Fund Balance consists of both cash and non-cash items andincludes receivables for Sales Tax and Franchise Fees. It also includes $20 millionfrom the Rainy Day Fund which became Undesignated within the General Fund inFY11. The Undesignated Fund Balance is expected to decrease by $72 million inFY11 and $31 million in FY12.
14

City Ordinance 5% Fund Balance Requirement
General Fund(amounts shown in Millions)
$220
$2705% Fund Balance Requirement
Fund Balance
7.5% Preferred
$120
$170
Fund Balance
$20
$70
FY02 FY03 FY04 FY05 FY06 FY07 FY08 FY09 FY10 FY11 FY12
City ordinance requires an Undesignated Reserve of 5% of the Adopted Budget less Debt Service. An Undesignated Reserve of 7.5% is preferred. For FY12 we project a $57 million deficit under the 7.5% Fund Balance. This is due to a difference in revenue of $28 million and Fund Balance difference of $29 million.
15

Aviation Revenues& Expenses& Expenses
(amounts expressed in millions)
$450
$500
$550
Revenues
Total Expenses
$250
$300
$350
$400 p
$100
$150
$200
$250
FY06 FY07 FY08 FY09 FY10 FY11 FY12FY06 FY07 FY08 FY09 FY10 FY11 FY12
Aviation is projecting revenues to increase slightly due to additional operatingrevenues. Projected increases in expenses are based on anticipated increasedspending for Debt Service.
16

Aviation Revenues
(amounts expressed in millions)
$400
$450
$500 Non Operating Revenue
Operating Revenue
2 0
$300
$350
$150
$200
$250
FY06 FY07 FY08 FY09 FY10 FY11 FY12
FY12 revenues are expected to increase 2.85%, or $2.7 million from the FY11estimate, primarily related to a budgeted increase in Landing Fees, Terminal Rentals,and Retail Concessions.
17

Aviation Expenses
(amounts expressed in millions)
$350
$400
Debt Service
Expenses
$200
$250
$300
$100
$150
FY06 FY07 FY08 FY09 FY10 FY11 FY12
Aviation expects an FY12 expense increase of approximately 6.8%, or $23.9 millionover the FY11 estimate. The FY12 Debt Service budget is increasing due to otherfunding sources used in FY11 that are not available for FY12.
18

Convention & Entertainment Revenues & Expensesp
(amounts expressed in millions)
$90
$100 Revenues
Expenses
$60
$70
$80
$40
$50
FY06 FY07 FY08 FY09 FY10 FY11 FY12
Convention & Entertainment projects that FY12 total expenses will exceed revenuesConvention & Entertainment projects that FY12 total expenses will exceed revenuesby $10.7 million, which is primarily attributable to the department’s “pay-as-you-go”funding philosophy for capital and non-recurring projects. Such FY12 projectsinclude facility upgrades and major maintenance projects. The operating deficit isfunded by a fund balance that retained the balance of record HOT revenues in FY08and FY09 in anticipation of the need for these projects.
19
p p j

Convention & EntertainmentRevenuesRevenues
(amounts expressed in millions)
$70
$80
$90
$100
Non-Operating Revenue
Operating Revenue
$30
$40
$50
$60
$-
$10
$20
FY06 FY07 FY08 FY09 FY10 FY11 FY12
Convention & Entertainment total revenues are primarily generated from HOTConvention & Entertainment total revenues are primarily generated from HOTtaxes reported as Non-Operating revenues, followed by parking fees and facilityrentals with related concession revenues reported as Operating revenues. Non-Operating and Operating revenues are projected to increase 4.28% in FY12 whencompared to estimated FY11 revenues.
20

Convention & Entertainment Expenses
(amounts expressed in millions)
$80
$90
$100
Debt Service
Expenses
$50
$60
$70
$30
$40
$50
FY06 FY07 FY08 FY09 FY10 FY11 FY12
Convention & Entertainment is projecting an increase in expenses due to thedepartment’s “pay-as-you-go” funding philosophy for capital and non-recurringprojects. Such FY12 projects include facility upgrades and major maintenanceprojects. Debt service is relatively flat.
21
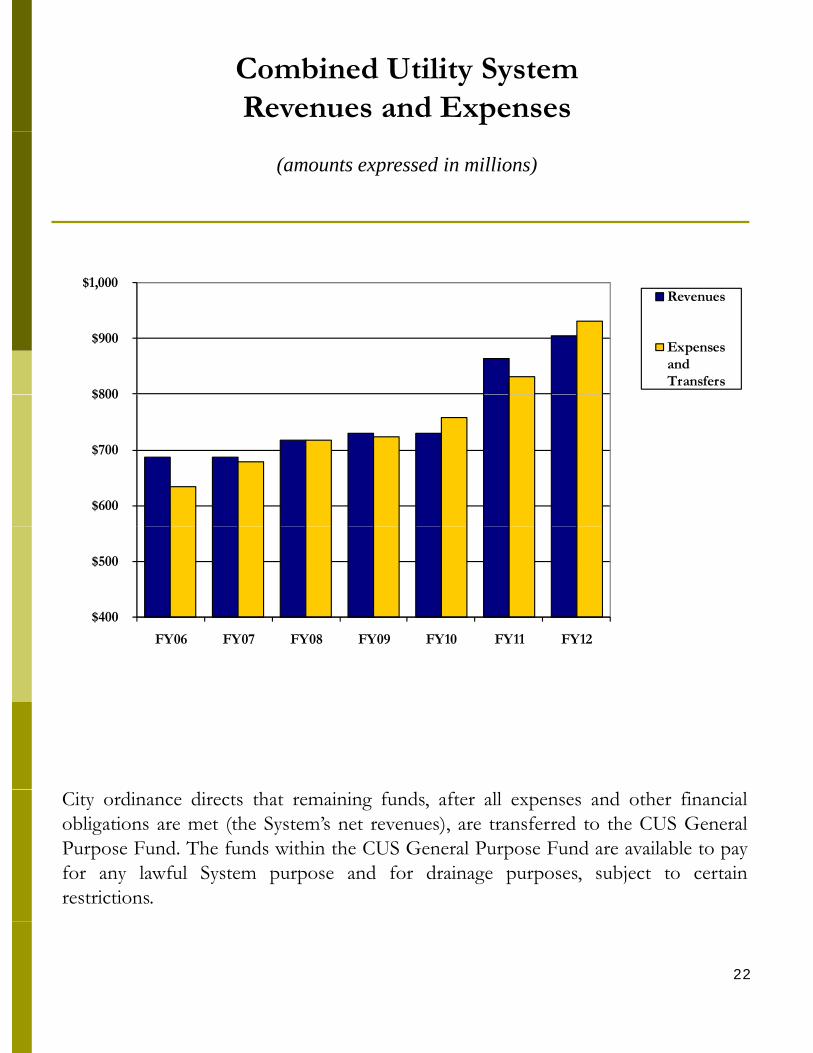
Combined Utility System Revenues and Expenses
(amounts expressed in millions)
$800
$900
$1,000 Revenues
Expenses and Transfers
$600
$700
$800
$400
$500
FY06 FY07 FY08 FY09 FY10 FY11 FY12
City ordinance directs that remaining funds, after all expenses and other financialobligations are met (the System’s net revenues), are transferred to the CUS GeneralPurpose Fund. The funds within the CUS General Purpose Fund are available to payfor any lawful System purpose and for drainage purposes, subject to certainrestrictions.
22

Combined Utility System Revenue
(amounts expressed in millions)
$800
$850
$900
$950 Non Operating Revenue
Operating Revenue
$650
$700
$750
$800
$500
$550
$600
FY06 FY07 FY08 FY09 FY10 FY11 FY12
Operating Revenues for the Combined Utility System are projected to increase yearOperating Revenues for the Combined Utility System are projected to increase year-over-year due in part to an annual rate adjustment equal to the previous calendaryear's Consumer Price Index for the area including Houston, Galveston andBrazoria Counties. The rate adjustments for Fiscal Years 2008, 2009, 2010, and2011 are 2.8%, 5.1%, 0.3%, and 1.9% respectively.
23

Combined Utility System Operating Expenses by Categoryp y g y
(amounts expressed in millions)
$800,000
$900,000
$1,000,000Operating Transfers
Expenses
$400,000
$500,000
$600,000
$700,000
$100,000
$200,000
$300,000
$ ,
FY06 FY07 FY08 FY09 FY10 FY11 FY12
The CUS Operating and Maintenance expenses reflect changes to Energy ExpenseComponents, Employment expenses, additional resources to accommodate newcustomers or additional regulatory compliance. Operating Transfers include theSystem's debt service payment obligations as well as the drainage expense and debtservice funding obligations. These numbers are the Administration's projections, notnumbers generated by the Controller's Office
24
numbers generated by the Controller s Office.