trends and scenarios for food security
TRANSCRIPT
Trends & Scenarios for Food Security
Mark W. Rosegrant, IFPRI#IFPRI40 November 18, 2015
0
0.5
1
1.5
2
2.5
1975 1985 1995 2005 2015 2025 2035 20450%
20%
40%
60%
80%
100%
1975 1985 1995 2005 2015 2025 2035 2045
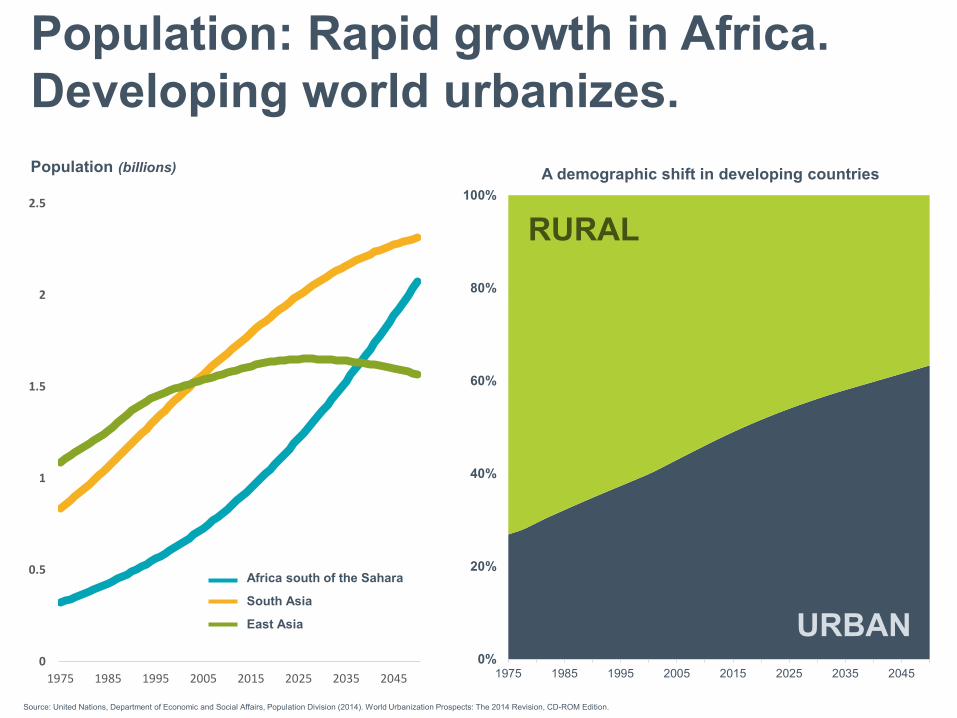
Population: Rapid growth in Africa. Developing world urbanizes.Population (billions)
RURAL
URBAN
A demographic shift in developing countries
Africa south of the Sahara
South Asia
East Asia
Source: United Nations, Department of Economic and Social Affairs, Population Division (2014). World Urbanization Prospects: The 2014 Revision, CD-ROM Edition.
-
200
400
600
800
1,000
1,200
Africa south of the SaharaSouth AsiaDeveloping Countries
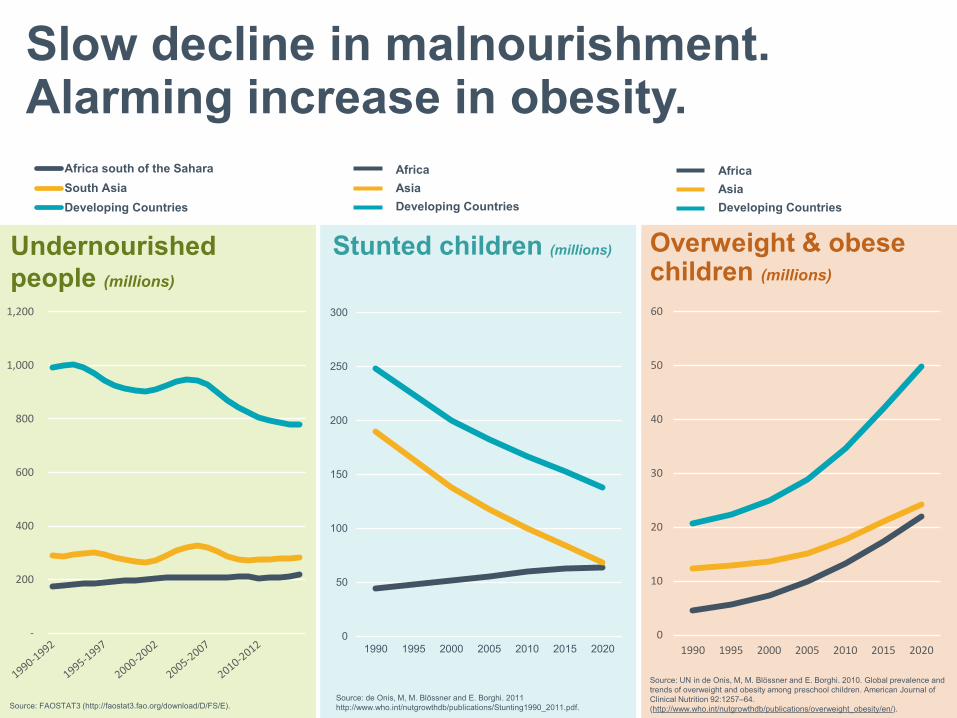
Slow decline in malnourishment.Alarming increase in obesity.
Stunted children (millions)
0
10
20
30
40
50
60
1990 1995 2000 2005 2010 2015 2020
Overweight & obese children (millions)
Source: FAOSTAT3 (http://faostat3.fao.org/download/D/FS/E).
Source: UN in de Onis, M, M. Blössner and E. Borghi. 2010. Global prevalence and trends of overweight and obesity among preschool children. American Journal of Clinical Nutrition 92:1257–64. (http://www.who.int/nutgrowthdb/publications/overweight_obesity/en/).
Undernourished people (millions)
0
50
100
150
200
250
300
1990 1995 2000 2005 2010 2015 2020
Source: de Onis, M, M. Blössner and E. Borghi. 2011 http://www.who.int/nutgrowthdb/publications/Stunting1990_2011.pdf.
AfricaAsiaDeveloping Countries
AfricaAsiaDeveloping Countries
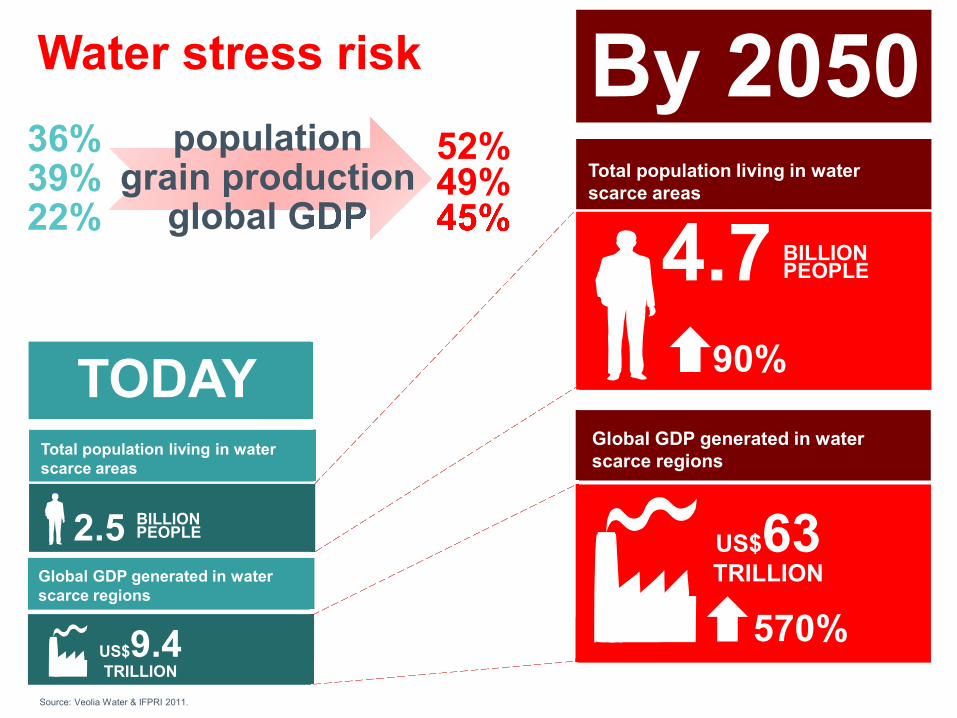
36%39%22%
2.5
US$9.4TRILLION
Source: Veolia Water & IFPRI 2011.
Water stress risk
BILLION PEOPLE
TODAYTotal population living in waterscarce areas
Global GDP generated in water scarce regions
52%49% 45%
US$63TRILLION
Total population living in waterscarce areas
4.7 BILLION PEOPLE
90%
570%
By 2050
Global GDP generated in water scarce regions
populationgrain production
global GDP
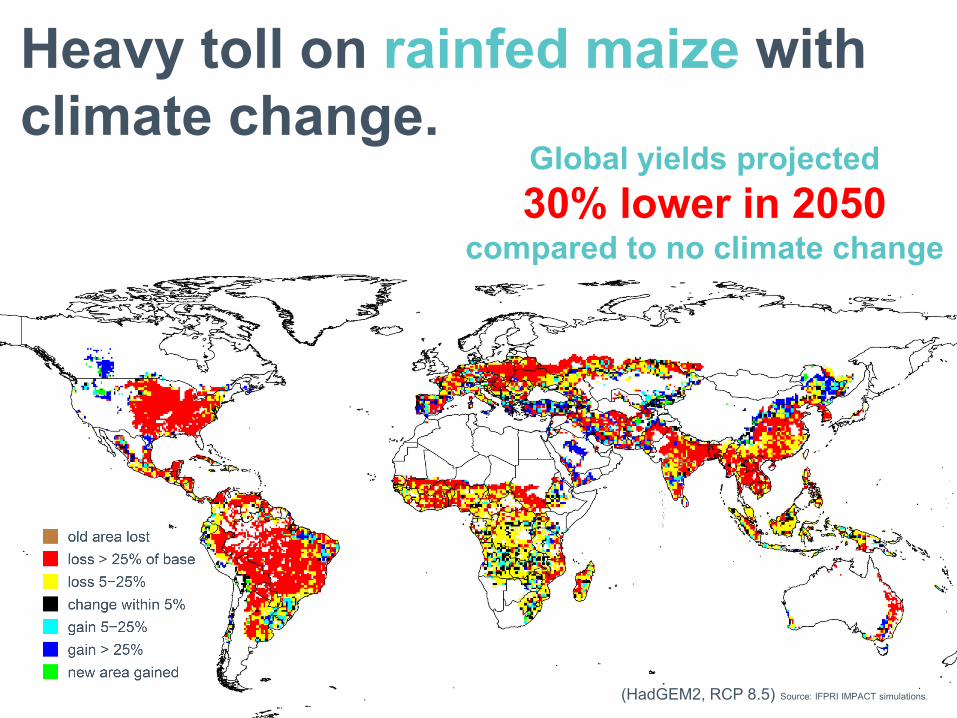
Global yields projected 30% lower in 2050
compared to no climate change
Source: IFPRI IMPACT simulations.
Heavy toll on rainfed maize with climate change.
(HadGEM2, RCP 8.5)
0.9
1.0
1.1
1.2
1.3
1.4
1.5
1.6
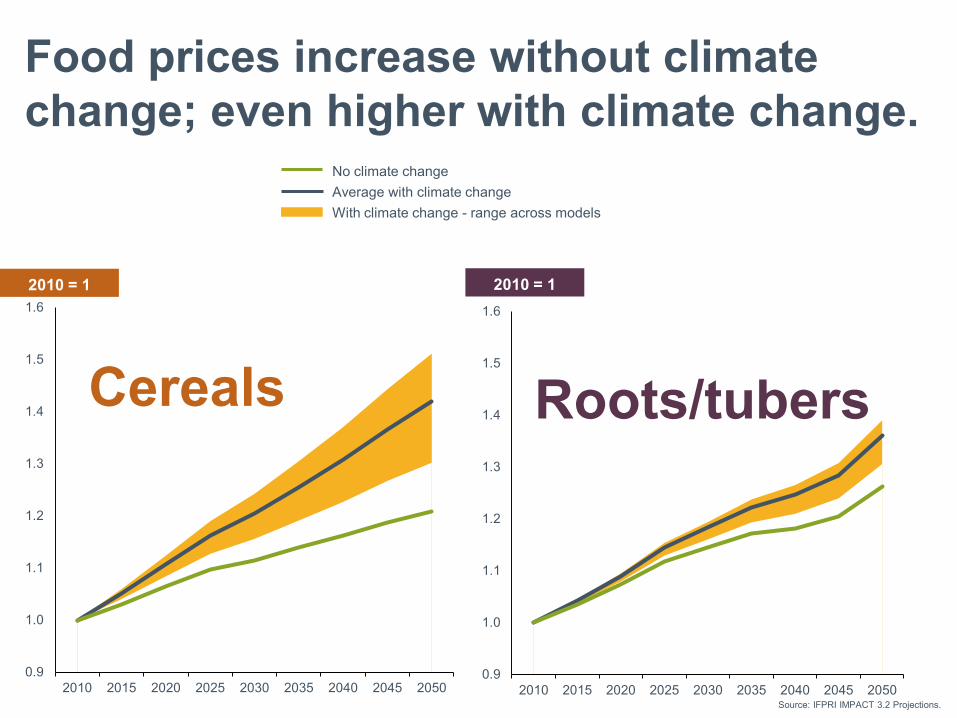
2010 2015 2020 2025 2030 2035 2040 2045 2050Source: IFPRI IMPACT 3.2 Projections.
Food prices increase without climate change; even higher with climate change.
No climate changeAverage with climate changeWith climate change - range across models
(Indexed to 1 in 2010)
0.9
1.0
1.1
1.2
1.3
1.4
1.5
1.6
2010 2015 2020 2025 2030 2035 2040 2045 2050
Cereals Roots/tubers
2010 = 1 2010 = 1
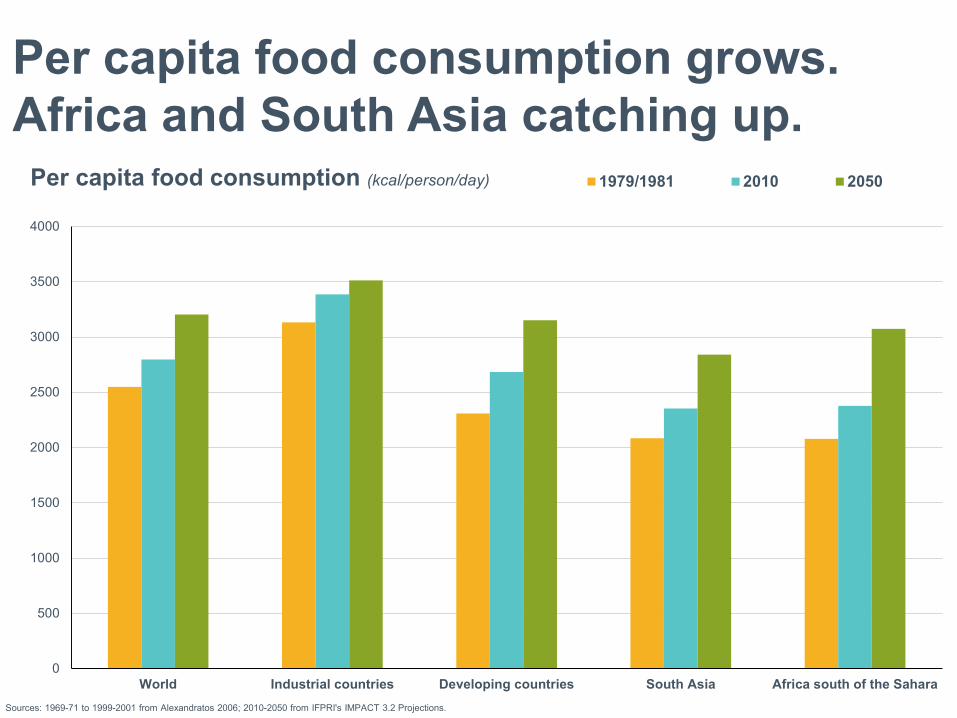
Sources: 1969-71 to 1999-2001 from Alexandratos 2006; 2010-2050 from IFPRI's IMPACT 3.2 Projections.
Per capita food consumption grows.Africa and South Asia catching up.
0
500
1000
1500
2000
2500
3000
3500
4000
World Industrial countries Developing countries South Asia Africa south of the Sahara
Per capita food consumption (kcal/person/day) 1979/1981 2010 2050
0
100
200
300
400
500
600
700
800
900
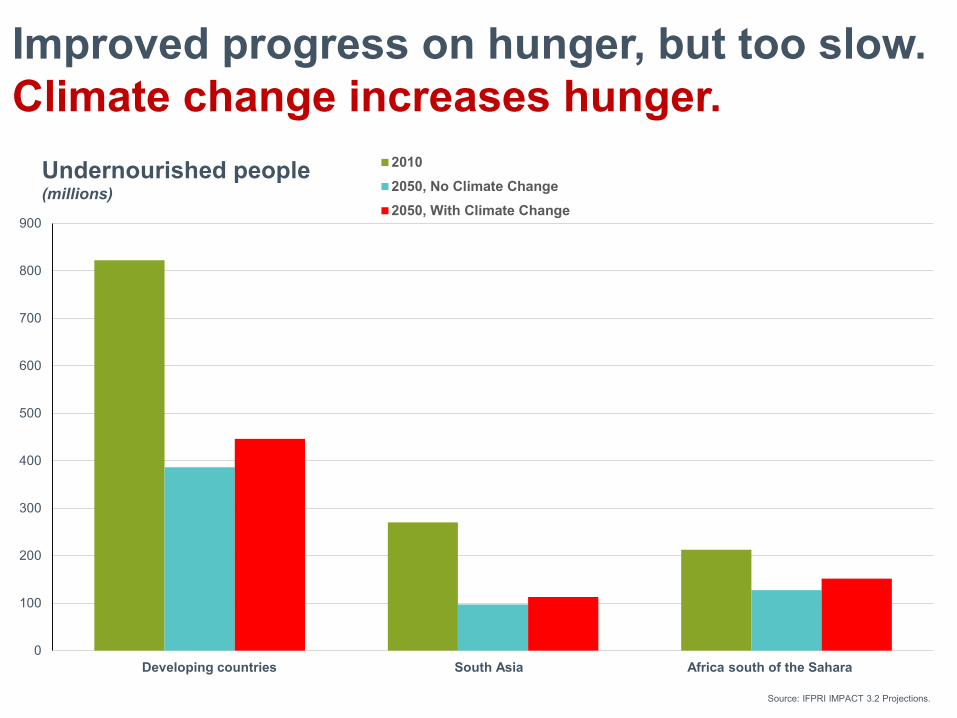
20102050, No Climate Change2050, With Climate Change
Source: IFPRI IMPACT 3.2 Projections.
Improved progress on hunger, but too slow.Climate change increases hunger.
Undernourished people (millions)
Developing countries South Asia Africa south of the Sahara
-45
-40
-35
-30
-25
-20
-15
-10
-5
0
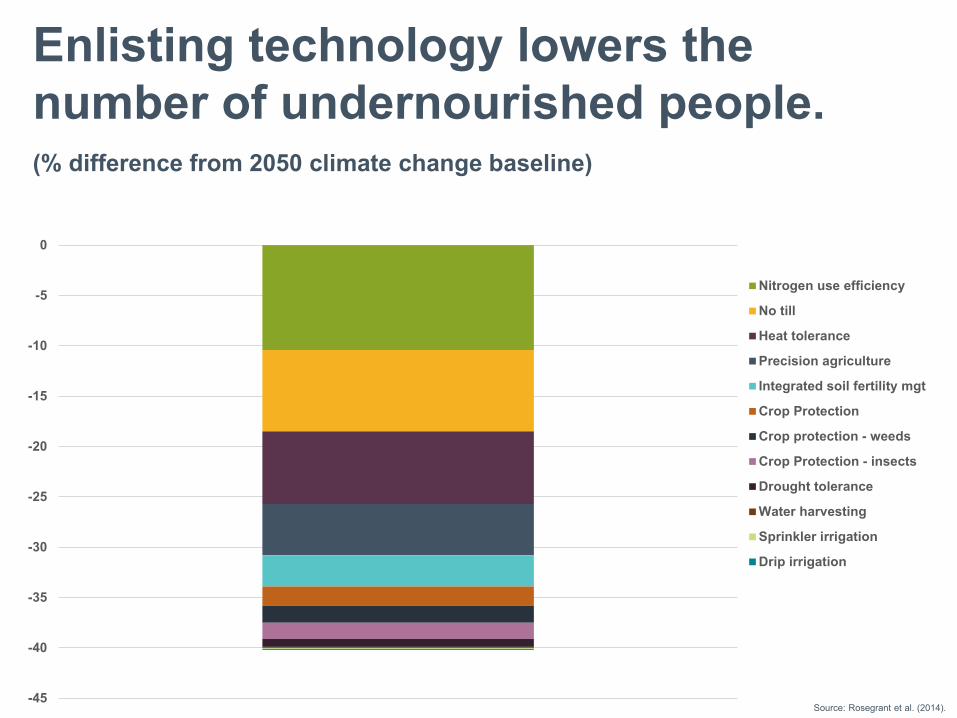
Nitrogen use efficiency
No till
Heat tolerance
Precision agriculture
Integrated soil fertility mgt
Crop Protection
Crop protection - weeds
Crop Protection - insects
Drought tolerance
Water harvesting
Sprinkler irrigation
Drip irrigation
Source: Rosegrant et al. (2014).
(% difference from 2050 climate change baseline)
Enlisting technology lowers the number of undernourished people.