tree-stem diameter fluctuates with the lunar tides and perhaps
TRANSCRIPT

ORIGINAL ARTICLE
Tree-stem diameter fluctuates with the lunar tidesand perhaps with geomagnetic activity
Peter W. Barlow & Miroslav Mikulecký Sr &
Jaroslav Střeštík
Received: 19 January 2010 /Accepted: 9 March 2010# Springer-Verlag 2010
Abstract Our initial objective has been to examine thesuggestion of Zürcher et al. (Nature 392:665–666, 1998)that the naturally occurring variations in stem diameter oftwo experimental trees of Picea alba were related to near-simultaneous variations in the lunisolar tidal acceleration.The relationship was positive: Lunar peaks were roughlysynchronous with stem diameter peaks. To extend theinvestigation of this putative relationship, additional data onstem diameter variations from six other tree species weregathered from published literature. Sixteen sets of data wereanalysed retrospectively using graphical representations aswell as cosinor analysis, statistical cross-correlation andcross-spectral analysis, together with estimated values ofthe lunisolar tidal acceleration corresponding to the sites,dates and times of collection of the biological data. Positiverelationships were revealed between the daily variations ofstem diameter and the variations of the lunisolar tidalacceleration. Although this relationship could be mediated
by a 24.8-h lunar rhythm, the presence of a solar rhythm of24.0 h could not be ruled out. Studies of transpiration intwo of the observed trees indicated that although thisvariable was not linked to stem diameter variation, it mightalso be subject to lunisolar gravitational regulation. Inthree cases, the geomagnetic Thule index showed a weakbut reciprocal relationship with stem diameter variation, aswell as a positive relationship with the lunisolar tidal force.In conclusion, it seems that lunar gravity alone couldinfluence stem diameter variation and that, under certaincircumstances, additional regulation may come from thegeomagnetic flux.
Keywords Abies alba . Juglans regia . Lunisolar tidalacceleration .Picea abies .Pseudotsuga menziesii .
Stem diameter variation . Thule index . Tilia cordata .
Transpiration . Trees
AbbreviationsCD Coefficient of determinationδD Stem diameter variationδg Lunisolar tidal acceleration (vertical component)Th Thule indexTs Rate of transpiration
Introduction
Twelve years ago, Zürcher et al. (1998) reported a ‘strongcorrelation’ (their term) between the natural, rhythmicvariation of stem diameter (δD) of two trees of Picea abies(Norway spruce), as measured by high-resolution extens-ometry, and the timing and strength of the verticalcomponent of the lunisolar tidal acceleration (δg)—a partial
P. W. Barlow (*)School of Biological Sciences, University of Bristol,Woodland Road,Bristol BS8 1UG, UKe-mail: [email protected]
M. Mikulecký SrDepartment of Biometrics and Statistics,Neuroendocrinology Letters, Stockholm and Bratislava,Sweden and Slovakia, University of Minnesota,Minneapolis, MN, USA
M. Mikulecký SrBioCos, University of Minnesota,Minneapolis, MN, USA
J. StřeštíkInstitute of Geophysics, Academy of Sciences of Czech Republic,Prague, Czech Republic
ProtoplasmaDOI 10.1007/s00709-010-0136-6

and indirect measure of the continually varying lunargravitational force experienced everywhere on Earth as aconsequence of the relative positions of Sun, Moon andEarth. Similar correlations were also mentioned in relationto stem-diameter variations of alder (Alnus sp.) trees(Zürcher et al. 1998). The two experimental spruce treeswere grown in darkness within a controlled environmentcabinet. The displayed variations in stem diameter (dilatationrhythms) were therefore considered to have been independentof entraining influences from fluctuations of lighting, temper-ature and humidity. Moreover, because the trees’ stomata weresaid to be closed (Zürcher et al. 1998) and also because stemsof trees from which the crown leaves had been removedshowed similar diameter variations (Cantiani and SorbettiGuerri 1989), an effect of transpiration on δD was ruled out.Instead of transpirational water movement serving as asource of stem diameter variations, a rhythmic and reversibleflow of solutes between the symplasm of living cells and theapoplasm, including the cell walls, was proposed (Zürcheret al. 1998). More recent work has supported this opinion(Daudet et al. 2005), and anatomical studies of sapwood(Zweifel et al. 2000; Scholz et al. 2008) have indicated thecells of the developing secondary tissue, which could beinvolved in the dilatation rhythm of tree stems. It should,however, be pointed out that the relationship between lunargravity and stem diameter proposed by Zürcher et al. (1998)could not be confirmed by Vesala et al. (2000) workingwith trees of Pinus sylvestris raised in Finland. Unfortunate-ly, this report is not without its problems: Besides incorrectlystating the duration of the lunar period, these authors basetheir negative conclusion solely (apparently) on resultsgained from Fourier analysis of xylem diameter variation.
In view of the mentioned difference of opinion regardinga possible link between δD and the estimated lunisolar tidalacceleration δg prevailing during the period when stemdiameters were measured, the present article renewsexamination of this proposed relationship. Data for δDoriginally recorded by Cantiani (1978), Cantiani andSorbetti Guerri (1989) and Cantiani et al. (1994) have beenused. Cyclical–rhythmic relationships can be rigorouslyinvestigated by making use of cosinor rhythmometry(Nelson et al. 1979) and other statistical proceduresaccepted by chronobiologists for the analyses of biologicalrhythms. Chronometric-statistical methods can evaluate,for example, the time delay(s) between one cycle (thatpertaining to a presumed dependent biological variable,say) and a second cycle (such as that due to an independentgeophysical variable). Precision can thus be given to theevaluation of interrelationships, which show indications ofpartial synchrony. The publications of Cantiani and hiscolleagues contain not only details of δD, as measured bysensitive extensometry, in a number of species of both hard-and softwood trees, but also simultaneous records of
transpiration (Cantiani and Sorbetti Guerri 1989), a processwhich may be relevant to the daily variation in stemdiameter. Although these data were gathered many yearsago, they are still valid for examining their relationshipswith the lunisolar tidal accelerations δg prevailing at thetime and place of biological data collection.
Besides their well-known responses to gravity, livingorganisms are also responsive to external magnetoelectricfields—the second force in the cosmos after gravitation(Brown 1969; Żurbicki 1973; Galland and Pazur 2005;Zhou and Uesaka 2006; Ahmad et al. 2007). Therefore, inaddition to δg, the effects of two other cosmic variablesknown to contribute to the Earthly geomagnetic flux(Maeda 1968) were introduced into our analysis of tree-stem diameter variation. These are the ‘Thule index’ (Th)and the ‘Disturbance Storm Time index’ (Ds) (Akasofu1982). We asked of the time series of biological datagathered from the mentioned tree species, whether thesetwo variables showed any relationships with the rhythms ofδD or of transpiration.
Finally, we wish to remark upon the approach we havetaken in examining the putative relationship betweenlunisolar gravity and tree-stem diameter variation. Thepresent sets of data relating to δD and transpiration wereoriginally collected by Cantiani (1978) and Cantiani andSorbetti Guerri (1989) in their study of rhythmic stemdiameter variation. In fact, the observations of Cantiani hadled him cautiously to propose that the gravitational force ofboth Sun and Moon affected some of the tree-growthrhythms he had studied (Cantiani 1978). While Cantianirealised that this hypothesis was ‘alquanto fantascientifica’,he did call for rigorous experimentation upon the matter, astep towards which was taken by Zürcher et al. (1998).Visual inspection of these last-mentioned authors’ datafor δD and δg (the erroneous interchange of negative andpositive signs for δg in their publication needs to be lookedupon as a simple mistake) suggested—after our carefulreconsideration—a positive relationship between δD andδg (Zürcher et al. 1998). However, one example, takenfrom 3 days of data recording, is not sufficient to allowconclusions about a general relationship, especially sincethe pattern of δg continually changes across the period of alunar month. Unless longer term observations are con-ducted expressly to examine lunar/tree relationships, thebest that can be done is to examine this putativerelationship with the aid of a series of ‘snapshots’ of datagathered on different dates. While one snapshot showingone positive relationship is interesting (as in the case ofresults from Zürcher et al. 1998), numerous ‘snapshots’,gathered on various dates and over various lengths of timeare of greater merit, and if they all show similar relation-ships between lunar gravity and stem diameter, as wepresent here [and which we had found also in a previous,
P.W. Barlow et al.

cognate study of lunar gravity and nastic leaf movements(Barlow 2007; Barlow et al. 2008)], then the possibility of aMoon and tree relationship begins to demand seriousattention.
Materials and methods
Biological variables
The main concern is to examine the variation in stemdiameter (δD, mm) of soft- and hardwood trees in relation tothe lunisolar tidal acceleration δg. Data sets S1–S16 containtime-series records of δD and δg, and where appropriate,values of Th and Ds also, which were collected on a numberof different dates (Table 1). The values of δD were originallygathered by Cantiani (1978) and Cantiani and SorbettiGuerri (1989). In two cases, measurements of transpirationrate (Ts, g min−1) were also made. Details relevant to thepresent data and their sources are given below.
Stem diameter variations
Variations in stem diameter δD were recorded by extens-ometry from seven different temperate tree species growingin two different localities (Cantiani 1978; Cantiani andSorbetti Guerri 1989). One set of observations was made ontrees growing naturally in a forest at Vallombrosa, Italy(43°44′ N, 11°34′ E; altitude, 950 m). A second set wasgathered from trees grown within a controlled growthcabinet environment in Firenze, Italy (43°47′ N, 11°16′ E;altitude, 36 m). Details of both types of growth conditions,
as well as the extensometric method, are described byCantiani (1978), Cantiani and Sorbetti Guerri (1989) andMeluzzi and Sorbetti Guerri (1989).
Forest-grown trees Data sets S1 and S2 relate to a maturespecimen (19.6 m tall) of Tilia cordata growing inVallombrosa. Time series of δD were gathered via exten-someter channel 7 (for S1) and channel 9 (for S2) placed attwo different locations (7.5–13 m above ground level) uponthe stem of the tree. Data collections took place on 19–23September 1976. The values of δD in the time series wereextracted for analysis from Fig. 6 of Cantiani (1978).
Data set S3 pertains to the already mentioned tree ofT. cordata. Time series of δD were gathered via extensom-eter channel 9, between 24 June and 3 July, 1977. Data setS4 includes records from extensometer channel 11 placed20 m above ground level on the main stem of a tree (32.5 mtall) of Liriodendron tulipifera. The recordings were on thesame dates as for S3 of Tilia. Both sets of original dataappear in Fig. 7 of Cantiani (1978).
Data sets S5 and S6 contain time series of δD for twoisolated, vertically positioned, segments cut on 21 March1977 from a living branch of Douglas fir, Pseudotsugamenziesii, that was 39 m tall. Both segments showed arhythm of stem dilatation over a 10-day recording period,which commenced on 24 June 1977, 3 months after thesegments were cut. Records for S5 were obtained fromextensometer channel 5 placed on the bark of one of thesegments, whereas those for S6 were from channel 6located below the bark, in contact with living secondarytissue. Simultaneously, recordings of δD for data set S7were taken, via extensometer channel 2 at a location on the
Table 1 Summary of data sets S1–S16 containing time series of stem diameter variations (δD) and transpiration rates (Ts) originally recorded onthe dates give by M Cantiani and colleagues from various hardwood and softwood tree species at two locations in Italy
Variable Data set Tree species Location Date of recording Number of days
δD S1, S2 Tilia cordata Vallombrosa 19–23/09/1977 5
δD S3 Tilia cordata Vallombrosa 24/06–03/07/1977 10
δD S4 Liriodendron tulipifera Vallombrosa 24/06–02/07/1977 9
δD S5, S6, S7 Pseudotsuga menziesii Vallombrosa 23/06–02/07/1977 9
δD S8, S9 Pseudotsuga menziesii Vallombrosa 19–23/09/1976 5
δD S10 Picea abies Firenze 9–11/07/1988 2 1/2
δD S11 Picea abies Firenze 13–16/07/1988 2 1/2
δD S12 Picea abies Firenze 17–20/07/1988 4
δD S13 Abies alba Firenze 27–28/02/1988 2
δD S14 Juglans regia Firenze 24–26/03/1991 3
δD S15 Mespilus germanica Firenze 09–10/10/1989 2
δD S16 Mespilus germanica Firenze 21–24/10/1989 4
Ts S10 Picea abies Firenze 10–11/07/1988 2
Ts S13 Abies alba Firenze 27–29/02/1988 3
The data sets also include variations of the lunisolar tidal acceleration δg at the locations and dates indicated.
Tree-stem diameter, Moon and cosmogeomagnetism

stem (17 m above ground level) next to where the twomentioned segments had been cut. All three time series ofδD were extracted from Fig. 11 in Cantiani (1978). Thesesame time series appear in Fig. 3 of Cantiani et al. (1994).
Cantiani (1978) recorded δD from a root (26 cm indiameter) of P. menziesii. Data sets S8 and S9 contain,respectively, time series of δD from this root and from thestem to which the root was linked. Recordings were madevia extensometer channels 4 (root) and 1 (stem) on 19–23September 1976. The results for these two data sets wereextracted from Fig. 4 of Cantiani (1978). The same dataappear in Fig. 2 of Cantiani et al. (1994).
Trees in a growth cabinet A laboratory growth cabinetlocated in Firenze was used by Cantiani and Sorbetti Guerri(1989) to test whether lighting conditions and transpirationaffected stem diameter variation.
Three different time series of δD for a stem of a 9-year-old (1 m tall) Norway spruce tree (P. abies),1 referred to as‘tree no. 2’, are included in data sets S10–S12 and wererecorded on three occasions during July 1988. On the firsttwo occasions (9–12 July, and 13–16 July, respectively),tree no. 2 was grown first in 12-h light/12-h dark conditionsand then was placed in continuous light. Values of δD forthe corresponding data sets S10 and S11 were extractedfrom Figs. II-4 and II-5, respectively, of Cantiani andSorbetti Guerri (1989). On the third occasion (17–20 July),the tree was placed in darkness. The respective δD valuesassembled for data set S12 were extracted from Fig. II-6 inCantiani and Sorbetti Guerri (1989) [The same graph of δDfor this tree, tree no. 2, is presented as Fig. 1a in thepublication of Zürcher et al. (1998), as well as appearing inFig. 9 of Cantiani et al. (1994)].
Data set S13 contains a time series of δD values froma stem of a 10-year-old white fir (Abies alba) grown in12-h light/12-h dark conditions. The measurements weregathered on 27–29 February 1988 and were extracted fromFig. I-2 of Cantiani and Sorbetti Guerri (1989). The samemeasurements also feature in Fig. 1 in Cantiani et al. (1994).
Data for δD of a stem of Juglans regia growing in‘conditions de photopériode normale’ were extracted fromFig. 7 of Cantiani et al. (1994) and placed in data set S14.The dates of the extensometer recordings were 24–26March 1991.
Data sets S15 and S16 contain time series of δD from astem of a 6-year-old tree of Mespilus germanica. In the first
case (S15), the tree was grown in darkness; in the secondcase (S16), the same tree had been placed in a 12-h light/12-h dark regime. The respective time series of δD wereextracted from Figs. VII-2 and VII-1 of Cantiani andSorbetti Guerri (1989)—the last-mentioned figure alsofeatures as Fig. 10 in Cantiani et al. (1994). The dates onwhich the data for S15 and S16 were recorded were 9–10October 1989 and 21–24 October 1989, respectively.
Variations in transpiration rate
A time series of transpiration rates Ts from P. abies on10–11 July 1988 is contained in data set S11. The same tree(tree no. 2) had simultaneously supplied the already-mentioned values of δD. Two other records of Ts for P.abies are contained in the already-mentioned data sets S10and S12. All these time series were extracted from Figs II-1,II-2 and II-3 in Cantiani and Sorbetti Guerri (1989).
Data set S13 also includes a time series for Ts in A. albagathered on 27–29 February 1988, simultaneously with thedata for δD. The data were extracted from Fig. I-1 ofCantiani and Sorbetti Guerri (1989). The same data for Tsappear in Fig. 5 in Cantiani et al. (1994).
Transpiration rates were measured from the loss ofweight, over time, of the trees and their containers, takingcare that it was only the tree, not the soil, from which waterwas lost (Cantiani and Sorbetti Guerri 1989).
Geophysical variables
Lunisolar tidal acceleration
Variations in the vertical component of the lunisolar tidalacceleration δg were estimated according to programmesroutinely used by us (see also Barlow et al. 2008). Thehorizontal component of δg also varies, but the effect on thetidal acceleration is negligible. The computations are basedon gravimetric formulae prepared by Longman (1959).Data inputs for the estimation of δg relevant to the presentstudy were the latitude, longitude and altitude above sealevel of the already-mentioned locations of the experimentaltrees, as well as the calendar dates (Table 1) for which the δgvalues were required. The computation of δg produced timeseries, which used the local times at which recordings of δDand Ts were made.
To put the lunisolar tidal δg values into perspective, itshould be recalled that the gravimetric unit for δg is themicro-Galileo and that 9.81×10⁸ µGal (9.81 m/s2) areequivalent to 1 G unit of Earthly gravity.
Tidal theory has been thoroughly described (Bartels1957; Tomaschek 1957; Melchior 1983). However, inorder to explain the ‘meaning’ of δg more precisely,
1 In the publications of Cantiani and Sorbetti Guerri (1989) and ofCantiani et al. (1994), the Latin name of Norway spruce [‘abete rosso’(It.) or ‘l’épicéa’ (Fr.)] is given as Picea excelsa Link., whereas it isgiven as Picea abies Karst. in the publication of Zürcher et al. (1998).Clearly, the same individual tree is being referred to in each case. Thename Picea abies (L.) Karsten is retained here.
P.W. Barlow et al.

we offer the following remarks. The lunisolar tidalacceleration results from the fact that the Earth is notonly a single mass point but co-exists with Sun andMoon. The Earth is an elastic body and, in response tothe relative positions of Sun andMoon, it exhibits elasticdeformations, with maximal elevations reaching sometens of centimetres. Gravitational acceleration continu-ally varies at points on the Earth’s surface due to thesedeformations. The result is a residual (tidal) acceleration,δg. A 3-mm vertical elevation at a given location onthe Earth’s surface, as a result of the joint action of themasses of the Sun and Moon, is equal to 1 μGal, andthis value is subtracted from the local Earthly 1 Ggravitational acceleration of 9.81×10⁸ µGal. Thus, thevalues of δg, while actually relating to the local valuesof Earthly gravity, stand proxy for the lunisolargravitational force that is bearing upon the Earth atthe given times, dates and places. Cyclical variation inthe relative distances between Sun, Moon and Earthover time (say, 1 year) has a very small effect on δg.
The basic wave of δg has a period of 12 h, and twomaxima and two minima appear during the day. Inrelation to the Sun, the vertical component (and onlythis component is considered here) of δg reaches itsmaxima (positive) at noon and midnight and itsminima at sunrise and sunset. With respect to theMoon, there is an analogous arrangement: The basicperiod is equal to the half of a lunar day, i.e. 12.44 h,and the amplitude is twice the amplitude of the solarwave. On days with a new and full moon, maxima ofboth waves nearly coincide, and the resulting tidalwave is particularly high (the sum of both waves),whereas in the first and last quarter, maxima of onewave coincide with minima of the other wave and theresulting wave is lower. It is the relative positions ofSun and Moon that therefore govern the values of δg,the contribution of the Sun to the gravitational ‘pull’on the Earth being about 46% that of the Moon. Inrelation to the Earth’s 1 G gravitational constant,those of Sun and Moon are 27.9 and 0.16 G,respectively. However, distance from Earth affectstheir gravitational ‘pull’: Relative to distance of theMoon, the Sun is 389 times further from the Earth.
Besides the vertical component of the tidal accelera-tion (here denoted as δg), there is also a horizontalcomponent. Its value moves within the same limits asthe vertical component but is shifted in phase and isdelayed after the vertical component by π/2. Thiscomponent influences the direction of a vertical line,the maximal deviation being 0.0182 s of an arc. Thisdeviation is variable and exhibits the same periods asδg, also in accordance with the relative positions of
the Sun and the Moon with respect to the Earth. In thepresent paper, we deal only with the vertical compo-nent of δg, as did Zürcher et al. (1998) and Vesala etal. (2000). Due to its periods being similar to δg, theuse of the horizontal component (or the deviationfrom the vertical) does not any bring new, indepen-dent information.
The distances Earth-to-Sun as well as Earth-to-Moonvary with time due to the elliptical orbits of the Earthand of the Moon. These variations influence theamplitudes of the tidal acceleration, but when com-pared with the results arising in the case of circularorbits, the differences are very small. Moreover, thesevariations have long periods (1 year for the Sun, andone anomalistic month of 27.55 days for the Moontides). Therefore, these variations cannot expressthemselves during short intervals during which thetree diameters were presently investigated.
This ideal model applies only for the equinoxaccidentally coinciding with the new or full moon,i.e. both bodies move in the equatorial plane. Ingeneral, the diurnal waves are not symmetric, and theactual lunar tidal waves are a combination of the12:44-h and the 24.88-h waves with amplitudes whichchange rapidly with time. The whole tidal wave isthen a combination of four waves, contributed by bothSun and Moon, with different and variable ampli-tudes. The wave-like variations of δg for one of themonths (June 1977) coinciding with one observationperiod (in Vallombrosa, Italy) during the presentinvestigations of δD are shown in Fig. 1. On otherdates, slightly different patterns of δg are present.
The atmosphere of the Earth also exhibits variations due totidal effects, with periods similar to those for the solid Earth.These variations are reflected in small variations of the airpressure observed on the Earth’s surface, the biggest differencebetweenmaximal andminimal atmospheric pressures reaching0.1 hPa (Volland 1988). This takes place on the equator,during the full and new moon. In meteorology, atmosphericpressure is presented with an accuracy of 0.1 hPa. Thus,although the described tidal effect on air pressure is notnegligible, it is relatively small. It is possible that thismeteorological variable could affect rates of transpiration and,perhaps, even the amplitude of stem diameter variation.
With reference to the computed maximal (peak) valuesof δg, three modes repeat during the lunar month shown inFig. 1, one mode giving way to another during this period.On any given day, one of the following modes may beencountered: mode 1, a single peak or maximum of δg(A in Fig. 1); mode 2, an unequal pair A,B of peaks(A appearing first, followed by B, or vice versa); and 3, a
Tree-stem diameter, Moon and cosmogeomagnetism
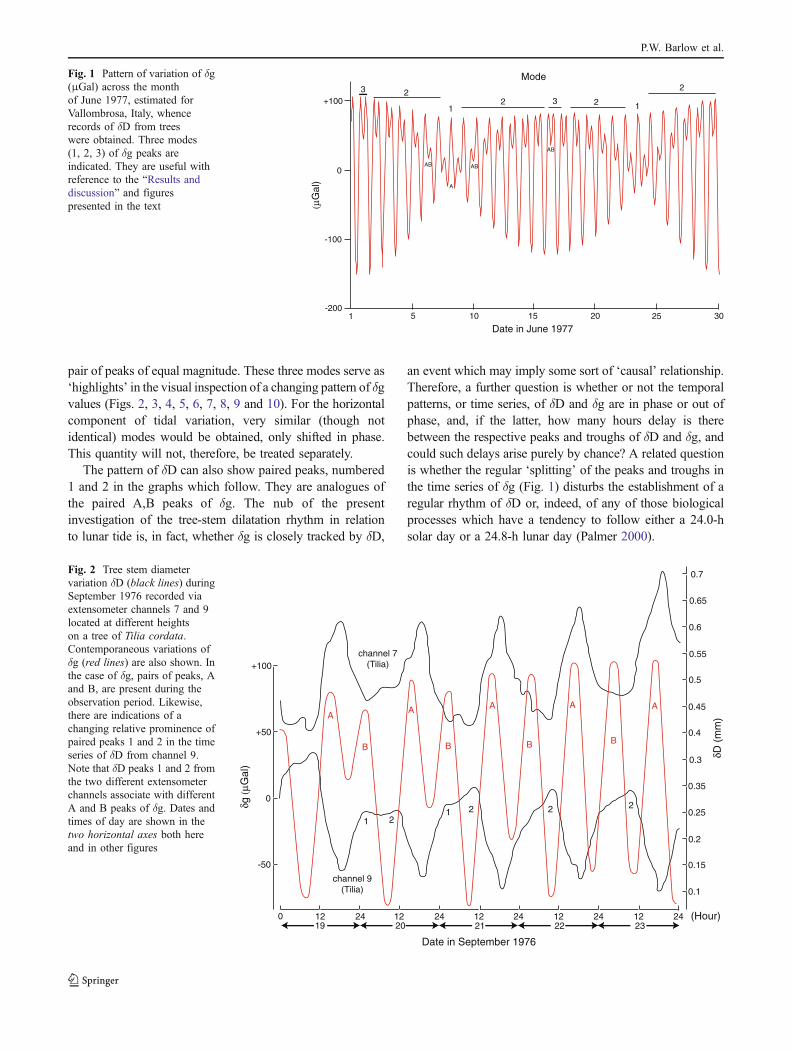
pair of peaks of equal magnitude. These three modes serve as‘highlights’ in the visual inspection of a changing pattern of δgvalues (Figs. 2, 3, 4, 5, 6, 7, 8, 9 and 10). For the horizontalcomponent of tidal variation, very similar (though notidentical) modes would be obtained, only shifted in phase.This quantity will not, therefore, be treated separately.
The pattern of δD can also show paired peaks, numbered1 and 2 in the graphs which follow. They are analogues ofthe paired A,B peaks of δg. The nub of the presentinvestigation of the tree-stem dilatation rhythm in relationto lunar tide is, in fact, whether δg is closely tracked by δD,
an event which may imply some sort of ‘causal’ relationship.Therefore, a further question is whether or not the temporalpatterns, or time series, of δD and δg are in phase or out ofphase, and, if the latter, how many hours delay is therebetween the respective peaks and troughs of δD and δg, andcould such delays arise purely by chance? A related questionis whether the regular ‘splitting’ of the peaks and troughs inthe time series of δg (Fig. 1) disturbs the establishment of aregular rhythm of δD or, indeed, of any of those biologicalprocesses which have a tendency to follow either a 24.0-hsolar day or a 24.8-h lunar day (Palmer 2000).
(µG
al)
Date in June 19771 5 10 15 20 25 30
+100
0
-100
-200
22
1 12
2
3
Mode3
AB AB
AB
A
Fig. 1 Pattern of variation of δg(μGal) across the monthof June 1977, estimated forVallombrosa, Italy, whencerecords of δD from treeswere obtained. Three modes(1, 2, 3) of δg peaks areindicated. They are useful withreference to the “Results anddiscussion” and figurespresented in the text
+100
+50
0
-50
0 12 12 12 12 1224 24 24 24 2419 20 21 22 23
0.7
0.65
0.6
0.55
0.5
0.45
0.4
0.35
0.25
0.2
0.15
0.1
0.3
δg (µ
Gal
)
Date in September 1976
δD (
mm
)
channel 7(Tilia)
channel 9(Tilia)
11
22 2 2
AA A A A
B B B B
(Hour)
Fig. 2 Tree stem diametervariation δD (black lines) duringSeptember 1976 recorded viaextensometer channels 7 and 9located at different heightson a tree of Tilia cordata.Contemporaneous variations ofδg (red lines) are also shown. Inthe case of δg, pairs of peaks, Aand B, are present during theobservation period. Likewise,there are indications of achanging relative prominence ofpaired peaks 1 and 2 in the timeseries of δD from channel 9.Note that δD peaks 1 and 2 fromthe two different extensometerchannels associate with differentA and B peaks of δg. Dates andtimes of day are shown in thetwo horizontal axes both hereand in other figures
P.W. Barlow et al.

Geomagnetic variables
With respect to geomagnetic activity, two types of variableswere examined. The first is the Geomagnetic Polar Cap
Index, called here the Thule Index (Th, no units), which isbased on an idea by Troshichev et al. (1979) (see alsoMaeda 1968). Th represents the magnetic activity, at thepolar cap, generated by parameters of the solar wind, such
+100
+50
0
-50
-100
-1500 12 12 12 12 1224 24 24 24 24
27 28 29 30 01
0.6
0.5
0.4
0.3
0.2
0.1
0
2.0
1.75
1.5
1.25
1.0
B B
BB B
A
AA A
A
channel 11(Liriodendron)
channel 9(Tilia)
δg (µ
Gal
)
δD (
mm
)
Date in June - July 1977
(Hour)
Fig. 3 Time series of δD and δgsimilar to those shown in Fig. 2.Extensometer channel 9 waslocated on a tree of Tiliacordata; channel 11 was locatedon a tree of Liriodendrontulipifera. Recordings weremade during June to July 1977
0 12 24 24 24 24 24 24 2412 12 12 12 12 1225 26 27 28 29 30 01
Date in June - July 1977
channel 2(intact)
AA
AA A A A
BBBBB
B
δg (µ
Gal
)
δD (
mm
)δD
(m
m)
δD (
mm
)
+100
+50
0
-50
-100
-150
1.5
1.4
1.3
1.2
1.1
1.0
0.9
0.8
0.50.40.30.20.10.60.50.4
channel 6(segment internal)
channel 5(segment external)
(Hour)
Fig. 4 Time series of δDfrom cut branch segments ofPseudotsuga menziesii duringJune to July 1977, together withthe contemporaneous record ofδg (red line). Channel 2recorded from an intact portionof stem, whereas channels 5 and6 were located, respectively, onthe surface of the bark and at thelevel of the cambium on abranch segment cut from the tree3 months earlier. Peaks of δDcoincide (see vertical arrowswith broken shafts) with eitheran A peak (see channel 6) ora B peak (see channels 2 and 5)of δg
Tree-stem diameter, Moon and cosmogeomagnetism

as its velocity and the southward and azimuthal components(Bz and By, respectively) of its interplanetary magneticfield. The Thule index, because of its universality, standsproxy for the geomagnetic activities which apply at the twosites (Vallombrosa and Firenze) of the present biologicalinvestigations.
The second geomagnetic variable is the DisturbanceStorm Time index Dst (called here Ds, units of nanotesla,nT) derived from hourly scalings of low-latitude horizontalmagnetic variation. This index represents the effect of theglobally symmetrical westward-flowing, high-altitude equa-torial ring current related to large magnetic storms (Mayaud1980; O’Brien and McPherron 2002). Positive and negativevalues of Ds indicate, respectively, either an enhancementor a weakening of the Earth’s magnetic field. Geomagneticdisturbances included in Ds are minute in comparison withthe Earth’s main magnetic field (some hundreds ofnanotesla compared with 50,000 nT of the main field).Nevertheless, they may influence organisms in whichelectric currents are active.
Values of Th and Ds are available at the followingwebsites: ftp://ftp.ngdc.noaa.gov/STP/SOLAR_DATA/RELATED_INDICES/PC_INDEX/THULE (for Th) andftp://ftp.ngdc.noaa.gov/STP/GEOMAGNETIC_DATA/INDICES/ and also http://wdc.kugi.kyoto-u.ac.jp/dst_final/index.html (for Ds). From these records, time series of Thand Ds were extracted for the same periods over whichbiological observations were made.
Data analysis
Visual inspection
Visual inspection of plotted data was used for assessingrelationships between biological and geophysical variables,
as performed in a related context (Barlow 2007; Klein2007; Barlow et al. 2008). ‘Highlights’ in the time series ofeach variable, especially those of δD and δg, were usuallyrelated to the timings of particular maximum or minimumvalues (peaks or troughs), or to the times at which thesevalues show the greatest rates of change (e.g. rapid fall orrise from a respective peak or trough). Each highlightrepresents a ‘nuance’ in the time-series data which may notimmediately be captured by statistical analysis. For example,the sinusoids derived by cosinor analysis are the smoothedpaths through the peaks and troughs of the data pointsproduced by the fitting procedure. Each highlight mighttherefore be justifiably considered separately in relation to δg.
The time between the occurrence of a peak of δD(generally Y, the dependent response, e.g. a biologicalvariable) and of δg (generally X, the independent, explan-atory, e.g. a cosmogeophysical variable) is a measure of thelag L between X and Y, or between Y and X. A positivevalue of L denotes a delay of Y after X (LXY), and a negativevalue denotes delay of X after Y (LYX). A positive LXYcorresponds with a negative LYX, the latter being equal to LXYminus the period length. Accordingly, LXY–LYX=period length.
Statistical procedures
Data from complete 24-h solar days (commencing at0:00 h) were used for statistical analysis. However, in thecase of data set S12, because of the special interestconcerning the values of δD from tree no. 2 of P. abies inrelation to δg (see Introduction and also Zürcher et al.1998), the data from the whole 75-h time series wereincorporated into the analyses.
Cosinor analysis Univariate cosinor analysis (Binghamet al. 1982) was used to assess the presence of linear or
0 12 12 12 12 1224 24 24 24 2419 20 21 22 23
0.7
0.6
0.5
0.4
0.3
+100
+50
0
-50
channel 4(root)
channel 1(stem)
A A A A AB B B B
Date in September 1976
δg (µ
Gal
)
δD (
mm
)
1 1 1 11
11
2 2 2 2
22
(Hour)
Fig. 5 Time series of δD from aroot and a stem of Pseudotsugamenziesii via extensometerchannels 4 and 1, respectively.Contemporaneous records of δgare also shown (red line). Notethat peaks and troughs of δD aremore frequent in the root than inthe stem
P.W. Barlow et al.

parabolic trends for x and y values versus time t, as well asperiodicities (circadian 24.0 h, or circalunidian 24.8 h, withtheir harmonics up to the tenth) within the time series ofboth biological and cosmogeophysical data. The methodutilises least squares to fit a (co)sine wave [(co)sinusoid]regression to the values under consideration (Nelson et al.1979). The 95% confidence intervals of the amplitude andacrophase (time of peaking), as well as the 95% confidence(for means) and 95% tolerance (for individual observations)corridors for the total approximating function, wereestimated and entered into the graphed data.
In the simplified cosinor evaluation, single peaks of δgduring, say, one lunar day, as in mode 1 (Fig. 1), were treatedas single sinusoids. When there were pairs of peaks (A andB) of δg during a lunar day, as in modes 2 and 3 (Fig. 1), thetwo peaks of the A,B pair were smoothed and treated as
though they were parts of a single sinusoid. Pairs of peaks 1and 2 in the time series of δD were considered similarly.
Cross-correlation The cross-correlation method of Bartlett(1953) describes the linear regression between x and yexpressed by the common correlation coefficient rx,y (on theordinate) as a function of a lag L (on the abscissa). Thepoint estimate of rx,y is accompanied by its 95% confidencecorridor. Non-overlapping of the zero value of rx,y, repre-sented on the horizontal axis, means either a significantpositive or a negative stochastic dependence of y upon x forthe given lag. The decisive information is whether the 24 h-cycling of rx,y versus L is significant. If so, it will testify thatboth variables are mutually resonating—in the sense of acoherence, perhaps as part of “a universal synchronisation ofnatural cyclic processes…based on a composite system ofuniversal causal interactions” (Vasil’eva, 1998). Thesemultidimensional actions can work immediately or with adelay: formally, with a lag Lxy or Lyx, where only the former
12 12 1224 24 2413 14 15 16
Date in July 1988
10
0
-10
-20
+50
0
-50
-100
δg (µ
Gal
)D
s (n
T)
Th
δD (
mm
x 1
0
)-2
Ts (
g.m
in
)-1
+15
+10
+5
0
-5
0.06
0.05
0.04
0.03
0.02
0.01
0
A A AB BB1
1
1
2 2
32
10
-1
(Hour)
Fig. 7 Tree no. 2 of Picea abies was now grown in continuous light.Ts was constant at approximately 0.055 g H2O min−1. Details of othermeasurements are as mentioned in the legend to Fig. 6
3
2
1
0
+30
+20
+10
0
-10
-20
+15
+10
+5
0
-5
-10
-15
-20
24 24 2412 12 1210 11 12
Th
Ds
(nT
)
-100
-50
0
+50
δg (µ
Gal
)
0.075
0.05
0.025
0
Ts (
g.m
in
)-1
Date in July 1998
AA A
B B B
1
1
1
2
2
δD (
mm
x 1
0 )-2
(Hour)
Fig. 6 Tree no. 2 of Picea abies was growing in a cabinet wherethere was a 12-h light/12-h dark cycle (dark periods are stippled).There was diurnal variation of Ts. Values of δD (black lines) andtranspiration Ts (blue lines), and of δg (red lines), were recordedduring July 1988. In each case, pairs of maximal peaks A,B of δg arenearly coincident with paired peaks 1,2 of δD. Contemporaneousvalues for the Thule (Th) and the Disturbance Storm Time (Ds)indices are shown in the upper panels
Tree-stem diameter, Moon and cosmogeomagnetism

will be considered as physiologically meaningful. A directcausal effect, e.g. gravity→tree, with or without a delay, isnot excluded, however.
Coherence A coherence indicates the presence of cyclingwith the same period lengths but with various phase shifts
in the data sets. Coherence between two or more variableswas searched for by means of cross-spectral analysis(Hannan 1970). Ordinary coherence relates to two variables(x, y), whereas multiple coherence evaluates the existenceof coherence between one target variable (y) and othervariables (x, w, z, ...). Partial coherence relates to thatbetween two variables (x,y) after excluding the confoundinginfluence of other variables (w, z, …).
Meaningful relationships derived from statistical analyses
The objective of the above statistical tests was to revealmeaningful relationships between two or more data timeseries. Significant statistical correlations between biolog-ical and geophysical variables do not necessarily implycausation; however, where the two time-series haveparticularly complex patterns that run in parallel (e.g.Lang 1972), such a supposition might have somejustification.
The most important statistical parameters in thepresent analyses are the significant period lengths, thevalues of the correlation coefficient r, the durations ofthe lags L, and the coefficients of partial coherence. Thepresent time series of biological data extend over 2–10 days.The longer the time series the more favourable thepossibility of discovering temporal trends in, say, the valuesof L. The usage of confidence intervals in cosinor andcross-correlation analyses yields a statistical uncertainty notonly for the values of x, y or r but also for the timing in thecosinor and for the L estimates in cross-correlation. Forexample, a confidence interval for L of 3 h may well coverthe zero value.
0 12 12 1224 24 2417 18 19 20
0.02
0.01
0
+15
+10
+5
0
-5
-10
34
21
0
0
-10-20-30
+50
0
-50
Date in July 1988
δg (µ
Gal
)D
s (n
T)
Th
δD (
mm
x 1
0 )-2
Ts (
g.m
in
)-1
1
11
2
22
B
BB
A A A
(Hour)
Fig. 8 Tree no. 2 of Picea abies was growing in darkness (indicatedby the stippling of the whole panel). Ts was at a minimal level ofapproximately 0.01 g H2O min−1. Details of other measurements are asmentioned in the legend to Fig. 6
0 12 24 24 2412 1224 25 26
Date in March 1991
+100
+50
0
-50
-100
11
10
9
8
7
6
5
4
3
δg (µ
Gal
)
δD (
mm
x 1
0 )-2
A
A AB B
B1
12
2
(Hour)
Fig. 9 Time series of δD(black line) recorded from astem of Juglans regia duringMarch 1991 and the contempo-raneous variations of δg(red line)
P.W. Barlow et al.

Results and discussion
Variation in stem diameters and lunisolar tidal acceleration
Results are presented in connection with the hypothesis thata valid, and perhaps causal, relationship exists between δDand δg. Supporting evidence is based on graphicalrepresentations (Figs. 2, 3, 4, 5, 6, 7, 8, 9 and 10) of thesetwo variables and also upon quantitative and statisticalevaluations of the original numerical data. Both perspec-tives are discussed below.
Trees at an open-air site: results from Vallombrosa
Time series of δD recorded during September 1976 from astem of T. cordata, as well as the corresponding lunisolartidal values δg, are shown in Fig. 2. Values of δD obtainedvia extensometer channel 7 reveal that peaks of δDapproximately coincide with the first peak A of each A,Bpair of peaks of δg. This pattern, however, is not exactlyreplicated in results gained simultaneously from extensom-eter channel 9, positioned lower down the same stem. On20 September, peak 1 of δD is associated with peak B of thepaired A,B peaks of δg. Later, on 21–23 September, theshoulder (1) of δD values is showing a decline and peak 2of δD appears to have ‘back-tracked’ and to associate moreclosely with the B peak of the paired A,B peaks of δg(Fig. 2). Thus, the peaks of δD from the two channels 7 and9 developed at different times; they coincided with differentpeaks (A and B) of δg, and perhaps showed indications ofchanging their association with one or other of the δgpeaks.
The record of δD via extensometer channel 9 from T.cordata on 27 June to 1 July 1977 (Fig. 3) is similar to thepattern of δD during September 1976 (cf. channel 9 inFig. 2). The single peaks of δD follow the second peak Bof each of the paired A,B peaks of δg. However, the
simultaneously recorded single peaks of δD obtained froma nearby tree of L. tulipifera, via extensometer channel 11,are associated with the A peaks of the A,B pair of peaksof δg.
From these results (shown in Figs. 2 and 3), it is evidentthat different locations on the same tree, or at locations ontwo nearby trees, can display different temporal patterns ofδD. Other data (not shown here) also displayed this feature(see Cantiani 1978). Thus, at one location, the pattern of δDis not necessarily synchronous with respect to the pattern ofδD at another location: This is because one location on astem may respond to the A peak of the A,B pair of δgpeaks, whereas another location may respond to the B peak.
Results from P. menziesii (Fig. 4) not only show featuressimilar to those displayed by Tilia but also demonstrateanother remarkable property. As noted by Cantiani (1978),segments of a branch cut from a tree continued to showdaily variations of δD for as long as the cambium remainedalive, which may be for 6 months or more. In one such case(Fig. 4), the peaks of δD (from extensometer channels 5 and6) coincided with one or other of the paired peaks of δg.Extensometer channel 6, located against the secondaryxylem (i.e. below the bark), recorded peaks of δD whichcoincided with the A peaks of the paired A,B peaks of δg.Readings from channel 5 located on the surface of the barkshowed peaks of δD coinciding with the B peaks of δg. Aset of ‘control’ data recorded from channel 2 on the stemfrom which the branch segments had been cut showed thesame rhythm of δD as did the excised branch portions atchannel 5 (Fig. 4). A second cut segment showed the samepattern of variation of δD as did the one already mentioned(data not shown, but see Cantiani 1978).
A root of P. menziesii was studied during September1976. Variations of δD were generally in near-synchronywith the rhythm of δD displayed in the stem to which theroot was attached (Fig. 5). However, whereas extensometerchannel 4 located on the root recorded ten peaks of δD
0 1227 28 29
12 1224 2424
70
60
50
40
30
20
10-100
-50
0
+500.2
0.15
0.1
0.05
Date in February 1988
δg (µ
Gal
)
δD (
mm
x 1
0 )-2
Ts (
g.m
in
)-1
AA A
BB
B
(Hour)
Fig. 10 Time series of δg(red line) and the simultaneouslyrecorded δD (black line) andtranspiration rate Ts (blue line)from a stem of Abies alba duringFebruary 1988. This tree wasgrown in a 12-h light/12-h darkcycle (dark periods are stippled)
Tree-stem diameter, Moon and cosmogeomagnetism

during the 5-day recording period, channel 1 located on thestem recorded five peaks of δD during the same period. Forthe root, every first peak of δD (peak 1) coincided with anA peak of the A,B pair of δg peaks. The other, alternatepeaks of δD (peak 2) coincided (at least on 20–23September 1976) with the B peaks of δg (Fig. 5).
The peaks of δD in the stem recorded by channel 1 arebroad and each may be a double peak (1,2). The first (1) ofthe paired stem peaks of δD coincided with the B peak ofthe A,B pair of peaks of δg (Fig. 5).
It is not clear why the root should be more sensitive toδg than the shoot (i.e. more peaks of δD developed in agiven time and did so apparently in response to each peakof δg). The same patterns of δD in this root and this shootwere expressed in the following year, between 19 and 26April 1977 (data not shown, but see Cantiani 1978, Fig. 3).Judging by the markedly different amplitudes of δD in theroot (variation of about 0.25 mm per cycle) and shoot(variations of 2.5 mm) (Fig. 5), the respective wavelengthsof δD may be related to the thickness of the bark tissue(thinner in the case of root, thicker in the case of the stem).
Trees in a growth cabinet: results from Firenze
Data concerning δD were obtained from Pinus abies byCantiani and Sorbetti Guerri (1989). Observations made on9–12 July 1988 were the first of three experiments into theeffect of transpiration on δD, though discussion of thistranspirational aspect will be deferred until later in thissection. A tree referred to as tree no. 2 (another tree of P.abies, tree no. 1, was found to give similar results) wasgrown in 12-h light/12-h dark conditions. Paired peaks (1,2)of δD can be discerned about 4 h after the correspondingpaired peaks A,B of δg (Fig. 6). In a second experiment,during the period 12–19 July, when tree nos. 1 and 2 werenow growing in continuous light, the pattern of δg had notaltered substantially, but now there was closer correspon-dence between the paired peaks of both δD and δg (Fig. 7).
The third experiment took place on 17–20 July 1988.Tree no. 2 of P. abies was now grown in continuousdarkness (Fig. 8). The data recorded for δD are particularlyimportant because they were presented by Zürcher et al.(1998) in connection with these authors’ suggestion of alink between δD and the lunisolar tidal acceleration δg. Thedarkened growth cabinet was used in order to minimise(but not abolish) the possible effect of transpiration uponδD. The results (Fig. 8) show not only how the paired A,Bpeaks of δg had developed from the time some days earlierwhen the experiment commenced (cf. Figs. 6 and 7) butalso reveal that during the 75-h recording period, threerelatively ‘strong’ first peaks (1) of δD developed inapproximate coincidence with three correspondingly‘strong’ A peaks of δg (Fig. 8). On the two whole days of
18–19 July, two alternate peaks (2) of δD developed shortlybefore the second, ‘weak’ B peak of δg (Fig. 8).
Given the good coincidence between peaks of δD and δgin mid-July 1988 (Fig. 7), it can only be conjectured howthe slight mismatch of the peaks arose at the later datesshown in Fig. 8. Nevertheless, it can be seen that the timebetween each successive A and B peaks in a pair of suchpeaks of δg lengthened over the observation period duringJuly. It may be that the biological system had beencontinually attempting to develop a rhythm of its own (asolar rhythm, say, or one developed in response to theearlier light/dark regime) and that this was continuallybeing challenged by the ever-changing lunar rhythm. Inaddition, any dilatation rhythm initiated in the tree stem (tofollow a lunar rhythm, say) might require some time toadjust to the changing pattern of δg. Complete coincidenceof the δD and δg rhythms may occur only rarely. The tworhythms are usually out of phase due to the changing lunarrhythm and the inertia in the dilatation rhythm. Hence, asobserved in the quantitation of such results (Table 2), thecorresponding time delays between δD and δg lead mostlyto positive and also to a few negative values of L.
Concluding these visual assessments are results whichconfirm the apparently consistent positive relationshipbetween δD and δg. They were obtained from the hardwoodspecies, J. regia and M. germanica. In the case of datafrom J. regia, the graph of δg (Fig. 9) shows the evolutionof the maximal values during the 3 days of observationduring March 1991. It can only be conjectured as to howthe development of δg at earlier dates influenced theillustrated pattern of δD (Fig. 9). However, on 25–26March, there are hints of an apparent splitting of the δDmaxima into two peaks, 1 and 2 (Fig. 9), a split whichcoincides with the splitting of the maximum of δg into twopeaks A and B.
Results from M. germanica were more complicated thanin any other species analysed. When the Mespilus tree wasgrown in a 12-h light/12-h dark regime the pattern of δDvalues revealed broad double (1,2) peaks (data not shown)that coincided with the A and B peaks of δg. Later, whenthe same tree was transferred to darkness, a third daily peak(3) of δD was evident (data not shown). Two of the threepeaks of δD values coincided with maximal δg values.Values of the time-delay L were easily obtained (Table 2).
Geophysical variables and stem diameter variations
A preliminary assessment of the relationship between twogeomagnetic variables—Thule index Th and DisturbanceStorm Time index Ds—and δD was made in connectionwith the data collected from P. abies (Figs. 6, 7 and 8),A. alba and J. regia. In the case of P. abies, visualinspection of the graphs in Figs. 6, 7 and 8 indicates
P.W. Barlow et al.

possible correspondences between Th and δg and, hence,between Th and δD. However, the index Ds had,apparently, a different rhythm to that of Th. The changingpattern of Ds therefore appears to be independent of, andunlikely to be positively correlated with, any pattern whichapplies to either δg, δD or Th.
Given the respective short and long wavelengths of δDfor root and stem of P. menziesii (Fig. 5), a record of Thwas taken in case this parameter could in some wayunderlie the greater sensitivity of roots to δg compared tothe stem: i.e. Th may sensitise the root tissue to variationsof δg. In this case, however, the time series of Th did notseem support this notion (data not shown).
Transpiration rates and stem diameter variations
It is necessary to provide some explanation not only for therhythm of δD but also for its apparent relationship withlunar gravity. To this end, transpiration rates Ts in twospecies of conifer, P. abies and A. alba, were examined[as was done originally by Cantiani and Sorbetti Guerri(1989)], using these authors’ data, to assess whether Tscould be a candidate determinator of δD: in particular,whether the daily rise and fall in the values of δD werepreceded, or were coincident, with increases and decreasesof Ts. This topic evidently requires an in-depth examinationof both the internal and external factors, which may be
Table 2 Times delays (Lv, h) between peaks of δg and δD for various species of softwood and hardwood trees
Species Species Date of recording δg peak (A or B);δD peak (1 or 2)
No. of δD peaksconsidered
Lv Figures
Tilia cordata S1; channel 7 19–23/09/1976 A 5 +3, +3, +2, +1, +1 2
T. cordata S2; channel 9 20–23/09/1976 B; 1 4 0, 0, 0, – 2
T. cordata S2; channel 9 20–23/09/1976 B; 1,2 (smoothed) 4 +5, +5, +5, +2 2
T. cordata S3; channel 9 25/06–02/07/1977
B 8 +8, –, +7, +1, +3, +7, +3, +3 3
Liriodendrontulipifera
S4; channel 11 25/06–02/07/1977
A 9 +7,+3,+7,+1, +1, −1, +2, 0, 0 3
Pseudotsuga menziesii S6; channel 6 24/06–02/07/1977
A 9 +4.5, 0, 0, +1.5, +3, 0, +1.5, 0, 0 4
P. menziesii S5; channel 5 24/06–02/07/1977
B 9 +3, 0, +1.5, 0, 0,+1.5, +1.5, 0, 0 4
P. menziesii S7; channel 2 24/06–02/07/1977
B 9 +4.5, 0, +4.5, 0, +1.5, +1.5, 0,+1.5, +1.5
4
P. menziesii S8; channel 4 19–23/09/1976 A; 1 5 +3, +2, +1, +1, +1 5
P. menziesii S8; channel 4 19–23/09/1976 B; 2 5 –, +6, +2, +2, +1 5
P. menziesii S9; channel 1 19–23/09/1976 B; 1 and 2(smoothed)
5 +5, +6, +4, +4, +1 5
P. abies S10 09–12/07/1988 A; 1 3 +4, +4, +5 6
P. abies S10 09–12/07/1988 B; 2 3 –, +4, +2 6
P. abies S10 09–12/07/1988 A,B; 1,2 (bothpeaks smoothed)
3 –, +4, +4 6
P. abies S11 13–16/07/1988 A; 1 3 +1, +1, +2 7
P. abies S11 13–16/07/1988 B; 2 3 +1, 0, – 7
Picea abies S12 17–20/07/1988 A; 1 3 +3, +1, 0 8
P. abies S12 17–20/07/1988 B; 2 3 −1, −3, – 8
Abies alba S13 27–29/02/1988 A 3 0, 0, +2 10
Juglans regia S14 24–26/03/1991 A, B; 1,2 (bothpeaks smoothed)
3 +4, +3, 0 9
Mespilus germanica S15 10–12/10/1989 A/2 3 −3, −2, – Not shown
M. germanica S15 10–12/10/1989 B/1 3 +2, +2, +1 Not shown
M. germanica S16 21–24/10/1989 A/3 4 0, 0, 0, 0 Not shown
Where there were clear peaks of the respective variables, the estimates of Lv are printed in the temporal sequence in which they developed. Apositive value of Lv means that a peak of δg occurred in advance of a peak of δD; a negative value indicates the converse. A zero value of Lvindicates coincidence of peaks of both δg and δD. A blank value (–) for Lv indicates that no value could be obtained due to absence of anevident peak. The column ‘Figures’ indicates the figure in the text which illustrates the peaks from which Lv values were estimated. However,sometimes, for reasons of space, not all peaks can be illustrated (see Figs. 3 and 4). These unseen peaks have, nevertheless, provided estimatesof Lv; these values are printed in italic type. Estimates of Lv are also given for Mespilus germinica even though its results are not illustratedwith figures in the text.
Tree-stem diameter, Moon and cosmogeomagnetism

involved. Nevertheless, we venture the following prelimi-nary observations.
The graphs presented in Figs. 7 and 8 indicate that, inP. abies, stem diameter variations are independent ofvariations of Ts: in the two cases illustrated, Ts was heldat two different constant rates by either light or dark growthconditions, yet the stem continued to show variations ofdiameter. Therefore, at present, the sole candidate determi-nator of δD is δg.
There is, nevertheless, a superficially attractive reciprocalrelationship between Ts and δD (Figs. 6 and 10). However,the alternating light and dark periods used in the experimentswith P. abies and A. alba may have led to a relationshipbetween δD, Ts and δg that was different to that expressedwhen constant light or dark regimes were used. Given thatthere are three variables, Ts, δD and δg, and irrespective ofthe lighting regime employed, the results in Figs. 6 and 10imply two possibilities with respect to δD: that Ts is adeterminator of δD or that δD is a determinator of Ts; in eachcase, δg is a co-determinator of δD. The use of thealternating 12-h light/12-h dark regime might help to resolvethis problem, but only if the light or dark phases could beshown to influence one of the variables, say Ts, indepen-dently of the other, say δD. Figure 6 shows that, as would beexpected, Ts increased rapidly to reach a maximum value(quantitatively similar to the value achieved in continuallight, cf. Fig. 7) shortly after the onset of the light period.Later, Ts declined upon the onset of darkness. However, thequestion is whether there were additional or independentinfluences that could regulate Ts. It is notable that, in the twowhole days of observation, the decline of Ts coincided withthe attainment of the A peak of the paired A,B peaks of δg.Likewise, the onset of the rapid increases of Ts coincidedwith rapid decreases in δg from its B peak (Fig. 6).
The observations from A. alba, where a 12-h light/12-h dark regime was also employed, confirm the possibleinterrelationships between the three variables, Ts, δD andδg, as described above for P. abies. Ts increased most steeplywhen the light period commenced (Fig. 10), but this increasealso coincided with a fall from the A peak of δg. Ts declinedrapidly when the light period terminated, but this declinecoincided with the decline of δg from their B peak maxima.Although not mentioned earlier, it can be seen in Fig. 10—aswe have come to expect—that successive maxima of δDcoincide with successive peak values of δg, in this case withthe A peak of the A,B pairs of peaks.
In both P. abies and A. alba, it is noteworthy that therewas a slow increase of Ts during the dark period, before thelight period commenced (Figs. 6 and 10). In both cases, theincreases coincided with the increase in δg values.Although the rapid increase in Ts was surely triggered bythe onset of light, nevertheless, in both species of trees, theincreases in Ts also coincided with rapid downturns of δg.
For Abies, the relevant downturns were those of the Apeaks of δg, whereas for Picea, it was those of the B peaks.It may be a coincidence that the transitions between lightand darkness in both these experiments occurred at the timeof a peak of δg values.
Quantitative evaluations
Stem diameter variations in relation to lunisolar tidalacceleration
Visual inspection Time series of δD (Figs. 2, 3, 4, 5, 6, 7, 8,9 and 10) nearly always demonstrated that each peak of δDfollowed a peak of δg after a short time delay. These delays(δD after δg), as judged from visual inspection, areindicated as positive values of L in Table 2 (here denotedby Lv). Values of 0, +1 and +2 h are quite characteristicof the delay between δg and the following δD. Had thedelays been more random, rather than putatively beingrelated to the timing of the peak of δg, then they wouldhave shown values between 5 and 12 h, these being thehalf-period between pairs of peaks A,B and major singlepeaks.
In a few cases, Lv had a negative value (Table 2) due to apeak of δD preceding the nearest peak of δg. The negativevalues, however, may indicate variation in the putativeresponse of δD to δg. Presumably, there is some inertia inthe biological system regulating stem diameter; hence, −Lv
values should not necessarily be taken as evidence of abiological event anticipating a geophysical event (Khabar-ova 2004). As suggested above, such anticipation may ariseas a consequence of the particular structure of biologicalrhythms vis à vis lunar rhythms.
Statistical evaluation The principal statistical assessmentswere made with respect to the relationships between δD andδg and between δD and Th. Searches were also made forcoherences within the time series of δD and δg. In the case ofthe dark-grown tree no. 2 of P. abies, cross-correlationindicated that the possible effective delay of δD after δg was22 h (Fig. 11). This result is similar to that revealed by visualinspection (Table 2). The plot of the parabolic regressionbetween δD and δg, with the –3 h adjustment due to thevalue of L, is shown in Fig. 12. In the case of A. alba, thedelay for the positive relationship of δD with δg had a similarvalue.
Regressions and cross-correlations relating δD withTh indicated significant relationships (Figs. 12 and 13).Using data set S11 relating to P. abies and therelevant time-delay-adjusted values of Th and of δg, thefollowing regression equations were obtained (seeFig. 12): dD ¼ 9:7þ 0:09dg� 0:001dg2 P < 0:001ð Þ anddD ¼ 13:0� 1:84Th� 0:975Th2 P < 0:001ð Þ. Using data
P.W. Barlow et al.

set S13 relating to A. alba, the corresponding regressionequations were as follows: dD ¼ 39:3� 0:21dg P < 0:001ð Þand dD ¼ 56:9� 24:94:Th P < 0:001ð Þ. If δg influencesthe values of Th, then a putative direct influence of Th onδD is unlikely. However, in consideration of the results
from assessments of coherence (see following paragraph),it would be premature to rule out a geomagnetic influencefrom Th using arguments based on regression analysis. Agraphical summary of the relationships between δD, δgand Th, as they apply to P. abies, is given in Fig. 14.
r
r
r = +.59
-3 h +22 h
-11.5 h
L (h)L (h)
δg δDδg δD
-1
+1
-6 -1-30 -20 -10 0 +10 +20 +30
r = -.38
Fig. 11 Cross-correlation between δg (independent variable) and δD(dependent variable) using data set S12 from Picea abies (cf. Fig. 8).Vertical axis shows the correlation coefficient, r; horizontal axisshows the time delay L between the two fitted sinusoids correspondingto δg and δD. Positive L values for a time delay of δD after δg(denoted as δg→δD in the graph) belong to the right-hand horizontalsemi-axis, whereas negative L values for the opposite delay of δDadvanced before δg (δg←δD) belong to the left-hand semi-axis. For
the peaks, Lxy=Lδg→δD=+22 h, Lyx=L (δg←δD)=3 h, both togetherconstituting the period length of 25 h. In addition to the pointestimates of r for separate values of L (bold solid line), a 95%confidence corridor for r is also given (upper and lower thinner lines).Significant departures of the r value from 0 are indicated by shadingand stippling in the area between the horizontal axis and theconfidence corridor. The direction of time-shifting is marked by thearrow, the head of the arrow pointing to the delayed variable
20
10
0
-10
-75 -50 -25 0 +25 +50 +75
+4+3+2+10-1Th
δg (µGal)
δD on δg
δD on Th
δD (
mm
x 1
0 )-2
Fig. 12 Parabolic dependencesof δD upon Th and δD upon δgare shown in relation to dataset S12 from Picea abies(cf. Fig. 8). The limits of the95% confidence corridors forboth relationships are indicatedby the stippled areas. Thevalues used for δD, δg and Thare those which had been de-rived from the respective delaysin relation to δD (cf. Figs. 11and 13). The regression equa-tions are given in the text. Thedelay of δg after δD is 3 h forthe peak of the correlation coef-ficient and that of Th after δD is22 h for the trough
Tree-stem diameter, Moon and cosmogeomagnetism

It would be difficult, if not impossible, to test whichrelationship is more in accord with the time series of δD, a24.0-h solar rhythm or a 24.8-h lunar rhythm. With regardto the hypothesis that, in the data gained from P. abies, asolar rhythm regulates the changes in δD, the correspondingcoefficient of determination (CD, i.e. the square of thecorrelation coefficient, which tells of the proportion of the
total variance in the data explained by the regression) is0.905. However, if the hypothesis is that a lunar rhythm isthe determinant, then the estimated CD is 0.917. Likewise,data from A. alba reveal the CDs in relation to δD to be0.989 (solar) and 0.984 (lunar). These analyses speak for analmost statistically indistinguishable participation of Sunand Moon in the regulation of δD, where A. alba is
r +1
r -1
-30 -22
0 +20
+30
L (h)-10 +10+13-20
r -.64
Fig. 13 Cross-correlationsimilar to that shown in Fig. 11but dealing with the relationbetween δD and Th. The datafor these geophysical variablescoincide with data pertaining tothe biological variables fromdata set S12 for P. abies(cf. Fig. 8). The conventions forinterpreting the correlogram areas in the legend for Fig. 11.Note that the log value ofL=+13 h of δD after Th mayalso extend to L=+15 h or more,and thus accomodate the valueof L*=+15.6 h indicated inFig. 14, which was evaluatedby cosinor analyis
+100
0
-100
+20
+10
0
-5.0
+4
+2
0
-20 12 12 1224 24 24
191817
Date in July 1988
δg
(µG
al)
δD
(m
m x
10
)
-2T
h
24.8 h
24.8 h
24.8 h
L* = +22.6 h
L* = +15.6 h
(Hour)
Fig. 14 Simplified cosinoranalyses of data relevant toPicea abies gathered duringmid-July 1988 (cf. Fig. 8). Thedata relate to δg, δD and Th.Time delays (L*) betweensuccessive peaks are indicated(cf. Figs. 11 and 13). Note thatthe double peaks of δg and δD(cf. Fig. 8) have been smoothedas single sinusoids, therebyremoving some of the nuanced‘highlights’ of these variables.The original data for δD (circle)relate to tree no. 2 of P. abiesand have been presented byCantiani and Sorbetti Guerri(1989) and by Zürcher et al.(1998). Circalunidian (24.8 h)cycling with its harmonics isevident for each variable. Thebroken vertical lines mark thelimits of a 24.8-h lunar ‘day’.The 95% confidence corridors(narrow bands) and 95% toler-ance corridors (broad bands)around the respective regres-sions are shown
P.W. Barlow et al.

concerned, whereas for P. abies there is indication of aslight predominance of an effect from the Moon on δD.
The two data sets S11 and S13 were searched forcoherence using ordinary, multiple and partial cross-spectral analyses to obtain the respective coefficients fromseparate period lengths. A test of data (S11) from P. abiesshowed that ordinary coherence between δg and δD wassignificant for the periods under 3 h and over 9 h; multiplecoherence was significant between δD with Th, on the onehand, and between δg with Th, on the other hand, for theperiods under 2 h and over 21 h; partial coherence betweenδg and δD after exclusion of Th was non-significant, butbetween δD and Th, excluding δg, it was significant for theperiods 3.6–3.8 and 12.8 h. These findings speak in favourof mutual links between the actions of macrocosmic forces(lunisolar gravity and Thule index) in the regulation of treestem diameter variation. In fact, variations in Th whichcoincided with the δD values gathered from J. regia (Fig. 9)also showed some small positive correlation (data not shown).Clearly, a much larger study is needed to establish (or deny)these relationships, but nevertheless, these preliminary assess-ments indicate that there is a statistical methodology capableof revealing hitherto unlooked-for interrelationships.
Lunisolar tidal acceleration in relation to geomagneticactivity
Although relationships between different geophysical varia-bles are beyond the scope of the present paper, they should,nevertheless, be briefly mentioned because they bear on thepossibility that Th and δg together may affect δD.
In view of the possibility that Earthly and lunar gravitycan influence the geomagnetic flux (Maeda 1968), threetime series S12, S13 and S14 were examined to see ifany relationships were apparent between the numerical datafor Th and δg contained therein. These variables showedplausible correlative interrelationships (CD=0.905 and CD=0.962) in two of the three time series (from S12 and S13).However, relationships between Th and δD were found to beweak (CD=0.57, approximate) in all three cases.
General discussion
In general, there were many close correspondences betweenpeaks and troughs of δD and δg, as well as significantstatistical correlations between the respective time series ofthese variables. In some cases, δD peak 1 (say) visiblytracked δg peak A; in other cases, it was δg peak B that wastracked by δD (Figs. 2 and 3). This feature may explainwhy some simultaneously obtained records of δD were notin synchrony with each other, even though they concernedparts of the same tree or related to two neighbouring trees
(Liriodendron and Tilia, Fig. 3). This means that care mustbe taken when analysing and discussing these types of data.Moreover, some caution needs to be exercised in pursuingrelationships with the A and B peaks of δg until the fullpicture of lunisolar gravity can be obtained by estimatingalso its horizontal component. An implication of theobservation of asynchrony of δD within or between trees isthat the changing modes of δg are closely tracked andresponded to by whatever internal biological system regu-lates δD in the stems and roots. Comparisons of the delaybetween δg and δD, as assessed by visual and statisticalevaluations, indicate some differences between them. This islargely because the statistical approach, at least as used here,amalgamates paired peaks of δg and δD into single peaks.The maximal values of each peak in a pair obviously willinfluence the fitting of sinusoids. The visual approach,however, retains the important nuances in the plotted data.
Regarding the biological regulator of δD and the trans-duction and integration of lunisolar gravity δg, nothing is yetknown of the thresholds of perception (Volkmann andTewinkel 1996; Barlow and Powers 2005) of this particulargeophysical variable. All observed peaks and troughs of δgwere accompanied by analogous peaks and troughs of δD. Itmay be that, in the cases of the tree species studied,sufficient variation of δg was experienced to producecorresponding variations in δD. The height from the groundof the recording point on the tree stem was one factor, whichinfluenced the amplitude of δD (Cantiani and Sorbetti Guerri1989) but, as already indicated, this may be attributed to thethickness of the bark according to its age.
Ideally, correlations between δg, δD and Ts should besought throughout a complete lunar month, thus accommo-dating the changing relationships brought about by thechanging modes of δg. Softwood conifers seem ideal to testsuch relationships since they transpire and show rhythmicvariations in δD throughout the year. Remarkably, theirbranches and trunks exhibit this rhythm even whenremoved from the living tree and cut into segments(Fig. 4). This finding alone is sufficient to dispel the notionof a relationship between transpiration and δD, and thesame conclusion is reached from observation on trees thathave been defoliated or their crowns removed: thedilatation rhythm of δD persists (Cantiani and SorbettiGuerri 1989). Nevertheless, some workers (Vesala et al.2000; Sevanto et al. 2003) persist with the view that waterpotential and transpiration underlie stem diameter variation.The above-mentioned observations do not accord with sucha notion. Moreover, it is difficult to see how the publisheddata of Sevanto et al. (2003) support their view in anyconvincing way: Their data for δD from two species oftrees put alongside the corresponding transpiration data donot indicate any particularly logical relationship— and,unfortunately, the authors omit from the graphs the rather
Tree-stem diameter, Moon and cosmogeomagnetism

crucial sign (+ or −) for the δD values (see their Figs. 1and 2).
The pattern of peaks and troughs of lunisolar δg may actas a timekeeper capable of regulating cyclical effects onplant functioning induced by solar rhythms. The timekeepercontinually brings a solar-driven rhythm back into line witha lunar rhythm. This could account for the difficulty, orimpossibility, of unambiguously attributing variation of δDto either Sun or Moon because influences from both are atwork continually and simultaneously (Brown 1976). Some-times, independent receptors for the Sun and Moon effectson biological rhythms have been proposed (Webb andBrown 1959). Even though geomagnetic forces are weakand poorly understood in relation to life, they evoke clearresponses in relation to biological processes (Brown 1976).A general conclusion derived from consideration of δD–δginterrelations might be summed up in the words of Burr(1945): “It is, therefore, not at all impossible that the lunarcycle produces, in some as yet undiscovered way, tides in thetree. Moreover,...since growth in trees is in part a matter ofhydration, it may eventually turn out that the effect of thelunar cycle...is as direct as on the [marine] tidal level.”
Variations in Thule index often did not appear to accordwith either changes in lunar gravity or the biological eventsstudied, though they did so weakly in three cases (seeFigs. 6, 13 and 14). However, it should not be forgotten thatputative influences from lunar gravity could be products ofa nexus of cosmic influences (Brown 1964; Vasil’eva1998), reflecting an earlier view of Tchijevsky who pointedout2 that apparently chaotic biological/geophysical relation-ships might become explicable when much more is knownabout cosmic cycles (Tchijevsky 1940). While such cyclesoften take months or years to complete (Breus et al. 1995),in the present cases, the responses of trees to δg were rapid,being accomplished within a few hours (Table 2).
The possible practical importance of these studies shouldbe considered. Zürcher (1999) and Zürcher et al. (2010), aswell as commercial companies such as ‘Tonewood’ (2009)have referred to traditional forestry experiences whichindicate that valuable technical properties of wood aresubject to variation according to the synodic phase of theMoon during which trees are felled. The present findingsindicate that, for practical purposes, relating δg to stemdiameter variation might provide a basis for optimising thetimes of night and day for the felling of trees in relation tosubsequent utilisation of their wood.
Equally important is our hope that, by exposing theserelationships between δg and δD, more discussion may beraised, and hopefully, new and properly controlled experi-ments can be devised, perhaps on a worldwide basis, in orderto capture the continual shift of lunar tidal accelerations. Ifconfirmatory of a relationship between trees and lunar gravity,then new theories of this linkage must be sought, as Dorda(2004) has already attempted, and then experimentallypursued.
Acknowledgement Thanks are due to two anonymous referees fortheir constructive commentaries. In addition, Professors GerhardDorda (Munich) and Ernst Zürcher (Biel) kindly provided supportiveremarks and also useful information in the form of reprints andpreprints of their own publications and those of others. Professor D.T.Clarkson and Dr S. Barlow are also thanked for their patient readingand commentary upon early drafts of this work. Mr Timothy Colbornexpertly prepared the diagrams.
Conflict of interest The authors declare that they have no conflict ofinterest.
References
Ahmad M, Galland P, Ritz T, Wiltschko R, Wiltschko W (2007)Magnetic intensity affects cryptochrome-dependent responses inArabidopsis thaliana. Planta 225:615–624
Akasofu S-I (1982) Interaction between a magnetized plasma flow anda strongly magnetized celestial body with an ionized atmosphere:energetics of the magnetosphere. Annu Rev Astron Astrophys20:117–138
Barlow PW (2007) Foreword. In: Klein G (ed) Farewell to the internalclock. A contribution in the field of chronobiology. Springer,New York, pp vii–xx
Barlow PW, Powers SJ (2005) Predicting the environmental thresh-olds for cambial and secondary vascular tissue development instems of hybrid aspen. Ann Forest Sci 62:565–573
Barlow PW, Klingelé E, Klein G, Mikulecký M (2008) Leafmovements of bean plants and lunar gravity. Plant Signal Behav3:1083–1090
Bartels J (1957) Gezeitenkräfte. In: Flügge S (ed) Handbuch derPhysik – Encyclopedia of physics XLVIII, Geophysik II.Springer, Berlin, pp 734–774
Bartlett MS (1953) An introduction to stochastic processes withspecial reference to methods and applications. CambridgeUniversity Press, Cambridge
Bingham Ch, Arbogast B, Cornélissen GG, Lee JK, Halberg F (1982)Inferential statistical methods for estimating and comparingcosinor parameters. Chronobiology 9:397–439
Breus TK, Cornélissen G, Halberg F, Levitan AE (1995) Temporalassociations of life with solar and geophysical activity. AnnGeophys 13:1211–1222
Brown FA Jr (1964) The biological rhythm problem and its bearing onspace biology. Adv Astronaut Sci 17:29–39
Brown FA Jr (1969) A hypothesis for extrinsic timing of circadianrhythms. Can J Bot 47:287–298
Brown FA Jr (1976) Biological clocks: endogenous cycles synchro-nized by subtle geophysical rhythms. BioSystems 8:67–81
Burr HS (1945) Diurnal potentials in the maple tree. Yale J Biol Med17:727–735
2 “Ainsi les contours chaotiques de tel out el phénomèna dans sesforms dynamiques subissent quand on change de point de vue, unetransformation. Il se révèle comme un movement harmonieux qu’onpeut figurer par une série d’oscillations sinusoïdales soumis dans letemps aux oscillations des forces invisibles de l’energie cosmique ousolaire.” (Tchijevsky 1940, p224).
P.W. Barlow et al.

Cantiani M (1978) Il ritmo di accrescimento diurno della Douglasiadel Tiglio e del Liriodendro a Vallombrosa. L’Italia Forestale eMontana 2:57–74
Cantiani M, Sorbetti Guerri F (1989) Traspirazione e ritmo circadianodelle variazioni reversibili del diametro dei fusti di alcune piantiarboree. L’Italia Forestale e Montana 5:341–372
Cantiani M, Cantiani M-G, Sorbetti Guerri F (1994) Rythmesd’accroissement en diametre des arbres forestiers. Rév ForestFranç 46:349–358
Daudet F-A, Améglio Th, Archilla O, Lacointe A (2005) Experimentalanalysis of the role of water and carbon in tree stem diametervariations. J Exp Bot 56:135–144
Dorda G (2004) Sun Earth, Moon—the influence of gravity on thedevelopment of organic structures. Sudetendeutsche Akad WissKünste, Naturwiss Kl 25:9–44
Galland P, Pazur A (2005) Magnetoreception in plants. J Plant Res118:371–389
Hannan EJ (1970) Multiple time series. Wiley, New York, pp 331–455Khabarova OV (2004) Investigation of the Tchizhevsky–Velhover
effect. Biophys 49(suppl 1):S60–S67Klein G (2007) Farewell to the internal clock. A contribution in the
field of chronobiology. Springer, New YorkLang H-J (1972) Korrelation und Kausalität bei lunaren Period-
izitätserscheinungen in Biologie und Geophysik. In: Rensing L,Birukow G (eds) Mechanismen und Bedeutung schwingenderSysteme. Nachricht AkadWissenschaften Göttingen, Mathematische-Physikalische Klasse, 1972, pp 30–34
Longman IM (1959) Formulas for computing the tidal accelerationdue to the Moon and the Sun. J Geophys Res 64:2351–2355
Maeda H (1968) Variation in geomagnetic field. Space Sci Rev 8:555–590Mayaud PN (1980) Derivation, meaning and use of the geomagnetic
indices. Geophysical Monograph 22. AGU, WashingtonMelchior P (1983) The tides of the planet Earth. Pergamon Press, OxfordMeluzzi G, Sorbetti Guerri F (1989) Apparecchiature per il rilevamento
di movimenti diametrici periodici e della traspirazione di piantearboree. L’Italia Forestale e Montana 5:373–390
Nelson W, Tong YL, Lee J-K, Halberg F (1979) Methods for cosinor-rhythmometry. Chronobiology 6:305–323
O’Brien TP, McPherron RL (2002) Seasonal and diurnal variation ofDst dynamics. J Geophys Res 107(No. A11):1341–1351
Palmer JD (2000) The clocks controlling the tide-associated rhythmsof intertidal animals. BioEssays 22:32–37
Scholz FG, Bucci SJ, Goldstein G, Meinzer FC, Franco AC, Miralles-Wilhelm F (2008) Temporal dynamics of stem expansion andcontraction in savanna trees: withdrawal and recharge of storedwater. Tree Physiol 28:469–480
Sevanto S, Mikkelsen TN, Pilegaard K, Vesala T (2003) Comparisonof tree stem diameter variations in beech (Fagus sylvestris L.) inSorø Denmark and in Scots pine (Pinus sylvestris L.) in HyytiäläFinland. Boreal Env Res 8:457–464
Tchijevsky AL (1940) Cosmobiologie et rythme du milieu extérieur.Acta Med Scand Suppl 108:211–226
Tomaschek R (1957) Tides of the solid Earth. In: Flügge S (ed)Handbuch der Physik—Encyclopedia of physics XLVIII, GeophysikII. Springer, Berlin, pp 775–845
Tonewood (2009) Moon wood. General feature and characteristics ofTonewood. http://www.tonewood.ch/moonwood.html, accessed26/11/2009
Troshichev OA, Dmitrieva NP, Kuznetsov BM (1979) Polar capmagnetic activity as a signature of substorm development. PlanetSpace Sci 27:217–221
Vasil’eva NI (1998) Correlations between terrestrial and spaceprocesses within the framework of universal synchronization.Biophys 43:658–659
Vesala T, Sevanto S, Paatero P, Nikinmaa E, Perämäki M, Ala-NissiläT, Kääriäinen J, Virtanen H, Irvine J, Grace J (2000) Do treestems shrink and swell with the tides? Tree Physiol 20:633–635
Volkmann D, Tewinkel M (1996) Gravisensitivity of cress roots:investigations of threshold values under specific conditionsof sensor physiology in microgravity. Plant Cell Environm19:1195–1202
Volland H (1988) Atmospheric tidal and planetary waves. Kluwer,Dordrecht
Webb HM, Brown FA Jr (1959) Timing long-cycle physiologicalrhythms. Physiol Rev 39:127–161
Zhou S-A, Uesaka M (2006) Bioelectrodynamics in living organisms.Int J Eng Sci 44:67–92
Żurbicki Z (1973) Atmospheric electricity and plant nutrition. ActaHort 29:413–427
Zürcher E (1999) Lunar rhythms in forestry traditions—lunar-correlated phenomena in tree biology and wood properties. EarthMoon Planets 85–86:463–478
Zürcher E, Cantiani M-G, Sorbetti-Guerri F, Michel D (1998) Treestem diameters fluctuate with tide. Nature 392:665–666
Zürcher E, Schlaepfer R, Conedera M, Giudici F (2010) Lookingfor differences in wood properties as a function of the fellingdate: lunar phase-correlated variations in the drying behaviourof Norway spruce (Picea abies Karst.) and sweet chestnut(Castanea sativa Mill.). Trees 24:31–41
Zweifel R, Item H, Häsler R (2000) Stem radius changes and theirrelation to stored water in stems of young Norway spruce trees.Trees 15:50–57
Tree-stem diameter, Moon and cosmogeomagnetism