treatments to reduce the frequence of freeway exit sign hits
TRANSCRIPT

Technical Report Documentation Page 1. Report No. FHWA/TX-11/0-6120-1
2. Government Accession No.
3. Recipient's Catalog No.
4. Title and Subtitle TREATMENTS TO REDUCE THE FREQUENCY OF FREEWAY EXIT SIGN HITS
5. Report Date January 2011 Published: June 2011 6. Performing Organization Code
7. Author(s) Geza Pesti, Kwaku Obeng-Boampong, Praprut Songchitruksa, and LuAnn Theiss
8. Performing Organization Report No. Report 0-6120-1
9. Performing Organization Name and Address Texas Transportation Institute The Texas A&M University System College Station, Texas 77843-3135
10. Work Unit No. (TRAIS) 11. Contract or Grant No. Project 0-6120
12. Sponsoring Agency Name and Address Texas Department of Transportation Research and Technology Implementation Office P.O. Box 5080 Austin, Texas 78763-5080
13. Type of Report and Period Covered Technical Report: September 2008–August 2010 14. Sponsoring Agency Code
15. Supplementary Notes Project performed in cooperation with the Texas Department of Transportation and the Federal Highway Administration. Project Title: An Evaluation of the Performance of High-Impact Signs URL: http://tti.tamu.edu/documents/0-6120-1.pdf 16. Abstract Exit gore signs present a significant maintenance challenge for TxDOT. There is concern regarding the safety of personnel working in gore areas to replace these signs, and the resources necessary for continual maintenance. The objective of this project was to identify and evaluate alternative methods that may reduce the number of sign hits. Researchers visited several sites with safety problems related to frequent sign hits, determined factors that contribute to sign crashes, and recommended potential treatments. They also evaluated the impact of eliminating exit gore signs at locations where appropriate advance warning with overhead exit signs are provided. Field studies were conducted at two freeway exits in Corpus Christi, Texas. It was found that the lack of exit gore signs at the two freeway exits did not have any negative consequences in terms of vehicle speeds, deceleration behavior, and erratic maneuvers. 17. Key Words Exit Gore, Exit Gore Sign, High-Impact Signs, Frequently Hit Roadside Signs
18. Distribution Statement No restrictions. This document is available to the public through NTIS: National Technical Information Service Alexandria, Virginia 22312 http://www.ntis.gov
19. Security Classif. (of this report) Unclassified
20. Security Classif. (of this page) Unclassified
21. No. of Pages 108
22. Price
Form DOT F 1700.7 (8-72) Reproduction of completed page authorized

TREATMENTS TO REDUCE THE FREQUENCY
OF FREEWAY EXIT SIGN HITS
by
Geza Pesti, Ph.D., P.E. Associate Research Engineer Texas Transportation Institute
Kwaku Obeng-Boampong, P.E. Associate Research Engineer Texas Transportation Institute
Praprut Songchitruksa, Ph.D., P.E. Associate Research Engineer Texas Transportation Institute
LuAnn Theiss, P.E. Associate Research Engineer Texas Transportation Institute
Report 0-6120-1 Project 0-6120
Project Title: An Evaluation of the Performance of High-Impact Signs
Performed in cooperation with the Texas Department of Transportation
and the Federal Highway Administration
January 2011 Published: June 2011
TEXAS TRANSPORTATION INSTITUTE The Texas A&M University System College Station, Texas 77843-3135


v
DISCLAIMER
This research was performed in cooperation with the Texas Department of Transportation
(TxDOT) and the Federal Highway Administration (FHWA). The contents of this report reflect
the views of the authors, who are responsible for the facts and the accuracy of the data presented
herein. The contents do not necessarily reflect the official view or policies of the FHWA or
TxDOT. This report does not constitute a standard, specification, or regulation.
This report is not intended for construction, bidding, or permit purposes. The engineer in
charge of the project was Geza Pesti, P.E. #95840. The United States Government and the State
of Texas do not endorse products or manufacturers. Trade or manufacturers’ names appear
herein solely because they are considered essential to the object of this report.

vi
ACKNOWLEDGMENTS
This project was conducted in cooperation with TxDOT and FHWA. The researchers
acknowledge the support and guidance provided by Ismael Soto, Project Director; Andrew
Oberlander, Douglas Skowronek, Edgar Fino and Michael Jedlicka, project advisors; and Wade
Odell, Research and Technology Implementation (RTI) Office research engineer. The
contribution of Steve Venglar, Jerry Ullman, Gary Barricklow, and Derek Ladd, TTI researchers,
is also greatly appreciated.
vii
TABLE OF CONTENTS
Page List of Figures ............................................................................................................................... ix List of Tables ................................................................................................................................ xi Introduction ................................................................................................................................... 1
Research Objective ..................................................................................................................... 1 Research Approach ..................................................................................................................... 1
State-of-Practice ............................................................................................................................ 3 Review of Literature ................................................................................................................... 3
Definitions............................................................................................................................... 3 Design of Gore Area ............................................................................................................... 4 Barrier End Treatments and Crash Cushions .......................................................................... 7 Delineation .............................................................................................................................. 9 Manual of Uniform Traffic Control Devices (MUTCD) ...................................................... 10 Highway Capacity Manual (HCM) Constrained Weaving ................................................... 10 Driver Expectancy ................................................................................................................ 15 Positive Guidance ................................................................................................................. 15 Consistency ........................................................................................................................... 15 Safety Studies in Gore Areas ................................................................................................ 16 Implications for Field Studies ............................................................................................... 16
Survey of TxDOT Districts ....................................................................................................... 17 Sites with High-Impact Sign Problems ..................................................................................... 27
Review Sites from Survey ........................................................................................................ 27 Site Visits and Diagnostics ....................................................................................................... 29
Site Selection for Detailed Site Diagnostics ......................................................................... 31 Diagnose Sites with Frequent Exit Gore Sign Hits ................................................................... 31
Historical Accident Data ....................................................................................................... 32 Land Use ............................................................................................................................... 32 Geometric Features ............................................................................................................... 32 Hazard Identification and Visibility...................................................................................... 33 Expectancy Violations .......................................................................................................... 34 Driver Information Load ....................................................................................................... 34 Driver Information Need ....................................................................................................... 35

viii
Surrogate Safety Measures ................................................................................................... 35 Most Frequent Problems Identified during Site Visits and Site Observations ..................... 36
Countermeasures ........................................................................................................................ 39 Factors Contributing to Sign Crashes ....................................................................................... 39 Identify Potential Countermeasures .......................................................................................... 40 Select Countermeasure for Evaluation ...................................................................................... 44
Field Studies ................................................................................................................................ 45 Field Study Design .................................................................................................................... 45 Study Sites ................................................................................................................................ 46
Site 1: Southbound SH 286 Exit to Port Avenue, Corpus Christi, Texas ............................. 46 Site 2: Southbound SH 286 Exit to SH 358 East, Corpus Christi, Texas ............................. 46
Site Characteristics .................................................................................................................... 47 Data Collection ......................................................................................................................... 48
Speed Data ............................................................................................................................ 48 Video Data ............................................................................................................................ 54
Results .......................................................................................................................................... 57 Evaluation Method .................................................................................................................... 57 Speed Characteristics ................................................................................................................ 57
Vehicle Speeds at the Exit Gore ........................................................................................... 57 Deceleration of Exiting Vehicles .......................................................................................... 59
Erratic Maneuvers ..................................................................................................................... 61 Summary and Conclusions......................................................................................................... 65
Research Summary ................................................................................................................... 65 Conclusions ............................................................................................................................... 66
References .................................................................................................................................... 67 Appendix A Survey Questionnaire ............................................................................................ 69 Appendix B Summary of Site Visits .......................................................................................... 75
ix
LIST OF FIGURES
Page Figure 1. Research Approach. ......................................................................................................... 1 Figure 2. Typical Gore Area Characteristics (1). ............................................................................ 4 Figure 3. Typical Exit Gore Details (1). ......................................................................................... 5 Figure 4. Reserve Areas for Gores (5). ........................................................................................... 8 Figure 5. Curb Attenuator. .............................................................................................................. 9 Figure 6. Channelizing Line Application for Exit Ramp Markings (Parallel and Tapered
Deceleration Lanes). ......................................................................................................... 11 Figure 7. Channelizing Line Application for Exit Ramp Markings (Auxiliary Lane). ................ 12 Figure 8. Example of Lane Drop Markings at Exit Ramps. ......................................................... 13 Figure 9. Measuring the Length of a Weaving Segment (7). ........................................................ 15 Figure 10. Monthly Sign Hits. ...................................................................................................... 19 Figure 11. Most Frequently Hit Roadway Sign Locations. .......................................................... 21 Figure 12. Reasons for Sign Hits. ................................................................................................. 21 Figure 13. Number of Sites with Unusually High Frequency of Sign Hits. ................................. 23 Figure 14. Methods to Mitigate Sign Hit Problems. ..................................................................... 24 Figure 15. Geographical Distribution of Sites with Information on High-Impact Sign
Problems. .......................................................................................................................... 27 Figure 16. Distribution of Sites according to Sign Categories. .................................................... 28 Figure 17. Reported Number of Problematic Exit Sign Locations for Different Posted
Speeds. .............................................................................................................................. 28 Figure 18. Example of a Potential Hazard—Steep Grade before an Exit. .................................... 33 Figure 19. Pavement Marking for Passive Speed Control in the Approach Lanes to the
Exit Ramp. ........................................................................................................................ 42 Figure 20. Advance Ramp Advisory Speed Warning Sign with Flashers. ................................... 43 Figure 21. Flexible Pylon. ............................................................................................................. 43 Figure 22. Escape Lanes on Freeway and Exit Ramp. ................................................................. 43 Figure 23. Impact Attenuator with Large Retro-Reflective Bi-Directional Arrows. .................... 44 Figure 24. Reflective Object Markers on Sign Posts. ................................................................... 44 Figure 25. Southbound SH 286 Exit to Port Avenue, Corpus Christi, Texas. .............................. 46 Figure 26. Southbound SH 286 Exit to SH 358 East, Corpus Christi, Texas. .............................. 47 Figure 27. Speed Data Collection Using Lidar (Radar) Gun. ....................................................... 49 Figure 28. Location of Lidar Gun Station at Site 1. ...................................................................... 50 Figure 29. Location of Lidar Gun Station at Site 2. ...................................................................... 51 Figure 30. Portable On-Pavement Traffic Analyzer Showing Cover and Sensor. ....................... 53 Figure 31. Location of On-Pavement Traffic Analyzers. ............................................................. 54 Figure 32. Typical Video Feed Captures from TxDOT Overhead Cameras. ............................... 55 Figure 33. Speed Distributions at the Exit Gore at Site 1 (SB SH 286 Exit to Port
Avenue). ............................................................................................................................ 58 Figure 34. Speed Distributions at the Exit Gore at Site 2 (SB SH 286 Exit to SH 358). ............. 59 Figure 35. Average Locations of Exiting Vehicles at Different Speed Levels. ............................ 60 Figure 36. Erratic Maneuvers at Exit Gore. .................................................................................. 61 Figure 37. Number of Erratic Maneuvers between 2–6 p.m. at Study Site 1. .............................. 62
x
Figure 38. Number of Erratic Maneuvers between 2–6 p.m. at Study Site 2. .............................. 63 Figure 39. Approach to Southbound SH 286 Exit to SH 358 East Prior to Gore Area. ............... 79 Figure 40. Approach to Southbound SH 286 Exit to SH 358 East at Start of Gore Area. ........... 80 Figure 41. Southbound SH 286 Exit to Port Avenue. ................................................................... 83 Figure 42. Sequence of Signing on Approach to Wetmore Exit on Westbound Wurzbach
Parkway............................................................................................................................. 89 Figure 43. Example of Painted Ramp Speed on Approach to Exit on Wurzbach Parkway. ........ 90 Figure 44. Driver View on Approach to Wetmore Exit on Wurzbach Parkway. ......................... 90 Figure 45. Approach to SH 151 Exit on Northbound IH 410. ...................................................... 93 Figure 46. Northbound IH 410 Frontage Road Approach to U-Turn at SH 151. ......................... 95

xi
LIST OF TABLES
Page Table 1. Minimum Length of Taper beyond an Offset Nose (1). ................................................... 6 Table 2. Weaving Configuration Types (7). ................................................................................. 14 Table 3. Email Cover Letter for Surveys. ..................................................................................... 18 Table 4. Roadway Sign Types Ranked Based on Frequency of Sign Hits. .................................. 20 Table 5. Reasons for Sign Hits. .................................................................................................... 22 Table 6. Information Collected during Site Visits. ....................................................................... 30 Table 7. Summary Characteristics of Sites. .................................................................................. 38 Table 8. Potential Countermeasures. ............................................................................................ 41 Table 9. Data Collection Techniques Used in Observational Studies. ......................................... 48

1
INTRODUCTION
There are approximately 15,000 exit gore signs installed on Texas highways. Because of
its frequency and exposure to high-speed traffic, the exit gore sign remains one of the sign types
most commonly struck by errant vehicles. Thus, exit gore signs present a significant maintenance
challenge for TxDOT, namely, the safety of personnel working in gore areas to replace these
signs, and the resources (staff, equipment, and stock) that are necessary for continual
maintenance. In addition, other roadside signs that are located near the travel lanes due to lack of
available clear zones are also prime high-impact candidates.
RESEARCH OBJECTIVE
The objective of this research was to identify and evaluate alternative signing methods
that may reduce the number of sign hits as well as the costs and resources required for sign
replacement and maintenance.
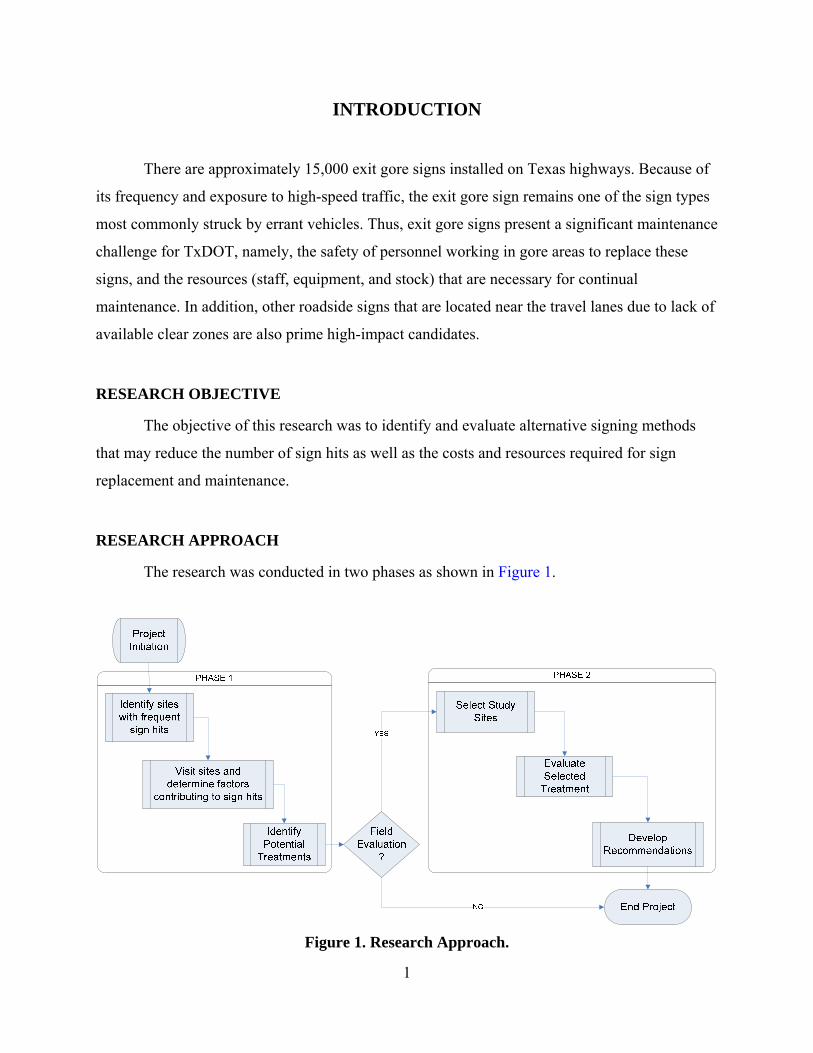
RESEARCH APPROACH
The research was conducted in two phases as shown in Figure 1.
Figure 1. Research Approach.

2
In the first phase, researchers identified sites with safety problems related to frequent sign
hits, determined the major contributing factors, and identified potential treatments. Sites were
identified based on input from the project monitoring committee and a survey of all TxDOT
districts. To determine the factors that most likely contributed to the frequent sign hits,
researchers visited several sites where they collected data and recorded drive-through videos.
Based on field observations and detailed site diagnostics, they compiled a list of common
problems and recommended countermeasures that could potentially address some of the issues
identified.
The second phase of the project involved field evaluation of a selected countermeasure
and development of recommendations. Researchers worked with the project monitoring
committee to rank the countermeasures developed in phase 1, and selected one of them for field
evaluations. The evaluation was based on the comparisons of safety-related measures of
effectiveness (MOE) determined from field data collected before and after the treatment.

3
STATE-OF-PRACTICE
REVIEW OF LITERATURE
An extensive amount of research has been conducted to reduce severity of vehicle
crashes with roadside appurtenances. However, a limited amount of research has been done in
recent years with respect to reducing the occurrence of exit ramp sign strikes. Thus, the literature
review for this project resulted in a limited amount of information. This literature review
summarizes available standards and documentation pertinent to the design of gore area.
Researchers also reviewed past studies directed toward safety evaluation and improvement of the
design and operational characteristics of the gore area. This will allow the researchers to identify
site characteristics at high-impact sign locations that may not meet standard design practices.
Definitions
AASHTO Geometric Design of Highways and Streets (1) defines the gore area
characteristics with the following terms:
• The term gore indicates an area downstream from the shoulder intersection points.
• The physical nose is a point upstream from the gore, having some dimensional width
that separates the roadways.
• The painted nose is a point, having no dimensional width, occurring at the separation
of the roadways.
• The neutral area is the triangular area between the painted and the gore nose and
incorporates the physical nose.
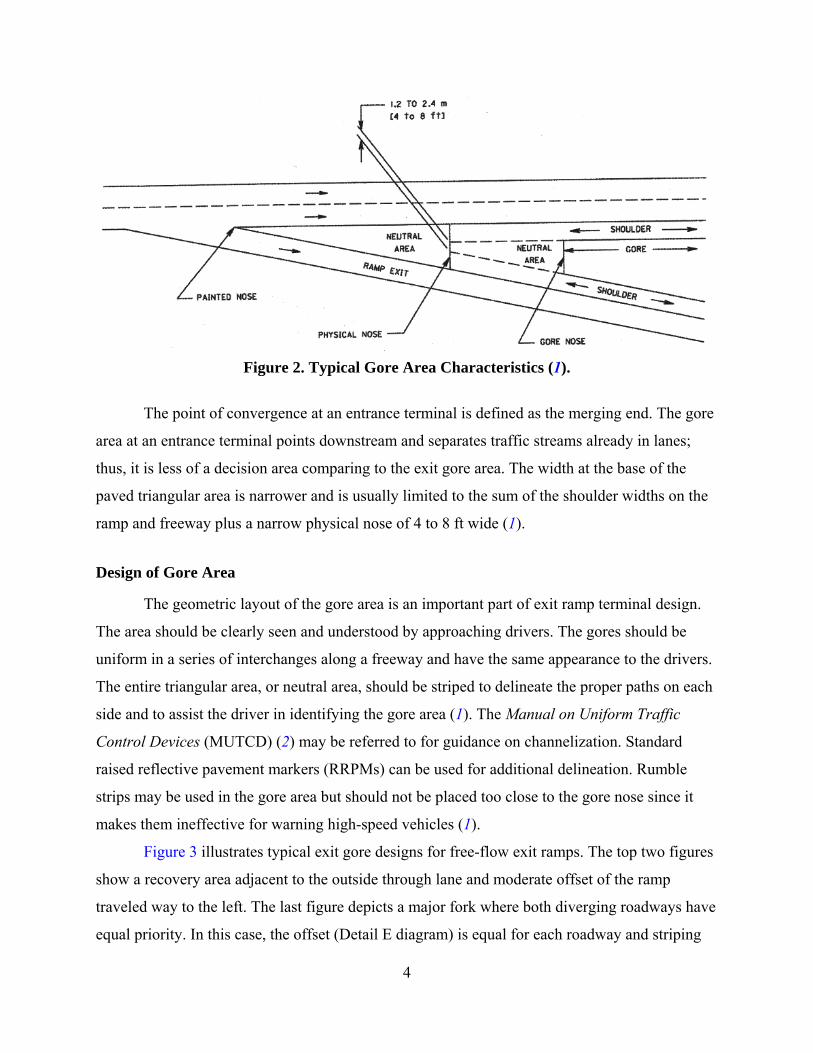
Figure 2 shows typical exit gore area characteristics. Although the term gore commonly
refers to the area between a through roadway and exit ramp area, the term may also be used to
refer to the similar area between a through roadway and a converging entrance ramp (1).
4
Figure 2. Typical Gore Area Characteristics (1).
The point of convergence at an entrance terminal is defined as the merging end. The gore
area at an entrance terminal points downstream and separates traffic streams already in lanes;
thus, it is less of a decision area comparing to the exit gore area. The width at the base of the
paved triangular area is narrower and is usually limited to the sum of the shoulder widths on the
ramp and freeway plus a narrow physical nose of 4 to 8 ft wide (1).
Design of Gore Area
The geometric layout of the gore area is an important part of exit ramp terminal design.
The area should be clearly seen and understood by approaching drivers. The gores should be
uniform in a series of interchanges along a freeway and have the same appearance to the drivers.
The entire triangular area, or neutral area, should be striped to delineate the proper paths on each
side and to assist the driver in identifying the gore area (1). The Manual on Uniform Traffic
Control Devices (MUTCD) (2) may be referred to for guidance on channelization. Standard
raised reflective pavement markers (RRPMs) can be used for additional delineation. Rumble
strips may be used in the gore area but should not be placed too close to the gore nose since it
makes them ineffective for warning high-speed vehicles (1).
Figure 3 illustrates typical exit gore designs for free-flow exit ramps. The top two figures
show a recovery area adjacent to the outside through lane and moderate offset of the ramp
traveled way to the left. The last figure depicts a major fork where both diverging roadways have
equal priority. In this case, the offset (Detail E diagram) is equal for each roadway and striping

5
or rumble strips are placed upstream from the physical nose. Any obstructions should be omitted
from the gore area particularly on high-speed facilities.
Figure 3. Typical Exit Gore Details (1).
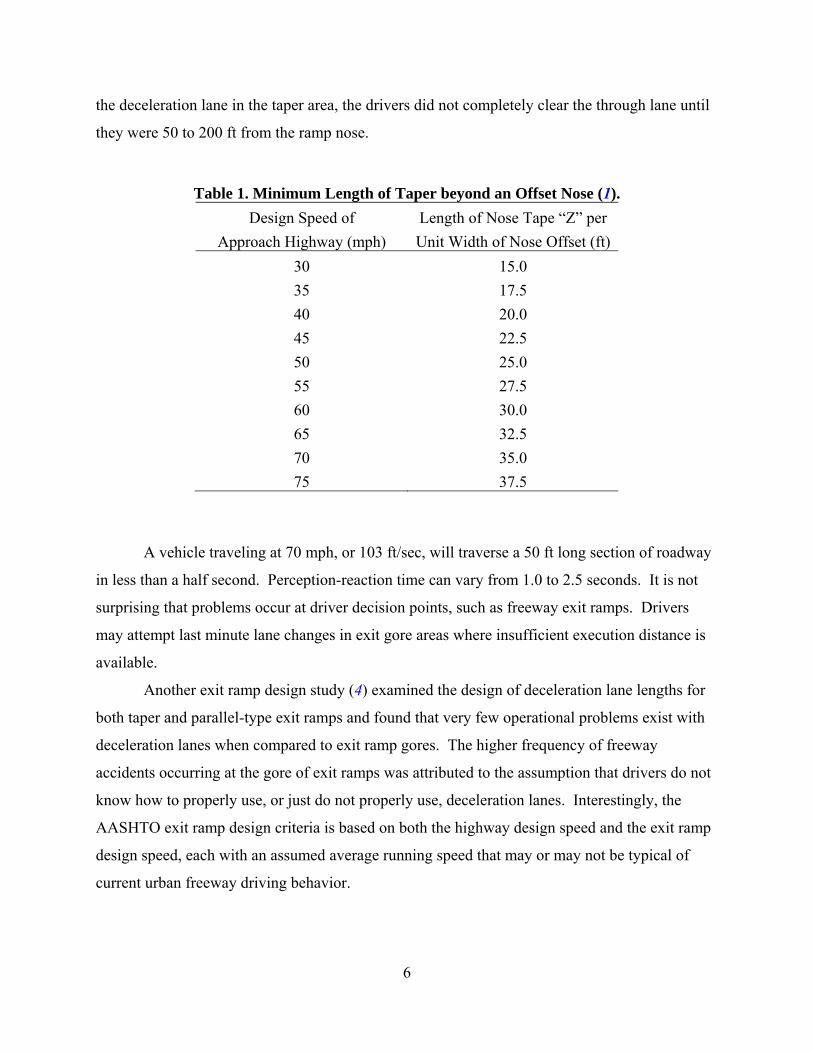
Table 1 gives the minimum lengths for tapers beyond the offset nose (length Z in
Figure 3). Alternatively, paved shoulder of a through lane can be used to provide a recovery
area (1). A study by Davis and Williams (3) evaluated the exiting behavior of vehicles on both
taper and parallel-type exit ramps and found that 95 percent of vehicles tend to execute exiting
maneuvers as if the deceleration ramp were a taper-type design. Although most vehicles entered
6
the deceleration lane in the taper area, the drivers did not completely clear the through lane until
they were 50 to 200 ft from the ramp nose.
Table 1. Minimum Length of Taper beyond an Offset Nose (1). Design Speed of
Approach Highway (mph) Length of Nose Tape “Z” per Unit Width of Nose Offset (ft)
30 15.0 35 17.5 40 20.0 45 22.5 50 25.0 55 27.5 60 30.0 65 32.5 70 35.0 75 37.5
A vehicle traveling at 70 mph, or 103 ft/sec, will traverse a 50 ft long section of roadway
in less than a half second. Perception-reaction time can vary from 1.0 to 2.5 seconds. It is not
surprising that problems occur at driver decision points, such as freeway exit ramps. Drivers
may attempt last minute lane changes in exit gore areas where insufficient execution distance is
available.
Another exit ramp design study (4) examined the design of deceleration lane lengths for
both taper and parallel-type exit ramps and found that very few operational problems exist with
deceleration lanes when compared to exit ramp gores. The higher frequency of freeway
accidents occurring at the gore of exit ramps was attributed to the assumption that drivers do not
know how to properly use, or just do not properly use, deceleration lanes. Interestingly, the
AASHTO exit ramp design criteria is based on both the highway design speed and the exit ramp
design speed, each with an assumed average running speed that may or may not be typical of
current urban freeway driving behavior.
7
Barrier End Treatments and Crash Cushions
Barrier end treatments and crash cushions are frequently used to attenuate the crash
impacts or redirect a vehicle around a fixed object or an untreated end of a roadside barrier. A
barrier end treatment or terminal is typically used at the end of a roadside barrier where traffic
passes on one side of the barrier and in one direction only. A crash cushion is normally used to
shield the end of a median barrier or a fixed object located in a gore area. Chapter 8 of the
Roadside Design Guide (5) explains the warrants for installation, the structural and performance
requirements of barrier end treatments and crash cushions, as well as the descriptions, selection
guidelines, and placement recommendations for these devices.
NCHRP Report 350 (6) contains the current recommendations for testing and evaluating
the performance of crash cushions and barrier end treatments. These devices must meet the
evaluation criteria outlined in this report to be considered acceptable for installation on new or
reconstruction projects.
Crash cushions are suitable for use at locations where fixed objects cannot be removed,
relocated, or made breakaway, and cannot be adequately shielded by a longitudinal barrier. A
common application of a crash cushion is in an exit ramp gore on an elevated or depressed
structure where a bridge rail end or a pier requires shielding. Crash cushions are also frequently
used to shield the ends of median barriers (5).
The Roadside Design Guide (5) suggests considering the following factors when
selecting crash cushions:
• Site characteristics.
• Structural and safety characteristics of candidate systems.
• Cost.
• Maintenance characteristics.
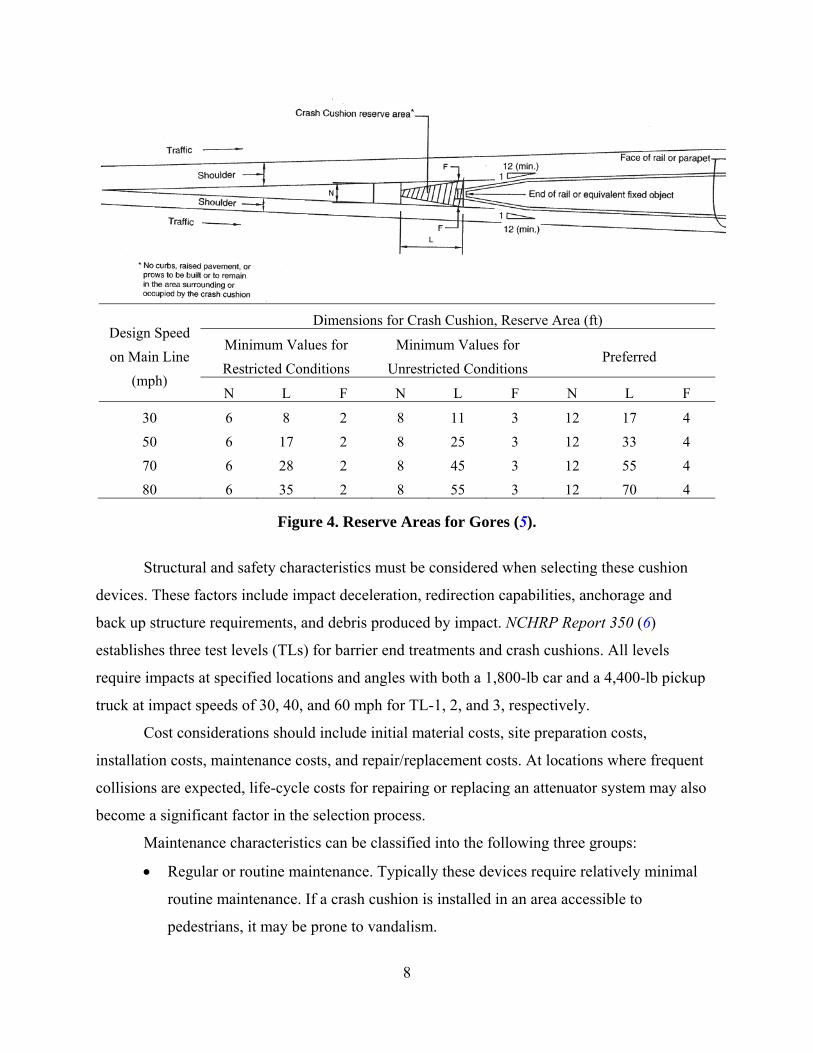
The evaluation of site characteristics should be conducted to determine the need for as
well as to estimate the space requirements of crash cushions to shield non-removable fixed
objects. Figure 4 suggests the area that should be made available for crash cushion installation
(5). This recommendation also applies to other types of fixed objects that need to be shielded.
The unrestricted conditions represent the minimum dimensions for all locations except
those sites where extra cost required for obtaining these dimensions is unjustifiable. The
preferred conditions represent optimal and desirable values.
8
Design Speed on Main Line
(mph)
Dimensions for Crash Cushion, Reserve Area (ft)
Minimum Values for Restricted Conditions
Minimum Values for Unrestricted Conditions
Preferred
N L F N L F N L F
30 6 8 2 8 11 3 12 17 4 50 6 17 2 8 25 3 12 33 4 70 6 28 2 8 45 3 12 55 4 80 6 35 2 8 55 3 12 70 4
Figure 4. Reserve Areas for Gores (5).
Structural and safety characteristics must be considered when selecting these cushion
devices. These factors include impact deceleration, redirection capabilities, anchorage and
back up structure requirements, and debris produced by impact. NCHRP Report 350 (6)
establishes three test levels (TLs) for barrier end treatments and crash cushions. All levels
require impacts at specified locations and angles with both a 1,800-lb car and a 4,400-lb pickup
truck at impact speeds of 30, 40, and 60 mph for TL-1, 2, and 3, respectively.
Cost considerations should include initial material costs, site preparation costs,
installation costs, maintenance costs, and repair/replacement costs. At locations where frequent
collisions are expected, life-cycle costs for repairing or replacing an attenuator system may also
become a significant factor in the selection process.
Maintenance characteristics can be classified into the following three groups:
• Regular or routine maintenance. Typically these devices require relatively minimal
routine maintenance. If a crash cushion is installed in an area accessible to
pedestrians, it may be prone to vandalism.
9
• Crash maintenance. For a location with a history of frequent hits, the use of a device
with high degree of reusability is desirable. If nuisance hits are relatively common, an
attenuator with redirection capability should be considered to reduce the effort
required for minor repairs or partial replacement of a system.
• Material storage requirements. This is pertinent to the availability of replacement
parts needed to restore a damaged device to its original capacity. The type and
amount of spare parts that must be on hand or quickly obtainable may play an
important role in the decision process. An agency may prefer fewer different types of
devices as it becomes more convenient to keep up with an adequate inventory of
replacement parts.
Delineation
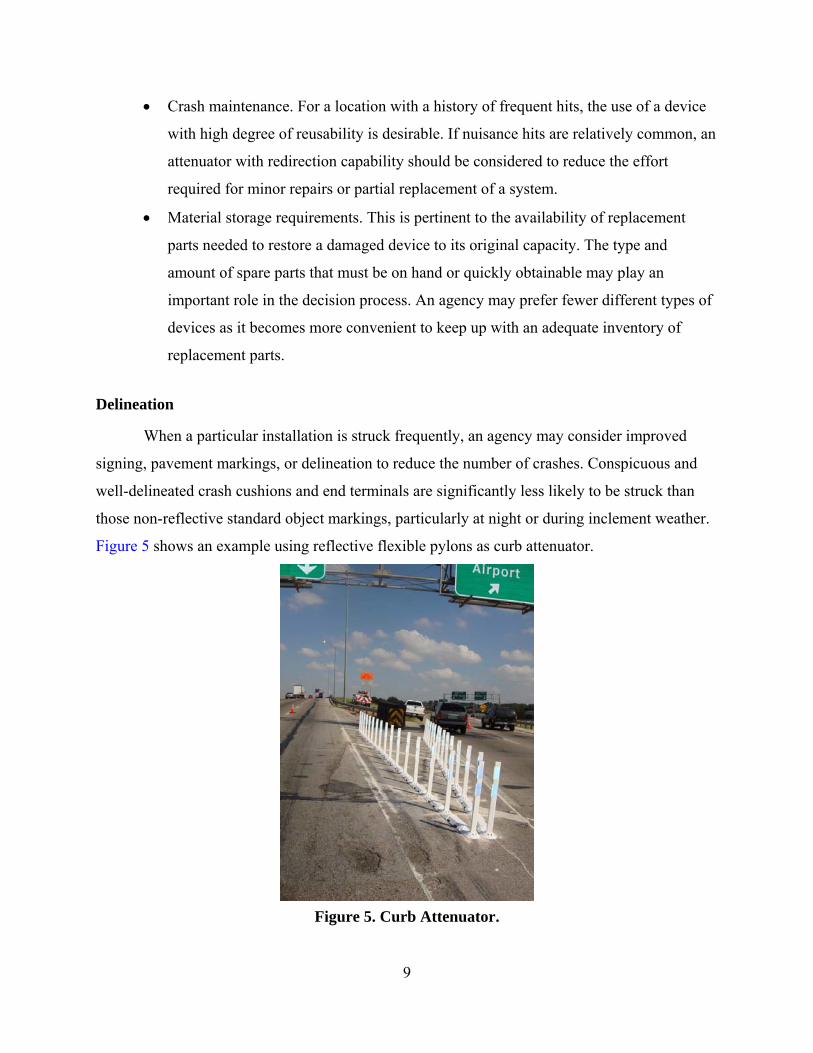
When a particular installation is struck frequently, an agency may consider improved
signing, pavement markings, or delineation to reduce the number of crashes. Conspicuous and
well-delineated crash cushions and end terminals are significantly less likely to be struck than
those non-reflective standard object markings, particularly at night or during inclement weather.
Figure 5 shows an example using reflective flexible pylons as curb attenuator.
Figure 5. Curb Attenuator.

10
Manual of Uniform Traffic Control Devices (MUTCD)
The MUTCD (2) provides information on the appropriate use of signage for freeway
applications in Part 2. Specifically, Section 2E covers guide signs for freeways and
expressways. In general, good sign design includes long visibility distances, large lettering and
symbols, and short legends for quick comprehension. Guide signs must be appropriately
colored, retroreflectorized, or illuminated and meet minimum requirements for letter and
numeral sizes. If diagrammatic signs are used, these should show a plain view of the exit ramp
arrangement. Other advance guide signs should give notice well in advance of the exit ramp and
give the distance to that interchange. If the distance to the next exit is unusually long, Next Exit
supplemental signs can be used to inform drivers of the distance to the next exit.
An exit gore sign, placed in the gore, indicates the point at which cars must depart the
main roadway to execute a movement off the freeway. Consistent application of this sign is
emphasized in the MUTCD. These signs are required to be mounted with breakaway or yielding
supports.
Pavement markings are also covered in the MUTCD in Part 3. Specifically, Section
3B.05 states that channelizing lines at exit ramps as shown in Figure 6 and Figure 7 define the
neutral area, direct exiting traffic at the proper angle for smooth divergence from the main lanes
into the ramp, and reduce the probability of colliding with objects adjacent to the roadway.
Lane drop markings as shown in Figure 8 may be used in advance of lane drops at exit
ramps to distinguish a lane drop from a normal exit ramp or from an auxiliary lane. The lane
drop marking may consist of a wide, white dotted line with line segments 0.9 m (3 ft) in length
separated by 2.7 m (9 ft) gaps.
Highway Capacity Manual (HCM) Constrained Weaving
The HCM (7) gives procedures for determining the capacity of weaving areas on
freeways. Weaving is defined as the crossing of two or more traffic streams traveling in the
same general direction along a significant length of highway without the aid of traffic control
devices (except for guide signs). Weaving areas consist of a merge area (entrance ramp)
followed closely by a diverge area (exit ramp). By definition, weaving areas are subject to
turbulence in the traffic stream(s) due to intense lane-changing maneuvers (a key descriptor of
weaving operations).

11
Source: Figure 3B-8, Sheet 1 of 2, MUTCD (2)
Figure 6. Channelizing Line Application for Exit Ramp Markings (Parallel and Tapered Deceleration Lanes).

12
Source: Figure 3B-8, Sheet 2 of 2, MUTCD (2)
Figure 7. Channelizing Line Application for Exit Ramp Markings (Auxiliary Lane).

13
Source: Figure 3B-10, MUTCD (2)
Figure 8. Example of Lane Drop Markings at Exit Ramps.
The key geometric characteristics affecting weaving operations are configuration, length
and width. Configuration is based on the number of lane changes required for weaving vehicles,
as shown in Table 2.

14
Table 2. Weaving Configuration Types (7).
Weaving
Configuration
Type
Number of Lane
Changes Required Illustration
A One per weaving
movement
B
One for one weaving
movement; none for the
other
C Two for one weaving
movement
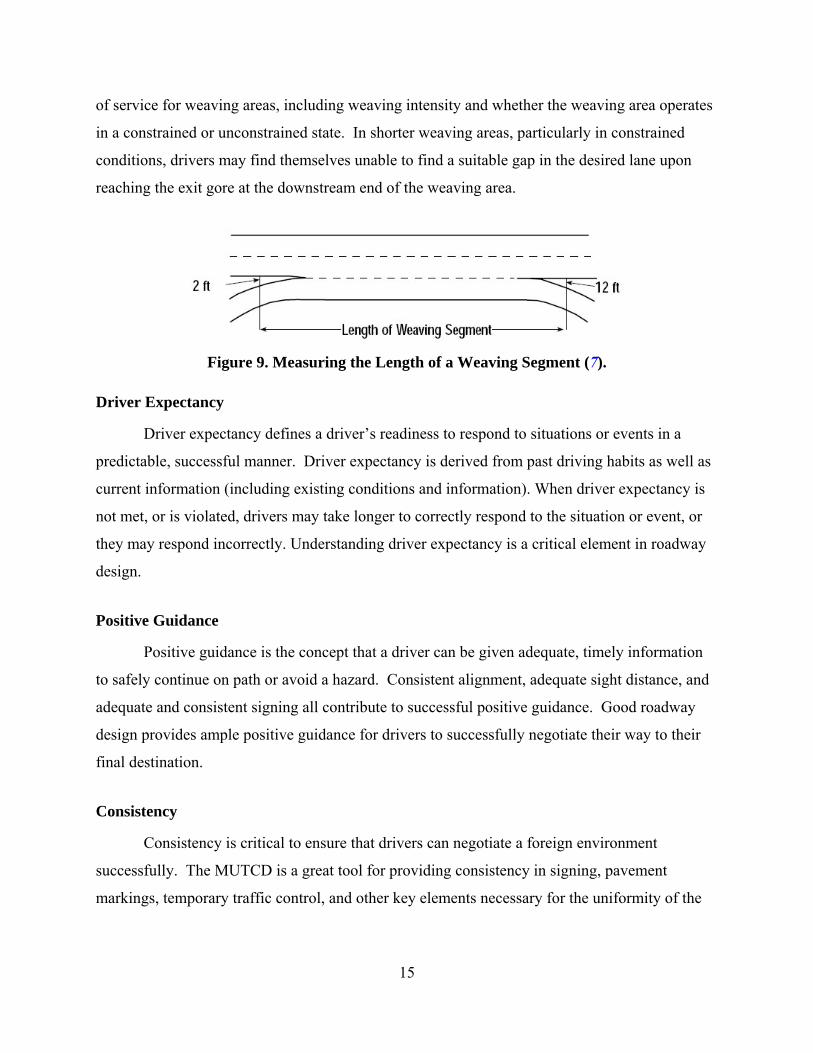
Weaving length is measured as shown in Figure 9. The length of the weaving area is
important because it constrains the time and space in which drivers must make all required lane
changes. At shorter weaving lengths, lane changing intensity and traffic flow turbulence
increase. Chapter 24 of the HCM defines a specific procedure for determining operational level
15
of service for weaving areas, including weaving intensity and whether the weaving area operates
in a constrained or unconstrained state. In shorter weaving areas, particularly in constrained
conditions, drivers may find themselves unable to find a suitable gap in the desired lane upon
reaching the exit gore at the downstream end of the weaving area.
Figure 9. Measuring the Length of a Weaving Segment (7).
Driver Expectancy
Driver expectancy defines a driver’s readiness to respond to situations or events in a
predictable, successful manner. Driver expectancy is derived from past driving habits as well as
current information (including existing conditions and information). When driver expectancy is
not met, or is violated, drivers may take longer to correctly respond to the situation or event, or
they may respond incorrectly. Understanding driver expectancy is a critical element in roadway
design.
Positive Guidance
Positive guidance is the concept that a driver can be given adequate, timely information
to safely continue on path or avoid a hazard. Consistent alignment, adequate sight distance, and
adequate and consistent signing all contribute to successful positive guidance. Good roadway
design provides ample positive guidance for drivers to successfully negotiate their way to their
final destination.
Consistency
Consistency is critical to ensure that drivers can negotiate a foreign environment
successfully. The MUTCD is a great tool for providing consistency in signing, pavement
markings, temporary traffic control, and other key elements necessary for the uniformity of the
16
driving environment. When the driving environment does not provide consistency, driver
expectancy violations are likely to occur more frequently.
Safety Studies in Gore Areas
The rate of crashes in gore areas is typically higher than the rate of run-off-the-road
crashes at other locations. AASHTO (1) recommends that the gore area as well as the unpaved
area should be provided with a clear recovery area. The unpaved area beyond the gore nose
should be graded as level with the roadways as practical to prevent the errant vehicles from
overturning or stopping abruptly by steep slopes.
There are situations in which placement of a major obstruction in a gore is inevitable,
such as gores that occur at exit ramp terminals on elevated structures. Head-on impact protection
should be provided in this case. However, guardrails and bridge rails designed to handle angular
impacts are not effective in handling the near head-on collision in this case.
Significant research effort has been made in the development of cushioning or energy-
dissipating devices for use in the front of fixed objects. These devices aim to reduce the severity
of fixed-object collisions. Adequate space should be provided for the installation of these devices
whenever a major obstruction exists in a gore area, particularly on a high-speed roadway.
Implications for Field Studies
This section discusses potential surrogate safety measures of effectiveness for the study
of exit gore safety.
Erratic Maneuvers
Erratic maneuvers cause disturbances in traffic flow and have been widely accepted as a
surrogate for safety in the absence of other evidence, such as crash data. Reductions in erratic
maneuvers inherently provide for more efficient operations and lead to lower accident rates.
Erratic maneuvers in exit gore areas can be categorized by type:
• Exiting vehicle makes last-minute lane change to remain on freeway.
• Freeway vehicle makes last-minute lane change to take exit.
• Abrupt deceleration to avoid hitting end of queue on ramp.

17
Lane Changes
The locations at which lane changes occur in the vicinity of the exit gore can be used to
describe traffic operations. As discussed previously, the presence of a deceleration lane does not
necessarily encourage drivers to exit early; instead, drivers use the exit as if it were a taper-type
design. Lane changes made farther upstream are less likely to result in exit gore sign strikes.
Weaving Operations
HCM weaving operations calculations may be used to quantify the level of service for
upstream weaving operations. Constrained operations with a poor level of service may result in
an increased number of exit gore sign strikes.
SURVEY OF TXDOT DISTRICTS
The primary objectives of the survey were to (1) identify highway segments with safety
problems due to frequently struck roadside signs, and (2) assess TxDOT’s needs and current
approach to mitigate the problem at these locations. To accomplish these objectives, the research
team conducted a survey of all TxDOT districts. The feedback received from these surveys and
follow-up telephone interviews was beneficial for the remaining tasks, particularly Tasks 2
through 6 of the project.
To conduct the survey, researchers prepared a questionnaire as a fillable PDF form
composed of 10 questions focused on the following three main areas:
• Locations of highway segments where roadside signs are frequently hit by vehicles.
• Approaches districts use to mitigate the safety problem at these locations.
• Experience with alternative methods (e.g., signing and marking techniques).
Appendix A includes the survey questionnaire.
After internal pilot testing of the survey, researchers obtained the necessary Institutional
Review Board (IRB) clearance through TAMU’s Human Subjects’ Protection Program. The
IRB-approved survey questionnaire was emailed to Directors of Transportation Operations at all
TxDOT districts. Table 3 shows the email cover letter.

18
Table 3. Email Cover Letter for Surveys. AN EVALUATION OF THE PERFORMANCE OF HIGH-IMPACT SIGNS
TxDOT Project No 0-6120
The Texas Transportation Institute is conducting a research project for the Texas Department of Transportation to identify alternative signing techniques for locations with high-impact signs. As part of this research we are conducting a survey to
• identify highway segments where frequently struck roadway signs, particularly freeway exit gore signs, pose serious safety concerns
• gather available information on
• reasons for the frequent sign hits, and
• approaches used for mitigating the high-impact sign problem.
The attached survey is sent to Directors of Transportation Operations in all TxDOT districts and to selected agencies in other states. Your response will significantly contribute to the success of the project. The survey results along with other research findings will be documented in the final report of TxDOT research project 0-6120. Completion of the survey is voluntary. The identity (names, job titles and contact information) of participants will be kept confidential, and will not be included in the report.
We would appreciate if you could return the completed survey by June 25, 2009. Please send it via e-mail [email protected] or by mail to Geza Pesti, Texas Transportation Institute, 3135 TAMU, College Station, TX 77843-3135. If you have any questions please contact Geza Pesti (Tel: 979-845-9878, e-mail:[email protected]). Thank you in advance for your cooperation.
The response rate was relatively high, and the survey can be considered successful. The
number of surveys returned and completed in sufficient detail was 34. Note that multiple
responses were received from some districts. The questions and the summary of answers are
presented in this section.
Question 1 Have you had any problems with exit gore signs or other roadside signs being struck often?
In the majority of the districts, 21 respondents (62 percent) indicated that there were
problems with frequently hit exit gore or other roadside signs. The remaining 13 respondents
(32 percent) either did not have problems or have not responded to this question and did not
complete the survey.
Unless otherwise specified, all percentages and distributions determined for the
remaining nine survey questions are based on the answers received from the 21 respondents who
indicated that they had problems with frequently hit signs. Note that the relative distribution of

19
answers may not always add up to 100 percent because respondents may have given multiple
answers for several questions.
Question 2 Does your district keep any types of records or logs of vehicular collisions with roadside signs?
Of the 21 respondents who had indicated problems with sign hits, only 38 percent keeps
some type of records of vehicular collisions with roadside signs, 52 percent does not have such
record, and 10 percent either did not respond or did not know if any records were available.
Question 3 If yes, can such data be made available for use by the research team?
The majority (87 percent) of those who kept some maintenance logs or records indicated
that such data could be made available. The remaining 13 percent did not give any response to
this question.
Question 4 Approximately how many of such impacts occur monthly in your district?
Figure 10 gives the distribution of answers.
14%
57%
14%
14%
0% 10% 20% 30% 40% 50% 60%
Less Than 5
Between 5 and 20
More than 20
No Response
Figure 10. Monthly Sign Hits.
Most respondents (57 percent) indicated that the number of monthly sign hits is
somewhere in the range of 5 to 20. The distributions of those responses where this monthly
figure was less than 5, more than 20, or no estimate was provided are approximately the same
(14 percent). Note that these percentages are greatly dependent on roadway density and the
20
exposure of the signs to traffic volume (i.e., urban districts with dense roadway network and
significant traffic volume are expected to have more sign hits than most rural districts with
sparser network and lower traffic volume). However, it is important that 71 percent of the
respondents indicated they experienced at least 5 sign hits per month.
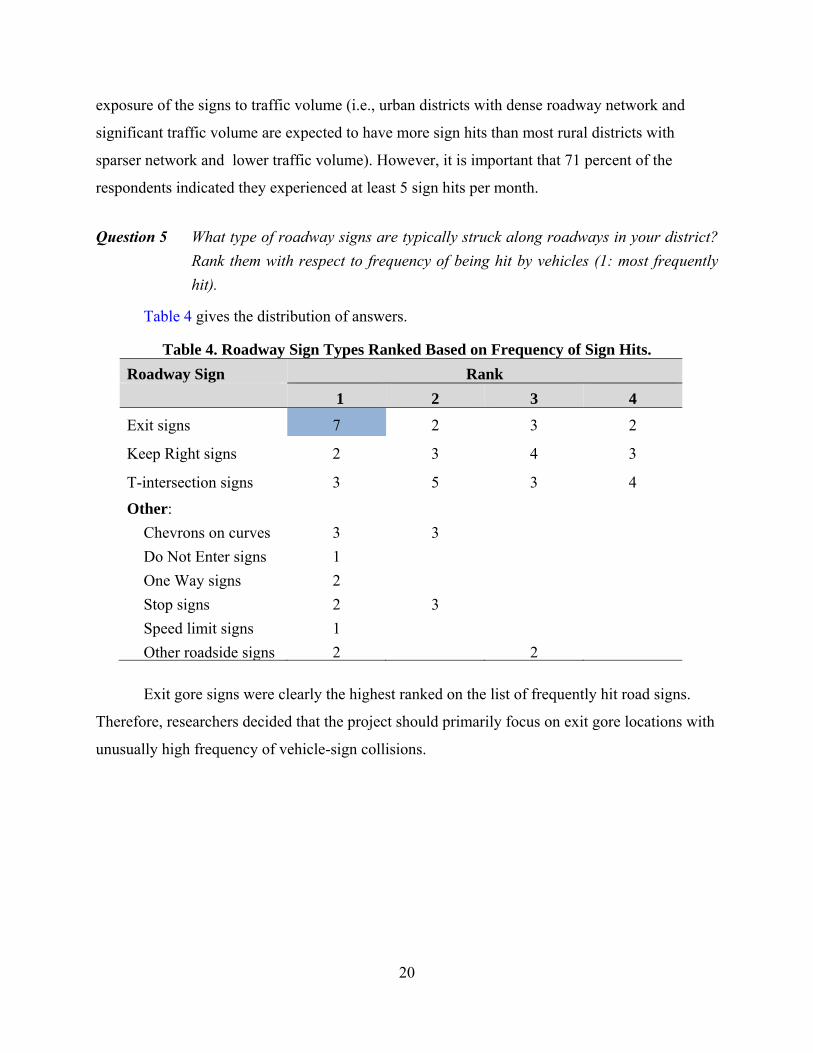
Question 5 What type of roadway signs are typically struck along roadways in your district? Rank them with respect to frequency of being hit by vehicles (1: most frequently hit).
Table 4 gives the distribution of answers.
Table 4. Roadway Sign Types Ranked Based on Frequency of Sign Hits. Roadway Sign Rank 1 2 3 4
Exit signs 7 2 3 2
Keep Right signs 2 3 4 3
T-intersection signs 3 5 3 4
Other: Chevrons on curves Do Not Enter signs One Way signs Stop signs Speed limit signs Other roadside signs
3 1 2 2 1 2
3 3
2
Exit gore signs were clearly the highest ranked on the list of frequently hit road signs.
Therefore, researchers decided that the project should primarily focus on exit gore locations with
unusually high frequency of vehicle-sign collisions.

21
Question 6 At which location(s) are the most frequently hit roadway signs located? Select all that apply.
Figure 11 gives the distribution of answers.
23%
26%
13%
28%
11%
0% 5% 10% 15% 20% 25% 30%
On Roadside
In Exit Gore
On Island
In Curve
Other location
Figure 11. Most Frequently Hit Roadway Sign Locations.
Most roadway sign hits occur in curves and exit gores. Roadway signs located on islands
and other locations are the least frequently hit.
Question 7 Are there reasons identified for the frequency of roadside sign hits by vehicles in your district? Select all that apply and explain.
Figure 12 gives the distribution of answers.
21%
18%
44%
18%
0% 10% 20% 30% 40% 50%
Location of signs
Geometric design
Lack of Driver attention
Others
Figure 12. Reasons for Sign Hits.

22
Note that lack of driver attention is considered more than twice as a significant
contributing factor to the frequent sign hits than sign location, geometric design features, or any
of the other reasons. Table 5 includes explanations and comments provided by the respondents
under the four categories.
Table 5. Reasons for Sign Hits.
Reasons for frequent sign hits Quoted comments made by respondents
Location of signs Sign too far in gore on slip ramp In island tight spaces Exit gores are probably the most susceptible Too close to gore The most frequently hit signs are in exit gores, followed
by intersections Exit gore, proximity to driveways
Geometric design Signs in curves Button hook ramps Small radius at intersection
Lack of driver attention Texting on cell phone Cell phones Not paying attention Drivers just don’t care about signs Large trucks don’t maintain control intakes Most signs are hit on straight sections of road, Stop
signs are usually vandalized Distracted and speeding Cell phones, wet weather driving Fatigue
Other Weather Going too fast Wide farm equipment Vandalism Impaired and speeding Speed

23
Question 8 List up to 10 highway segments in your district where you have safety problems due to frequently struck exit gore signs or other roadside signs. Please specify speed limit and approximate number of sign hits per year, if known.
Respondents have listed a total of 75 sites with unusually high frequency of sign hits.
The number of hits per year at the sites ranged from 1 to 50, and the posted speed from 20 to
70 mph. Figure 13 shows the distribution of the number of sites according to different sign
types.
9
32
6
28
0 5 10 15 20 25 30 35
Chevron
Exit Signs
Stop Signs
Others
Figure 13. Number of Sites with Unusually High Frequency of Sign Hits.
The top three locations where the most sign hits occurred included:
• 32 sites with exit gore sign hits.
• 9 locations (mostly on curves) with knocked-down chevrons.
• 6 locations with stop sign hits.

24
Question 9 What does your district typically do to mitigate the problem of vehicles striking
such high-impact signs? Select all that apply.
Figure 14 shows the distribution of answers.
2%
35%
23%
16%
12%
12%
0% 5% 10% 15% 20% 25% 30% 35% 40%
Remove sign completely
Relocate signs to "safer" place
Make signs more visible
Improve pavement markings in vicinity of signs
Remove signs if redundant
Other
Figure 14. Methods to Mitigate Sign Hit Problems.
According to most respondents (35 percent) the preferable treatment is to relocate the
signs to a safer place, assuming that there is enough room. Making the signs more visible
(recommended by 23 percent), applying improved pavement markings (recommended by
16 percent), and removal of redundant signs (recommended by 12 percent) are treatment options
that are also worth considering.
Respondents mentioned the following potential treatments under category “Other”:
• Improve pavement conditions.
• Add reflective tape to all posts.
• Resize the sign.
• Reflective sheeting on the sign post.

25
Question 10 Any other thoughts that you might have on the treatment of high-impact signs and ways to mitigate the occurrence of vehicular–sign collisions?
Some of the respondents provided the following input:
• “Look at moving signs further out away from travel lane/highway.”
• “Reduce the number of signs; there are too many out there.”
• “Need to remove the redundant signs–if you have OVHD exit signs, can the roadside
exit gore signs be eliminated?”
• “We have mitigated the problem considerably by adding reflective sheeting to the
sign posts for those signs that can get struck.”
• “Educate the driver.”


27
SITES WITH HIGH-IMPACT SIGN PROBLEMS
REVIEW SITES FROM SURVEY
The survey respondents listed a total of 75 sites with frequent sign hits. Figure 15 shows
the geographical distribution of these hits. Researchers conducted initial site visits and collected
data at sites in four districts, and obtained photos for locations with high-impact sign problems in
five other districts.
Photos and maps
Site visits and data collection
LBB
ABL
WAC LFK
BRY
YKMHOU
SAT
CRP
Figure 15. Geographical Distribution of Sites with Information on High-Impact Sign Problems.
The number of hits per year at these sites ranged from 1 to 50, and the posted speed
ranged from 20 to 70 mph. Figure 16 shows the distribution of the 75 sites according to sign
categories.

28
9
32
6
28
0 5 10 15 20 25 30 35
Chevron
Exit Signs
Stop Signs
Others
Figure 16. Distribution of Sites according to Sign Categories.
Most of the signs with unusually frequent hits were at exit gores. Figure 17 shows the
relationship between the reported number of problematic exit sign locations and posted speeds.
2
8
4
18
0
2
4
6
8
10
12
14
16
18
20
55 60 65 70
Freq
uency
Speed Limit (mph)
Figure 17. Reported Number of Problematic Exit Sign Locations for Different Posted
Speeds.
Not surprisingly, most of the exit sign hits occurred on roadways with higher posted
speeds. In addition to higher speeds, higher traffic volumes (more exposure) also increase the
number of sign hits. Therefore the primary focus of this study was on high-speed, high-volume
roadway exits in mostly urban and suburban areas.

29
SITE VISITS AND DIAGNOSTICS
Researchers visited a number of freeway segments with a history of frequent exit gore
sign hits in Houston, San Antonio, and Corpus Christi.
The sites visited in Houston included:
• All exits on IH 45 from Exit 52 to Exit 59, in both directions of travel.
• All exits on US 290 WB between IH 610 and Beltway 8.
• Exits on IH 610 WB and EB at Fannin, Kirby, and Buffalo Speedway.
The sites visited in San Antonio included:
• IH 410 NB Exit 9 to SH 151.
• IH 410 SB turnaround at SH 151.
• IH 410 EB exit to IH 10 (east side of town).
• SH 151 WB exit to IH 410.
• IH 410 SB frontage road to IH 35 N (south side of town).
• IH 10 E and IH 10 W exits to Loop 1604 (east side of town).
• IH 35 SB Exit 164 B to Eisenhauer.
• Every exit on the section of Wurzbach Parkway east of US 281, from Wetmore Road
to the west to O’Connor Road to the east. Of particular interest was the Wurzbach
Parkway WB exit to Wetmore Road.
• IH 10 WB Exit 543 to Cascade Caverns/Scenic Loop.
The sites visited in Corpus Christi included:
• SH 286 SB (Crosstown Expressway) exit to SH 358 (SPID) EB.
• SH 286 SB exit to Port Avenue Exit (both NB and SB Exit signs were frequently hit).
• SH 358 WB exit to Bear Lane.
The purpose of the site visits was to collect initial data (geometric data and vehicle
speeds) and determine each site’s appropriateness for subsequent field study evaluations. Photos
and drive-through videos were also taken to record any site-specific characteristics that may have
contributed to the frequent sign hits at each location. Table 6 illustrates the types of information
collected at the sites.

30
Table 6. Information Collected during Site Visits. Characteristic or Element Description or Photo Location (City) Houston TxDOT District Houston Freeway IH 45 North Direction SB Number of Main Lanes 4 Exit Number 56B Exit Name Shepherd (Spur 261) Exit Ramp Configuration Lane 4 = option lane; single lane ramp; angle <5 degrees Land Use Urban/Suburban Retail
Sign Sequence
Exit Direction sign shown on left. Exit Gore sign shown on right; note the use of diamond-shape reflectors on posts
Key Distances from Painted Gore
Advance Guide Sign (1/2 mi) +2660 ft Advance Guide Sign (METRO) +2370 ft Exit Direction Sign +220 ft Exit Gore Sign −250 ft Average Speeds (mph) Non-Exiting Traffic (lane 4) 56.5 Exiting Traffic 51.6 Speed Limits (mph) Main Lanes 65 Exit Ramp Advisory 30
31
Site Selection for Detailed Site Diagnostics
An important additional selection criterion was the appropriateness of a site for effective
data collection. In addition to geometric data, vehicle speeds and traffic volume data are also
needed to perform detailed analysis of a site. To evaluate the effectiveness of an alternative
signing, strategy data on driver behavior, such as erratic maneuvers, in the vicinity of the exit
gore are also needed. To safely and efficiently collect such data, locations that can be monitored
using video cameras are preferable. Based on these criteria, the following sites were selected for
detailed site diagnostics:
Houston sites:
• All exits on IH 45 from Exit 52 to Exit 59, in both directions of travel.
• All exits on US 290 WB between IH 610 and Beltway 8.
• Exits on IH 610 WB and EB at Fannin, Kirby and Buffalo Speedway.
San Antonio sites:
• IH 410 NB Exit 9 to SH 151.
• IH 410 SB turnaround at SH 151.
• Wurzbach Pkwy WB exit to Wetmore Rd.
Corpus Christi:
• SH 286 (Crosstown Expressway) SB exit to SH 358 (SPID) EB.
• SH 286 SB exit to Port Avenue Exit (both NB and SB Exit signs were frequently hit).
DIAGNOSE SITES WITH FREQUENT EXIT GORE SIGN HITS
Researchers visited several potential study sites in three locations in Texas: Houston, San
Antonio, and Corpus Christi. The sites selected were mostly freeway exit points and a frontage
road U-turn location. Researchers selected these areas based on input from the Texas
Department of Transportation (TxDOT) project oversight panel. The responses to the initial
survey of TxDOT districts and the follow-up telephone conversation with selected area offices
also enabled researchers to identify potential locations for site visits.

32
Multiple site visits and several drive-through videos were recorded at each location to
provide a thorough assessment of each site visited. Researchers also collected volume and speed
data to provide more information on traffic characteristics. At each location, site investigations
were performed to identify potential issues that might contribute to frequent sign strikes. The
analysis was a simplified version of the Positive Guidance in Traffic Control methodology
developed by the Federal Highway Administration. The various characteristics of the sites
visited were analyzed under the general areas discussed below.
Historical Accident Data
The research team initially considered the use of historical accident data to determine the
severity and frequency of crashes. This was not pursued because of the incompleteness of such
data at many locations and the difficulty in making an accurate assessment of the exact locations
and circumstances of accidents (e.g., whether it was an actual hit on a sign). In lieu of hard crash
data, researchers largely relied on information provided by TxDOT districts in the initial survey
completed in Task 1.
Land Use
The land use for each site was documented. Typically, the land use of an area should
have some relation with the volume of vehicles that access a particular exit on the highway.
Researchers documented the land use characteristics for each site.
Geometric Features
The nature of the geometry of each site was documented. Researchers paid particular
attention to the number of lanes, shoulder width, angle of deviation of the exit, horizontal and
vertical curvature and other general characteristics.
33
Hazard Identification and Visibility
An assessment of potential hazards was determined for each site. An initial qualitative
assessment of the presence of hazards was determined by driving the various sites several times
at different times of the day. In each case, researchers identified the presence of any potential
hazards such as:
• Merging traffic.
• Slow moving traffic.
• Guard rail ends.
• Utility pole.
• Curbs.
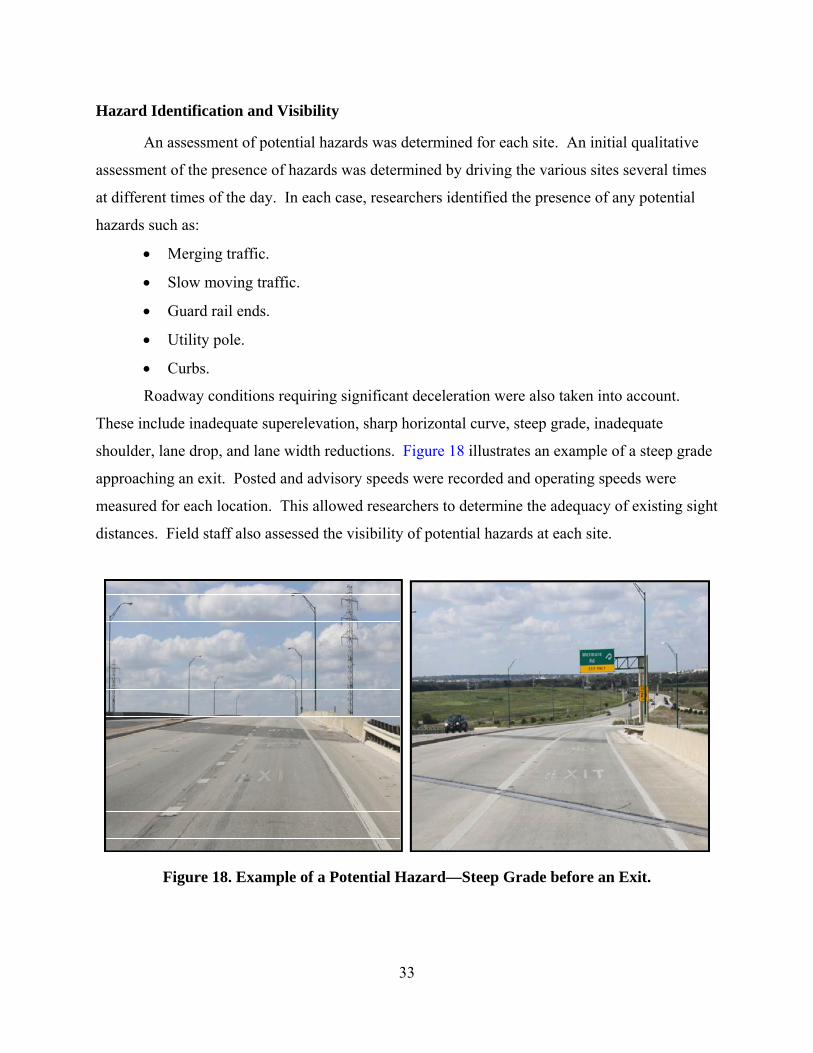
Roadway conditions requiring significant deceleration were also taken into account.
These include inadequate superelevation, sharp horizontal curve, steep grade, inadequate
shoulder, lane drop, and lane width reductions. Figure 18 illustrates an example of a steep grade
approaching an exit. Posted and advisory speeds were recorded and operating speeds were
measured for each location. This allowed researchers to determine the adequacy of existing sight
distances. Field staff also assessed the visibility of potential hazards at each site.
Figure 18. Example of a Potential Hazard—Steep Grade before an Exit.
34
Expectancy Violations
Researchers identified any expectancy violations at each site. Any unusual features or
attributes that drivers might find surprising were identified and documented at each location.
First-of-a-kind deployments and any changes in the roadway that could surprise unfamiliar
drivers as well as unexpected geometrics or traffic control devices that might violate driver
expectancies were noted. The nature of such violations included, but was not restricted to, the
following:
• Adequacy of advance warning.
• Warning and regulatory sign placement.
• Markings/delineation.
• Geometric extremes.
• Visibility of expectancy violation.
• Cross-section changes.
• Roadway/environment changes.
• Traffic patterns/vehicle mixes.
Driver Information Load
At each location, researchers performed a basic information load analysis. This involved
an assessment of various information load factors that might potentially affect driver behavior.
Such factors considered included:
• Land Use.
• Access Control.
• Volume.
• Speed.
• Task/Maneuver.
• Hazards.
• Hazard Visibility.
• Sight Distance.
• Expectancy Violation.
• Visual Clutter.
35
• Competing Information.
• Information Complexity.
Each site was given a Low, Moderate, or High grade for each factor from which a
particular site was designated as one of the following categories:
• “Underload”: very low information load.
• Possible “Underload”: low information load.
• No Processing Problems: moderate information load.
• Possible “Overload”: high information load.
• “Overload”: very high information load.
Driver Information Need
An assessment of the adequacy of driver information was made at each location. Various
driver information needs were evaluated including:
• Laws and Regulations Needs: traffic laws and regulations information needs
including signing and marking requirements were noted.
• Hazard/Expectancy Violation: these included signing and marking visibility,
alignment changes, grades, and road surface conditions.
• Safe Speeds and Speed/Path Change Need: location and adequacy of ramp advisory
signing and lane configuration signing prior to the exit in particular were noted.
• Route Guidance Needs: presence of advanced exit guide sign per MUTCD
requirements were assessed for each site location.
The Information Need evaluation included several questions aimed at making a
qualitative assessment of each site’s information needs. A site was generally classified as Good,
Fair, or Poor. A site was considered Good if no potential changes were identified, Fair if some
improvements could be implemented, and Poor if significant improvements were needed. At
some sites classified as Poor, a complete redesign might also be recommended.
Surrogate Safety Measures
Researchers also examined measurable safety characteristics at the sites using surrogate
safety measures. Such measures are intended for safety evaluation at sites where crash data are
36
often limited or unavailable, which is particularly the case for this study. The desirable safety
surrogates should possess the following characteristics:
• It should be measurable with a high degree of repeatability and accuracy.
• It must be observable and more frequent than crashes.
• It should correlate with crashes.
In this study, researchers collected speed tracking data using lidar guns with a frequency
of three readings per second. The data were also aggregated at 1-second intervals to filter the
noise in the observations. Researchers calculated the following surrogate safety measures at the
sites where speed tracking data were collected:
• Speed profile–plot of individual vehicular speeds over time.
• Acceleration profile–plot of instantaneous acceleration over time.
• Maximum deceleration rate–maximum deceleration value observed for each vehicle.
• Acceleration variability or standard deviation of the acceleration profile
• Frequency of abrupt deceleration rate. Abrupt deceleration rate is defined at
90 percent of 11.2 ft/s2, which is the AASHTO maximum comfortable deceleration
rate.
Vehicle types and maneuvers were also recorded for each tracking data. In this way,
researchers were able to analyze if specific vehicle type and/or maneuver contribute to the
increase in the crash risk as the selected safety surrogates have measured.
Most Frequent Problems Identified during Site Visits and Site Observations
After a diagnosis of the problems and challenges observed at each site, researchers
identified the following most common factors that likely contributed to crashes with exit gore
signs:
• Geometric Design.
o Vertical alignment.
Up-down grades at crossroads (IH 45 bridge over intersecting arterials).
• Limited sight distance upstream.
37
• Potential downstream queue propagation during congested
conditions that may surprise drivers.
o Horizontal alignment.
Slight shift in horizontal alignment of main lanes.
o Other.
Constrained right-of-way (<300 ft).
Significantly lower advisory speed for ramp and/or frontage road.
Drop-lane design coupled with limited sight distance.
• Driver Behavior.
o Inattentive driving.
o Late decision making.
o Excessive speed.
• Sign Location/Placement.
o Visual clutter with other signs.
o Location of exit gore sign is too close to pavement.
• Pavement Markings.
o Faded/worn-out.
o Lane delineators broken or uprooted.
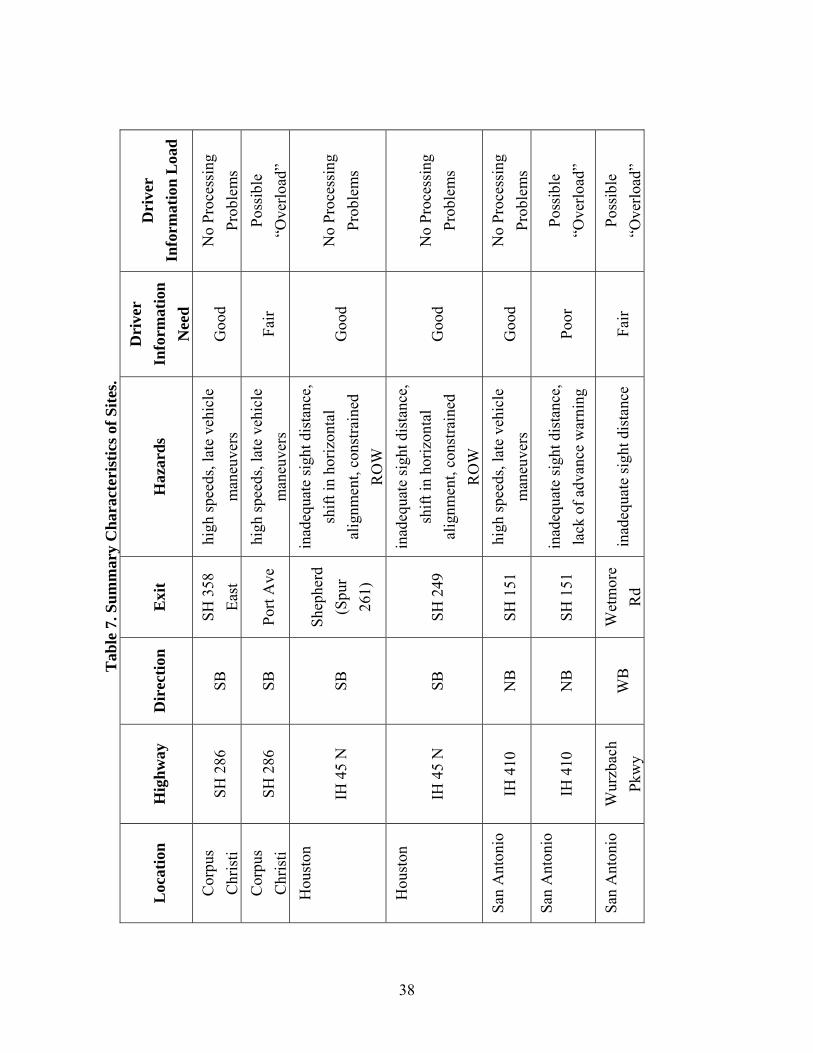
Appendix B documents details of site visits. Table 7 provides a summary of site
characteristics and the potential issues identified at each site.
38
Tab
le 7
. Sum
mar
y C
hara
cter
istic
s of S
ites.
Loc
atio
n H
ighw
ay
Dir
ectio
n E
xit
Haz
ards
D
rive
r In
form
atio
n N
eed
Dri
ver
Info
rmat
ion
Loa
d
Cor
pus
Chr
isti
SH 2
86
SB
SH 3
58
East
hi
gh sp
eeds
, lat
e ve
hicl
e m
aneu
vers
G
ood
No
Proc
essi
ng
Prob
lem
s C
orpu
s C
hris
ti SH
286
SB
Po
rt A
ve
high
spee
ds, l
ate
vehi
cle
man
euve
rs
Fair
Poss
ible
“O
verlo
ad”
Hou
ston
IH 4
5 N
SB
Sh
ephe
rd
(Spu
r 26
1)
inad
equa
te si
ght d
ista
nce,
sh
ift in
hor
izon
tal
alig
nmen
t, co
nstra
ined
R
OW
Goo
d N
o Pr
oces
sing
Pr
oble
ms
Hou
ston
IH 4
5 N
SB
SH
249
inad
equa
te si
ght d
ista
nce,
sh
ift in
hor
izon
tal
alig
nmen
t, co
nstra
ined
R
OW
Goo
d N
o Pr
oces
sing
Pr
oble
ms
San
Ant
onio
IH
410
N
B
SH 1
51
high
spee
ds, l
ate
vehi
cle
man
euve
rs
Goo
d N
o Pr
oces
sing
Pr
oble
ms
San
Ant
onio
IH
410
N
B
SH 1
51
inad
equa
te si
ght d
ista
nce,
la
ck o
f adv
ance
war
ning
Po
or
Poss
ible
“O
verlo
ad”
San
Ant
onio
W
urzb
ach
Pkw
y W
B
Wet
mor
e R
d in
adeq
uate
sigh
t dis
tanc
e Fa
ir Po
ssib
le
“Ove
rload
”
39
COUNTERMEASURES
FACTORS CONTRIBUTING TO SIGN CRASHES
Based on field observations, data collections and detailed diagnosis of the problems and
challenges observed at the sites visited, researchers identified the most common factors that
likely contributed to the unusually high frequency of vehicle crashes with exit gore signs. These
were related to four main categories: geometric design features, driver behavior characteristics,
sign location/placement, and condition of pavement markings. The input of interviewed TxDOT
personnel confirmed most of these findings and added a few additional items to the list. For
example, inadequate night-time visibility on some poorly lighted roadways may also play a
significant role in the frequent sign hits. The following list is a summary of some typical
problems that may contribute to vehicle crashes with exit gore signs:
• Limited sight distance due to vertical and/or horizontal curve upstream of the exit
ramp.
• Significant weaving between closely spaced ramps.
• Shift in horizontal alignment of main lanes.
• Constrained right-of-way.
• Significantly lower advisory speed for ramp and/or frontage road.
• Drop-lane design coupled with limited sight distance.
Problems related to driver behavior characteristics included:
• Inattentive driving (e.g., cell phone use, texting).
• Late decision making.
• Excessive speed.
Problems related to sign location and/or placement included:
• Visual clutter with other signs.
• Location of exit gore sign too close to pavement.
Problems related to pavement markings included:
• Faded/worn-out.
• Lane delineators broken or uprooted.

40
Poor night-time visibility on inadequately lighted roadways was also a problem at
some sites.
Some of these problems, such as inattentive driving, late decision making, or the
existence of a vertical curve that limits the site distance of motorists approaching the exit ramp,
are very difficult and often impossible to correct. However, some of the other problems may be
at least mitigated by certain countermeasures.
IDENTIFY POTENTIAL COUNTERMEASURES
Researchers compiled a list of countermeasures that could potentially address some of the
issues identified. Table 8 summarizes these countermeasures. The first four countermeasures
address issues related to excessive speeds of vehicles approaching the exit, and potentially large
speed differentials between freeway and exit ramp traffic. They use various pavement marking
techniques (e.g., converging chevrons, transverse bars, peripheral lines, ramp speed painted on
the pavement) and rumble strips for controlling the speed of vehicles approaching an exit.
Figure 19 shows implementations of these passive speed control treatments (8). On roadways
with large speed differentials between the mainline and exit ramp speeds, advance ramp advisory
warning signs with flashers may be used to encourage exiting motorists to begin decelerating
sooner in advance of the exit ramp. This treatment is particularly useful where site distance is
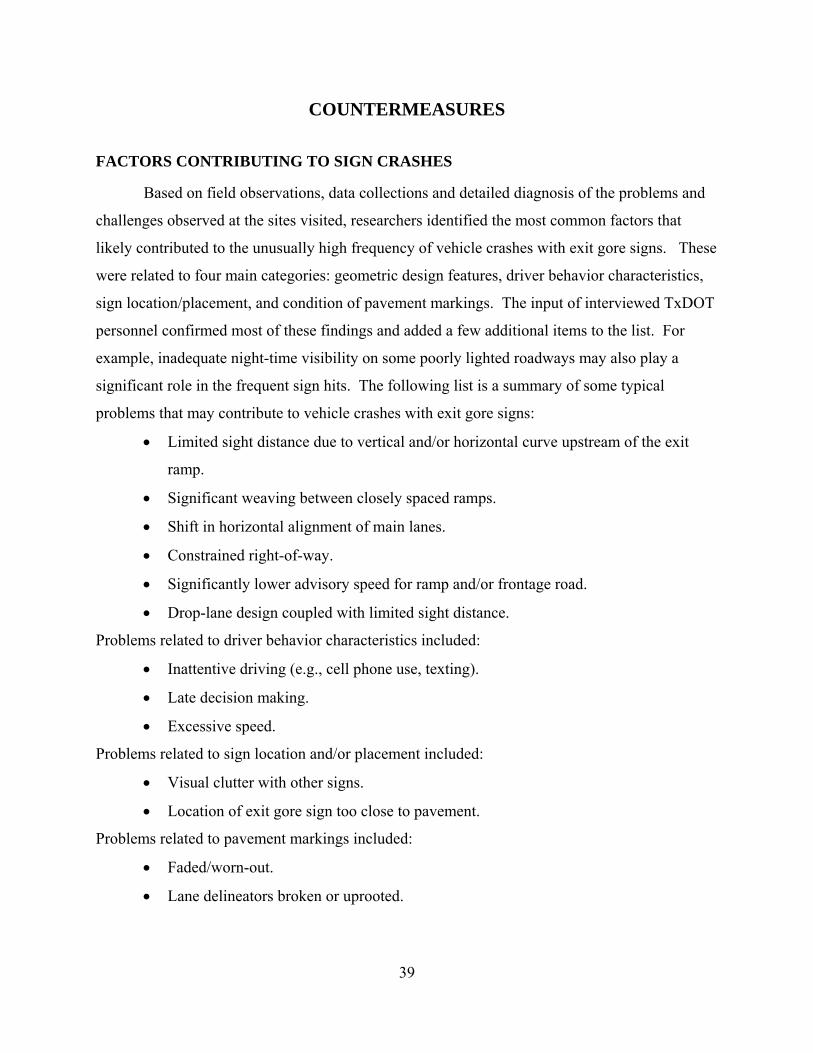
limited and exit ramp turning radius is small, as shown in Figure 20. Other treatments, such as
flexible pylons shown in Figure 21, may be used as channelizing devices to delineating gore
areas. These are intended to reduce the potential of late exiting or merging maneuvers and
prevent vehicles crossing the gore area. If sufficient space is available adjacent to the freeway
lanes and exit ramp, the safety issues related to late exit or merge maneuvers, and vehicles
crossing the gore area, or vehicle queues on exit ramp, can also be addressed using “escape”
lanes such as those shown in Figure 22.

41
Table 8. Potential Countermeasures. Countermeasures Related Problems Pavement Marking as Passive Speed Control Devices • Converging chevrons • Transverse bars • Peripheral lines
• High operating speeds on approach to exit • Relatively large speed difference between
main line and exit ramp speed
Rumble strips on the approach lane to the exit
• High operating speeds on approach to exit • Relatively large speed difference between
main line and exit ramp speed
Ramp speed painted on the pavement in the approach lane to the exit
• High operating speeds on approach to exit • Relatively large speed difference between
main line and exit ramp speed
Advance ramp advisory speed warning sign with flashers
• High operating speeds on approach to exit • Relatively large speed difference between
main line and exit ramp speed
Relocation of exit gore sign farther into gore area
Vehicle crashes with exit gore sign
Flexible pylons • Delineating gore area • Delineating and extending beyond gore
area
• Late exiting or merging maneuvers • Vehicles crossing gore area
“Escape” lane • on freeway • on exit ramp
• Late exiting or merging maneuvers • Vehicles crossing gore area • Vehicle queue on exit ramp • Heavy weaving upstream of exit
Retro-reflective sheeting on sign posts Poor night-time visibility
Reflective object markers on sign posts Poor night-time visibility
Impact Attenuator with large retro-reflective bi-directional arrows
Poor delineation and visibility of gore area
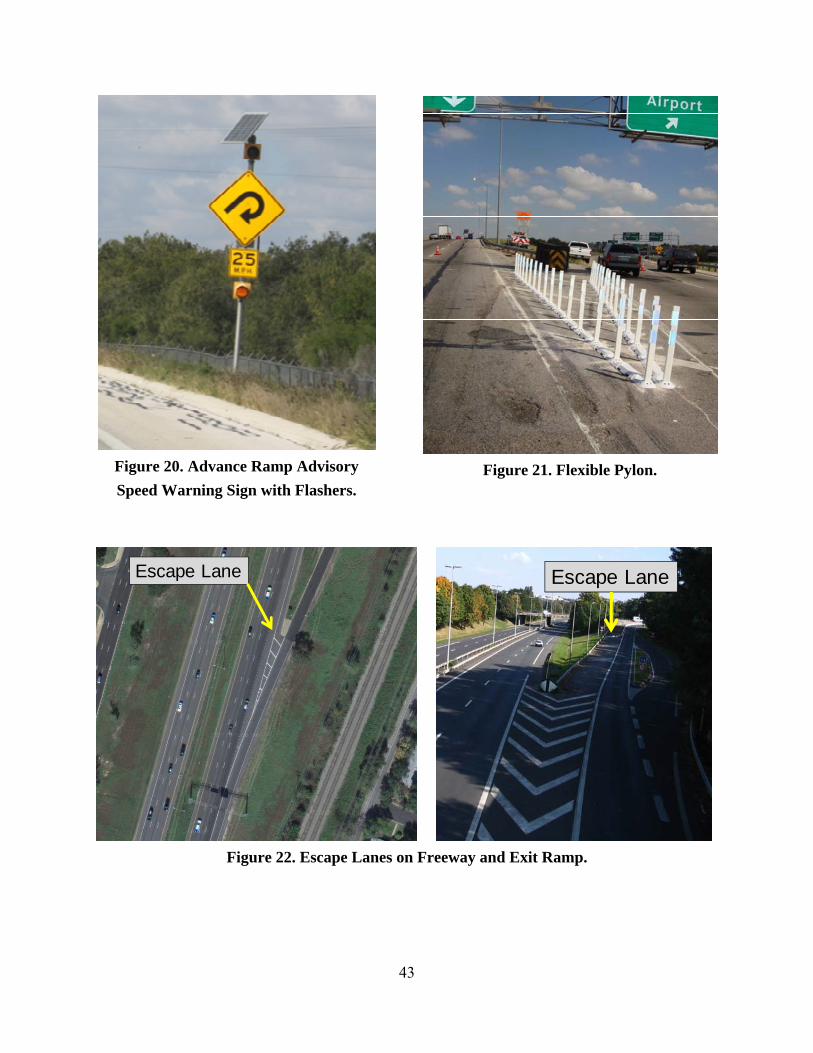
Other countermeasures address issues related to poor delineation and visibility of gore
areas. Impact attenuators with large retro-reflective bi-directional arrows, as the one shown in
Figure 23, are common traffic control devices used at exit ramps on European highways. These
improve visibility, and provide protection for both motorists and signs. The reflective object

42
markers shown in Figure 24 are commonly treatments to improve the night-time visibility of
roadside signs and traffic control devices.
Transverse bars Peripheral lines
Source: Report on Passive Speed Control Devices, 2004
Source: Report on Passive Speed Control Devices, 2004
Converging chevrons
Ramp speed painted on the pavement
Source: Report on Passive Speed Control Devices, 2004
Figure 19. Pavement Marking for Passive Speed Control in the Approach Lanes to the Exit Ramp.
43
Figure 20. Advance Ramp Advisory Speed Warning Sign with Flashers.
Figure 21. Flexible Pylon.
Escape Lane Escape Lane
Figure 22. Escape Lanes on Freeway and Exit Ramp.
44
Figure 23. Impact Attenuator with Large Retro-Reflective Bi-Directional Arrows.
Figure 24. Reflective Object Markers on Sign Posts.
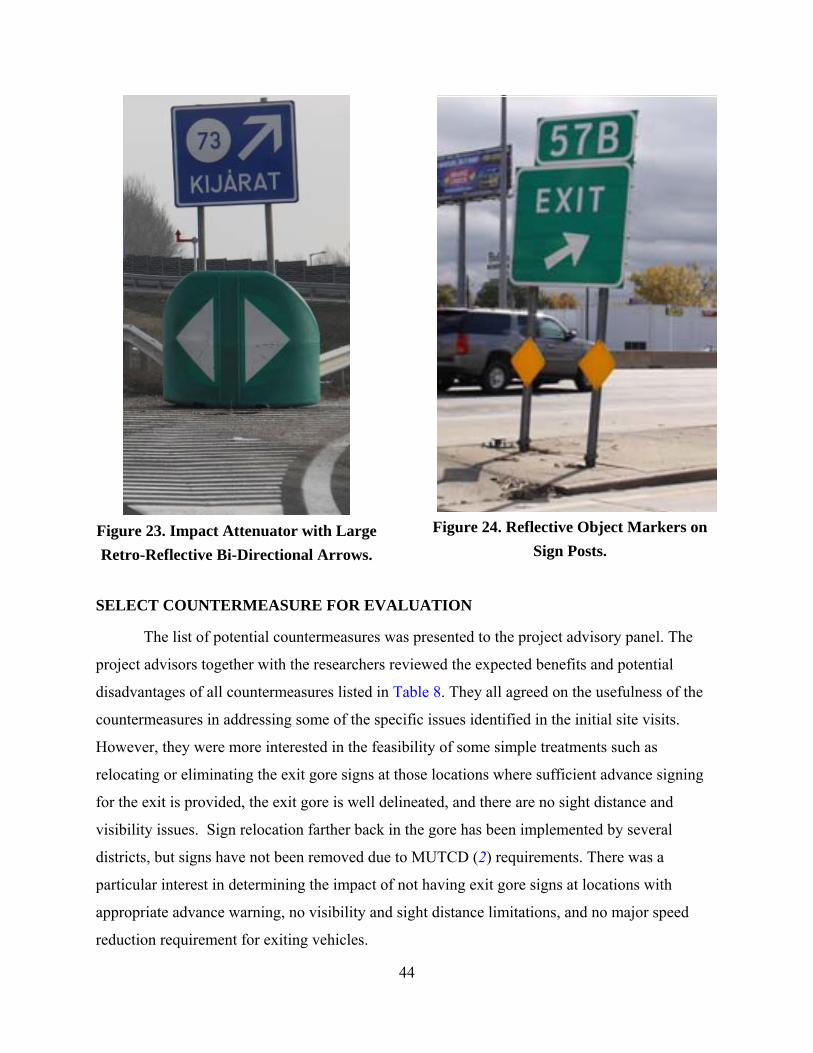
SELECT COUNTERMEASURE FOR EVALUATION
The list of potential countermeasures was presented to the project advisory panel. The
project advisors together with the researchers reviewed the expected benefits and potential
disadvantages of all countermeasures listed in Table 8. They all agreed on the usefulness of the
countermeasures in addressing some of the specific issues identified in the initial site visits.
However, they were more interested in the feasibility of some simple treatments such as
relocating or eliminating the exit gore signs at those locations where sufficient advance signing
for the exit is provided, the exit gore is well delineated, and there are no sight distance and
visibility issues. Sign relocation farther back in the gore has been implemented by several
districts, but signs have not been removed due to MUTCD (2) requirements. There was a
particular interest in determining the impact of not having exit gore signs at locations with
appropriate advance warning, no visibility and sight distance limitations, and no major speed
reduction requirement for exiting vehicles.
45
FIELD STUDIES
FIELD STUDY DESIGN
The primary objective of field studies was to determine the potential impacts of
eliminating exit gore signs at certain freeway exits. It required the conduct of BEFORE- and
AFTER-studies, in which data were collected and performance measures determined for time
periods when the exit gore sign was missing (BEFORE-study) and when it was present (AFTER-
study).
However, removal of exit gore signs for the purpose of field evaluations was not possible
since the MUTCD (2) requires these signs. Therefore, researchers selected a different approach
by taking advantage of instances when vehicles knocked down exit gore signs. Following a sign
hit, maintenance crews usually take several days to replace the sign. This time window may be
relatively narrow, but researchers had only this opportunity to conduct BEFORE-studies (i.e.,
collect data in lack of exit gore signs) without violating MUTCD requirements.
Once the BEFORE-studies are completed and the exit gore sign was replaced, AFTER-
studies could be performed at almost any time. The only constraint was that data had to be
collected under similar weather, roadway, and traffic conditions on the same days of the week
for both the BEFORE- and AFTER-studies.
This approach required constant monitoring of some selected freeway exits with
historically high frequency of sign hits. Based on the survey results, researchers were aware of a
number of such sites, but many of them were not appropriate because of the distance that data
collection crews had to travel. A short response time was needed to conduct BEFORE-studies in
a relatively narrow time window between sign hit and replacement. Therefore, locations
relatively close to TTI offices were preferable. In addition to distance and high frequency of sign
hits, site selection criteria also included the ability of safely and inconspicuously collecting speed
and volume data, and recording videos.
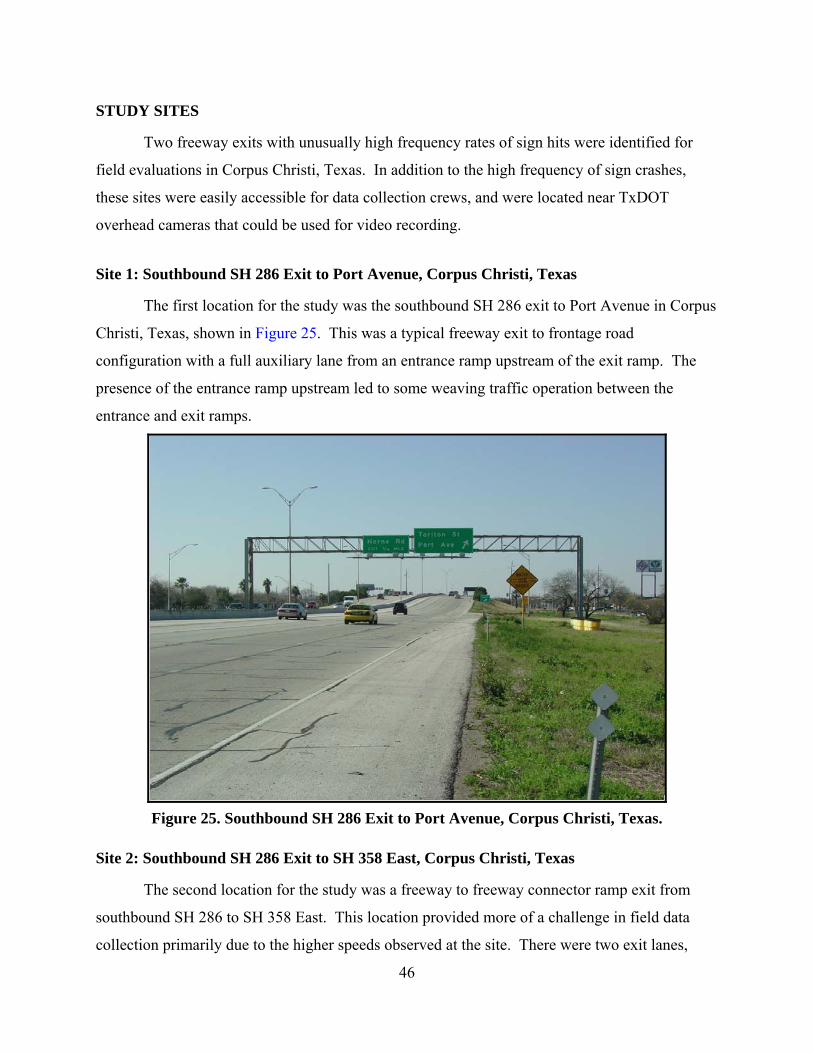
46
STUDY SITES
Two freeway exits with unusually high frequency rates of sign hits were identified for
field evaluations in Corpus Christi, Texas. In addition to the high frequency of sign crashes,
these sites were easily accessible for data collection crews, and were located near TxDOT
overhead cameras that could be used for video recording.
Site 1: Southbound SH 286 Exit to Port Avenue, Corpus Christi, Texas
The first location for the study was the southbound SH 286 exit to Port Avenue in Corpus
Christi, Texas, shown in Figure 25. This was a typical freeway exit to frontage road
configuration with a full auxiliary lane from an entrance ramp upstream of the exit ramp. The
presence of the entrance ramp upstream led to some weaving traffic operation between the
entrance and exit ramps.
Figure 25. Southbound SH 286 Exit to Port Avenue, Corpus Christi, Texas.
Site 2: Southbound SH 286 Exit to SH 358 East, Corpus Christi, Texas
The second location for the study was a freeway to freeway connector ramp exit from
southbound SH 286 to SH 358 East. This location provided more of a challenge in field data
collection primarily due to the higher speeds observed at the site. There were two exit lanes,

47
with one of them being a shared through-exit lane combination. Figure 26 shows the approach to
the southbound SH 286 exit to SH 358 East.
Figure 26. Southbound SH 286 Exit to SH 358 East, Corpus Christi, Texas.
SITE CHARACTERISTICS
Members of the research team observed and took photographs of existing operations at
the two freeway exits being used in the study. Researchers also took detailed measurements and
recordings of the exact location of the exit gore sign, the overhead exit sign, and other notable
signs related to the freeway exit. Specific tasks performed at both sites included the following:
• Take pictures of site with camera.
• Document the signs and markings on the approaches to the freeway exit.
• Draw sketch of vicinity of exit gore area with particular attention to:
o Nature of exit lane (Distance of exit gore sign location from edge of exit gore).
o Distance of overhead exit sign from exit gore sign.
o Distance of solid gore line.
o Location of observers with lidar gun relative to beginning of exit gore.

48
DATA COLLECTION
Field studies were conducted at two freeway exits in Corpus Christi, Texas, to determine
the potential impacts of the absence of exit gore signs. BEFORE-studies were conducted in
February 2010 (22–26) and May 10–14, 2010, and AFTER-studies were conducted from June 25
to July 16, 2010.
Researchers used several techniques to collect observational data. Table 9 summarizes
the data types, data collection methods, and equipment used in the study.
These are described in more detail in the following section.
Table 9. Data Collection Techniques Used in Observational Studies. Data Type Data Collection Method and Equipment Used Speed and Volume Data • Laser (lidar) guns
• Portable on-pavement traffic analyzers Video Data • DVR-based recording from TxDOT overhead
camera Site Characteristics • Digital photographs
• Site sketches • Other observations
Speed Data
The research team intended to collect speed data on the approach to the freeway exit sign
and exit gore location to determine the speed patterns prior to and after any changes in the exit
sign location were made. Researchers used two approaches to collect the requisite speed data:
laser (lidar) guns and portable on-pavement traffic analyzers.
Laser (Lidar) Gun
At both selected sites, researchers used laser guns (Figure 27) to obtain speed
profiles of vehicles as these approached the freeway exit. This allowed for the
analysis of the acceleration/deceleration behavior of individual vehicles relative to the
exit gore location. The laser guns employed for this study have the capability of locking
onto a target vehicle and tracking it over long distances, taking three speed/distance readings per
second, and collecting a speed profile data over the entire distance of the study area.

49
The gun sends those readings through a data cable to a laptop computer, where each time-
stamped reading is stored in a text file that is available for downloading into a spreadsheet for
data reduction and analysis. The end result is a data file composed of speed/distance profiles for
each individual target vehicle during the study period.
Figure 27. Speed Data Collection Using Lidar (Radar) Gun.
The biggest challenge with using lidar guns was being able to obtain an adequate line of
sight in order to record straight line speed measurements. In attempting to do so, researchers
also needed to be positioned so as not to alert drivers of their presence thus altering their speeds
and creating a potential skewing of recorded speed data. A third challenge for observers was to
ensure safety of the observers as both locations had relatively high speeds in the vicinity of the
freeway exit.
To achieve this in the first location (southbound SH 286 exit to Port Avenue), researchers
measured speeds from behind the vehicles as these moved away from the observer and
approached the exit gore (see Figure 28 for illustration).

50
Figure 28. Location of Lidar Gun Station at Site 1.
For the second location (southbound SH 286 exit to SH 358 East), researchers were
stationed behind the exit gore location and recorded speeds as vehicles approached the exit
(see Figure 29 for illustration). At this site, the data collection crew had more difficulty to
remain inconspicuous to drivers. The presence of a ditch and luminaire pole helped hide the
observer location sufficiently from oncoming drivers’ field of view. Observers parked vehicles
in the selected locations and collected speeds from inside the vehicle, using the vehicle’s power
supply to operate the laser gun and laptop.
Lidar gun location
Port Avenue
SH 286
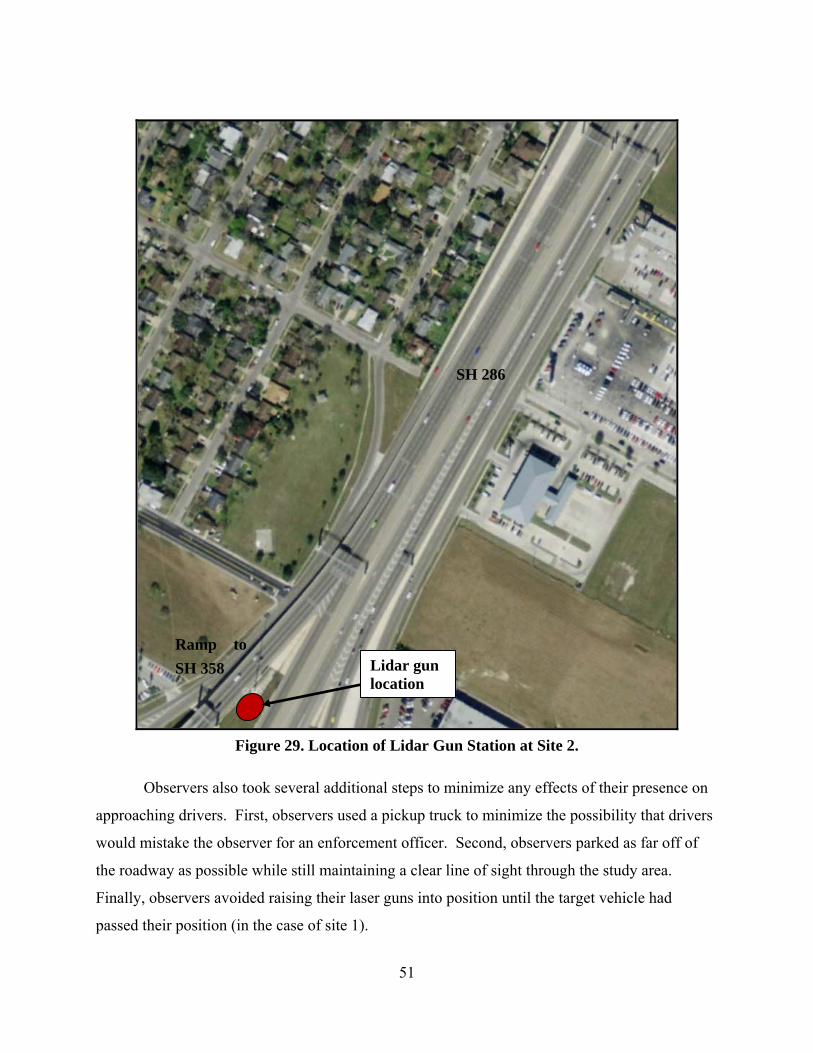
51
Figure 29. Location of Lidar Gun Station at Site 2.
Observers also took several additional steps to minimize any effects of their presence on
approaching drivers. First, observers used a pickup truck to minimize the possibility that drivers
would mistake the observer for an enforcement officer. Second, observers parked as far off of
the roadway as possible while still maintaining a clear line of sight through the study area.
Finally, observers avoided raising their laser guns into position until the target vehicle had
passed their position (in the case of site 1).
Lidar gun location
Ramp to SH 358
SH 286
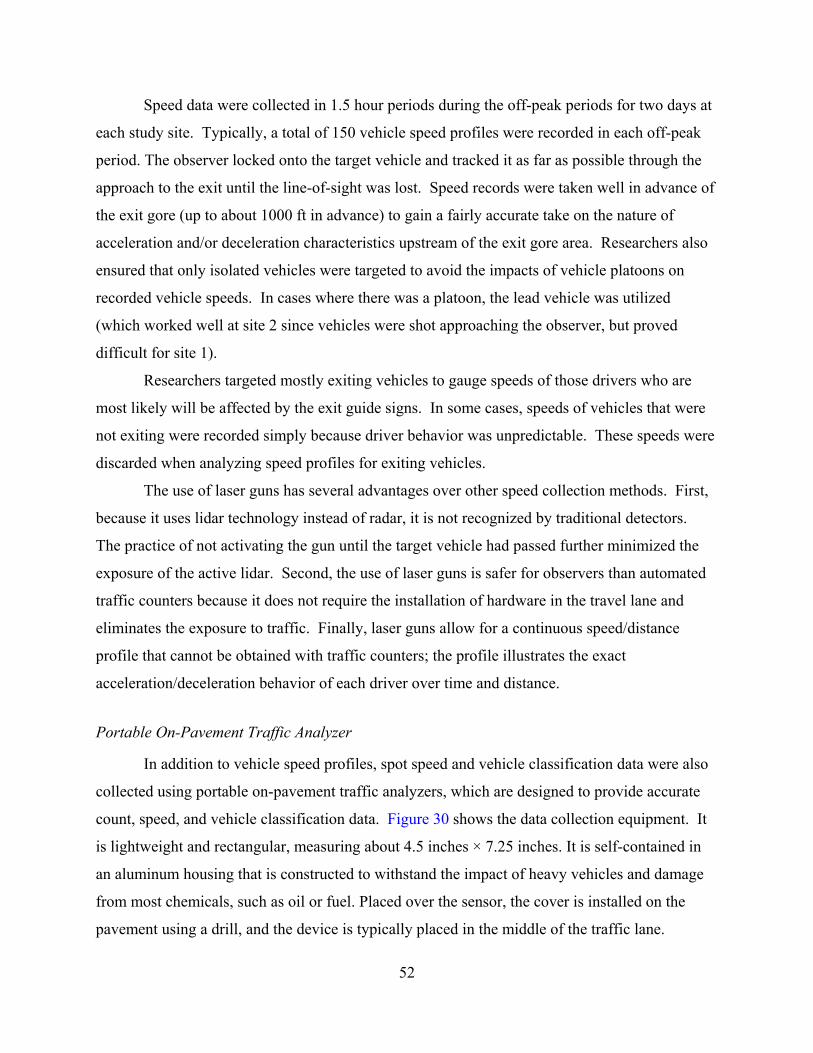
52
Speed data were collected in 1.5 hour periods during the off-peak periods for two days at
each study site. Typically, a total of 150 vehicle speed profiles were recorded in each off-peak
period. The observer locked onto the target vehicle and tracked it as far as possible through the
approach to the exit until the line-of-sight was lost. Speed records were taken well in advance of
the exit gore (up to about 1000 ft in advance) to gain a fairly accurate take on the nature of
acceleration and/or deceleration characteristics upstream of the exit gore area. Researchers also
ensured that only isolated vehicles were targeted to avoid the impacts of vehicle platoons on
recorded vehicle speeds. In cases where there was a platoon, the lead vehicle was utilized
(which worked well at site 2 since vehicles were shot approaching the observer, but proved
difficult for site 1).
Researchers targeted mostly exiting vehicles to gauge speeds of those drivers who are
most likely will be affected by the exit guide signs. In some cases, speeds of vehicles that were
not exiting were recorded simply because driver behavior was unpredictable. These speeds were
discarded when analyzing speed profiles for exiting vehicles.
The use of laser guns has several advantages over other speed collection methods. First,
because it uses lidar technology instead of radar, it is not recognized by traditional detectors.
The practice of not activating the gun until the target vehicle had passed further minimized the
exposure of the active lidar. Second, the use of laser guns is safer for observers than automated
traffic counters because it does not require the installation of hardware in the travel lane and
eliminates the exposure to traffic. Finally, laser guns allow for a continuous speed/distance
profile that cannot be obtained with traffic counters; the profile illustrates the exact
acceleration/deceleration behavior of each driver over time and distance.
Portable On-Pavement Traffic Analyzer
In addition to vehicle speed profiles, spot speed and vehicle classification data were also
collected using portable on-pavement traffic analyzers, which are designed to provide accurate
count, speed, and vehicle classification data. Figure 30 shows the data collection equipment. It
is lightweight and rectangular, measuring about 4.5 inches × 7.25 inches. It is self-contained in
an aluminum housing that is constructed to withstand the impact of heavy vehicles and damage
from most chemicals, such as oil or fuel. Placed over the sensor, the cover is installed on the
pavement using a drill, and the device is typically placed in the middle of the traffic lane.
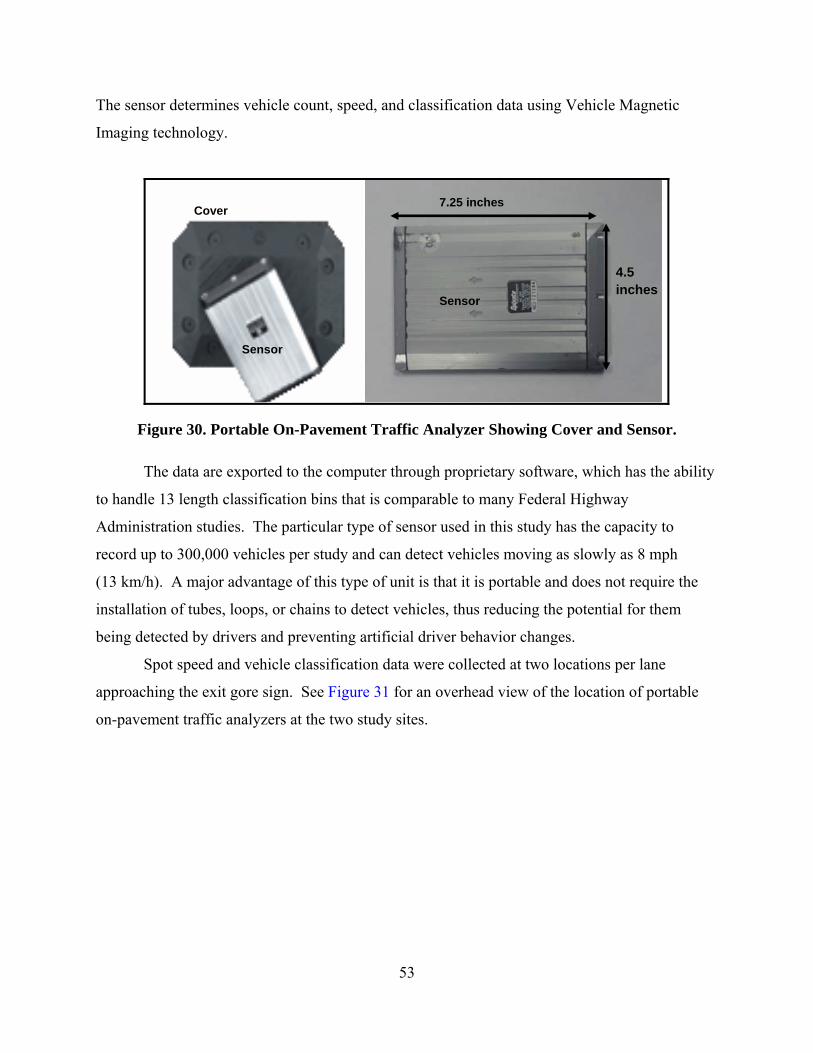
53
The sensor determines vehicle count, speed, and classification data using Vehicle Magnetic
Imaging technology.
7.25 inches
4.5 inches
Cover
Sensor
Sensor
Figure 30. Portable On-Pavement Traffic Analyzer Showing Cover and Sensor.
The data are exported to the computer through proprietary software, which has the ability
to handle 13 length classification bins that is comparable to many Federal Highway
Administration studies. The particular type of sensor used in this study has the capacity to
record up to 300,000 vehicles per study and can detect vehicles moving as slowly as 8 mph
(13 km/h). A major advantage of this type of unit is that it is portable and does not require the
installation of tubes, loops, or chains to detect vehicles, thus reducing the potential for them
being detected by drivers and preventing artificial driver behavior changes.
Spot speed and vehicle classification data were collected at two locations per lane
approaching the exit gore sign. See Figure 31 for an overhead view of the location of portable
on-pavement traffic analyzers at the two study sites.
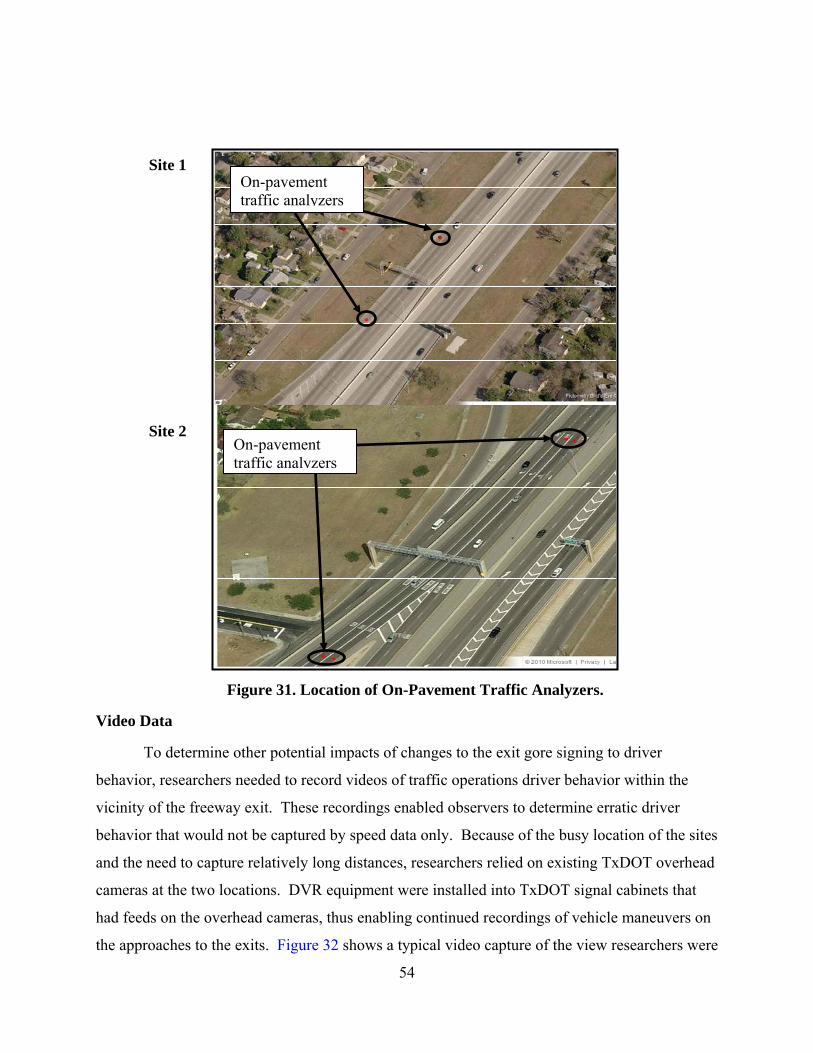
54
Video Data
To determine other potential impacts of changes to the exit gore signing to driver
behavior, researchers needed to record videos of traffic operations driver behavior within the
vicinity of the freeway exit. These recordings enabled observers to determine erratic driver
behavior that would not be captured by speed data only. Because of the busy location of the sites
and the need to capture relatively long distances, researchers relied on existing TxDOT overhead
cameras at the two locations. DVR equipment were installed into TxDOT signal cabinets that
had feeds on the overhead cameras, thus enabling continued recordings of vehicle maneuvers on
the approaches to the exits. Figure 32 shows a typical video capture of the view researchers were
Site 1 On-pavement traffic analyzers
Site 2 On-pavement traffic analyzers
Figure 31. Location of On-Pavement Traffic Analyzers.

55
afforded through the overhead cameras. The video gave researchers the capability of
investigating several driver behavior characteristics that would otherwise not have been captured
with the on-pavement traffic analyzer.
SB SH-286 exit to Port Ave. SB SH-286 exit to SH-358
Figure 32. Typical Video Feed Captures from TxDOT Overhead Cameras.

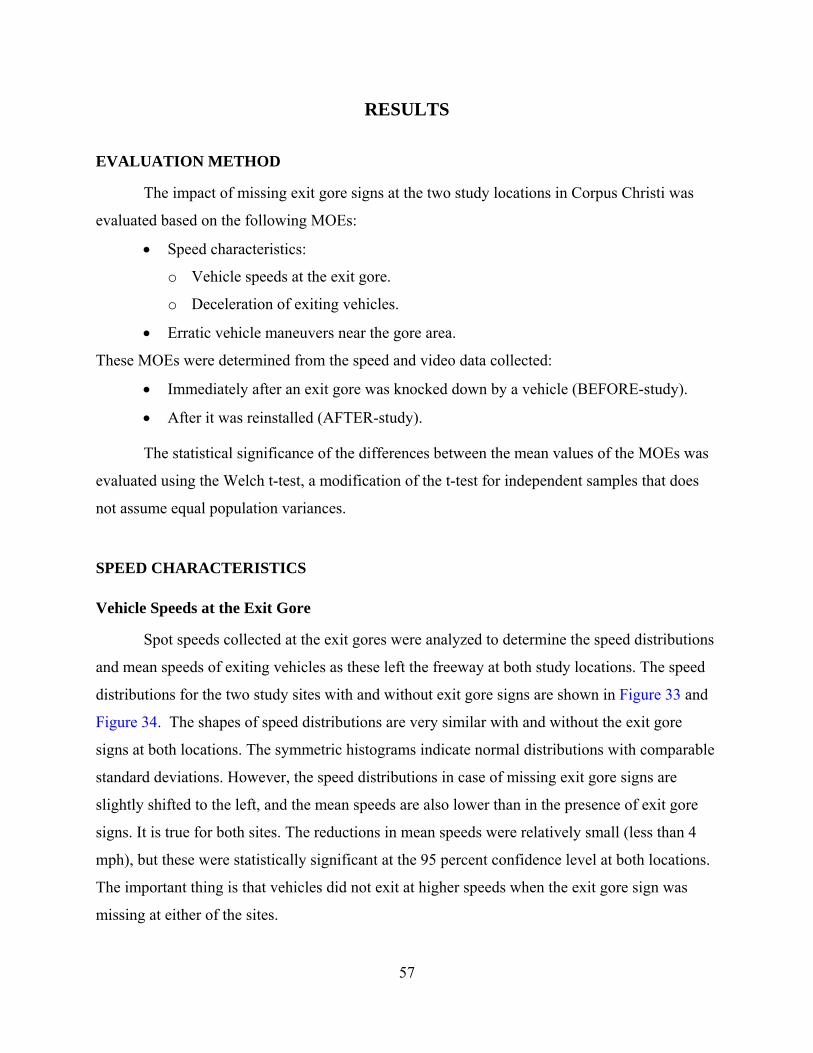
57
RESULTS
EVALUATION METHOD
The impact of missing exit gore signs at the two study locations in Corpus Christi was
evaluated based on the following MOEs:
• Speed characteristics:
o Vehicle speeds at the exit gore.
o Deceleration of exiting vehicles.
• Erratic vehicle maneuvers near the gore area.
These MOEs were determined from the speed and video data collected:
• Immediately after an exit gore was knocked down by a vehicle (BEFORE-study).
• After it was reinstalled (AFTER-study).
The statistical significance of the differences between the mean values of the MOEs was
evaluated using the Welch t-test, a modification of the t-test for independent samples that does
not assume equal population variances.
SPEED CHARACTERISTICS
Vehicle Speeds at the Exit Gore
Spot speeds collected at the exit gores were analyzed to determine the speed distributions
and mean speeds of exiting vehicles as these left the freeway at both study locations. The speed
distributions for the two study sites with and without exit gore signs are shown in Figure 33 and
Figure 34. The shapes of speed distributions are very similar with and without the exit gore
signs at both locations. The symmetric histograms indicate normal distributions with comparable
standard deviations. However, the speed distributions in case of missing exit gore signs are
slightly shifted to the left, and the mean speeds are also lower than in the presence of exit gore
signs. It is true for both sites. The reductions in mean speeds were relatively small (less than 4
mph), but these were statistically significant at the 95 percent confidence level at both locations.
The important thing is that vehicles did not exit at higher speeds when the exit gore sign was
missing at either of the sites.
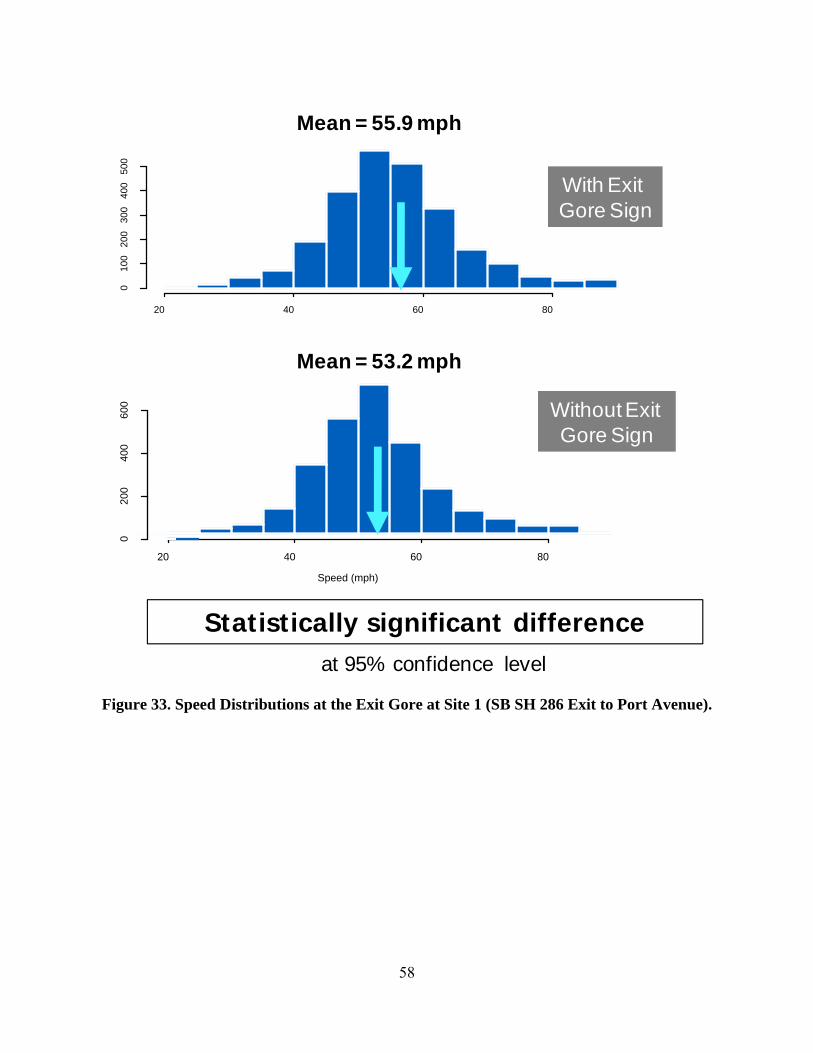
58
20 40 60 80
010
020
030
040
050
0With Sign
Speed (mph)
20 40 60 80
Without Sign
Speed (mph)
Mean = 55.9 mph
Mean = 53.2 mph
at 95% confidence level
Statistically significant difference
With Exit Gore Sign
Without Exit Gore Sign
020
040
060
0
Figure 33. Speed Distributions at the Exit Gore at Site 1 (SB SH 286 Exit to Port Avenue).

59
at 95% confidence level
Statistically significant difference
20 40 60 80
050
010
0015
00
Without Sign
Speed (mph)
20 40 60 80 100
050
015
0025
00With Sign
Speed (mph)
Mean = 61.2 mph
Mean = 57.6 mph
With Exit Gore Sign
Without Exit Gore Sign
Figure 34. Speed Distributions at the Exit Gore at Site 2 (SB SH 286 Exit to SH 358).
Deceleration of Exiting Vehicles
In addition to collecting spot speed data, researchers tracked exiting vehicles and
recorded the deceleration profiles at each study site to determine the impact of missing exit gore
signs on deceleration behavior of drivers of exiting vehicles. Vehicle tracking made it possible
to identify vehicle positions at decreasing speed levels. For example, Figure 35 shows the
average positions of exiting vehicles as the drivers reduced their speeds first to 55 mph and then
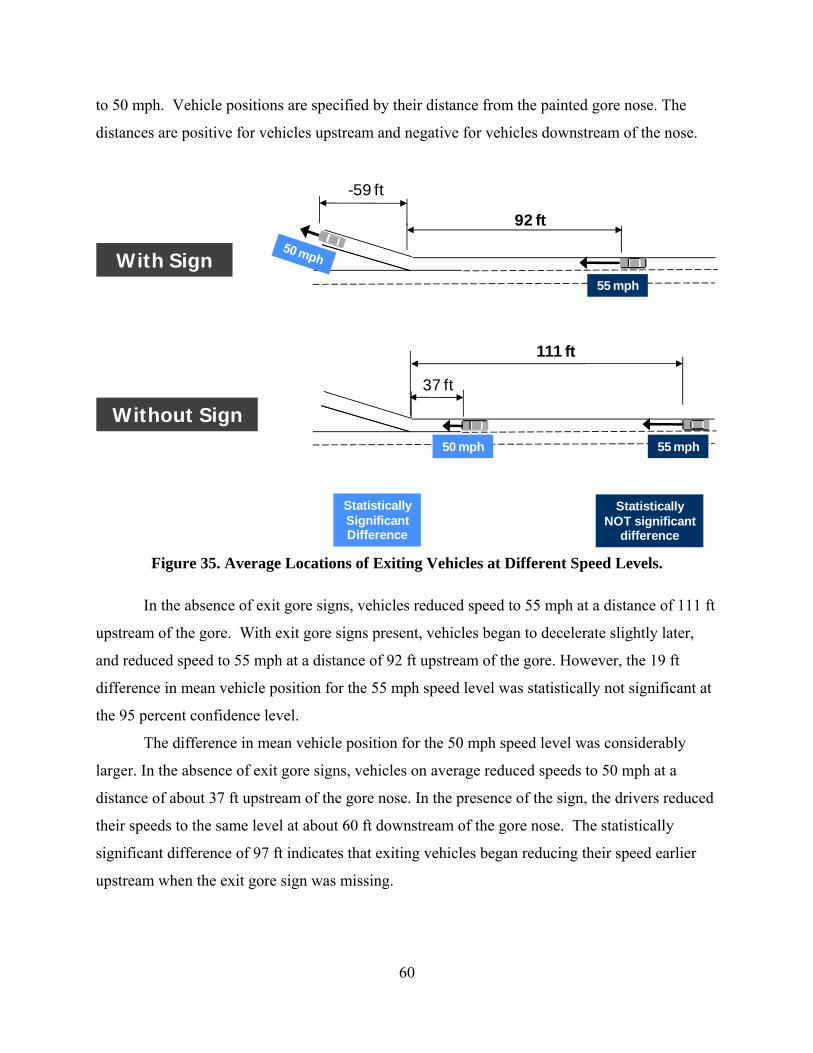
60
to 50 mph. Vehicle positions are specified by their distance from the painted gore nose. The
distances are positive for vehicles upstream and negative for vehicles downstream of the nose.
With Sign
Without Sign
111 ft
92 ft
-59 ft
37 ft
50 mph 55 mph
55 mph
StatisticallyNOT significant
difference
Statistically SignificantDifference
Figure 35. Average Locations of Exiting Vehicles at Different Speed Levels.
In the absence of exit gore signs, vehicles reduced speed to 55 mph at a distance of 111 ft
upstream of the gore. With exit gore signs present, vehicles began to decelerate slightly later,
and reduced speed to 55 mph at a distance of 92 ft upstream of the gore. However, the 19 ft
difference in mean vehicle position for the 55 mph speed level was statistically not significant at
the 95 percent confidence level.
The difference in mean vehicle position for the 50 mph speed level was considerably
larger. In the absence of exit gore signs, vehicles on average reduced speeds to 50 mph at a
distance of about 37 ft upstream of the gore nose. In the presence of the sign, the drivers reduced
their speeds to the same level at about 60 ft downstream of the gore nose. The statistically
significant difference of 97 ft indicates that exiting vehicles began reducing their speed earlier
upstream when the exit gore sign was missing.
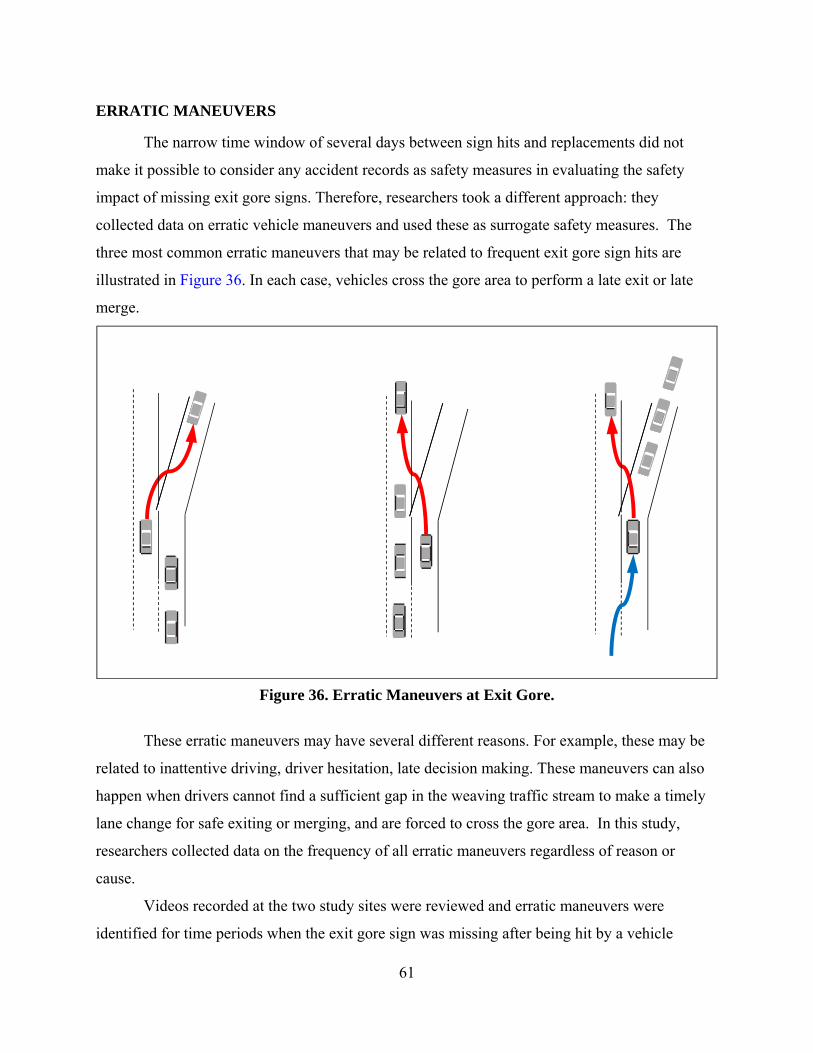
61
ERRATIC MANEUVERS
The narrow time window of several days between sign hits and replacements did not
make it possible to consider any accident records as safety measures in evaluating the safety
impact of missing exit gore signs. Therefore, researchers took a different approach: they
collected data on erratic vehicle maneuvers and used these as surrogate safety measures. The
three most common erratic maneuvers that may be related to frequent exit gore sign hits are
illustrated in Figure 36. In each case, vehicles cross the gore area to perform a late exit or late
merge.
Figure 36. Erratic Maneuvers at Exit Gore.
These erratic maneuvers may have several different reasons. For example, these may be
related to inattentive driving, driver hesitation, late decision making. These maneuvers can also
happen when drivers cannot find a sufficient gap in the weaving traffic stream to make a timely
lane change for safe exiting or merging, and are forced to cross the gore area. In this study,
researchers collected data on the frequency of all erratic maneuvers regardless of reason or
cause.
Videos recorded at the two study sites were reviewed and erratic maneuvers were
identified for time periods when the exit gore sign was missing after being hit by a vehicle
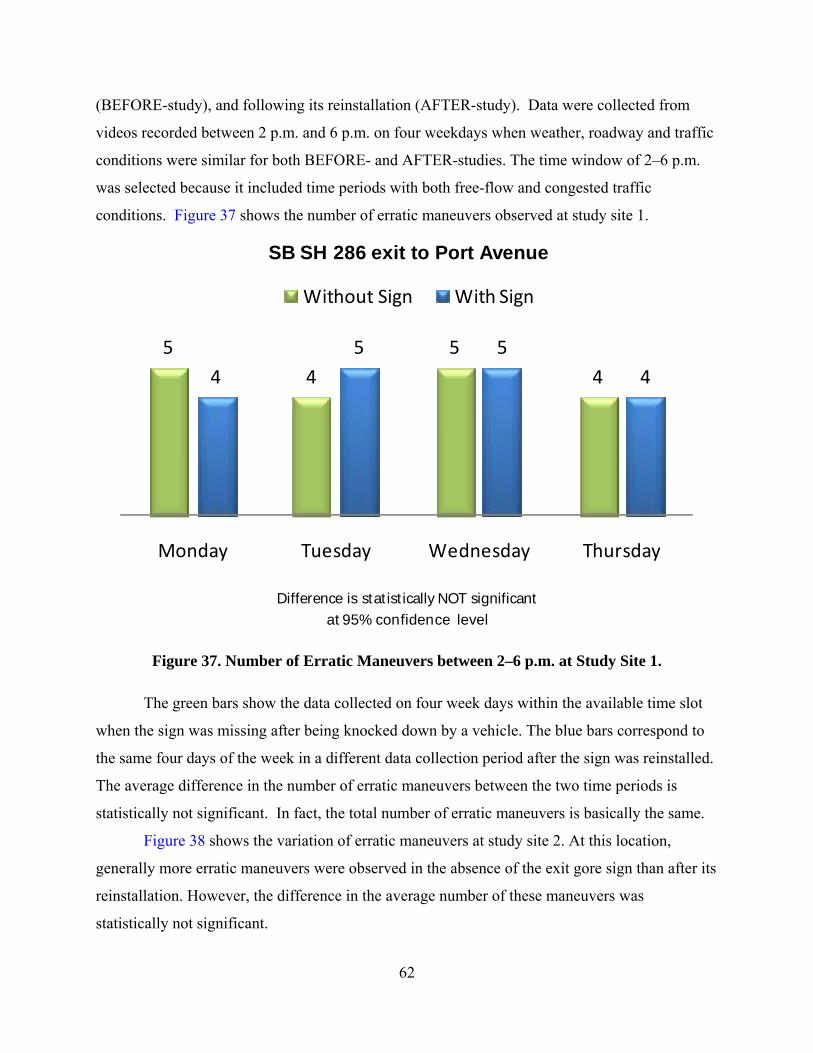
62
(BEFORE-study), and following its reinstallation (AFTER-study). Data were collected from
videos recorded between 2 p.m. and 6 p.m. on four weekdays when weather, roadway and traffic
conditions were similar for both BEFORE- and AFTER-studies. The time window of 2–6 p.m.
was selected because it included time periods with both free-flow and congested traffic
conditions. Figure 37 shows the number of erratic maneuvers observed at study site 1.
54
544
5 54
Monday Tuesday Wednesday Thursday
Without Sign With Sign
Difference is statistically NOT significantat 95% confidence level
SB SH 286 exit to Port Avenue
Figure 37. Number of Erratic Maneuvers between 2–6 p.m. at Study Site 1.
The green bars show the data collected on four week days within the available time slot
when the sign was missing after being knocked down by a vehicle. The blue bars correspond to
the same four days of the week in a different data collection period after the sign was reinstalled.
The average difference in the number of erratic maneuvers between the two time periods is
statistically not significant. In fact, the total number of erratic maneuvers is basically the same.
Figure 38 shows the variation of erratic maneuvers at study site 2. At this location,
generally more erratic maneuvers were observed in the absence of the exit gore sign than after its
reinstallation. However, the difference in the average number of these maneuvers was
statistically not significant.
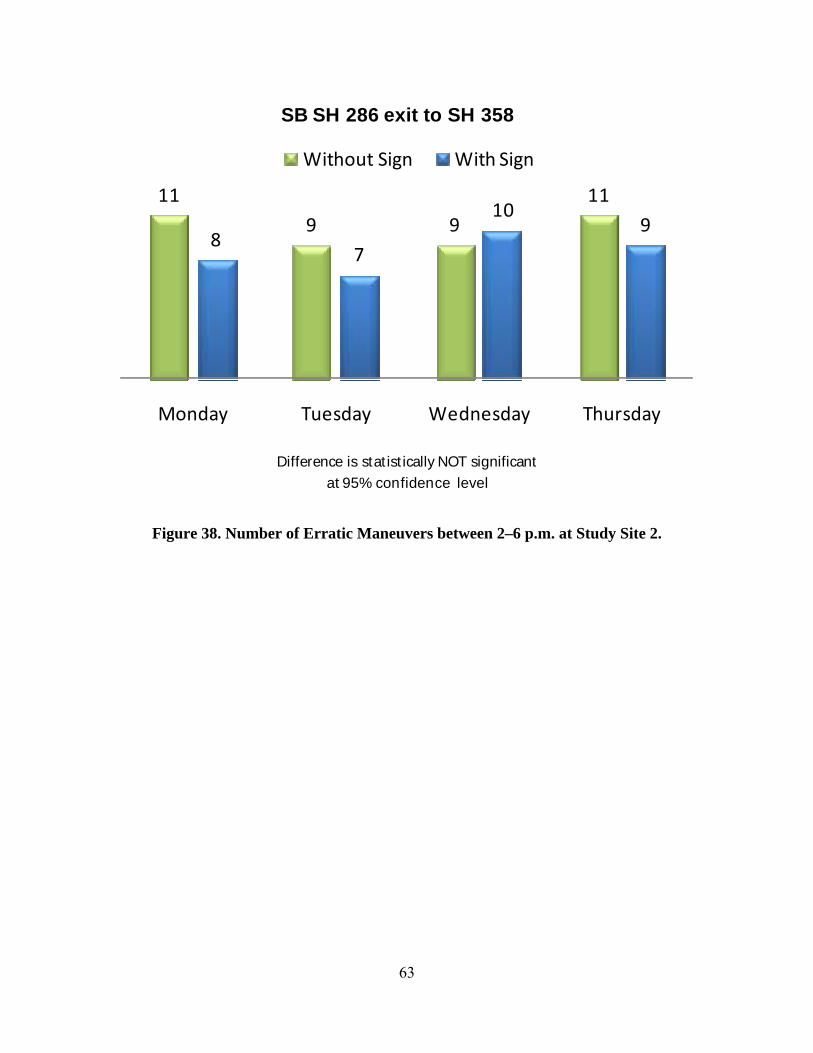
63
119 9
11
87
109
Monday Tuesday Wednesday Thursday
Without Sign With Sign
Difference is statistically NOT significantat 95% confidence level
SB SH 286 exit to SH 358
Figure 38. Number of Erratic Maneuvers between 2–6 p.m. at Study Site 2.


65
SUMMARY AND CONCLUSIONS
RESEARCH SUMMARY
Exit gore signs present a significant maintenance challenge for TxDOT. There is
particular concern regarding the safety of personnel working in gore areas to replace these signs,
and the resources necessary for continual maintenance. In addition to exit gore signs, other
roadside signs that are located near the travel lanes due to lack of available clear zone are also
prime high-impact candidates.
The objective of this research was to identify and evaluate alternative signing methods
that may reduce the number of sign hits as well as the costs and resources required for sign
replacement and maintenance. Researchers identified and visited several sites with safety
problems related to unusually frequent sign hits, and determined the major factors that typically
contribute to these sign crashes. The most common factors belonged to at least one of the
following categories:
• Geometric Design Characteristics.
• Driver Behavior.
• Sign Location and Placement.
• Pavement Markings Conditions.
• Poor Night-Time Visibility.
Researchers recommended potential treatments and countermeasures to address some of
the issues identified in these categories. Table 8 summarizes the list of treatments. The list also
included some simple treatments such as relocating or eliminating the exit gore signs at those
locations where sufficient advance signing for the exit is provided, the exit gore is well
delineated, and there are no sight distance and visibility issues. Several districts have
implemented sign relocation farther back in the gore, but the feasibility of sign removal has not
been studied. The project advisors expressed a particular interest in evaluating the impact of
eliminating exit gore signs at locations where:
• Appropriate advance warning with overhead exit signs are provided.
• There are no visibility and sight distance issues.
• There is no major drop between freeway speed and advisory ramp speed.

66
Since MUTCD (2) requires exit gore signs, removing these signs for the purpose of field
evaluations was not possible. Therefore, researchers took a different approach by taking
advantage of events when vehicles knocked down exit gore signs. Once a vehicle hits a sign, the
time until reinstallation provided researchers a good opportunity to collect data without violating
MUTCD requirements. Field studies were conducted at two freeway exits in Corpus Christi,
Texas. The impact of the absence of exit gore signs was evaluated based on vehicle speeds at the
exit gore, deceleration profiles of exiting vehicles, and erratic vehicle maneuvers near the gore
area.
CONCLUSIONS
Based on the results of field data collections at the two study sites in Corpus Christi, the
following observations were made in terms of speed characteristics and erratic maneuvers:
• Exiting vehicles began reducing their speeds earlier upstream when the exit gore sign
was missing.
• No statistically significant difference in the frequency of erratic maneuvers at either
of the two study sites.
The lack of exit gore signs at the two freeway exits did not have any negative
consequence in terms of vehicle speeds, deceleration behavior, and erratic maneuvers. The field
study results suggest that there are locations where overhead exit signs provide sufficient
advance warning and exit gore signs may not be needed. If the MUTCD would provide more
flexibility in determining the need for the signs, these could probably be eliminated at several
freeway exits, thus helping reduce the number of sign hits as well as the costs and resources
required for sign replacement and maintenance.
67
REFERENCES
1. AASHTO. A Policy on Geometric Design of Highways and Streets, American Association of
State Highway and Transportation Officials, Washington, D.C., 2004.
2. FHWA. Manual of Uniform Traffic Control Devices (MUTCD), Federal Highway
Administration, U.S. Department of Transportation, Washington, D.C., 2003.
3. Davis, M. M. and K. M. Williams. Vehicle Operating Characteristics on Outer Loop
Deceleration Lanes of Interchanges. Report No. 43, Ontario Department of Highways,
Ontario Joint Highway Research Programme, 1968.
4. Koepke, F. J. Ramp Exit/Entrance Design—Taper versus Parallel and Critical Dimensions.
Transportation Research Record: Journal of the Transportation Research Board, No. 1385,
Transportation Research Board of the National Academies, Washington, D.C., 1993,
pp. 126–132.
5. AASHTO. Roadside Design Guide, American Association of State Highway and
Transportation Officials, Washington, D.C., 2006.
6. Ross, H. E., Jr., D. L. Sicking and R. A. Zimmer. Recommended Procedures for the Safety
Performance Evaluation of Highway Features. NCHRP Report 350, National Cooperative
Highway Research Program, Transportation Research Board, Washington, D.C., 1993.
7. Highway Capacity Manual, TRB, National Research Council, Washington, D.C., 2000.
8. Report on Passive Speed Control Devices. MassSAFE Report 04-G020-001, Massachusetts
Traffic Safety Research Program, University of Massachusetts. Amherst, MA 2004.


69
APPENDIX A SURVEY QUESTIONNAIRE

71

72
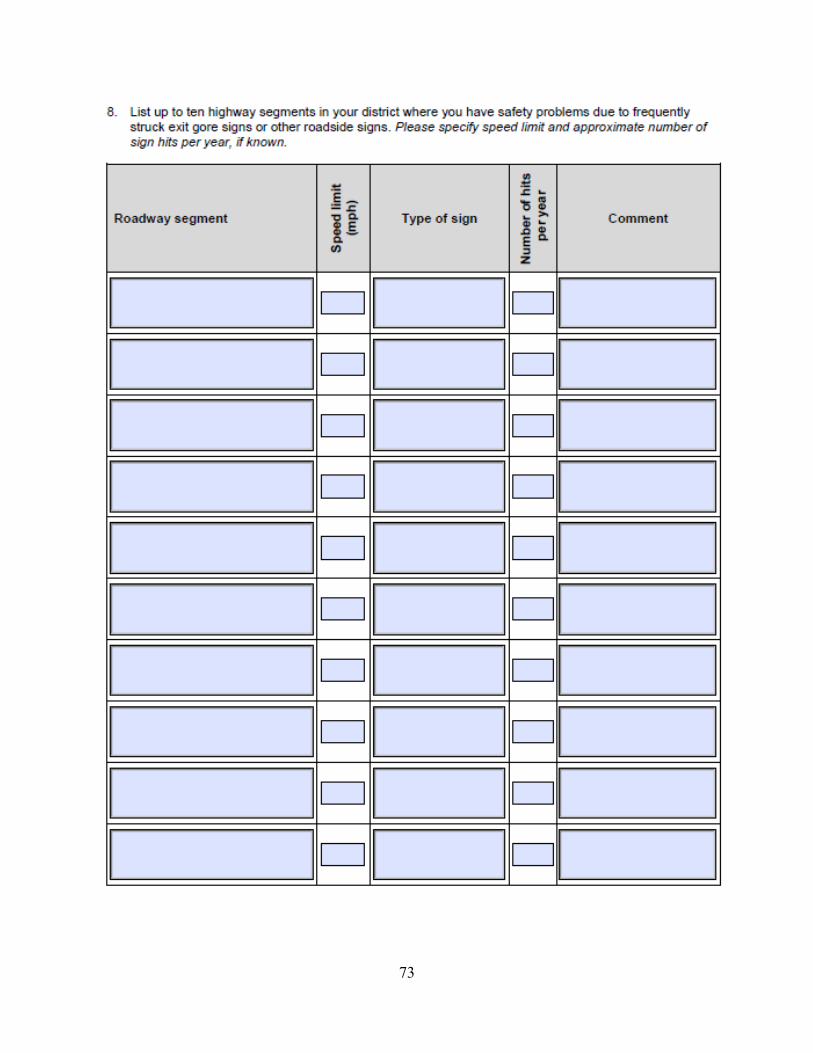
73

74

75
APPENDIX B SUMMARY OF SITE VISITS

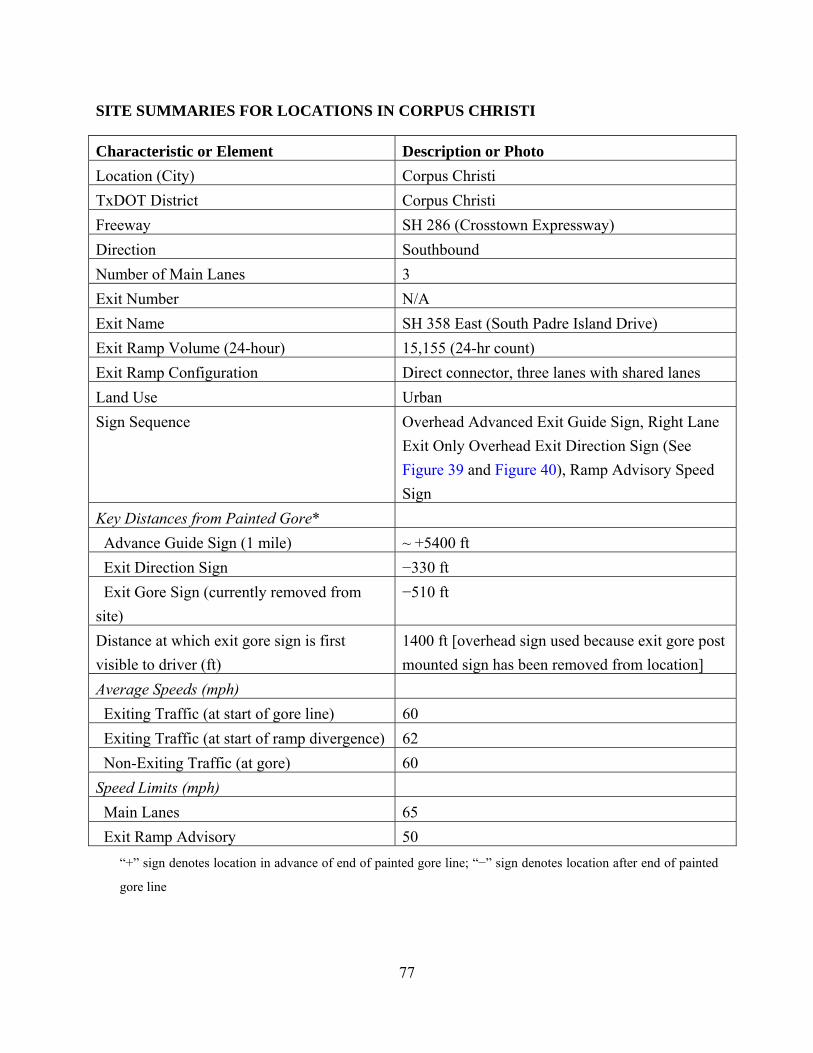
77
SITE SUMMARIES FOR LOCATIONS IN CORPUS CHRISTI
Characteristic or Element Description or Photo Location (City) Corpus Christi TxDOT District Corpus Christi Freeway SH 286 (Crosstown Expressway) Direction Southbound Number of Main Lanes 3 Exit Number N/A Exit Name SH 358 East (South Padre Island Drive) Exit Ramp Volume (24-hour) 15,155 (24-hr count) Exit Ramp Configuration Direct connector, three lanes with shared lanes Land Use Urban Sign Sequence Overhead Advanced Exit Guide Sign, Right Lane
Exit Only Overhead Exit Direction Sign (See Figure 39 and Figure 40), Ramp Advisory Speed Sign
Key Distances from Painted Gore* Advance Guide Sign (1 mile) ~ +5400 ft Exit Direction Sign −330 ft Exit Gore Sign (currently removed from site)
−510 ft
Distance at which exit gore sign is first visible to driver (ft)
1400 ft [overhead sign used because exit gore post mounted sign has been removed from location]
Average Speeds (mph) Exiting Traffic (at start of gore line) 60 Exiting Traffic (at start of ramp divergence) 62 Non-Exiting Traffic (at gore) 60 Speed Limits (mph) Main Lanes 65 Exit Ramp Advisory 50
“+” sign denotes location in advance of end of painted gore line; “−” sign denotes location after end of painted
gore line

78
Observations at This Location
• This is a freeway to freeway direct connector ramp exit. • There was no observed sight distance issue with this location. • High operating speeds were observed on approach to the exit ramp. • Very little visual clutter on approach.
Countermeasure Existing measures taken by the district at this location include:
• Removal of exit sign at gore area.
Potential countermeasures to reduce exit sign impacts include: • Flexible pylons in gore area. • Painted ramp speed on approach lane (existing paintings may not allow this option). • Rumble strips on approach lane. • Relocation of exit gore sign farther into gore area.
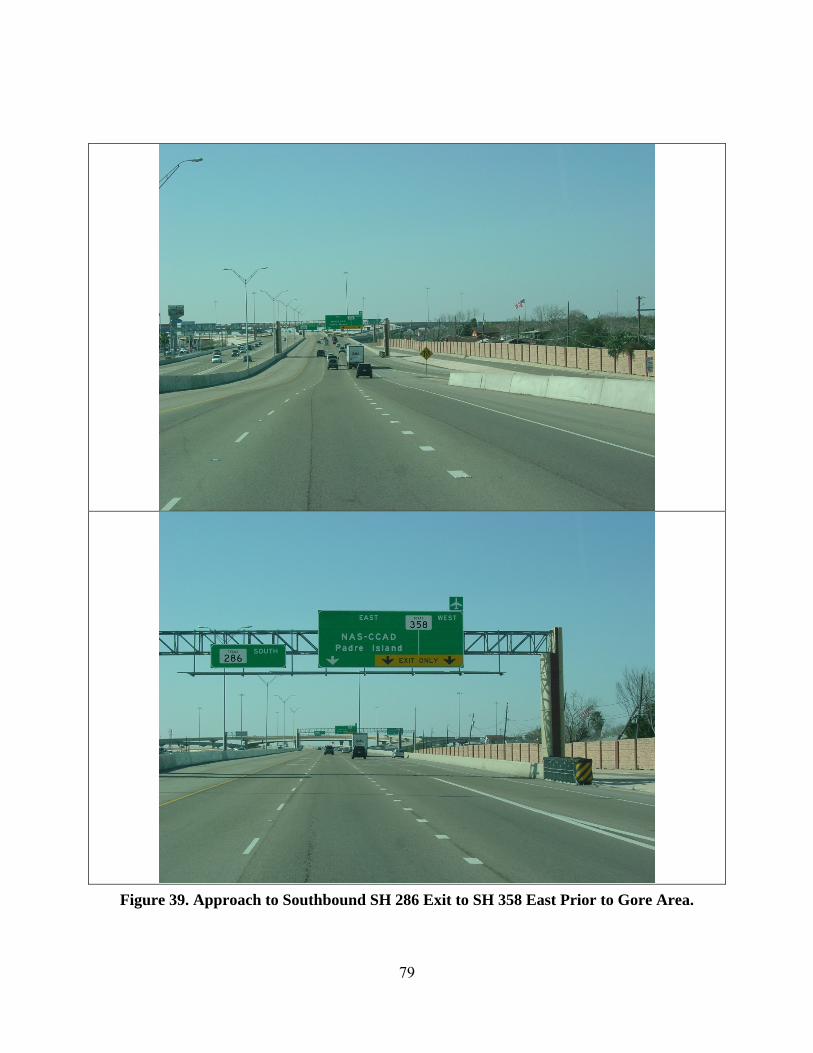
79
Figure 39. Approach to Southbound SH 286 Exit to SH 358 East Prior to Gore Area.
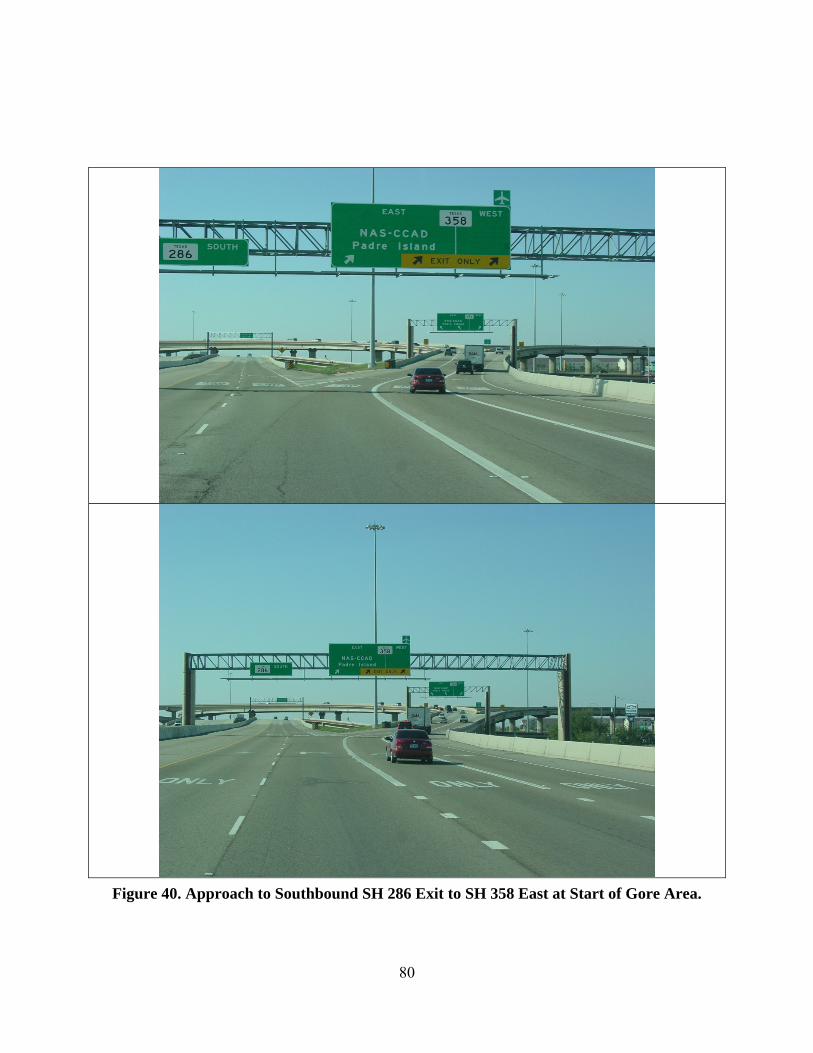
80
Figure 40. Approach to Southbound SH 286 Exit to SH 358 East at Start of Gore Area.
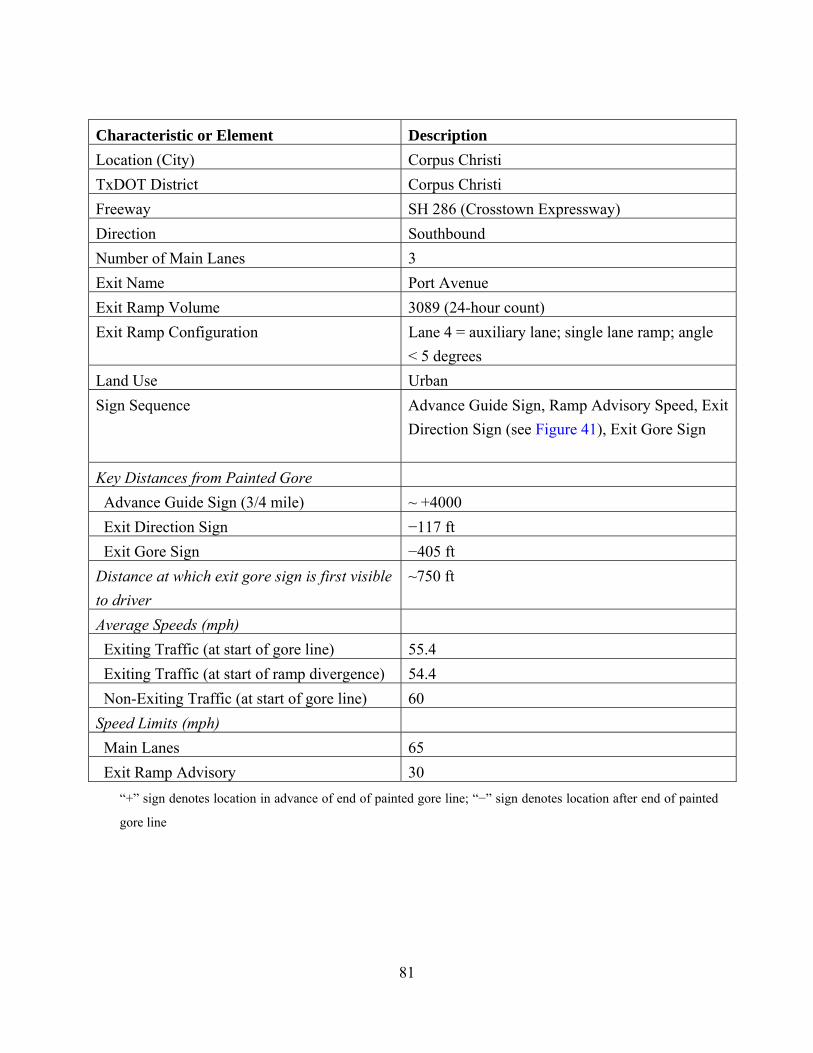
81
Characteristic or Element Description Location (City) Corpus Christi TxDOT District Corpus Christi Freeway SH 286 (Crosstown Expressway) Direction Southbound Number of Main Lanes 3 Exit Name Port Avenue Exit Ramp Volume 3089 (24-hour count) Exit Ramp Configuration Lane 4 = auxiliary lane; single lane ramp; angle
< 5 degrees Land Use Urban Sign Sequence Advance Guide Sign, Ramp Advisory Speed, Exit
Direction Sign (see Figure 41), Exit Gore Sign
Key Distances from Painted Gore Advance Guide Sign (3/4 mile) ~ +4000 Exit Direction Sign −117 ft Exit Gore Sign −405 ft Distance at which exit gore sign is first visible to driver
~750 ft
Average Speeds (mph) Exiting Traffic (at start of gore line) 55.4 Exiting Traffic (at start of ramp divergence) 54.4 Non-Exiting Traffic (at start of gore line) 60 Speed Limits (mph) Main Lanes 65 Exit Ramp Advisory 30
“+” sign denotes location in advance of end of painted gore line; “−” sign denotes location after end of painted
gore line

82
Observations at This Location • There is an entrance ramp in advance of the exit to Port Avenue, making the exit lane a
full auxiliary lane. This location could prove a challenge if flexible pylons are implemented here that will extend the gore line as it will shorten the weaving section on the auxiliary lane.
• There was no observed sight distance issue with this location. • Relatively high operating speeds (about 20 mph over the ramp advisory speed) were
observed on approach to the exit ramp. • Very little visual clutter on approach. • Approximately 260 vehicles made a late maneuver to use the exit ramp within the
24-hour data collection period.
Countermeasures Existing measures taken by the district at this location include:
• Possible relocation of exit sign further back into gore.
Potential countermeasures to reduce exit sign impacts include:
• Flexible pylons in gore area. • Rumble strips on approach lane. • Relocation of exit gore sign farther into gore area.
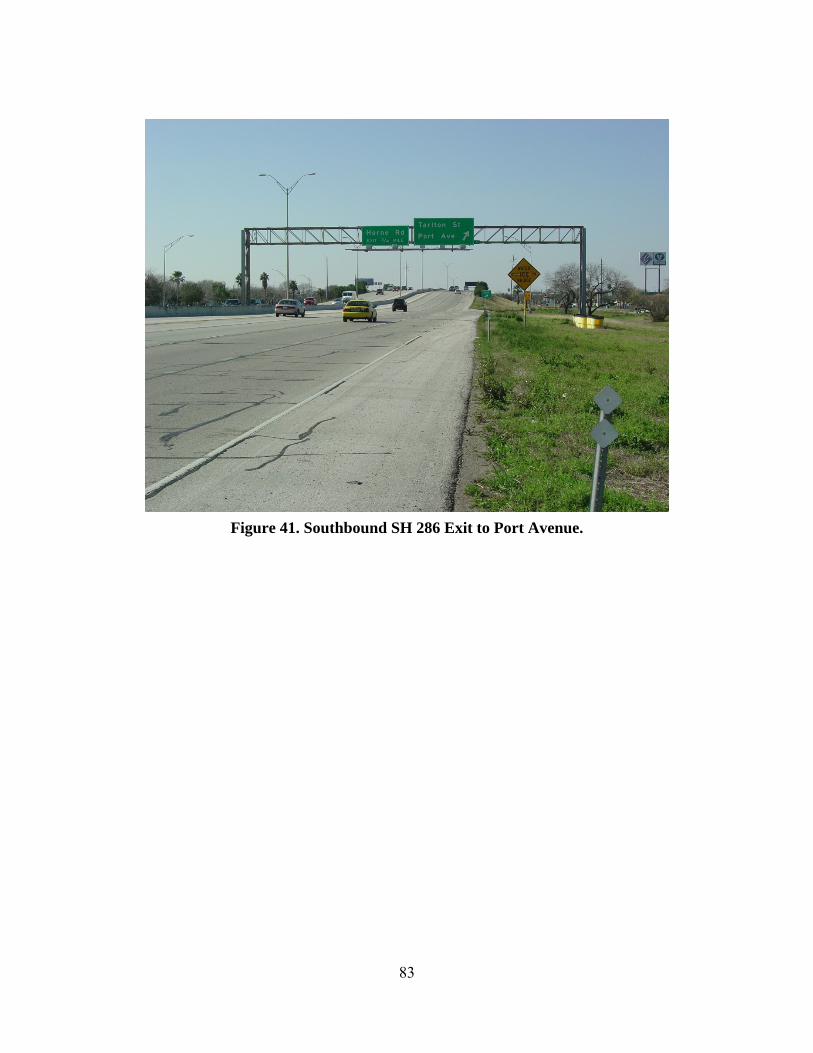
83
Figure 41. Southbound SH 286 Exit to Port Avenue.
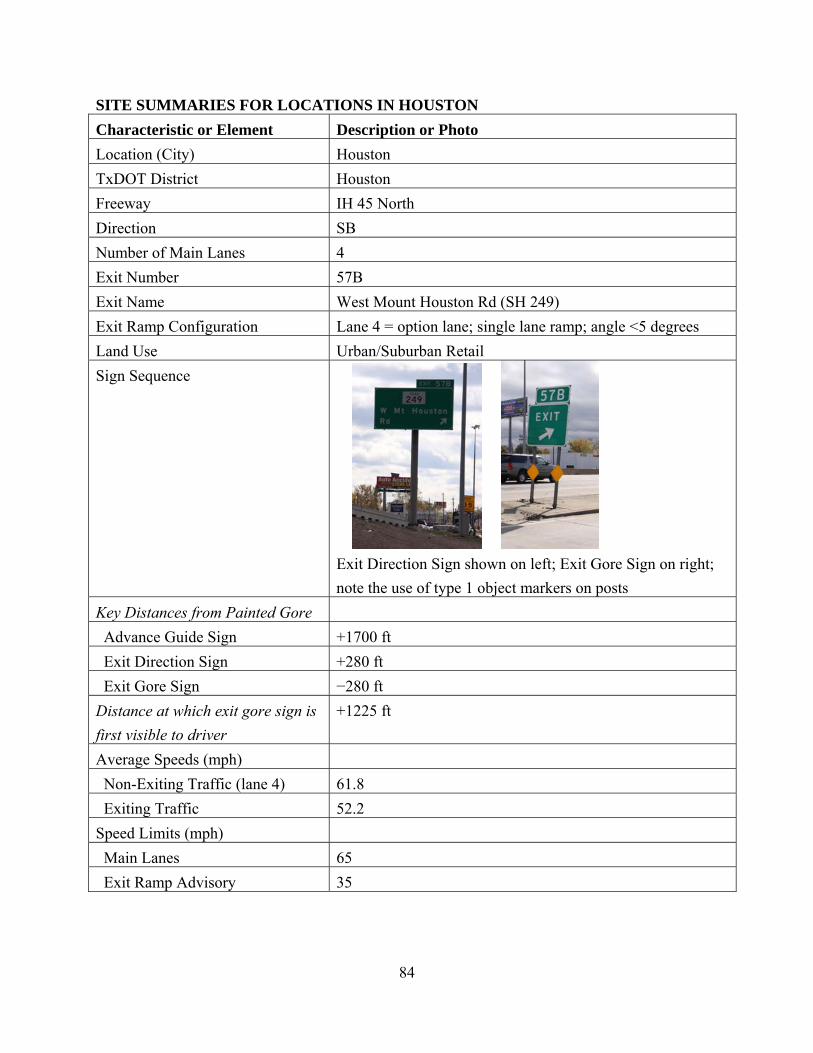
84
SITE SUMMARIES FOR LOCATIONS IN HOUSTON Characteristic or Element Description or Photo Location (City) Houston TxDOT District Houston Freeway IH 45 North Direction SB Number of Main Lanes 4 Exit Number 57B Exit Name West Mount Houston Rd (SH 249) Exit Ramp Configuration Lane 4 = option lane; single lane ramp; angle <5 degrees Land Use Urban/Suburban Retail Sign Sequence
Exit Direction Sign shown on left; Exit Gore Sign on right; note the use of type 1 object markers on posts
Key Distances from Painted Gore Advance Guide Sign +1700 ft Exit Direction Sign +280 ft Exit Gore Sign −280 ft Distance at which exit gore sign is first visible to driver
+1225 ft
Average Speeds (mph) Non-Exiting Traffic (lane 4) 61.8 Exiting Traffic 52.2 Speed Limits (mph) Main Lanes 65 Exit Ramp Advisory 35

85
Observations at This Location • The vertical geometry of IH 45 has up-down grades at crossroads (IH 45 bridge over
intersecting arterials) resulting in limited sight distance upstream and potential downstream queue propagation during congested conditions that may surprise drivers; slight shift in horizontal alignment of main lanes occurs at this exit ramp; constrained right-of-way (<300 ft).
• Inattentive driving, late decision making, and excessive speeding were common driver behavior observed.
Countermeasure Existing measures taken by the district at this location include:
• Type 1 object markers on exit sign post. Potential countermeasures to reduce exit sign impacts include:
• Flexible pylons in gore area. • Rumble strips on approach lane. • Relocation of exit gore sign farther into gore area.
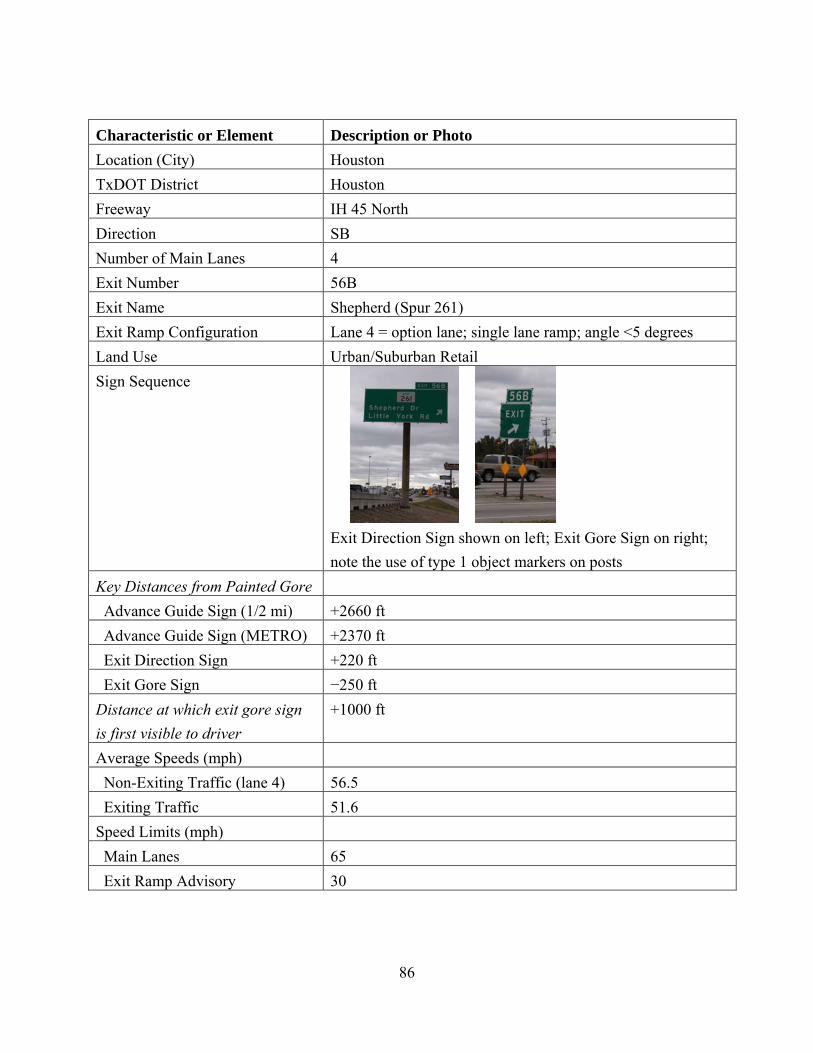
86
Characteristic or Element Description or Photo Location (City) Houston TxDOT District Houston Freeway IH 45 North Direction SB Number of Main Lanes 4 Exit Number 56B Exit Name Shepherd (Spur 261) Exit Ramp Configuration Lane 4 = option lane; single lane ramp; angle <5 degrees Land Use Urban/Suburban Retail Sign Sequence
Exit Direction Sign shown on left; Exit Gore Sign on right; note the use of type 1 object markers on posts
Key Distances from Painted Gore Advance Guide Sign (1/2 mi) +2660 ft Advance Guide Sign (METRO) +2370 ft Exit Direction Sign +220 ft Exit Gore Sign −250 ft Distance at which exit gore sign is first visible to driver
+1000 ft
Average Speeds (mph) Non-Exiting Traffic (lane 4) 56.5 Exiting Traffic 51.6 Speed Limits (mph) Main Lanes 65 Exit Ramp Advisory 30

87
Observations at This Location • The vertical geometry of IH 45 has up-down grades at crossroads (IH 45 bridge over
intersecting arterials) resulting in limited sight distance upstream and potential downstream queue propagation during congested conditions that may surprise drivers; slight shift in horizontal alignment of main lanes occurs at this exit ramp; constrained right-of-way (<300 ft).
• Inattentive driving, late decision making, and excessive speeding were common driver behavior observed.
Countermeasure Existing measures taken by the district at this location include:
• Type 1 object markers on exit sign post. Potential countermeasures to reduce exit sign impacts include:
• Flexible pylons in gore area. • Rumble strips on approach lane. • Relocation of exit gore sign farther into gore area.

88
SITE SUMMARIES FOR LOCATIONS IN SAN ANTONIO Characteristic or Element Description or Photo Location (City) San Antonio TxDOT District San Antonio Freeway Wurzbach Parkway (Expressway, signalized at some
locations) Direction Westbound Number of Main Lanes 2 Exit Number N/A Exit Name Wetmore Road Sign Sequence Overhead Advanced Exit Guide Sign, Curve Advisory
Speed Warning Sign, Advanced Ramp Advisory Speed Sign, Right Lane Exit Only Overhead Exit Direction Sign (See Figure 42), Ramp Advisory Speed Sign
Key Distances from Painted Gore Advance Guide Sign (1/2 mile) +2650 ft Exit Direction Sign +965 ft Exit Gore Sign (currently removed from site)
−440 ft
Distance at which exit gore sign is first visible to driver
685 ft
Average Speeds (mph) Exiting Traffic (at start of gore line) 43 Exiting Traffic (at start of ramp divergence)
31.5
Speed Limits (mph) Main Lanes 60 Exit Ramp Advisory 25
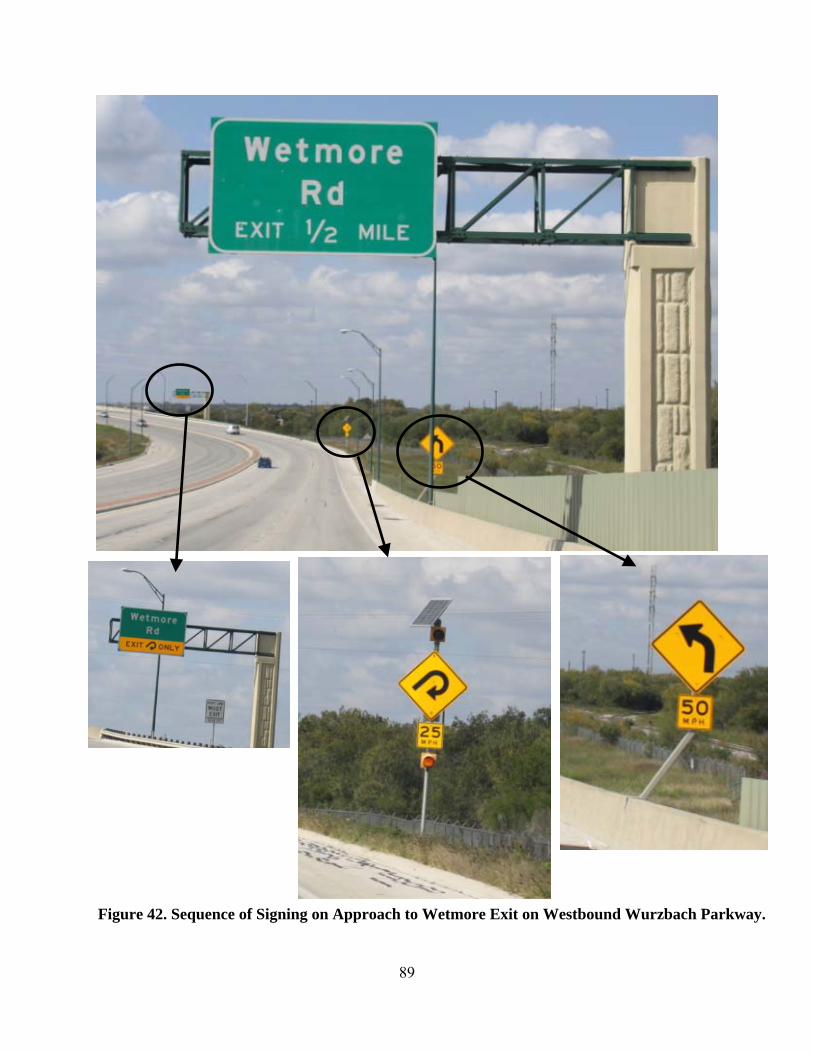
89
Figure 42. Sequence of Signing on Approach to Wetmore Exit on Westbound Wurzbach Parkway.

90
Figure 44. Example of Painted Ramp Speed on Approach to Exit on Wurzbach Parkway.
Figure 43. Driver View on Approach to Wetmore Exit on Wurzbach Parkway.

91
Observations at This Location • Vertical and horizontal curves were observed on approach to exit. • Steep grade on approach to the exit reduces sight distance significantly. • Relatively high speeds were observed on approach to the exit.
Countermeasure Existing measures taken by the district at this location include:
• Advanced ramp advisory speed warning with flashers. • Painted ramp speed on approach lane (see Figure 44). • Rumble strips on approach lane. • Removal of exit gore sign (not an option based on MUTCD).
Potential countermeasures to reduce exit sign impacts include:
• Flexible pylons extending beyond gore area to limit late-decision maneuvers. • Relocation of exit gore sign farther into gore area (this might be difficult due to drop-off
after gore area.
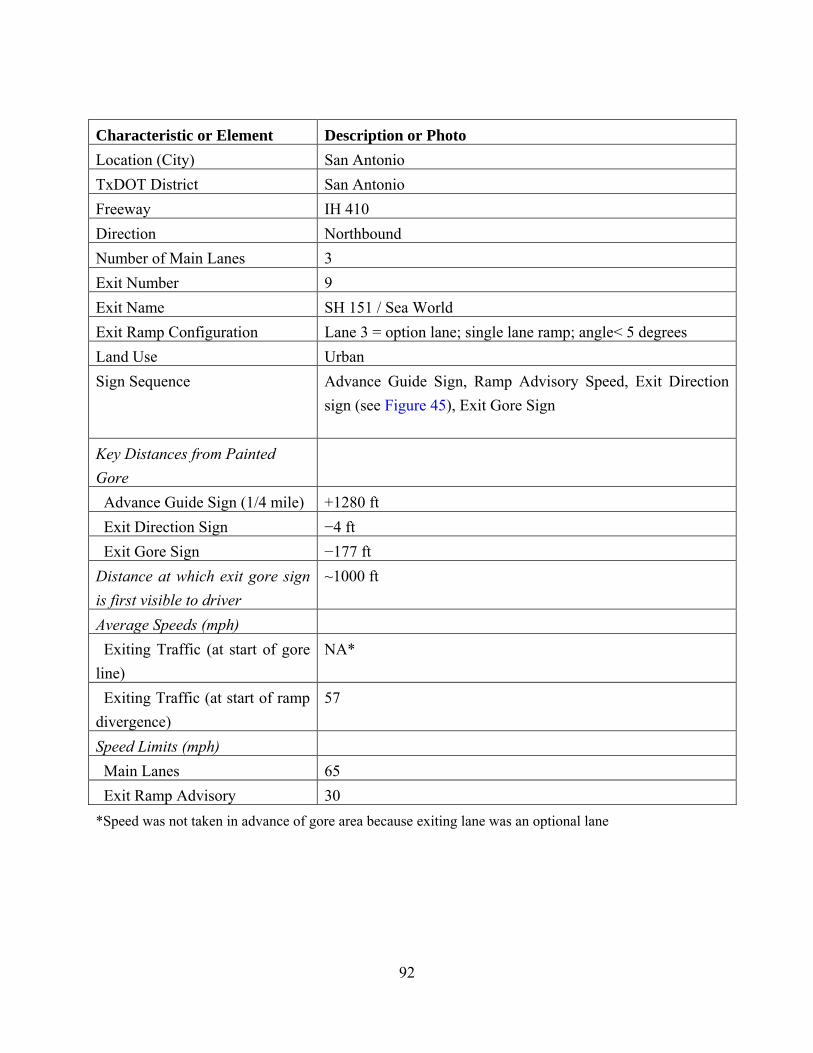
92
Characteristic or Element Description or Photo Location (City) San Antonio TxDOT District San Antonio Freeway IH 410 Direction Northbound Number of Main Lanes 3 Exit Number 9 Exit Name SH 151 / Sea World Exit Ramp Configuration Lane 3 = option lane; single lane ramp; angle< 5 degrees Land Use Urban Sign Sequence Advance Guide Sign, Ramp Advisory Speed, Exit Direction
sign (see Figure 45), Exit Gore Sign
Key Distances from Painted Gore
Advance Guide Sign (1/4 mile) +1280 ft Exit Direction Sign −4 ft Exit Gore Sign −177 ft Distance at which exit gore sign is first visible to driver
~1000 ft
Average Speeds (mph) Exiting Traffic (at start of gore line)
NA*
Exiting Traffic (at start of ramp divergence)
57
Speed Limits (mph) Main Lanes 65 Exit Ramp Advisory 30 *Speed was not taken in advance of gore area because exiting lane was an optional lane

93
Figure 45. Approach to SH 151 Exit on Northbound IH 410.
Observations at This Location
• No obvious geometric deficiencies noted on site. • High speeds were recorded for exiting traffic. • Some visual clutter on approach to exit with numerous roadside signs (see Figure 45). • Late maneuvering was a common observance.
Countermeasure No existing measures were observed at this location. Potential countermeasures include:
• Flexible pylons extending beyond gore area to limit late-decision maneuvers. • Relocation of exit gore sign farther into gore area.
Possible visual clutter obscures exit sign
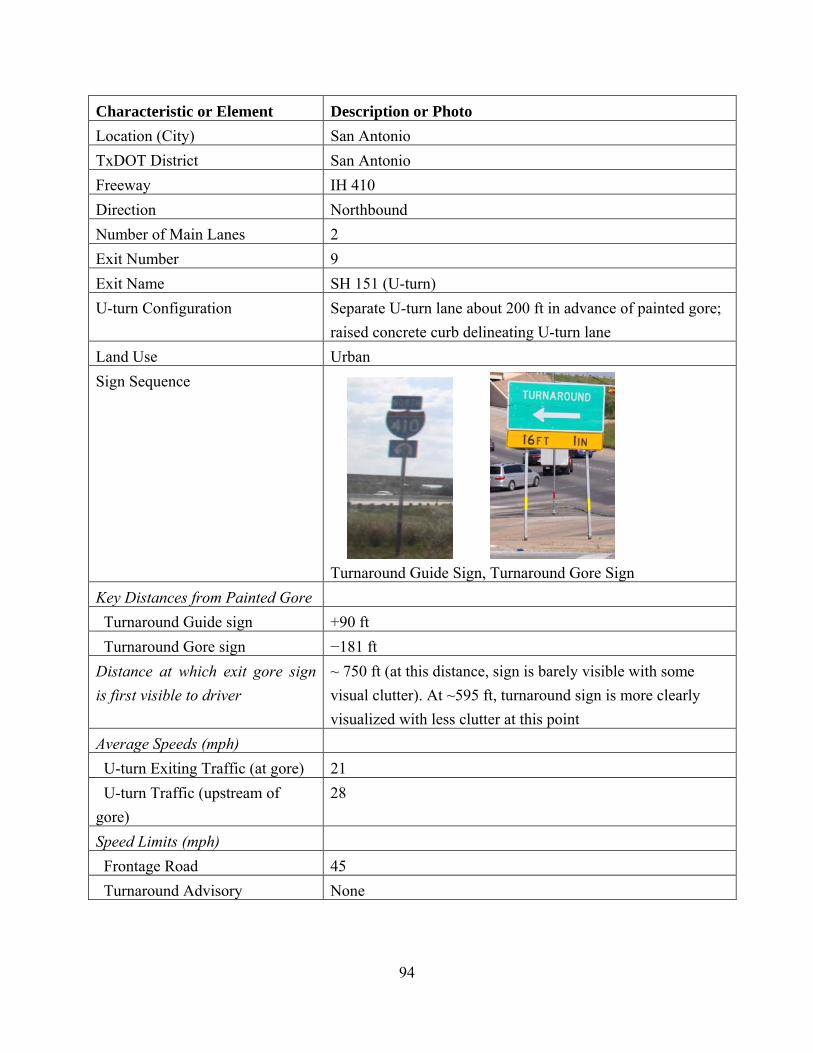
94
Characteristic or Element Description or Photo Location (City) San Antonio TxDOT District San Antonio Freeway IH 410 Direction Northbound Number of Main Lanes 2 Exit Number 9 Exit Name SH 151 (U-turn) U-turn Configuration Separate U-turn lane about 200 ft in advance of painted gore;
raised concrete curb delineating U-turn lane Land Use Urban Sign Sequence
Turnaround Guide Sign, Turnaround Gore Sign
Key Distances from Painted Gore Turnaround Guide sign +90 ft Turnaround Gore sign −181 ft Distance at which exit gore sign is first visible to driver
~ 750 ft (at this distance, sign is barely visible with some visual clutter). At ~595 ft, turnaround sign is more clearly visualized with less clutter at this point
Average Speeds (mph) U-turn Exiting Traffic (at gore) 21 U-turn Traffic (upstream of gore)
28
Speed Limits (mph) Frontage Road 45 Turnaround Advisory None
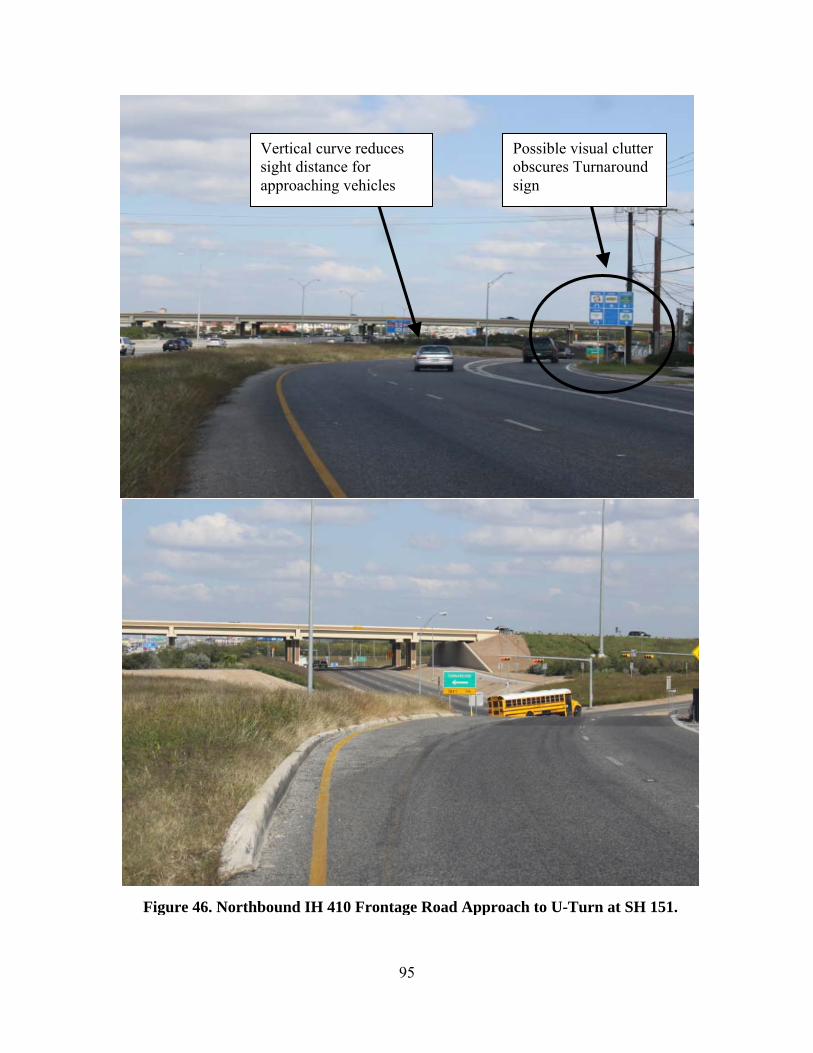
95
Possible visual clutter obscures Turnaround sign
Vertical curve reduces sight distance for approaching vehicles
Figure 46. Northbound IH 410 Frontage Road Approach to U-Turn at SH 151.
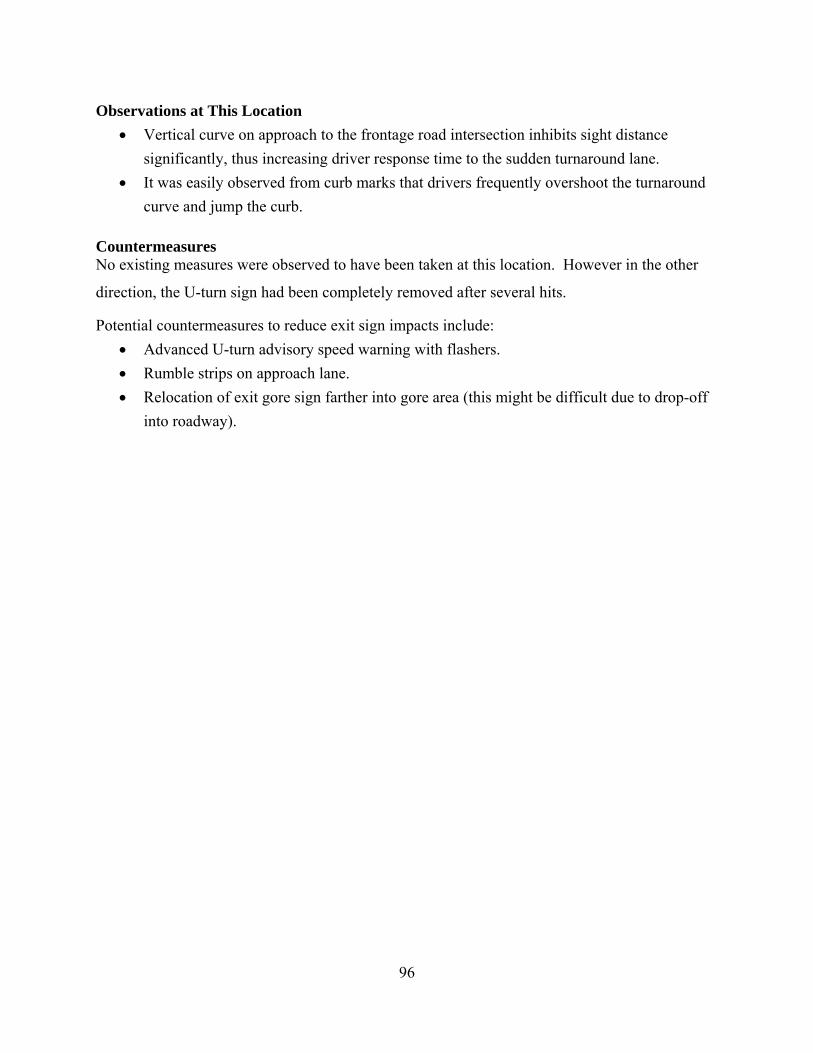
96
Observations at This Location • Vertical curve on approach to the frontage road intersection inhibits sight distance
significantly, thus increasing driver response time to the sudden turnaround lane. • It was easily observed from curb marks that drivers frequently overshoot the turnaround
curve and jump the curb.
Countermeasures No existing measures were observed to have been taken at this location. However in the other
direction, the U-turn sign had been completely removed after several hits.
Potential countermeasures to reduce exit sign impacts include: • Advanced U-turn advisory speed warning with flashers. • Rumble strips on approach lane. • Relocation of exit gore sign farther into gore area (this might be difficult due to drop-off
into roadway).