treatment of liquid pharmaceutical industry … carolina... · conclusão de um mestrado em ......
TRANSCRIPT

Ana Carolina Lopes Oliveira
TREATMENT OF LIQUID PHARMACEUTICAL INDUSTRY EFFLUENTS BY FENTON’S PROCESSES
Master dissertation in Industrial Pharmaceutical Chemistry, supervised by Professor Doctor Jorge António Ribeiro Salvador
and Professor Doctor Rosa M. Quinta-Ferreira and submitted to the Faculty of Pharmacy, University of Coimbra
Setembro 2012

I
TREATMENT OF
LIQUID PHARMACEUTICAL INDUSTRY
EFFLUENTS BY FENTON’S PROCESSES
Dissertation by
ANA CAROLINA LOPES OLIVEIRA
to be presented as requirement to obtain the
degree Master in Industrial Pharmaceutical Chemist.
COIMBRA, 2012

II

III
“The illiterates of XXI century will not be those who can’t read and write, but those who can’t
learn, forget what they have learned and learn again.”
Alvin Toffler

IV

V
ACKNOWLEDGEMENTS
Esta dissertação representa bem mais do que meses de laboratório, simboliza também a
conclusão de um mestrado em Química Farmacêutica Industrial. Assim sendo, gostaria de
agradecer a todos que, de algum modo, permitiram que eu o concretizasse.
Agradeço ao Professor Doutor Jorge António Ribeiro Salvador, meu orientador da
Faculdade de Farmácia da Universidade de Coimbra, pelas críticas, correções e sugestões
relevantes feitas durante a orientação.
Um especial agradecimento à Professora Doutora Rosa M. Quinta-Ferreira, minha
orientadora da Faculdade de Ciências e Tecnologias da Universidade de Coimbra, pelo
amistoso acolhimento no seu grupo de investigação e por todos os ensinamentos que me
transmitiu. Pela confiança, pelo apoio e dedicação. Exemplo a ser seguido como pessoa e
profissional.
Ao Doutor Rui Martins, pela sua disponibilidade, profissionalismo e dedicação. Muito
importante para a minha aprendizagem e para o sucesso deste trabalho.
Às colegas de laboratório, pelo companheirismo, pelos risos, pelo espírito de entreajuda
e principalmente, pela amizade e carinho.
Ao Sr. António Amado e à D. Rosa Gaspar que nunca deixaram de esboçar um sorriso de
apoio.
Aos meus pais, Manuel Monteiro e Zaida Catrocho, pelo apoio incalculável que sempre
demonstraram para o meu sucesso. É com profunda gratidão que reconheço o investimento e o
esforço pessoal que sempre empregaram neste sentido. Sem eles, nada teria sido possível.
À minha irmã, Janete Oliveira, que esteve sempre presente, pelos bons momentos que
passamos juntas, pelo carinho e amizade.
Ao Rui Pedro Matias, pelas palavras de incentivo, apoio incondicional com amor e
carinho.
Aos meus amigos e companheiros que foram importantes ao longo do meu percurso.
A todos aqueles que partilharam os bons e maus momentos, o meu sincero
agradecimento!

VI
VII
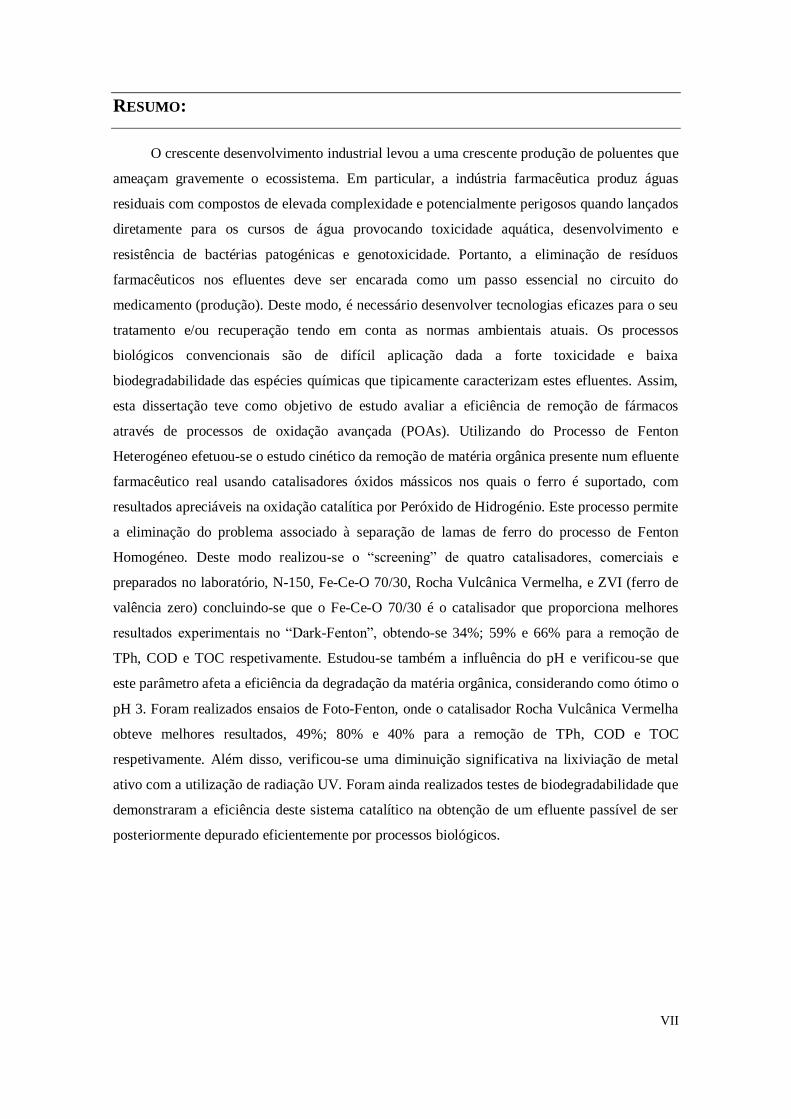
RESUMO:
O crescente desenvolvimento industrial levou a uma crescente produção de poluentes que
ameaçam gravemente o ecossistema. Em particular, a indústria farmacêutica produz águas
residuais com compostos de elevada complexidade e potencialmente perigosos quando lançados
diretamente para os cursos de água provocando toxicidade aquática, desenvolvimento e
resistência de bactérias patogénicas e genotoxicidade. Portanto, a eliminação de resíduos
farmacêuticos nos efluentes deve ser encarada como um passo essencial no circuito do
medicamento (produção). Deste modo, é necessário desenvolver tecnologias eficazes para o seu
tratamento e/ou recuperação tendo em conta as normas ambientais atuais. Os processos
biológicos convencionais são de difícil aplicação dada a forte toxicidade e baixa
biodegradabilidade das espécies químicas que tipicamente caracterizam estes efluentes. Assim,
esta dissertação teve como objetivo de estudo avaliar a eficiência de remoção de fármacos
através de processos de oxidação avançada (POAs). Utilizando do Processo de Fenton
Heterogéneo efetuou-se o estudo cinético da remoção de matéria orgânica presente num efluente
farmacêutico real usando catalisadores óxidos mássicos nos quais o ferro é suportado, com
resultados apreciáveis na oxidação catalítica por Peróxido de Hidrogénio. Este processo permite
a eliminação do problema associado à separação de lamas de ferro do processo de Fenton
Homogéneo. Deste modo realizou-se o “screening” de quatro catalisadores, comerciais e
preparados no laboratório, N-150, Fe-Ce-O 70/30, Rocha Vulcânica Vermelha, e ZVI (ferro de
valência zero) concluindo-se que o Fe-Ce-O 70/30 é o catalisador que proporciona melhores
resultados experimentais no “Dark-Fenton”, obtendo-se 34%; 59% e 66% para a remoção de
TPh, COD e TOC respetivamente. Estudou-se também a influência do pH e verificou-se que
este parâmetro afeta a eficiência da degradação da matéria orgânica, considerando como ótimo o
pH 3. Foram realizados ensaios de Foto-Fenton, onde o catalisador Rocha Vulcânica Vermelha
obteve melhores resultados, 49%; 80% e 40% para a remoção de TPh, COD e TOC
respetivamente. Além disso, verificou-se uma diminuição significativa na lixiviação de metal
ativo com a utilização de radiação UV. Foram ainda realizados testes de biodegradabilidade que
demonstraram a eficiência deste sistema catalítico na obtenção de um efluente passível de ser
posteriormente depurado eficientemente por processos biológicos.

VIII
IX
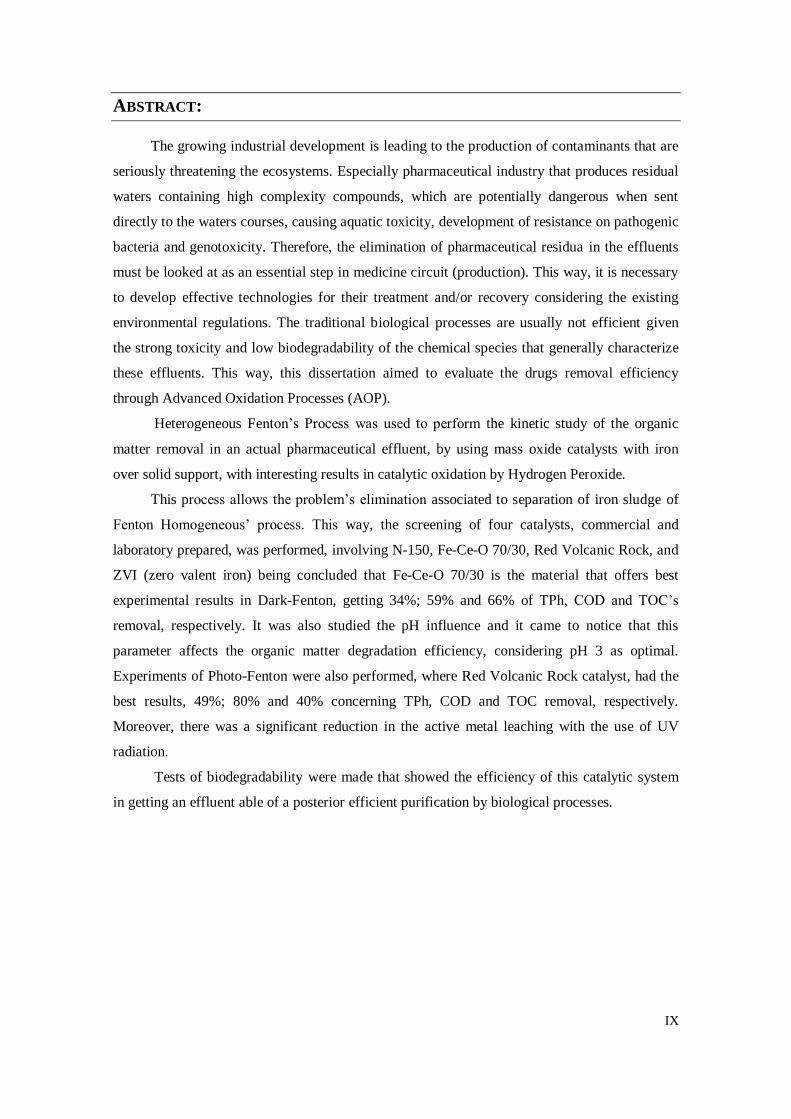
ABSTRACT:
The growing industrial development is leading to the production of contaminants that are
seriously threatening the ecosystems. Especially pharmaceutical industry that produces residual
waters containing high complexity compounds, which are potentially dangerous when sent
directly to the waters courses, causing aquatic toxicity, development of resistance on pathogenic
bacteria and genotoxicity. Therefore, the elimination of pharmaceutical residua in the effluents
must be looked at as an essential step in medicine circuit (production). This way, it is necessary
to develop effective technologies for their treatment and/or recovery considering the existing
environmental regulations. The traditional biological processes are usually not efficient given
the strong toxicity and low biodegradability of the chemical species that generally characterize
these effluents. This way, this dissertation aimed to evaluate the drugs removal efficiency
through Advanced Oxidation Processes (AOP).
Heterogeneous Fenton’s Process was used to perform the kinetic study of the organic
matter removal in an actual pharmaceutical effluent, by using mass oxide catalysts with iron
over solid support, with interesting results in catalytic oxidation by Hydrogen Peroxide.
This process allows the problem’s elimination associated to separation of iron sludge of
Fenton Homogeneous’ process. This way, the screening of four catalysts, commercial and
laboratory prepared, was performed, involving N-150, Fe-Ce-O 70/30, Red Volcanic Rock, and
ZVI (zero valent iron) being concluded that Fe-Ce-O 70/30 is the material that offers best
experimental results in Dark-Fenton, getting 34%; 59% and 66% of TPh, COD and TOC’s
removal, respectively. It was also studied the pH influence and it came to notice that this
parameter affects the organic matter degradation efficiency, considering pH 3 as optimal.
Experiments of Photo-Fenton were also performed, where Red Volcanic Rock catalyst, had the
best results, 49%; 80% and 40% concerning TPh, COD and TOC removal, respectively.
Moreover, there was a significant reduction in the active metal leaching with the use of UV
radiation.
Tests of biodegradability were made that showed the efficiency of this catalytic system
in getting an effluent able of a posterior efficient purification by biological processes.

X

XI
LIST OF CONTENTS
RESUMO
ABSTRACT
LIST OF CONTENTS
LIST OF FIGURES
LIST OF TABLES
VII
IX
XI
XIII
XIV
1 INTRODUCTION 1
1.1 ENVIRONMENTAL PROBLEM 1
1.2 MOST COMMON TECHNOLOGIES FOR EFFLUENTS TREATMENT 2
1.3 ADVANCED OXIDATIVE PROCESSES 4
1.3.1 H2O2 / FE2+
(FENTON) 7
1.3.2 H2O2 / FE2+
/UV (PHOTO-FENTON) 10
1.4 OBJECTIVES OF THE THESIS: 12
1.5 THESIS’ STRUCTURE 13
2 STATE OF THE ART 14
3 EXPERIMENTAL METHODOLOGY 24
3.1 CATALYST PREPARATION AND CHARACTERIZATION 24
3.2 COAGULATION PROCEDURE 24
3.3 OXIDATION PROCEDURE 25
3.3.1 DARK FENTON´S TREATMENT 25
3.3.2 PHOTO FENTON´S TREATMENT 26
3.4 ANALYTICAL TECHNIQUES 26
3.4.1 COD - Chemical Oxygen Demand 26
3.4.2 TPh - Total Phenol Content 27
3.4.3 TOC- Total Organic Carbon 27
3.4.4 BOD5- Biochemical Oxygen Demand 27
3.4.5 pH 28
3.4.6 Residual Hydrogen Peroxide 29
3.4.7 Effluent’s Biodegradability 29

XII
3.4.8 Actinometry 29
3.4.9 Iron Leaching Measurement 30
3.4.10 Suspended Solids 31
4 RESULTS AND DISCUSSION 34
4.1 EFFLUENT’S CHARACTERIZATION 34
4.2 PRELIMINARY EXPERIMENTS 35
4.2.1 COAGULATION 35
4.2.2 SUSPENDED SOLIDS 36
4.3 CATALYSTS SCREENING 37
4.3.1 DARK FENTON´S TREATMENT 38
4.3.1.1 pH’S INFLUENCE ON THE PROCESS PERFORMANCE 43
4.3.2 PHOTO-FENTON´S TREATMENT 45
5 CONCLUSIONS AND FUTURE WORK SUGGESTION 48
5.1 CONCLUSIONS 48
5.2 FUTURE WORK SUGGESTION 49
6 REFERENCES 50

XIII
LIST OF FIGURES
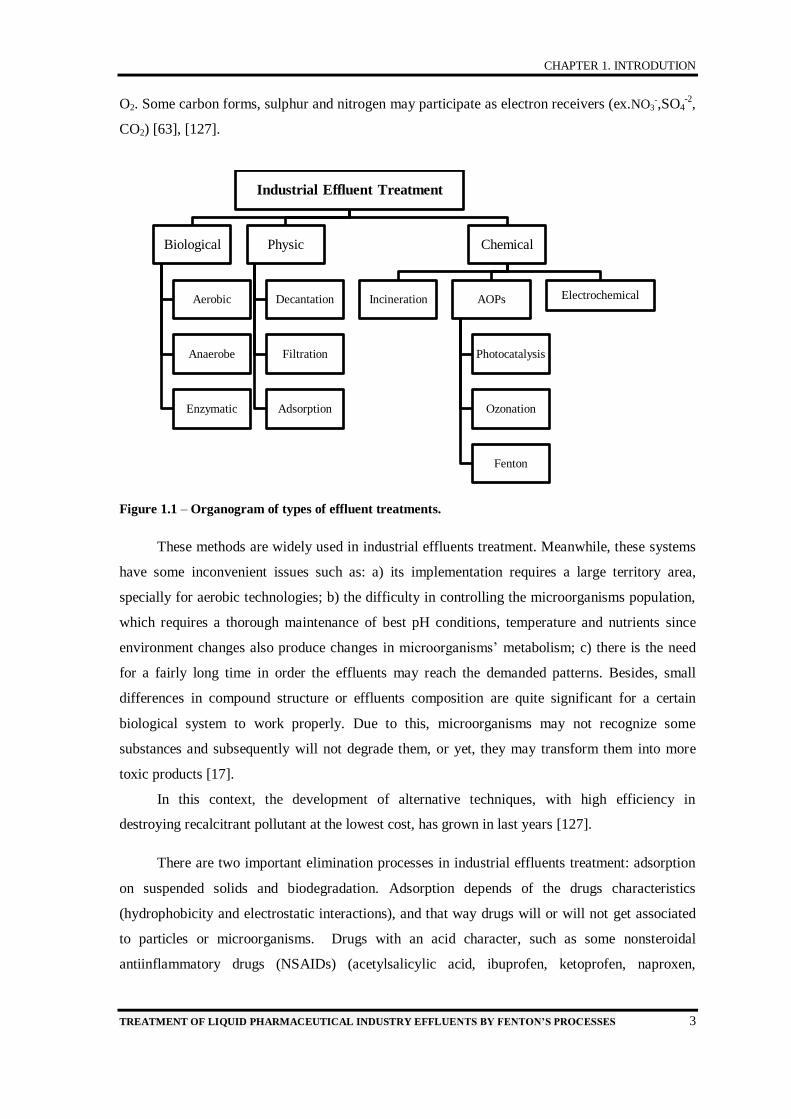
Figure 1.1 - Organogram of types of effluent treatments. 3
Figure 1.2 - Organogram of Classical Advanced Oxidative Process Systems. 5
Figure 4.1 - Effect of the different pH on COD (a) and TOC (b) degradation by placing 7mL of
coagulant p19. 35
Figure 4.2 - Effect of the different concentration of p19 on COD (a) , TOC (b) and TPh (c)
degradation by placing pH 3. 36
Figure 4.3 - Effect of the different concentration of p19 on TSS by placing pH 3. 37
Figure 4.4 - Effect of different catalysts at pH 3 under mechanical stirring in Dark-Fenton.
(catalyst concentration of 1.00g L-1
, room temperature and hydrogen peroxide volume of
2.50mL) on TPh (a), COD (b) and TOC (c). 38
Figure 4.5 - Effect of different catalysts at pH 3 with orbital agitator in Dark-Fenton (catalyst
concentration of 1.00g L-1
, room temperature and hydrogen peroxide volume of 0,33mL) on
TPh degradation profiles. 39
Figure 4.6 - Effect of different catalysts at pH 3 under orbital agitator in Dark-Fenton. (catalyst
concentration of 1.00g L-1
, room temperature and hydrogen peroxide volume of 0,33mL) on
COD degradation profiles. 40
Figure 4.7 - Effect of different catalysts at pH 3 under orbital agitator in Dark-Fenton. (catalyst
concentration of 1.00g L-1
, room temperature and hydrogen peroxide volume of 0,33mL) on
TOC degradation profiles. 41
Figure 4.8 - Amount of iron leached after 120 minutes of Dark-Fenton Process for different
catalysts. 42
Figure 4.9 - COD (a) and TOC (b) removal to different used pH at 120 minutes in Dark-
Fenton. (Fixed pH during the experimental test. Pressure and Room temperature). 44
Figure 4.10 - Amount of iron leached after 120 minutes of Heterogeneous Fenton Process for
different pHs. 45
Figure 4.11 - TPh removal along photo-Fenton´s process operating time. (Fixed pH during the
experimental test. Pressure and Room temperature). 45
Figure 4.12 - COD (a) and TOC (b) removal along photo-Fenton´s process operating time.
(Fixed pH during the experimental test. Pressure and Room temperature). 46
Figure 4.13 - Amount of iron leached after 120 minutes of Photo-Fenton Process for different
catalysts. 47
XIV
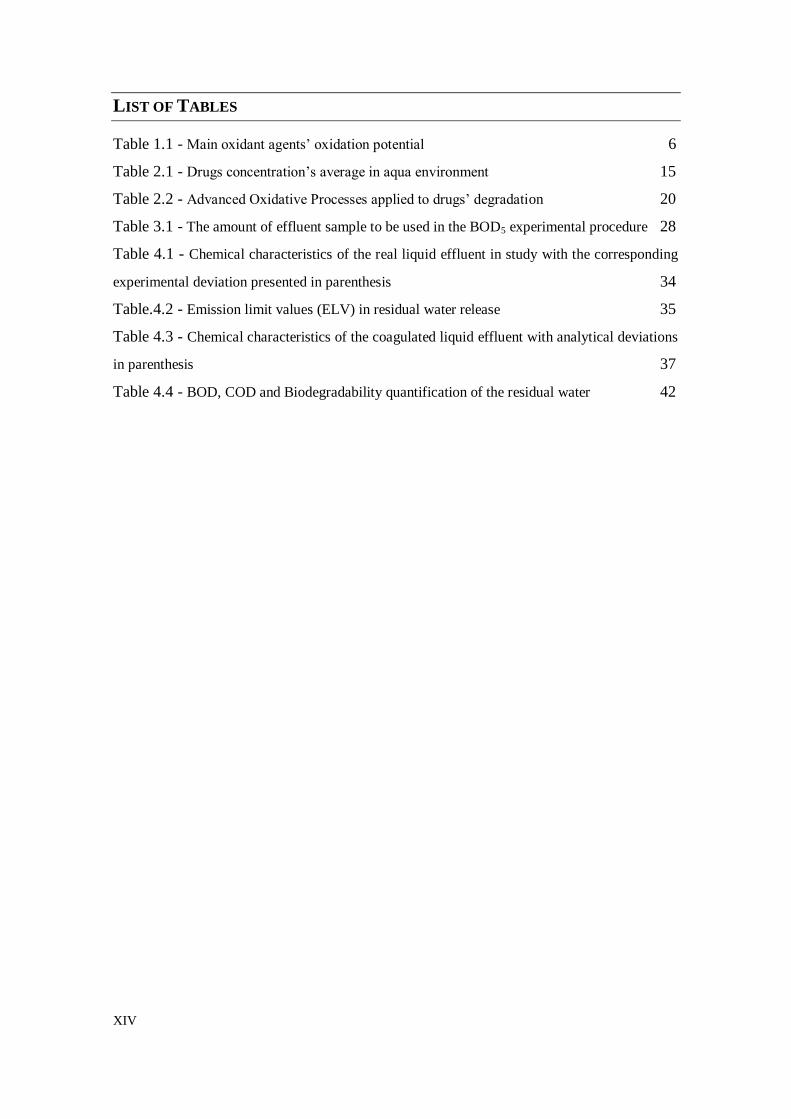
LIST OF TABLES
Table 1.1 - Main oxidant agents’ oxidation potential 6
Table 2.1 - Drugs concentration’s average in aqua environment 15
Table 2.2 - Advanced Oxidative Processes applied to drugs’ degradation 20
Table 3.1 - The amount of effluent sample to be used in the BOD5 experimental procedure 28
Table 4.1 - Chemical characteristics of the real liquid effluent in study with the corresponding
experimental deviation presented in parenthesis 34
Table.4.2 - Emission limit values (ELV) in residual water release 35
Table 4.3 - Chemical characteristics of the coagulated liquid effluent with analytical deviations
in parenthesis 37
Table 4.4 - BOD, COD and Biodegradability quantification of the residual water 42

CHAPTER 1. INTRODUTION
TREATMENT OF LIQUID PHARMACEUTICAL INDUSTRY EFFLUENTS BY FENTON’S PROCESSES 1
1 INTRODUCTION:
This dissertation’s first chapter refers environmental problems related with liquid effluents
and the most common treatment technologies with special focus on wastewaters originated in the
pharmaceutical industry. In this context, the advanced oxidation processes (AOPs) are described
as viable alternative in prejudice of classical biological sludge systems, with special attention to
Fenton and Photo-Fenton systems. Finally, the aims and thesis’ structure are presented.
1.1 ENVIRONMENTAL PROBLEM
Despite the fact that pharmaceutical compounds concentration in the hydric system is only
of a few traces, its continuous introduction may, in long term, become a potential risk to aquatic
organisms and Man. This way, the concern regarding the presence of these toxic substances in
environment has been increasing since early 90’s, as well as the need to analyze the inherent risks
[71].
Except for antibiotics, most pharmaceutical compounds are chemical substances made by
Man, and are therefore not found in Nature. Hence, if its presence is detected in the environment,
it can only come from human or veterinarian usage. The main sources for human usage
pharmaceutical compounds, in the hydric system are: its excretion after usage, the inappropriate
destruction of non – used drugs and, to a smaller scale, the wastes and spilling during its
production [71].
The drugs that are not removed in the wastewater treatment plants (WWTP) end up being
unloaded along with the treated effluents, this way polluting rivers, firths, lakes and also, although
rarely, subterraneous water and drinking water. Since these compounds are bio-refractory they are
not destroyed in the WWTP, but can be partially transferred to the mud which is generally applied
in agriculture, with the risk of contamination of the soil, and maybe leaching to surface water as
well as getting infiltrated, endangering underground water quality [37].
Environmental concern is not necessarily related with the high volume of production of a
certain drug compound, but its remaining in the ecosystems and its critical biological activity,
resulting on high toxicity and potential to create effects on key biological processes, such as
reproduction. According to FILHO (2007), beyond drugs remaining in environment, other
problem comes from the fact that these have been produced to unchain specific physiologic
effects. Although some pharmaceuticals concentrations are low, their combination can have
strong effects due to the mechanism of synergetic action [40].

CHAPTER 1. INTRODUTION
2 TREATMENT OF LIQUID PHARMACEUTICAL INDUSTRY EFFLUENTS BY FENTON’S PROCESSES
A large amount of drugs from different types (lipid regulators, antipyretics, analgesics,
antibiotics, antidepressants, oral contraceptives, chemotherapeutic agents and others) are widely
consumed all over the world [100].
A pharmaceutical industry that includes different types of production processes, such as
fermentation, chemical synthesis, extraction and formulation, usually creates a highly resistant
and variable effluent (in concentration of organic matter and in volume) considering the
production process that was used and the season of the year which difficult the applicability of the
traditional biological systems. This way, it is necessary a former chemical treatment, particularly
for effluents coming from antibiotics’ production, which contain high bio-inhibiter compounds
concentrations reducing the direct use of classical biological purification technologies [11].
Drugs and metabolites destiny and behaviour in the aquatic environment have not yet been
deeply explored. The reduced volatility of the compounds states that its distribution in the
surroundings is done, mainly, by water dispersion or through the food chain [93].
There are a large number of original articles and comments from different authors
concerning the occurrence and quantity of pharmaceutical compounds marked in hydric systems.
According to FENT et al. (2006), about 80 to 100 drugs and their metabolites are found on both
effluents and superficial water. These compounds are mainly detected on nanograms and
micrograms scale per liter (ng-μg/L). However, this can be sufficient to induce toxic effects [37].
1.2 MOST COMMON TECHNOLOGIES FOR EFFLUENTS TREATMENT
A rising subject in environmental and engineer science is the development of processes,
which promote the definite removal of drugs from industrial wastewaters, before ecosystems
contamination. Since common water and effluents treatment are unable to destroy definitely
persevering compounds, it is necessary to introduce additional advanced treatment technologies
[5], [6], [50], [69], [76], [128].
Figure 1.1 shows the different treatment industrial effluent treatment.
Definitely, treatments based on biological processes are most commonly used, since they
allow handling large masses of effluents transforming the toxic organic compounds into CO2 and
H2O (or CH4 and CO2), with relatively low costs. The ability for certain microorganisms to
degrade toxic organic substances is a well-documented fact [17].
Biological systems are based on the use of interest toxic compounds as substrate for
organisms growth and maintenance. Depending on the electron’s receiver nature, the bioprocesses
may be divided into aerobia and anaerobia. While in the former, which lead to CO2 and H2O, the
electron receiver is molecular oxygen in the latter, CO2 and CH4, are produced in the absence of
CHAPTER 1. INTRODUTION
TREATMENT OF LIQUID PHARMACEUTICAL INDUSTRY EFFLUENTS BY FENTON’S PROCESSES 3
O2. Some carbon forms, sulphur and nitrogen may participate as electron receivers (ex.NO3-,SO4
-2,
CO2) [63], [127].
Figure 1.1 – Organogram of types of effluent treatments.
These methods are widely used in industrial effluents treatment. Meanwhile, these systems
have some inconvenient issues such as: a) its implementation requires a large territory area,
specially for aerobic technologies; b) the difficulty in controlling the microorganisms population,
which requires a thorough maintenance of best pH conditions, temperature and nutrients since
environment changes also produce changes in microorganisms’ metabolism; c) there is the need
for a fairly long time in order the effluents may reach the demanded patterns. Besides, small
differences in compound structure or effluents composition are quite significant for a certain
biological system to work properly. Due to this, microorganisms may not recognize some
substances and subsequently will not degrade them, or yet, they may transform them into more
toxic products [17].
In this context, the development of alternative techniques, with high efficiency in
destroying recalcitrant pollutant at the lowest cost, has grown in last years [127].
There are two important elimination processes in industrial effluents treatment: adsorption
on suspended solids and biodegradation. Adsorption depends of the drugs characteristics
(hydrophobicity and electrostatic interactions), and that way drugs will or will not get associated
to particles or microorganisms. Drugs with an acid character, such as some nonsteroidal
antiinflammatory drugs (NSAIDs) (acetylsalicylic acid, ibuprofen, ketoprofen, naproxen,
Industrial Effluent Treatment
Biological
Aerobic
Anaerobe
Enzymatic
Physic
Decantation
Filtration
Adsorption
Chemical
Incineration AOPs
Photocatalysis
Ozonation
Fenton
Electrochemical

CHAPTER 1. INTRODUTION
4 TREATMENT OF LIQUID PHARMACEUTICAL INDUSTRY EFFLUENTS BY FENTON’S PROCESSES
diclofenac, indomethacin), with a pKa that goes from 4.9 to 4.1, as well as chlofibric1 acid and
bezafibrate2 (pKa 3.6), occur as ions in neutral pH. In those conditions, these compounds have a
negative charge; therefore, they will be preferably in the effluents dissolved phase. For those
species, sorption3 does not seem to be relevant [18], [78].
However, drugs of a basic and
amphoteric4 character can be adsorbed in activated sludge in a significant way as, for example,
antibiotics of fluoroquinolones’ group [53].
In general, during the treatment, the micro pollutant biological decomposition, including
drugs, increases with hydraulic retention time and with sludge’s age. For example, diclofenac
presents a significant biodegradability only when mud retaining time is superior to 8 days. As a
counterpart, METCALFE et al. (2003) indicate that regardless hydraulic retaining time,
compounds with a low index of biodegradability, such as carbamazepine, are only removed in
very low quantities (usually less than 10%) [97].
Recalcitrant organic pollutants’ removal, such as drugs, present in water and liquid
effluents, can be obtained using advanced treatment technologies instead that are to be
approached along this dissertation. Such treatment technologies can eliminate potentially
dangerous compounds through mineralization or conversion into less harmful products to human
health and aquatic environment [84].
1.3 ADVANCED OXIDATIVE PROCESSES
Chemical oxidation is a process that shows great potential in treating effluents comprising
non-biodegradable toxic compounds. Conventional oxidative processes use oxygen, ozone,
chlorite, sodium hypochlorite, chlorine dioxide, potassium permanganate and hydrogen peroxide,
as oxidative agents [57] but there are a number of compounds resistant to such direct action. In
these cases, the use of Advanced Oxidative Processes (APOs) becomes necessary. These systems
generally involve the generation of hydroxyl radicals which present a quite elevated oxidative
potential (2.06V) and are capable of reacting with almost every type of organic compounds. If the
oxidative extension is enough, it can even reach a total mineralization into CO2, H2O and
inorganic minerals [101].
1 is biological active chlofibrate’s metabolite (from fibric acid used in hyperlipoproteinemia type III and
hypertriglyceridemia severe treatment)
2 Bezafibrate is a cholesterol reducer; triglyceride reducer; (from fibric acid; fibrate).
3 Absorption and adsorption happen simultaneously.
4 Amphoteric, according to Bronsted-Lowry acid – base theory, is the substance that has the ability to behave as an acid
or as a base, depending on other reagent’s presence.

CHAPTER 1. INTRODUTION
TREATMENT OF LIQUID PHARMACEUTICAL INDUSTRY EFFLUENTS BY FENTON’S PROCESSES 5
These are non-selective processes for they degrade innumerous compounds regardless of
the presence of others. Hydroxyl radicals can be produced by reactions with strong oxidant, as
previously quoted and now described, ozone (O3) and hydrogen peroxide (H2O2); semiconductors,
such as titanium dioxide (TiO2) and zinc oxide (ZnO); and ultraviolet radiation (UV) [87].
Processes that present solid catalysts are called heterogeneous, while others are referred as
homogenous. The main AOPs systems are presented on Figure 1.2.
AOPs present some advantages that go through polluter’s mineralization and not only
through phase’s transfer; they are used on effluent hard removing compounds (refractive
compounds to other treatments), and transform those cumbersome species into biodegradable
moieties; they can be used associated to other processes (pre and post treatment); have a strong
oxidative capability, with high reaction kinetics; if enough harsh conditions are used, they
mineralize contaminants and do not form sub products; usually they improve the organoleptic
qualities of the treated water; in many cases, they use less energy (when compared with other
treatments), leading to minor costs; and allow the treatment in situ [7], [8], [9], [69].
Figure 1.2 – Organogram of Classical Advanced Oxidative Process Systems. (Source: HUANG et al.,
1993).
One has to add that main benefits of advanced oxidative processes are related to the
possibility of carrying out polluters’ degradation in low concentrations, and the easiness in
combining with other processes such as biological and activated charcoal adsorption, adding to
the fact that these processes are conducted at ambient pressure and temperature [7], [8], [9], [69].
Hydrogen peroxide is one of the most versatile oxidant, surpassing chloride, chloride
dioxide and potassium permanganate. When used along with catalytic agents (iron compounds,
Classical Advanced Oxidative Process Systems
Homogeneous systems
With Radiation
O3/UV
H2O2/UV
Electron beam
US
H2O2/US
UV/US
Without Radiation
O3/H2O2
O3/OH-
H2O2/Fe2+ (Fenton)
Heterogeneous systems
With Radiation
TiO2/O2/UV
TiO2/ H2O2/UV
Without Radiation
Electro-Fenton
O3/ Solid catalyst
H2O2/ Solid catalyst (heterogeneous Fenton)

CHAPTER 1. INTRODUTION
6 TREATMENT OF LIQUID PHARMACEUTICAL INDUSTRY EFFLUENTS BY FENTON’S PROCESSES
UV light, semiconductors, etc.) it can be converted into hydroxyl radicals (•OH) whose reactivity
is only lower to that of fluorine [7], [8], [9], [69].
Table 1.1 shows the oxidation potential of most important oxidative agents.
Table 1.1 – Main oxidant agents’ oxidation potential (Source: MARTINEZ, et al., 2001.)
OXIDATIVE AGENT OXIDATIVE POTENTIAL (EV)
Fluoride 3.00
Hydroxyl radical (•OH) 2.80
Ozone 2.10
Hydrogen peroxide 1.80
Potassium permanganate 1.70
Carbone chloride 1.50
Chlorine 1.40
The advanced oxidative processes (AOPs) are based on hydroxyl (•OH) free radical
formation, highly reactive, with a superior oxidation potential than ozone and slightly inferior to
fluorine. These species are non-selective, acting as an intermediate oxidant agent with a semi-
lifetime that rounds milliseconds. Due to its high reduction standard potential (Equation 1), it is
capable of oxidizing a large variety of organic compounds to carbon dioxide, water and inorganic
ions that come from heteroatoms [72], [102].
0
2 2,730 Equation 1OH e H H O E V
Hydroxyl radicals are strong oxidatives, that react with most of the organic contaminants,
with a controlled diffusion limit. The most common mechanism for oxidation through hydroxyl
radicals is by electrophilic addition at unsaturated compounds or aromatics, while hydrogen
separation usually occurs with saturated compounds [136].
Hydrogen peroxide is used to form hydroxyl radicals; meanwhile, it is necessary to add
activators, such as iron minerals, ozone and/or ultraviolet light, in order to enhance that
production. The free radicals (HO•) formed attack the organic compounds and may lead to their
fully oxidation, producing CO2 and H2O. Nevertheless, in some situation, a partial oxidation can
be the main route usually reaching more biodegradable by-products [83].
Fenton’s reaction (H2O2+Fe2+
) is among the most promising advanced methods for
effluents improvement degradation. This process will be discussed in the following section [90].

CHAPTER 1. INTRODUTION
TREATMENT OF LIQUID PHARMACEUTICAL INDUSTRY EFFLUENTS BY FENTON’S PROCESSES 7
1.3.1 H2O2 / FE2+
(FENTON)
In 1876, H.J.H. Fenton watched for the first time highly oxidative properties of a hydrogen
peroxide and Fe2+
ions solution [38]. Many organic molecules could be easily oxidized by using
this reagent without the use of high pressure or temperatures and complex equipment’s were not
needed. Fenton’s reaction is defined nowadays as a “hydroxyl radicals catalytic generation from
chain reaction between iron ion (Fe2+
) and hydrogen peroxide (H2O2), in an acid environment,
creating CO2, H2O and inorganic minerals as final result“ [31], [36], [41], [51].
According to FLOTRON et al. (2005), Fenton’s reagent can be used in treating aromatic
hydrocarbons, meaning low biodegradability polluters. Its application is well accepted because
involves a low cost and simple operation with advanced oxidative potential, hydroxyl radicals
formation in aqua solution [42].
NOGUEIRA et al. (2007) refer that hydroxyl radicals are formed in reactions that result
from the combination of metallic ions or semiconductors with oxidants such as ozone and
hydrogen peroxide with or without ultraviolet (UV) or visible (Vis) radiation. With Fenton’s
reaction, Equation 2, one can observe that hydroxyl radical is produced throughout H2O2
decomposition catalyzed by ferrous ions; these moieties are the oxidative specie involved in this
process, able to react with several types of organic compounds in a spontaneous reaction that
occurs in the dark [102].
2 3
2 2
• - 2 Fe H O Fe OH OH Equation
The formed hydroxyl radicals can oxidize Fe (II) ion leading to Fe (III) Equation 3:
2 3• - 3Fe OH Fe OH Equation
Protons are added so that there is water formation, Equation 4:
2 3
2 2 22 2 2 4Fe H O H Fe H O Equation
This equation shows that Fenton’s reaction depends on solution’s pH. Only under acid
conditions does HO• becomes the predominant reactive oxidant [25], [39].
The ferrous ions that are formed can further dissociate H2O2, always depending on pH, as
can be seen in Equations 5 to 9, also leading to iron ions and other radicals:
3 2
2 2 5Fe H O FeOOH H Equation

CHAPTER 1. INTRODUTION
8 TREATMENT OF LIQUID PHARMACEUTICAL INDUSTRY EFFLUENTS BY FENTON’S PROCESSES
2 2 •
2
2 • 3
2 2
2 2 2
• •
6
7
3 • 2 82 2
2
FeOOH Fe OH Equation
Fe OH Fe OH Equation
Fe OH Fe O H Equation
H O OH HO H O 9Equation
As one can see in reaction 9, hydrogen peroxide can also act as a scavenger of hydroxyl
radical, forming peroxyl radical (HO2•), that has a smaller oxidation potential (1.42V) than the
hydroxyl radical (•OH) (2.730V), harming the efficiency of the degrading process. That occurs
when there is an excess of hydrogen peroxide, since in this case Fe2+
concentration is low when
compared to Fe3+
. In fact the reaction between Fe
3+ and H2O2 (Equation 5) is slower than the
decomposition of hydrogen peroxide in presence of Fe2+
(Equation 3). The negative effect of
H2O2 excess in degrading organic compounds demands an extra attention when defining its proper
concentration [39], [102].
According to AGUIAR et al. (2007), hydroxyl radical high reactivity leads to rapid and
unspecified reactions with different substrates. If Fe3+
is used instead of Fe2+
and hydrogen
peroxide in excess, other minor oxidative potential radicals are also formed, such as peroxyl
radical (HO2•) and the superoxide anion (O2
•). The hydroxyl radical can act as an electrophile or a
nucleophile, attacking organic molecules by hydrogen exit or connecting into multiple bounds and
aromatic rings (hydroxylation), even in replaced positions, leading to reactions such as
demethoxylation, dehalogenation, dealkylation, denitration, deamination and decarboxylation [1].
Despite the higher reaction velocity between Fe2+
and hydrogen peroxide, the use of Fe3+
is
more convenient because, in this state of oxidation, iron is more abundant, which leads to costs
reduction. H2O2 decomposed by Fe3+
creates reduced Fe2+
, according to Equations 10 and 11, that
also react with H2O2 [89], [91].
3 2
2 2 2
3 2
2 2
•
•
10
11
Equation
Equation
Fe H O Fe HO H
Fe HO Fe O H
Since both Fe2+
and Fe3+
ions are coagulants5, Fenton’s reagent can have both functions
oxidization and coagulation in the treatment processes. One of the benefits in using Fenton’s
5 Coagulants are all products, natural or chemical, used to condense liquids, separating their solid phase.

CHAPTER 1. INTRODUTION
TREATMENT OF LIQUID PHARMACEUTICAL INDUSTRY EFFLUENTS BY FENTON’S PROCESSES 9
reagent is the fact that there is no unwanted halogenated compounds formation during the
oxidation process [72].
The use of iron minerals to catalyst decomposition of hydrogen peroxide is a low cost
solution compared to other advanced oxidation processes, since it uses a residue from steel
production industries (ferrous sulphate) [27].
An important advantage is that Fenton’s reagent is easy to apply on effluents treatment,
since the reaction occurs at ambient temperature and pressure, involves safe and easy to handle
reactants, not requiring special equipment and can be implemented with a great variety of
compounds. Besides, iron is the fourth most abundant element on earth’s surface [89], [91].
It has been said above that hydroxyl radicals are the species that begin organic compounds
oxidation in Fenton’s reaction. However, some studies have suggested other oxidizing species,
such as high valence iron intermediates, like FeO3+
and ferrite ion FeO2+
(it has colour and
presents itself as a viable alternative to treatment of several effluents) [89], [91].
Fenton’s reaction can be used as the only effluents’ treatment in a specific case or it can be
integrated into an overall purifying system (pre or post). There are several facts that have
influence into the degradation rate, such as contaminant’s chemical structure, pH, iron and
hydrogen peroxide concentration and organic charge [102]. Oxidation efficiency depends on the
environment reaction conditions, and it is very important to study factors such as: reagents
dosage, ratio between oxidant and catalyst load, catalyst type, time of reaction, environment’s pH
and temperature [15].
Fenton’s system may have different treatment functions, depending on H2O2/Fe2+
ratios.
When the Fe2+
amount surpasses that of hydrogen peroxide, the system tends to have a chemical
coagulation effect. With an inverted H2O2/Fe2+
, chemical oxidation effect is stronger [72], [101].
The dosage level among reagents to be properly used is different according to the type of
affluent. Classical margin to H2O2/Fe2+
relation is 5:1 up to 25:1 in mass [15], [73]. Reaction
velocity increases with temperature rising. Nevertheless, when temperature rises above 40-50ºC,
H2O2 usage efficiency decreases due to high dissociation in H2O and O2. Most reactions with
Fenton’s process occur at temperatures between 20 and 40ºC [2]. Reaction time depends on
variables such as temperature and reactants’ dosage. The oxidation treatment end is governed by
the relation between hydrogen peroxide and substrate (organic compound), and the rate of
oxidation is determined by the initial iron concentration and by temperature [15], [73].
The main limitation/ disadvantage of the Fenton’s process is the narrow pH gap in which
degradation efficiency is maximum (3 to 4). However, this can be solved by adding organic iron
complexes that stabilize iron in a wider pH interval [102]. The reaction’s pH is more important
since some factors depend on it. One of them is the used reagents’ stability, hydrogen peroxide
and ferrous ions are more stable in acid pH [80]. At alkaline conditions, hydrogen peroxide

CHAPTER 1. INTRODUTION
10 TREATMENT OF LIQUID PHARMACEUTICAL INDUSTRY EFFLUENTS BY FENTON’S PROCESSES
decomposes into H2O and O2 which reduces its oxidation’s potential. Hydroxyl radicals’
oxidation decreases too with pH’s increase. Some authors have proved that to near 3 pH, radical
•OH is the most active specie in degrading organic compounds. Optimum pH gap for reaction is
between 3 and 4 [2].
It is convenient to mention that, although Fenton’s reagent is very efficient in some cases,
its usage leads to an additional step, which is the destruction of the formed iron minerals. This
way, usually, a strong base is added that leads to iron precipitation for further removal [89], [91].
1.3.2 H2O2 / FE2+
/ UV (PHOTO-FENTON)
The process that combines hydrogen peroxide with ultraviolet radiation is more productive
than the use of each of them separately. That happens due to high hydroxyl radicals’ production,
extremely oxidative. According to HUANG et al (1993) and LEGRINI et al (1993), most
common accepted mechanism for photolysis of H2O2 with UV is molecule break into hydroxyl
radicals with an income of two •OH for each H2O2 molecule (Equation 12). However, it must be
taken under consideration that there is also the possibility of these radicals’ recombination,
transforming into H2O2 again (Equation 13) [68], [86].
2 2
2 2
•2 12
•2 13
H O OH Equation
OH H O Equation
There are some available articles quoting the exclusive usage of UV/ H2O2 oxidation
process for organic compounds degradation, such as methyl terc – butyl ether (MTBE) and dyes
or as a pre treatment to increase surfactants6 biodegradability
[70].
Organic compounds’ oxidation under UV radiation in the presence of ferrous ions in an
acid environment was tested in the 50’s, when it was discussed the hypothesis that an electronic
transfer initiated by radiation resulted in •OH creation, responsible for oxidation reactions. The
formation of •OH from Fe (III) species’ photolysis was also observed in oxidation processes of
atmospheric water and in aquatic environment, considered responsible for hydrocarbon’s
oxidation. In an aqua solution, ferrous ions exist as aqua – complexes, for example [Fe(H2O)6]3+
.
With pH increase, hydrolysis takes place creating hydroxyl species, whose proportion depends of
pH. First hydrolysis balance is represented in Equation 14. Ultra violet irradiation increases
contaminant’s degradation quantity, mainly because it stimulates Fe3+
to Fe2+
reduction [10]. This
process is called Photo-Fenton and it is demonstrated in Equation 15:
6 Compounds that diminish liquid’s surface tension and interfacial tension between two liquids, or between a liquid and
a solid. Surfactants can act as detergents, moistening, emulsifiers and dispersants.

CHAPTER 1. INTRODUTION
TREATMENT OF LIQUID PHARMACEUTICAL INDUSTRY EFFLUENTS BY FENTON’S PROCESSES 11
23 142
3 2 • 152
luzFe H O Fe OH H Equation
luzFe H O Fe OH H Equation
According to BACARDIT et al. (2007), the presence of inorganic ions, such as chlorite or
sulphate, can reduce the oxidation process efficiency based on hydroxyl radical [10]. These anions
can “lock” hydroxyl radical, producing less reactive anionic radicals, which may react with
hydrogen peroxide. Chloride’s interaction in Fenton’s mechanism can be from Fe2+
to Fe3+
with
Cl⎯ complexation, according to Equation 16 to 19, or hydroxyl radical’s “capture” (Equation 20),
which can lead to Cl• radicals production, less reactive than hydroxyl radical[10]:
2
0
2
3 2
3
2
- 16
- 17
- 18
-2 19
Fe Cl FeCl Equation
FeCl Cl FeCl Equation
Fe Cl FeCl Equation
Fe Cl FeCl Equation
In presence of Cl⎯ radical
•OH is captured [10]
:
•- • 20Cl OH ClOH Equation
When studying chloride anions (Cl-) effect in Photo-Fenton’s process, MACHULEK et al.,
(2007) concluded that keeping pH close to 3 during reaction made the process suffer no changes.
However, with different pH from 3 negative effect of Cl- ions increased reducing Fenton’s process
efficiency [90].
Fe2+
originated during radiation reacts with, hydrogen peroxide, according to Fenton’s
reaction (Equation 21). Here, reaction is catalytic and a cycle is established at which Fe2+
is
regenerated. The use of Fe2+/3+
in hydrogen peroxide’s presence under radiation is then referred as
Photo-Fenton’s reaction [90].
2 3
2 2
• 21Fe H O Fe OH OH Equation

CHAPTER 1. INTRODUTION
12 TREATMENT OF LIQUID PHARMACEUTICAL INDUSTRY EFFLUENTS BY FENTON’S PROCESSES
Fenton and Photo-Fenton processes are catalyzed by Fe2+
/Fe3+
ions, and if we consider that
these ions are hydrolyzed and form insoluble hydroxides, environment’s pH has a very important
role in involved reactions, which affects organic compounds’ degradation velocity. pH’s limited
gap is due to Fe (III) precipitation when pH is above 3, besides hydrogen peroxide is less stable
for higher pH drastically reducing H2O2 interaction and, subsequently, •OH production. Below pH
equal to 2.5 degradation velocity decreases since H+ high concentrations in solution lead to
hydroxyl radicals consumption according to Equation 22 [90].
• 222
OH H e H O Equation
Using Fenton or Photo-Fenton’s heterogeneous process with immobilized iron in
membranes or other supports presents its advantages, such as iron reuse, avoiding iron removal
procedures, since iron’s limit within an effluent is approximately 15mg.L-1
[90].
Whenever hydrogen peroxide is used, alone or combined with UV or iron minerals, it must
be used in a proper amount in order not to create residua (unnecessary expense). It is important to
quote that hydrogen peroxide can interfere with some analyses, as in Chemical Oxygen Demand
(COD) [90].
1.4 OBJECTIVES OF THE THESIS:
This work’s main objective is to evaluate solid catalysts’ efficiency in order to purify liquid
effluents in pharmaceutical industry through Fenton and Photo-Fenton heterogeneous’ processes.
Specific objectives:
Catalysts preparation and selected catalyst’s characterization;
Degradation study of a real wastewater containing several pharmaceutical origins
(unknown) through hydrogen peroxide catalytic oxidation in a batch reactor;
Process’s treatment analysis through pH variation and different catalysts, presence
and absence of light in the removal of Total Phenol Content’s (TPh), Chemical
Oxygen demand (COD) and Total Organic Carbon (TOC) depletion;
Discussion about the possibility of integrating this process with biological methods
of treatment through the analysis of the effluents biodegradability.

CHAPTER 1. INTRODUTION
TREATMENT OF LIQUID PHARMACEUTICAL INDUSTRY EFFLUENTS BY FENTON’S PROCESSES 13
1.5 THESIS’ STRUCTURE
In order to contextualize this thesis, this first chapter focuses on environmental problems
related to pharmaceutical effluents, being discussed the reasons why their treatment is so
important and why to choose advanced oxidative processes (Fenton and Photo-Fenton).
Chapter 2 presents a global sight of what is written in scientific literature, state of art, about
some drugs (therapeutic class), and average concentrations they occur at several matrixes (sewer,
surface water, effluents) in different countries. It also overviews the application of advanced
oxidative processes on the degradation of some of those drugs.
Chapter 3 describes the methodologies involved in the study. Experimental equipment
description, procedure and analysis methods to infer the process efficiency such as TOC, COD,
TPh and BOD5 removal. Catalyst characterization and the actinometrical procedure used in Photo-
Fenton are also described in this chapter.
Chapter 4 discusses the results obtained through the oxidation study. More specifically it
shows the raw effluent’s characterization and catalysts screening, as well as the analysis of the pH
influence in the Fenton process.
Main conclusions from the work and suggestions for forthcoming investigation are
described in chapter 5.

CHAPTER 2. STATE OF THE ART
14 TREATMENT OF LIQUID PHARMACEUTICAL INDUSTRY EFFLUENTS BY FENTON’S PROCESSES
2 STATE OF THE ART:
This chapter describes what is found in scientific literature about some drugs (therapeutic
class), and their occurrence in several matrixes (sewer, surface water, effluents) in different
countries. It also shows advanced oxidative processes applied to some drugs degradation.
Demographic growth and industrial expansion brought contamination scenarios of soil
and hydric resources all over the world. That is leading to environment deterioration and to the
need to revert or minimize that process [45].
In the 70’s, the presence of drugs in aqua environment became known. Since then, there
have been made several studies which reveal the presence of drugs’ residua in liquid effluents in
several parts of the world. Water contamination by drugs is worth special attention since the
risks to human health and aqua environment are not completely identified. First studies about
the presence of drugs in environment were made by GARRISON and assistants [45] and
HIGNITE AND AZARNOFF [64]. They detected the presence of clofibric acid, clofibrate,
etofibrate in μg L-1
concentrations, at a Water Residua Treatment Station (WRTS) in the United
States.
The main way for drugs residua to enter the environment is through domestic sewer
draining, treated or not, in watercourses. However, pharmaceutical industry effluents, rural
effluents and the inadequate dumping of out of date drugs must also be taken under
consideration [16], [58], [60].
Most drugs that arrive to WRTS come from human or veterinarian metabolic excretion.
These residua follow with rough sewer to WRTS where they are, in most cases, submitted to
traditional treatment processes. Nevertheless, these processes are mainly based on contaminants
biological degradation, and are not efficient on completely removing these cumbersome
compounds due to their biocide action and complex chemical structures that cannot be easily
bio-degraded, as has been proved by several studies that show the presence of this type of
contaminant in WRTS effluents [8], [14], [19], [22], [24], [46], [64] [88], [126], [129].
Different class drugs, such as antibiotics, hormones, lipid-lowering, anti-inflammatory,
analgesic, among others, are frequently detected on domestic sewers, surface and underwater in
concentrations around ng.L-1
to µgL-1
in several parts of the world (Table 2.1).

CHAPTER 2. STATE OF THE ART
TREATMENT OF LIQUID PHARMACEUTICAL INDUSTRY EFFLUENTS BY FENTON’S PROCESSES 15
Table 2.1 – Drugs concentration’s average in aqua environment.
DRUG
(therapeutic class)
CONCENTRATION
(μg L-1) MATRIX REFERENCE
Amoxicillin
(antibiotic) 0.013 Rough sewer/Italy Castiglioni et al., 2009
Atenolol
(β-blocker)
0.49 Rough sewer / Italy Castiglioni et al., 2009
0.28 WRTS effluent/Italy Castiglioni et al., 2009
0.050 Surface water/ Italy Calamari et al., 2003
0.30 Rough sewer /Sweden Bendz et al., 2005
0.16 WRTS effluent / Sweden Bendz et al., 2005
Bezafibrate
(lipid-lowering)
0.54 WRTS effluent /France Andreozzi et al., 2003
0.30 WRTS effluent Italy / Andreozzi et al., 2003
0.070 WRTS effluent /Canada Gagné et al., 2006
0.42 Rough sewer /Finland Lindqvist et al., 2005
1.2 Rough sewer /Brazil Stumpf et al., 1999
0.18 Surface water / Brazil Stumpf et al., 1999
2.2 WRTS effluent /
Germany Ternes, 1998
0.35 Surface water / Germany Ternes. 1998
Carbamazepine
(anticonvulsant)
1.7 Rough sewer / Sweden Bendz et al., 2005
1.2 WRTS effluent / Sweden Bendz et al., 2005
1.0 WRTS effluent / France Andreozzi et al., 2003
1.0 WRTS effluent Greece Andreozzi et al., 2003
0.38 WRTS effluent / Italy Andreozzi et al., 2003
0.085 WRTS effluent /Canada Gagné et al., 2006
2.1 WRTS effluent /
Germany Ternes. 1998
0.25 Surface water / Germany Ternes. 1998
0.50 Rough sewer /Spain Santos et al., 2005
0.48 WRTS effluent /Spain Santos et al., 2005
Tetracycline
(antibiotic)
0.010 Surface water / Italy Calamari et al., 2003
0.11 Surface water /USA Kolpin et al., 2002

CHAPTER 2. STATE OF THE ART
16 TREATMENT OF LIQUID PHARMACEUTICAL INDUSTRY EFFLUENTS BY FENTON’S PROCESSES
DRUG
(therapeutic class)
CONCENTRATION
(μg L-1) MATRIX REFERENCE
KETOPROFEN
(ANTI-
INFLAMMATORY)
0.94 Rough sewer / Sweden Bendz et al., 2005
0.33 WRTS effluent / Sweden Bendz et al., 2005
0.81 WRTS effluent /France Andreozzi et al., 2003
2.0 Rough sewer /Finland Lindqvist et al., 2005
0.15 Rough sewer /Brazil Stumpf et al., 1999
0.22 Surface water / Brazil Stumpf et al., 1999
0.20 WRTS effluent /Germany Ternes. 1998
1.1 Rough sewer /Spain Santos et al., 2005
0.98 WRTS effluent /Spain Santos et al., 2005
CIPROFLOXACIN
(ANTIBIOTIC)
0.26 Rough sewer /Italy Castiglioni et al., 2009
0.097 WRTS effluent / Italy Castiglioni et al., 2009
0.060 WRTS effluent /France Andreozzi et al., 2003
0.070 WRTS effluent /Greece Andreozzi et al., 2003
0.030 WRTS effluent / Sweden Andreozzi et al., 2003
0.37 WRTS effluent /Switzerland Golet et al., 2001
0.020 Surface water /USA Kolpin et al., 2002
DICLOFENAC
(ANTI-
INFLAMMATORY)
0.16 Rough sewer / Sweden Bendz et al., 2005
0.12 WRTS effluent / Sweden Bendz et al., 2005
0.33 WRTS effluent / France Andreozzi et al., 2003
0.84 WRTS effluent /Greece Andreozzi et al., 2003
2.47 WRTS effluent / Italy Andreozzi et al., 2003
0.35 Rough sewer /Finland Lindqvist et al., 2005
0.40 Rough sewer /Brazil Stumpf et al., 1999
0.020 Surface water /Brazil Stumpf et al., 1999
0.81 WRTS effluent / Germany Ternes. 1998
0.15 Surface water / Germany Ternes. 1998
2.9 Rough sewer /Brazil Ghisele. 2006
1.8 WRTS effluent /Brazil Ghisele. 2006
4.0 Surface water /Brazil Ghisele. 2006
17 Α-ETHINYL
ESTRADIOL
(CONTRACEPTIVE
HORMONE)
0.073 Surface water /USA Kolpin et al., 2002
0.001 WRTS effluent / Germany Ternes et al., 1999
0.009 WRTS effluent /Canada Ternes et al., 1999
0.005 Rough sewer /Brazil Ternes et al., 1999
5.8 Rough sewer /Brazil Ghisele, 2006
5.0 WRTS effluent /Brazil Ghisele, 2006

CHAPTER 2. STATE OF THE ART
TREATMENT OF LIQUID PHARMACEUTICAL INDUSTRY EFFLUENTS BY FENTON’S PROCESSES 17
DRUG
(therapeutic class)
CONCENTRATION
(μg L-1) MATRIX REFERENCE
GENFIBROZIL
(LIPID-LOWERING)
0.71 Rough sewer / Sweden Bendz et al., 2005
0.18 WRTS effluent/ Sweden Bendz et al., 2005
0.70 WRTS effluent /France Andreozzi et al., 2003
0.71 WRTS effluent /Greece Andreozzi et al., 2003
2.14 WRTS effluent / Italy Andreozzi et al., 2003
0.071 WRTS effluent Canada Gagné et al., 2006
0.40 Rough sewer /Brazil Stumpf et al., 1999
0.048 Surface water /USA Kolpin et al., 2002
IBUPROFENO
(ANTI-
INFLAMMATORY)
3.6 Rough sewer / Sweden Bendz et al., 2005
0.15 WRTS effluent / Sweden Bendz et al., 2005
0.92 WRTS effluent / France Andreozzi et al., 2003
0.050 WRTS effluent /Greece Andreozzi et al., 2003
0.070 WRTS effluent / Italy Andreozzi et al., 2003
0.79 WRTS effluent /Canada Gagné et al., 2006
13.1 Rough sewer /Finland Lindqvist et al., 2005
0.60 Rough sewer /Brazil Stumpf et al., 1999
0.19 Surface water /Brazil Stumpf et al., 1999
0.37 WRTS effluent / Germany Ternes et al., 1999
0.070 Surface water / Germany Ternes et al., 1999
0.20 Surface water /USA Kolpin et al., 2002
54.2 Rough sewer /Brazil Ghisele. 2006
48.4 WRTS effluent /Brazil Ghisele. 2006
3.7 Rough sewer /Spain Carbala et al., 2004
1.3 WRTS effluent /Spain Carbala et al., 2004
PROPRANOLOL
(Β-BLOCKER)
0.050 Rough sewer / Sweden Bendz et al., 2005
0.030 WRTS effluent / Sweden Bendz et al., 2005
0.030 WRTS effluent /France Andreozzi et al., 2003
0.010 WRTS effluent /Greece Andreozzi et al., 2003
0.040 WRTS effluent / Italy Andreozzi et al., 2003
0.17 WRTS effluent / Germany Ternes et al., 1999
0.010 Surface water / Germany Ternes et al., 1999
NAPROXEN
(ANTI-
INFLAMMATORY)
3.7 Rough sewer / Sweden Bendz et al., 2005
0.25 WRTS effluent / Sweden Bendz et al., 2005
1.1 WRTS effluent /France Andreozzi et al., 2003
2.0 WRTS effluent / Italy Andreozzi et al., 2003

CHAPTER 2. STATE OF THE ART
18 TREATMENT OF LIQUID PHARMACEUTICAL INDUSTRY EFFLUENTS BY FENTON’S PROCESSES
DRUG
(therapeutic class)
CONCENTRATIO
N (μg L-1) MATRIX REFERENCE
NAPROXEN
(ANTI-
INFLAMMATORY)
CONTINUATION
0.27 WRTS effluent /Canada Gagné et al., 2006
4.9 Rough sewer /Finland Lindqvist et al., 2005
0.60 Rough sewer /Brazil Stumpf et al., 1999
0.020 Surface water /Brazil Stumpf et al., 1999
0.30 WTRS effluent / Germany Ternes et al., 1999
0.070 Surface water / Germany Ternes et al., 1999
4.7 Rough sewer /Spain Santos et al., 2005
1.5 WRTS effluent /Spain Santos et al., 2005
SULFAMETHOXAZOLE
(ANTIBIOTIC)
0.080 WRTS effluent / France Andreozzi et al., 2003
0.090 WRTS effluent /Greece Andreozzi et al., 2003
0.010 WRTS effluent / Italy Andreozzi et al., 2003
0.020 WRTS effluent /Sweden Andreozzi et al., 2003
0.049 WRTS effluent /Canada Gagné et al., 2006
0.58 Rough sewer /Spain Carbala et al., 2004
0.25 WRTS effluent /Spain Carbala et al., 2004
0.40 WRTS effluent / Germany Hirsch et al., 1999
0.41 Underwater/ Germany Sacher et al., 2001
0.05 Surface water /USA Stackelberg et al 2004
TRIMETHOPRIM
(ANTIBIOTIC)
0.080 Rough sewer/ Sweden Bendz et al., 2005
0.040 WRTS effluent/ Sweden Bendz et al., 2005
0.030 WRTS effluent /France Andreozzi et al., 2003
0.080 WRTS effluent /Greece Andreozzi et al., 2003
0.070 WRTS effluent / Italy Andreozzi et al., 2003
0.065 WRTS effluent /Canada Gagné et al., 2006
0.15 Surface water /USA Kolpin et al., 2002
0.32 WRTS effluent /Germany Hirsch et al., 1999
Studies show that drugs concentration levels found in aqua environments are related to
population consumption pattern, by removal tax in WRTS, by the kind of effluent that ports at
WRTS and by season’s hip [25], [27].
Drugs used in therapeutics, after working in the organism, can be excreted as metabolites,
hydrolyzed or in its original form. They can also be conjugated with polar molecules such as
glucuronides. However, these conjunctions are easily cleaved by applying pharmacologically
active substances into domestic sewers [37], [59].

CHAPTER 2. STATE OF THE ART
TREATMENT OF LIQUID PHARMACEUTICAL INDUSTRY EFFLUENTS BY FENTON’S PROCESSES 19
Once in environment, drugs’ destiny depends on their structural characteristics and
chemical – physical properties, such as photo sensibility, biodegradability and lipophilicity.
LAM and MABURY (2005) studied the following drugs photo degradation: lipid-
lowering, carbamazepine (anticonvulsant), levofloxacin and sulfamethoxazole (antibiotics) and
proposed that photo transformation reactions are an important factor in limiting these drugs
persistence in surface water, either by direct or indirect photolysis by reacting with reactive
species (hydroxyl radicals, for example) [81].
Some drugs, such as acetylsalicylic acid and caffeine are biodegradable and, therefore,
removed from WRTS with efficiency, reaching removal percentages of 99, 9% [59], [116].
Penicillin is also hard to find in environment, due to their β-lactam ring chemical instability,
which makes it susceptible to hydrolysis and biodegradation by microorganisms that have a β-
lactamase enzyme [64].
Synthetic estrogens and tetracycline (antibiotic) tend to be adsorbed to WRTS slime and /
or sediments, due to their high lipophilicity and the formation of sediment with calcium [60],
[64], [62].
Biological processes are most frequently used because they allow large volumes
treatment, can reach high organic matter removal and they cost relatively low. However, some
compounds are recalcitrant and can even be toxic to microorganisms. Studies on drugs
biodegradability have shown removal taxes around 50% in activated slime traditional systems
[29], [111].
Phase transfer of the contaminant characterizes physical processes (decantation, filtration,
and adsorption), without the compound being really eliminated. On other hand, they are usually
very efficient, and can be useful as pre or post treatment [44].
Chemical processes are based on contaminant’ oxidants by reaction with strong oxidants,
such as hydrogen peroxide (H2O2), chlorite (Cl2), chlorine dioxide (ClO2) and permanganate
(MnO4-).In most cases, however, using this kind of treatment does not promote total
mineralization of pollutants to CO2, and there is formation of great variety of degradation sub
products, usually organic acids (oxalic acid, formic and acetic acid). In case of Cl2, there is
formation of organochlorine compounds, which can be more toxic than former contaminants,
making it inconvenient for a proper treatment [133].
Drugs removal efficiency in WRTS depends on the chemical and physical properties of
each compound. Different studies show that these compounds’ elimination is usually
incomplete with an unsteady removal percentage. For example, anticonvulsant carbamazepine
has a 7% removal, while acetylsalicylic acid (analgesic) reached 99% in WRTS in Germany
[128]. This fluctuation in removal percentage was also observed in WRTS in Finland, where
diclofenac got a 26% removal and ibuprofen 92% [88].

CHAPTER 2. STATE OF THE ART
20 TREATMENT OF LIQUID PHARMACEUTICAL INDUSTRY EFFLUENTS BY FENTON’S PROCESSES
The presence of drugs in WRTS effluents is the reflex of the removal methods’ low
efficiency through traditional treatment processes, which claims for the research for more
effective methods, able to promote contaminants mineralization or, at least, its transformation
into products that do not represent hostile effects to the environment.
Drugs amoxicillin, bezafibrate, paracetamol [132] and tetracycline’s [13] degradation
were studied in WRTS effluents using the Photo-Fenton’s process under solar radiation. There
was over 95% degradation for all drugs in 5 minutes, highlighting the importance of this process
to drugs degradation in this matrix.
The use of UV radiation lamps was also efficient to pharmaceuticals degradation, such as
Diclofenac [114], metronidazole [122] and sulfamethoxazole [54], showing Photo-Fenton’s
versatility in different sources of radiation use.
Beside works quoted in literature, several others approach drugs’ degradation by
Advanced Oxidation Process (AOPs). Table 2.2 presents a compilation of some of these works.
Table 2.2 – Advanced Oxidative Processes applied to drugs’ degradation
DRUG AOP REFERENCE
AMOXICILLIN O3 Andreozzi et al., 2005
Fe3+
, FeOx/ H2O2/ UV, solar Trovó et al., 2008
BEZAFIBRATE
O3 Dantas et al., 2007
O3, O3/ H2O2 Huber et al., 2003
TiO2/ UV Lambropoulou et al., 2006
Fe3+
, FeOx/ H2O2/ UV, solar Trovó et al., 2008
CARBAMAZEPINE
O3, O3/ UV, H2O2/ UV Gerbhardt et al., 2007
O3/ H2O2 Huber et al., 2003
H2O2/ UV Vogna et al., 2004
DIAZEPAM O3, O3/ UV, H2O2/ UV Gerbhardt et al., 2007
O3/ H2O2 Huber et al., 2003
DIPYRONE Fe
2+/ H2O2/solar
Pérez-Estrada et al., 2006 TiO2/solar
DICLOFENAC
TiO2/ UV Calza et al., 2006
Fe2+
/ H2O2/solar Pérez-Estrada et al., 2005
Fe3+
/ H2O2/UV Ravina et al., 2002
Fe2+
/ H2O2 Packer et al., 2003
O3, O3/ UV, H2O2/ UV Gerbhardt et al., 2007
O3, O3/ H2O2 Zwiener et al., 2000
H2O2/ UV Vogna et al., 2004

CHAPTER 2. STATE OF THE ART
TREATMENT OF LIQUID PHARMACEUTICAL INDUSTRY EFFLUENTS BY FENTON’S PROCESSES 21
Table 2.2 – Advanced Oxidative Processes applied to drugs’ degradation (continuation)
DRUG AOP REFERENCE
17 Α-ETHINYL
ESTRADIOL
TiO2/UV Coleman et al., 2004
O3/ H2O2 Huber et al., 2003
IBUPROFEN O3/ H2O2
Zwiener et al., 2000;
Huber et al., 2003
Fe2+
/ H2O2 Packer et al., 2003
IOPROMIDA O3 Huber et al., 2005
O3/ H2O2, O3/ UV Ternes et al., 2003
METRONIDAZOLE
H2O2/ UV
Shemer et al., 2006 Fe2+
/ H2O2
Fe2+
/ H2O2/ UV
NAPROXEN
O3 Huber et al., 2005
H2O2/ UV Pereira et al., 2007
Fe2+
/ H2O2 Packer et al., 2003
PARACETAMOL O3, H2O2/ UV Andreozzi et al., 2003
Fe3+
, FeOx/ H2O2/ UV, solar Trovó et al., 2008
RANITIDINE TiO2/ UV Addamo et al., 2005
Fe2+
/ H2O2 Abellán et al., 2007
SULFAMETHAZINE TiO2/ UV
ZnO/ UV Kaniou et al., 2005
SULFAMETHOXAZOLE
TiO2/ UV Abellán et al., 2007
Fe2+
/ H2O2/ UV González et al., 2007
O3 Ternes et al 2003
O3/ H2O2 Huber et al., 2003
TETRACYCLINE
H2O2/UV Kim et al., 2009
TiO2/ UV Reyes et al., 2006
Addamo et al., 2005
Fe3+
, FeOx/ H2O2/ UV, solar Bautitz et al., 2007
Under an operational point of view, AOPs can be applied to drugs residua degradation in
WRTS exit as well as in final water treatment process steps.
Drugs degradation through AOPs, as well as direct photolysis (which depends of each
compound absorbency), involves several different stages and several reactions that result in
different sub products, which can be more or less toxic when compared to the original drug.
These intermediates can, or not, maintain functional activity of the original compound.
Since several intermediates can be formed during treatment, it is important to identify a
degradation route as well as to evaluate their toxicity and destiny in the environment. One of the
parameters that allow evaluating intermediates’ toxicity is biodegradability, which is given by

CHAPTER 2. STATE OF THE ART
22 TREATMENT OF LIQUID PHARMACEUTICAL INDUSTRY EFFLUENTS BY FENTON’S PROCESSES
the ratio between biochemical oxygen demand after 5 days and chemical oxygen demand
(BOD5/COD).
Intermediates’ toxicity and biodegradability of sulfamethoxazole [54] (200mg.L-1
)
antibiotic were determined after photo-Fenton’s process appliance. The BOD5/COD results
showed that by increasing the H2O2 dose from 50 to 550mg.L-1 during treatment, there was an
increase in biodegradability. Another relevant data was that for the smallest dose H2O2 (50mg.L-
1) there was an increase in solution’s toxicity, which indicates that under such condition more
toxic intermediates were formed than the original drug.
In sulfonamide’s degradation, sulfadiazine, sulfamerazine, sulfadimethoxine
sulfathiazole, by heterogeneous photocatalysis, it was seen that all these molecules follow the
same degradation mechanism ,that is, hydroxyl radical’s attack to aromatic ring with one or two
hydroxisulfonamides formation, or S-N bound break and subsequent sulphate ions release [20].
In synthetic estrogen diethylstilbestrol (DES) degradation’s, the complex Fe (III)-oxalate
presence under radiation was evaluated. Three main intermediates were formed, being that an
OH group to the aromatic ring created one of them. Later, degradation followed two different
reaction mechanisms, which resulted in DES-4-semiquinone and DES-o-quinone formation
[138].
Heterogeneous photocatalysis and photo-Fenton’s process under solar radiation were
applied to stable 4-Methylaminoantipyrin intermediate degradation formed during dipyrone
analgesic hydrolysis [107]. After treatment by heterogeneous photocatalysis 12 degradation
products were identified, formed from aromatic ring hydroxylation and pyrazole ring’s opening.
No intermediate was detected in the Photo-Fenton’s process and it presented a 5 times larger
efficiency than heterogeneous photocatalysis.
Different advanced oxidative processes (ozonation, H2O2/UV, etc) were applied to
several drugs mixture (carbamazepine, acid clofibric, diclofenac, sulfamethoxazole, ofloxacin
and propranolol) and after a short exposure time to these processes (3-5 min), solution
containing with created metabolites presented less toxicity when compared to the original
solution [5].
As a counterpart, when evaluating antiepileptic carbamazepine degradation after the
process H2O2/UV appliance, a series of acridines was obtained as intermediates [134]. Acridines
present mutagenic and carcinogenic activity and the possibility of its formation, even residual,
can make the process’ application not viable.
Based in the presented results, treatment processes improvement is imperious to assure
total mineralization of target compounds, this way reducing toxic intermediates formation.

CHAPTER 2. STATE OF THE ART
TREATMENT OF LIQUID PHARMACEUTICAL INDUSTRY EFFLUENTS BY FENTON’S PROCESSES 23
CONCLUSIONS:
To summarize, different therapeutics class drugs, used both in human and veterinarian
medicine, are excreted in its original form or as metabolites. These residua can contaminate
aquatic environment if they are not natural biodegraded or efficiently removed in treatment
stations. Advanced Oxidation Processes (AOPs) are viable alternative when the contaminated
matrix has a low organic concentration (hundreds of mg.L-1
) and pollutants are not
biodegradable. Besides, they are adequate when classical treatment is not possible or not even
appropriate. Treatment’s efficiency depends on the matrix, contaminants, purpose of the
treatment, volume to be treated, as well as other factors.
These substances continuous hauling to environment characterizes them as pseudo
persistent, which may result in severe effects in aquatic environment and even to human health.
Different advanced oxidative processes applied to different therapeutics class drugs’
degradation have been described. Despite these molecules complexity, low concentrations found
allow these methodologies to be used, which reach high degradation efficiency, as some works
have demonstrated.

CHAPTER 3. EXPERIMENTAL
24 TREATMENT OF LIQUID PHARMACEUTICAL INDUSTRY EFFLUENTS BY FENTON’S PROCESSES
3 EXPERIMENTAL METHODOLOGY:
This chapter refers to the preparation techniques and solid catalysts’ characterization,
oxidation tests procedures and analytical methods used to evaluate catalytic process.
3.1 CATALYST PREPARATION AND CHARACTERIZATION
Four distinctive catalysts were used in this work. One of them, the only commercial one,
Envicat® N-150 (Fe2O3-MnOx) was kindly provided by Süd-Chemie AG, Munich, Germany.
Laboratory prepared catalyst was Fe-Ce-O (70/30), synthesized by co precipitation, through an
aqua solution of precursor minerals, namely metallic nitrates, such as iron nitrate (Riedel-de-
Häen) and cerium nitrate (Riedel-de-Häen). Its synthesis was performed with molar proportion
defined in order not to surpass 15 g of minerals per 100 mL of water, and precipitated by adding
200 mL of NaOH solution at 3M (from NaOH with 98% of purity). Final precipitate was
filtered and washed with 2.5 L of water, dried at 105 ºC, crushed and calcined at 300 ºC [124].
Commercially available red volcanic rock (abundant in nature) was also used as catalyst and its
chemical composition, determined in our laboratory, is as follows: 6.31% of Fe; 0.03% of Cu;
0.02% of Zn; 0.44% of K; 1.54% of Na; 0.06% of Cr; 0.07% of Mn, 8.32% of Ca and 2.31% of
Mg. ZVI particles, iron catalyst with zero valent state (low commercial value), were chemically
composed by nearly 100% of Fe with some residual elements (Cu, Zn, K, Na, Cr, Mn, Ca and
Mg) and it was supplied by a metallurgical industry in the area.
Selected catalysts were characterized before (fresh catalyst) and after (used catalyst) they
were applied in the oxidation process.
3.2 COAGULATION PROCEDURE
Coagulation/flocculation procedure has in goal colloidal substances removal, that is, solid
material in suspension and/ or dissolved. That operation is usually considered as pre treatment.
RITCHER & NETTO (2003) and CARDOSO (2007) say that coagulation is the process
by which a coagulant agent added to water reduces forces that tend to keep solids in suspension
separated forming larger particles that can sediment [23], [117].
Coagulation cancels repulsion forces between colloidal substances through connection
and adsorption mechanisms in colloidal particle surface by adding chemical agents, called
electrolytes. According to DI BERNADO & DANTAS (2005), in order for coagulation process
to be efficient, it must be made through intense agitation (quick mixture) so that interactions
between coagulant and water (effluent) can occur. Formation velocity for these flocks depends,

CHAPTER 3. EXPERIMENTAL
TREATMENT OF LIQUID PHARMACEUTICAL INDUSTRY EFFLUENTS BY FENTON’S PROCESSES 25
in thermo agitation beginning (Brownian movement) and, by reaching around 0.1 mm size. Of
course that mechanical agitation must be at a moderate level (slow mixture) for otherwise; it
may cause already formed flocks’ degradation, which will make their removal more difficult
[33].
The coagulant that used in this work was p19, an acid coagulant (provided by
Adventech), in 1:10 (10mL of p19 diluted into 100mL of water) proportion.
Coagulation trials were performed in a Jar-Test equipment with 600mL reactors, under
constant agitation at 300rpm, for 5 minutes and, then agitation was reduced to 30rpm for 30
minutes.
Initially, 200mL of effluent and 7mL of coagulant were placed in 5 reactors. In one of
them effluent’s pH was kept (5.4) and for others pH was adjusted to values of 3; 5; 7 and 9 with
H2SO4 or with NaOH. COD was evaluated.
After COD evaluation for the different pH conditions, procedure was repeated, keeping
the pH value with a lower COD and placing different coagulant quantities 2mL; 3,5mL; 7mL;
10mL and 14mL. COD was evaluated again.
3.3 OXIDATION PROCEDURE
3.3.1 DARK FENTON´S TREATMENT
Heterogeneous Fenton experiment were made in batch 600 mL reactors, under constant
300rpm agitation, during a maximum of 120 minutes period. Initially, 200mL of real effluent
was added and pH was adjusted with H2SO4 or NaOH. Later, previously defined catalyst
quantity was added as the select iron source, and by last hydrogen peroxide, at 50%, was
introduced in the desired concentration marking the beginning of the reaction. Samples were
taken during time, at 0, 15, 30, 45, 60, 75, 90, 105 and 120 minutes. Each sample was filtered
through a 0.45 μm filter and a certain volume of NaOH was added (In first experiments 1,5mL
of NaHSO3 were added to guarantee reaction’s terminus) to end the reaction, in order to
eliminate residual hydrogen peroxide that interferes with some analytical determinations. Later,
samples were acidized for the analysis mentioned next. Along experiments, the following
parameters were evaluated: Total Phenolic Content (TPh), Chemical Oxygen Demand (COD)
and Total Organic Carbon (TOC). Biological tests involving Biochemical Oxygen Demand
(BOD5), were made to previously selected samples. As many tests as necessary were made, in
order to obtain agreeing values [96].
It should be noticed that some runs were performed under orbital agitation (Heidolph
Reax 20) under constant 16rpm agitation, in 50mL reactors.

CHAPTER 3. EXPERIMENTAL
26 TREATMENT OF LIQUID PHARMACEUTICAL INDUSTRY EFFLUENTS BY FENTON’S PROCESSES
3.3.2 PHOTO FENTON´S TREATMENT
The Photo-Fenton’s installing process consisted of a magnetically agitated photo reactor
(3L glass reactor), with a 9W black light (Phillips), axially placed inside a glass tube in the
reactor. Glass tube with double wall was used to cool the lamp; the temperature was kept at 25 º
C, through a thermo static bath. Preferred used lamp produces wave – length between 350-
400nm. Equipment was covered with aluminum foil to avoid radiation leaks and to avoid
external influences [105].
Heterogeneous Photo-Fenton’s experiments were made under constant agitation, during a
maximum time of 120 minutes. First, 300 mL of real effluent were added and pH was adjusted,
with H2SO4 or NaOH, to the given value. Hydrogen peroxide, at 50%, in desired concentration,
was placed 30 minutes later (zero sample), and reaction began. Samples were taken through
time, at 0, 30, 60, and 120 minutes. Each sample was filtered through a 0.45 μm filter and a
certain volume of NaOH was added to end reaction, in order to eliminate residual hydroxide
peroxide that interferes with some analyses. Later, the sample was acidized to perform further
[96]. Along these experiments, the following parameters were evaluated: Total Phenol Content
(TPh), Chemical Oxygen Demand (COD) and Total Organic Carbon (TOC). Again, tests were
repeated until agreeing values were obtained.
3.4 ANALYTICAL TECHNIQUES
3.4.1 COD - Chemical Oxygen Demand
Chemical Oxygen Demand (mg O2 L-1
) is defined as the amount of oxygen used to
chemically oxidize all the organic matter, and it is commonly used as an indirect measure for
organic constituents in water. Residual COD was analyzed through Closed Reflux Colorimetric
Standard Method 5220D [56], which involves a sample’s digestion in an acid environment for
two hours in presence of dichromate de potassium dichromate (K2Cr2O7), a strong oxidative
agent, and mercury sulphate as catalyst. During reaction, the organic compounds are oxidized
and the orange colored dichromate (Cr2O7-) is reduced to a green colored chromate (Cr
3+),
which is colorimetrically detected. Reaction between chromate absorbance and COD is given by
the device internal calibration, periodically verified, with a standard solution of potassium
hidrogenophthalate.
The thermo reactor WTW CR3000 was used as digester and the photometer WTW
MPM3000 was used to detect dichromate excess, with a double performance for each sample.

CHAPTER 3. EXPERIMENTAL
TREATMENT OF LIQUID PHARMACEUTICAL INDUSTRY EFFLUENTS BY FENTON’S PROCESSES 27
3.4.2 TPh - Total Phenol Content
Total Phenol Content (TPh) was colorimetrically analyzed through Foulin-Ciocalteau
method [43]. 20 μL of the sample were introduced in a 2mL cuvette later diluted with 1.58mL
distilled water. Next, 100 μL Foulin-Ciocalteau’s reagent was added and after 3 to 6 minutes,
300μL of a Sodium Carbonate (Na2CO3) saturated solution. Cuvettes were placed in light’s
absence for 2 hours, and absorbance measured at 765nm through a T60 PG Instruments
Spectrophotometer, against a blank that contained distilled water instead of a sample.
Concentration’s value is expressed in mg.L-1
equivalent to gallic acid, corresponding to a
calibration curve, previously performed with different concentrations of this compound [94].
3.4.3 TOC - Total Organic Carbon
Total Organic Carbon is indirectly obtained from Total Carbon (TC) and Inorganic
Carbon (IC) difference; first TC is measured, and then IC is determined. Samples were
introduced by automatic injection in a suction tube, through an auto-sampler Shimadzu ASI-
5000A which improves analyses’ efficiency. Their measure was made with a Shimadzu 5000
TOC Analyser that works through the combustion/Infrared Analyses Method gas non-disperser
(NDIR). This device uses ultra pure air (<1 mg L-1
of hydrocarbons), that in presence of a
catalyst (platinum supported in alumina), oxidizes Total Carbon to CO2 inside the reactor, being
the carbon dioxide detected in NDIR. The resultant signal is electronically analyzed, and the
area of its peak calculated that, in turn is proportional to Total Carbon concentration,
corresponding to the value of a calibration curve which is obtained through several solutions,
prepared with a standard solution with 2.125g Potassium hidrogenophthalate per distilled water
liter. IC (Inorganic Carbon) is determined after the samples’ injection in the IC reactor, where
gas passes through an acid solution. IC contained is decomposed into CO2 also detected in
NDIR. The calculated peak area corresponds to the value of the calibration curve obtained by a
standard solution with 3.500g of Sodium Hidrogenocarbonate 4.410g and of Sodium Carbonate
per distilled water liter [125].
3.4.4 BOD5 – Biochemical Oxygen Demand
Biochemical Oxygen Demand (mg O2 L-1
) corresponds to the amount of oxygen used in
organic matter degradation by biological processes action, at a medium temperature of 20ºC for
5 days and with adjusted pH between 6.5 and 8.5. BOD5 was calculated by the difference of

CHAPTER 3. EXPERIMENTAL
28 TREATMENT OF LIQUID PHARMACEUTICAL INDUSTRY EFFLUENTS BY FENTON’S PROCESSES
oxygen amount between the moment of preparation and after the incubation period. First, a
mineralized solution was prepared (with a solution of hexahidrated ferric chloride, heptahydrate
sulphate magnesium and Calcium chloride anhydrous), that was pumped with air in order to
saturate it with oxygen. After that period, inoculum was prepared with organisms from earth
and garden according to Standard Methods [56]. At each 300mL (V) erlenmeyer 300μL
inoculums was placed, mineralized solution was added, a certain sample value (Vs), that
depends of its COD value, and dissolved oxygen was measured (ODi) with the help of a WTW
Inolab 740. Erlenmeyer’s volume was made up and was closed to be isolated and without any
air bubbles inside, with each rehearsal being performed in double. At incubation’s end period (5
days) dissolved oxygen was measured again (ODf) and considering dilution made CBO5 was
calculated through equation 23. This procedure was also performed with a flask without sample
(B), to take O2 used by inoculums endogenous’ respiration value under consideration.
5
( ) ( ) Equation 23
IOD OD OD ODI Bf f
CBOVs
V
The range of BOD and the correlated volume needed are shown in Table 3.1
Table 3.1 – The amount of effluent sample to be used in the BOD5 experimental procedure.
(Adapted from Metcalf and Eddy, 2003)
3.4.5 pH
pH was determined by the potentiometric method, using a pH measurer (Crison
micropH2000), previously calibrated with buffer solutions of pH 4.0 and 7.0.
3.4.6 Residual hydrogen peroxide
CHAPTER 3. EXPERIMENTAL
TREATMENT OF LIQUID PHARMACEUTICAL INDUSTRY EFFLUENTS BY FENTON’S PROCESSES 29
Processes’ efficiency was also evaluated by residual hydrogen concentration. Residual
H2O2 analyses were performed through a colorimetric method, Peroxide Test Strip of Precision
Laboratories, which presented a 1; 3; 10; 50 and 100ppm scale.
3.4.7 Effluent’s biodegradability
In order to define or control an effluent’s treatment process it is important to evaluate
effluent’s biodegradability connecting BOD5 with COD, whose ratio may give an effluent’s
biodegradability reference:
5 biodegradabilityBOD
COD
If biodegradability tends to 0 it is an effluent biologically hard to treat. If, by contrary, the
value tends to 1 it is an effluent with some availability for biological treatment [35].
3.4.8 Actinometry
Actinometry is a classical method to determine radiation source’s intensity. The main
substance used is salt from Parker’s actinometre, K3(Fe(C2O4)3).3H2O (tris (oxalate) ferrate
(III), tri hydrate), a light green solid. Another substance commonly used is potassium
ferrioxalate, since it is easy to handle with and sensible to a wide variety of wavelengths (254 to
500 nm). These crystals are prepared by mixing 500mL of 1.5M ferric chlorite (Riedel-de
Haen) with 1.5L of potassium oxalate solution 1.5M (Panreac), at 60ºC. The resulting mixture
is then cooled with an ice bath at 0ºC. This temperature is kept until salt’s crystallization is
complete. Next, final product is filtered through a disposable 0.45μm filter, washed with a small
amount of cold water and a small cold methanol volume to remove excess of water. After that,
the product is left in a desiccator to dry, kept in the dark to be protected from light. Finally, the
obtained crystals are stored in a plastic flask covered with aluminum leaf to stop light from
entering [99], [119], [120].
Next, 0.006 M solution is prepared through 2.947g of crystals dissolution in 100mL of
H2SO4 (1N) (Panreac) and dissolved in distilled water until it makes 1L. This solution is then
irradiated in the photo reactor under efficient agitation, for 3minutes. Then, 2.0 mL of irradiated
solution is placed in a 10mL volumetric balloon, containing a 1.0mL mixture of 0.12% of 1.10-
fenantrolina (Panreac) and 2.5mL of sodium acetate tampon solution (tampon
solution: 600mL of 1.0M of sodium acetate solution (Riedel-de Haën), 360ml of 0.5M of
H2SO4, diluted in a 1L balloon with distilled water), that is diluted with distilled water until it

CHAPTER 3. EXPERIMENTAL
30 TREATMENT OF LIQUID PHARMACEUTICAL INDUSTRY EFFLUENTS BY FENTON’S PROCESSES
makes the necessary volume. The blank is prepared the same way; the only difference is that
this one is not irradiated. Both solutions are kept in the dark (for about one hour) until color
development reaches its full. Both samples’ absorbance difference is measured at 510nm in a
spectrophotometer [119], [120].
Through this actinometrical method of potassium ferrioxalate one can know radiation’s
flux intensity, where Fe3+
is photo chemically transformed into Fe2+
according to the equation
24:
3 2 22 2 2 242 4 2
Fe C O Fe CO Equation
(The amount of produced Fe2+
is measured due to its with 1.10fenantrolina at 510nm.)
[26].
Using the obtained absorbance, light intensity is calculated through the equation:
. .2 3
. . . .1
AV VI
d t V
Where:
light intensity (Einstein/min);
the optical difference in absorbance ( =510nm) between the irradiated solution and
that taken in the dark;
Width cell used to measure the absorbance ( );
is th
I
A
d A
2+ 4at of the complex Fe(phen) to 510nm ( 1,11 10 / . );
3
is the quantum yield of ferrous ion prodution at the irradiation wavelength;
is the aliquot of the irradiated solution taken for the det1
L mol cm
V ermination of the ferrous ions;
is the irradiated volume (mL);2
is the final volume after complrxation with phenanthroline (mL);3
the irradiation time (min).
V
V
t
3.4.9 Iron Leaching Measurement
Aiming to get iron leaching on long terms data, an experimental run was performed with
the same characteristics of the others without stopping the reaction. Iron concentration in the
liquid was determined by atomic absorption using a Perkin-Elmer 3300 spectrometer.
3.4.10 Suspended Solids

CHAPTER 3. EXPERIMENTAL
TREATMENT OF LIQUID PHARMACEUTICAL INDUSTRY EFFLUENTS BY FENTON’S PROCESSES 31
Before beginning experiments, porcelain capsules were washed and 45 ηm filters were
humidified with distilled water. Later they were placed in the glasshouse at, approximately, 105º
C in order to volatize volatile constituents present in both capsules and filter papers. Filter
papers and porcelain capsules were weighted.
Afterwards, 50mL of effluent was filtrated at low pressure using the mentioned former
paper filter. From the filtrate, 20mL were placed in a porcelain capsule. Paper filter was placed
at 105ºC in glasshouse and the porcelain capsule in muffle at 600ºC for 1h-2h. After this, they
were left in the dessicateur to cool and they were weighted again.
a) Total Solids (TS)
Inside of a crucible previously dried, a known volume of sample was taken to glasshouse
at 105ºC until constant weight. Total solids are those that remain as residue after that procedure.
With mass values from the crucible (with and without dried solids), TS may be calculated this
way:
1 2TS M M
Equation 25 – Total Solids calculation. Where M1 is mass before evaporation and M2 is mass after
evaporation.
b) Total Fix Solids (TFS)
Total fixed solids are the portion remaining in the recipient even after calcination (made
in a muffle, at 600ºC for two hours). With crucible’s mass values before and after that stage,
TFS can be calculated as follows:
2 3TFS M M
Equation 26 – Total fixed solids calculation. Where M2 is mass before calcinations and M3 is mass after
calcinations.
c) Total Volatile Solids (TVS)
Total volatile solids constitute the part of total solids that volatize during calcination.
TVS value is obtained through difference between total solids and total fix solids (TFS), as
shown in equation below:
TVS TS TFS
Equation 27 – Total volatile solids’ calculation.
d) Total Suspended Solids (TSS)

CHAPTER 3. EXPERIMENTAL
32 TREATMENT OF LIQUID PHARMACEUTICAL INDUSTRY EFFLUENTS BY FENTON’S PROCESSES
Suspended solids are those with diameter higher than 0.45µm. They correspond to the
remaining residue over filter paper with pores diameter equal to 0.45µm after a known volume
sample is filtered. With masses values from paper filters (dried in glasshouse at 105ºC for one
hour) before and after containing the filtrate residua, TSS can be calculated this way:
1 2TSS P P
Equation 28 – Total suspended solids calculation. Where P1 is mass from washed and dried paper filter
before it contains the solids and P2 is mass from dried paper filter after it contains the solids.
e) Fix Suspended Solids (FSS)
Fix suspended solids are the portion of total suspended solids that remain as residua in a
crucible after calcination (600ºC for two hours). Through crucible’s masses difference before
and after calcination, fix suspended solids mass can be calculated through the equation below:
2 3FSS P P
Equation 29 – Fix suspended solids calculation. Where P2 is dried crucible’s mass before calcinations
and P3 is crucible’s mass after calcinations.
f) Volatile Suspended Solids (VSS)
Volatile suspended solids are the filtered part of residua that volatizes during calcination
(600ºC for two hours). Volatile suspended solids mass can be calculated through the following
difference:
VSS TSS FSS
Equation 30 – Volatile suspended solid’ calculation.
g) Total Dissolved Solids (TDS)
TDS TS TSS
Equation 31 – Total dissolved solids’ calculation.
h) Fix Dissolved Solids (FDS)
FDS TFS FSS

CHAPTER 3. EXPERIMENTAL
TREATMENT OF LIQUID PHARMACEUTICAL INDUSTRY EFFLUENTS BY FENTON’S PROCESSES 33
Equation 32 – Fix dissolved solids’ calculation.
i) Volatile Dissolved Solids (VDS)
VDS TVS VSS
Equation 33 – Volatile dissolved solids’ calculation.

CHAPTER 4. RESULTS AND DISCUSSION
34 TREATMENT OF LIQUID PHARMACEUTICAL INDUSTRY EFFLUENTS BY FENTON’S PROCESSES
4 RESULTS AND DISCUSSION:
In this chapter, the industrial effluent is characterized and all the results are presented and
discussed.
4.1 EFFLUENT’S CHARACTERIZATION
The real effluent in study was collected from a pharmaceutical industry and its
composition is unknown. The plant synthesizes and produces active substances and develops
formulas of several therapeutic classes.
Effluent’s chemical characteristics are summed in the table 4.1.1, as well as the standard
deviations associated to each analyses technique.
Table 4.1 – Chemical characteristics of the real liquid effluent in study with the corresponding
experimental deviation presented in parenthesis
Characteristics Values
COD (mg O2 L-1
) 9520 (± 10)
BOD5 (mg O2 L-1
) 4710 (± 20)
BOD5/COD 0.4
TOC (ppm) 5134 (± 10)
TPh (mg GA L-1
) 211 (± 20)
pH 5.4
Liquid effluent treatments based on advanced oxidation process have as main goal to
obtain an effluent that corresponds to discharge legal limits in the environment. When this is not
possible or economically not viable, the targets become reducing its toxicity and increase its
biodegradability. According to present environmental laws, an effluent must not have COD and
BOD5 values above 150mg O2 L-1
and 40mg O2 L-1
, respectively, to be released into
surroundings.
The studied effluent presents a high organic charge, with COD of 9520 mg O2 L-1
,
BOD5 of 4710 mg O2 L-1
and TOC of 5134ppm (Table 4.1.1). Even if biodegradability is not so
low (BOD5/COD) = 0.4, as an effluent is considered to be completely biodegradable when this
ratio is superior to 0.4 [35] it is known that it can not be directly subjected to biological
treatment, sustaining the need to proceed to an oxidative chemical process. In fact, its

CHAPTER 4. RESULTS AND DISCUSSION
TREATMENT OF LIQUID PHARMACEUTICAL INDUSTRY EFFLUENTS BY FENTON’S PROCESSES 35
cumbersome composition comprising highly toxic substances such as phenolic compounds (211
mg GA L-1
) which are known for being refractory and toxic to microorganisms, is continuously
changing throughout time due to variations on the drugs being produced.
For effluents’ directly release into the natural water courses, Decretory-Law nº 236/98
establishes limited emission values. The most commonly quoted and analyzed parameters are
summed in the table 4.2.
Table.4.2 – Emission limit values (ELV) in residual water release
Parameters Results expression ELV
pH Sorensen’ Scale 6,0-9,0
Temperature ºC 3ºC increase
BOD5 mg O2 L-1
40
COD mg O2 L-1
150
TSS mg L-1
60
Color - Not detectable in dilution 1:20
Odor - Not visible in dilution 1:20
4.2 PRELIMINARY EXPERIMENTS
4.2.1 Coagulation
The raw effluent presents brownish color, intense odor and suspended solids. This way,
before the experimental procedure related to the study of the Heterogeneous Fenton’s process
behavior, coagulation tests and posterior suspended solids analyses were made.
In figure 4.1 it is possible to see a significant reduction of COD and TOC by placing 7mL
(1g mL-1
) of coagulant p19 and pH 3.
a) b)
Figure 4.1 – Effect of the different pH on COD (a) and TOC (b) degradation by placing 7mL of coagulant p19.

CHAPTER 4. RESULTS AND DISCUSSION
36 TREATMENT OF LIQUID PHARMACEUTICAL INDUSTRY EFFLUENTS BY FENTON’S PROCESSES
It was seen that pH has influence over coagulation’s process. At pH 3, not only does one
get better results but also, it will not be necessary to make future pH corrections in order to
proceed with the Fenton’s process, since process’ optimum pH is 3.
After this, it was observed that by adding lower (2mL; 3.5) and higher (10mL; 14mL)
quantities of coagulant at pH3 COD removal percentage increased (figure 4.1.2). However, the
obtained results show that the TOC removal was not favored by lowering the p19 amount while
a slight increase was reached when adding 10mL. In what regards TPh values, bigger reductions
were detected, with the exception of 2mL that led to a removal percentage near zero, which
reveals that the quantity of coagulant used was not enough to remove phenol content.
a) b)
c)
Figure 4.2 – Effect of the different concentration of p19 on COD (a) , TOC (b) and TPh (c) degradation by
placing pH 3.
As for effluent’s BOD5, a significant decrease was observed, given that this parameter
went from 4710 mg O2 L-1
to 2441 mg O2 L-1
.
4.2.2 Suspended solids
From a chemical point of view, solids are classified as volatiles and fix. Volatile solids
are those that volatize at temperatures below 600ºC, either organic substances or mineral salts.

CHAPTER 4. RESULTS AND DISCUSSION
TREATMENT OF LIQUID PHARMACEUTICAL INDUSTRY EFFLUENTS BY FENTON’S PROCESSES 37
Fix solids are those that remain after water’s complete evaporation, usually salts. Dissolved
solids excess in the effluent can cause corrosion problems. As for suspended solids, they make
water muddy creating aesthetic problems and harming photosynthetic activity.
Through the figure 4.3 it is possible to check a further reduction in the amount of solids
present in the effluent coagulated with 3.5mL of p19 and pH 3. The excess coagulant (10mL
and 14mL) discloses increased TSS because for large concentrations of coagulant restabilization
occurs, i.e., colloids become positively charged by excess coagulant.
Figure 4.3 – Effect of the different concentration of p19 on TSS by placing pH 3.
4.3 CATALYSTS SCREENING
The effluent used for all experimental tests (except those marked) was coagulated effluent
(with 3.5mL of p19 and pH 3).
Effluent’s chemical characteristics are summed in the table 4.3, as well as the standard
deviations associated to each analyses technique.
Table 4.3 – Chemical characteristics of the coagulated liquid effluent with analytical deviations in
parenthesis
Characteristics Values
COD (mg O2 L-1
) 4270 (± 10)
BOD5 (mg O2 L-1
) 2441 (± 20)
BOD5/COD 0.57
TOC (ppm) 2855 (± 10)
TPh (mg GA L-1
) 149 (± 20)
pH 3
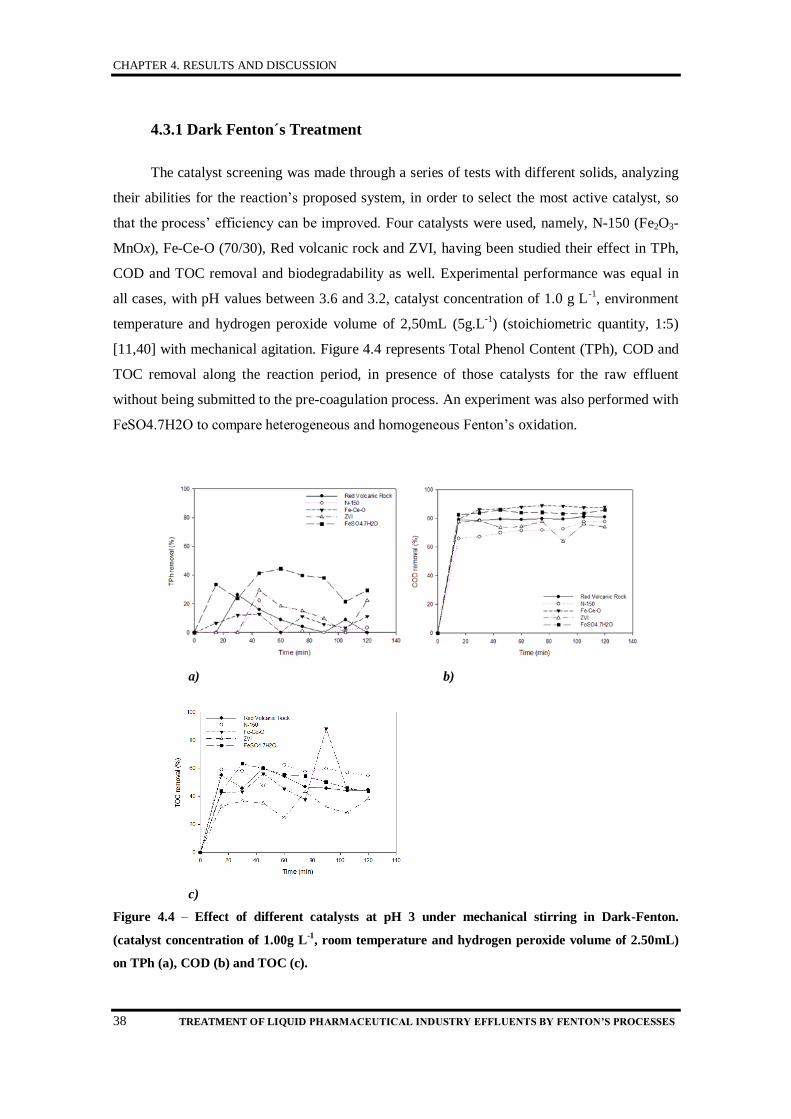
CHAPTER 4. RESULTS AND DISCUSSION
38 TREATMENT OF LIQUID PHARMACEUTICAL INDUSTRY EFFLUENTS BY FENTON’S PROCESSES
4.3.1 Dark Fenton´s Treatment
The catalyst screening was made through a series of tests with different solids, analyzing
their abilities for the reaction’s proposed system, in order to select the most active catalyst, so
that the process’ efficiency can be improved. Four catalysts were used, namely, N-150 (Fe2O3-
MnOx), Fe-Ce-O (70/30), Red volcanic rock and ZVI, having been studied their effect in TPh,
COD and TOC removal and biodegradability as well. Experimental performance was equal in
all cases, with pH values between 3.6 and 3.2, catalyst concentration of 1.0 g L-1
, environment
temperature and hydrogen peroxide volume of 2,50mL (5g.L-1
) (stoichiometric quantity, 1:5)
[11,40] with mechanical agitation. Figure 4.4 represents Total Phenol Content (TPh), COD and
TOC removal along the reaction period, in presence of those catalysts for the raw effluent
without being submitted to the pre-coagulation process. An experiment was also performed with
FeSO4.7H2O to compare heterogeneous and homogeneous Fenton’s oxidation.
a) b)
c)
Figure 4.4 – Effect of different catalysts at pH 3 under mechanical stirring in Dark-Fenton.
(catalyst concentration of 1.00g L-1
, room temperature and hydrogen peroxide volume of 2.50mL)
on TPh (a), COD (b) and TOC (c).

CHAPTER 4. RESULTS AND DISCUSSION
TREATMENT OF LIQUID PHARMACEUTICAL INDUSTRY EFFLUENTS BY FENTON’S PROCESSES 39
Through these data, it is seen that there was inconsistency in the obtained results
reflected on the irregular profiles along time. That can be explained by the impossibility to
maintain the solid catalysts with the same uniform concentration in solution under
homogeneous agitation since with mechanical stirring that was used in the experiment system
the presence of catalyst’s deposit in the reactor could be observed. Besides, effluent’s
coagulation had not yet been made, which shows that the presence of dissolved solids makes
phenol compounds and organic matter measurement impracticable.
It is also important to note that, in these first experiments, the method for that was used
for the reaction terminus was the addition of 1.5mL of NaHSO3, to consume all hydrogen
peroxide still present, according to equation 4.3:
342 2 3 2 4
H O SO H O SO Equation
However, it was discovered that this reagent also interfered with the COD determination
and for that reason all the runs had, as method for ending the reaction, a pH increase for values
near pH=10. Besides, since no homogeneity was possible to be attained with mechanical
stirring, all the following experiments were then performed in an orbital agitator. In fact, with
these changes in the operation mode, those irregularities in the values measured along treatment
were eliminated, as can be observed in the results shown below. Moreover, the quite different
range levels detected now indicate that the previous procedure was inappropriate.
In figure 4.5 it is possible to see the total phenol content removal given by the oxidation
reaction performed for the different catalysts under the new operating characteristics.
Figure 4.5 – Effect of different catalysts at pH 3 with orbital agitator in Dark-Fenton (catalyst
concentration of 1.00g L-1
, room temperature and hydrogen peroxide volume of 0,33mL) on TPh
degradation profiles.
It can be observed that all catalytic systems had satisfactory results, in what concerns
TPh, with removals above 50% (except for Fe-Ce-O) under high initial velocities. The

CHAPTER 4. RESULTS AND DISCUSSION
40 TREATMENT OF LIQUID PHARMACEUTICAL INDUSTRY EFFLUENTS BY FENTON’S PROCESSES
laboratory made catalyst, Fe-Ce-O, is the one presenting lower efficiency, with phenolic
decrease removal around 34%. Among other catalysts, there are similar degradation profiles for
the reaction’s first 30 minutes. After 120 minutes, it was achieved 56% degradation with the
commercial catalyst, N-150, and 52% on those of low commercial value, red volcanic rock
(RVR) and ZVI In what regards the red volcanic rock, after 30 minutes of reaction no further
TPh abatement is observed maintaining itself practically unaltered, most likely due to refractive
phenol compounds formed during the oxidation process. In this case, the heterogeneous
Fenton’s process, with any of those catalysts, was much below expectation when compared with
the homogeneous process, since when FeSO4.7H2O was used 64% of the phenolic compounds
were removed after 120 minutes.
Figure 4.6 presents Chemical Oxygen Demand removal through time for the different
catalytic systems.
Figure 4.6 – Effect of different catalysts at pH 3 under orbital agitator in Dark-Fenton. (catalyst
concentration of 1.00g L-1
, room temperature and hydrogen peroxide volume of 0,33mL) on COD
degradation profiles.
Each one of the catalysts presents similar evolution until 30 minutes, with removals in the
range 50-60% removal, which are nearly maintained until 120 minutes. Fe-Ce-O presents 59%
of COD degradation at the reaction’s end, while the red volcanic rock catalyst reaches little
more than 50% of Chemical Oxygen Demand abatement. Even though the heterogeneous
systems reached similar results to those of the homogeneous operation, in this case the
efficiency was slightly higher with 61% final depuration.
TOC removal allows evaluating the mineralization degree obtained by the oxidation
process of the involved compounds. Figure 4.7 shows the TOC degradation profiles for all the
systems under study.
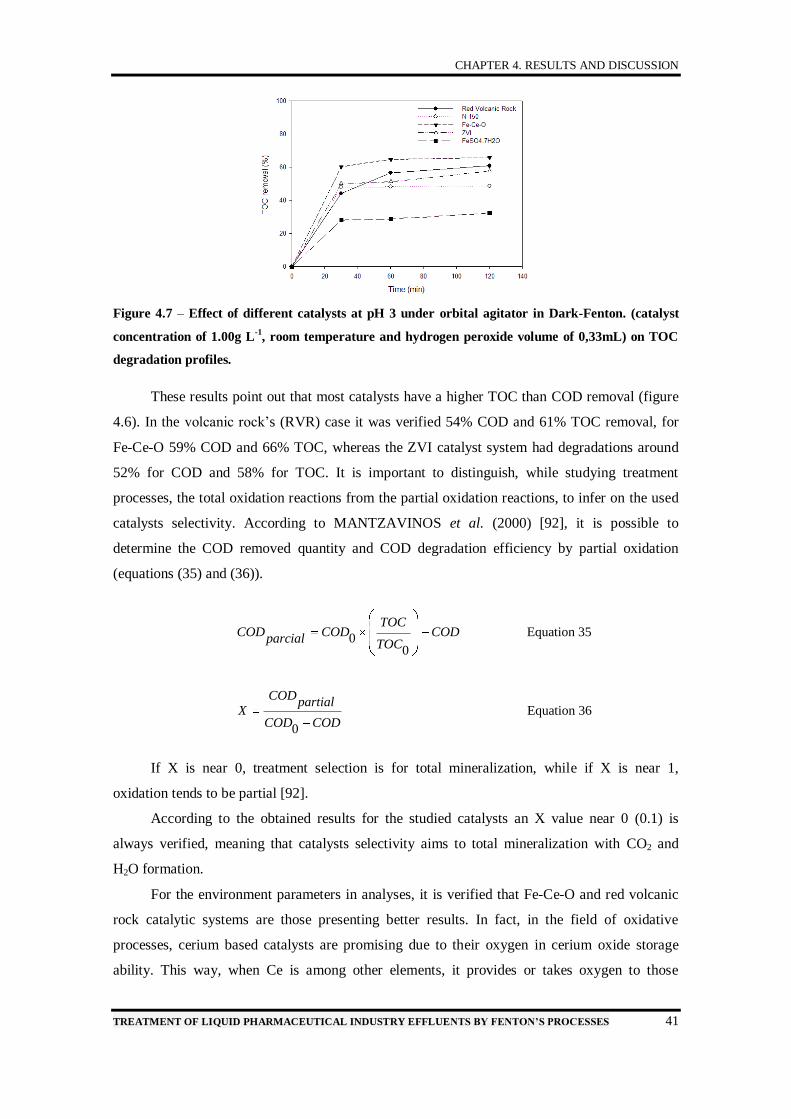
CHAPTER 4. RESULTS AND DISCUSSION
TREATMENT OF LIQUID PHARMACEUTICAL INDUSTRY EFFLUENTS BY FENTON’S PROCESSES 41
Figure 4.7 – Effect of different catalysts at pH 3 under orbital agitator in Dark-Fenton. (catalyst
concentration of 1.00g L-1
, room temperature and hydrogen peroxide volume of 0,33mL) on TOC
degradation profiles.
These results point out that most catalysts have a higher TOC than COD removal (figure
4.6). In the volcanic rock’s (RVR) case it was verified 54% COD and 61% TOC removal, for
Fe-Ce-O 59% COD and 66% TOC, whereas the ZVI catalyst system had degradations around
52% for COD and 58% for TOC. It is important to distinguish, while studying treatment
processes, the total oxidation reactions from the partial oxidation reactions, to infer on the used
catalysts selectivity. According to MANTZAVINOS et al. (2000) [92], it is possible to
determine the COD removed quantity and COD degradation efficiency by partial oxidation
(equations (35) and (36)).
Equation 350
0
Equation 36
0
TOCCOD COD COD
parcial TOC
CODpartial
XCOD COD
If X is near 0, treatment selection is for total mineralization, while if X is near 1,
oxidation tends to be partial [92].
According to the obtained results for the studied catalysts an X value near 0 (0.1) is
always verified, meaning that catalysts selectivity aims to total mineralization with CO2 and
H2O formation.
For the environment parameters in analyses, it is verified that Fe-Ce-O and red volcanic
rock catalytic systems are those presenting better results. In fact, in the field of oxidative
processes, cerium based catalysts are promising due to their oxygen in cerium oxide storage
ability. This way, when Ce is among other elements, it provides or takes oxygen to those

CHAPTER 4. RESULTS AND DISCUSSION
42 TREATMENT OF LIQUID PHARMACEUTICAL INDUSTRY EFFLUENTS BY FENTON’S PROCESSES
elements according to need, allowing a better electronic balance and this way favoring oxidative
reactions [131].
Table 4.4 presents final COD and BOD5 values, which according legislation may not
exceed 40 and 150 mg O2 L-1 if the wastewater is to be directly discharged in surroundings. As
can be seen, the effluent after this chemical treatment is still not under legal limits for release.
This way, biodegradability (BOD5/COD) at the end of the Fenton’s treatment was evaluated in
order to determine posterior biological treatment applicability to further purify the effluent. It
was then seen that the less efficient catalyst in the organic removal and with lower BOD5/COD
ratio with a 0.54 value was N-150, meaning the effluent is more biodegradable while all other
catalysts increased BOD5/COD ratio compared to 0.57 of initial coagulate effluent and were
close to reaching biodegradability. Homogeneous system had lower value discrepancy when
compared to heterogeneous.
Table 4.4 – BOD, COD and Biodegradability quantification of the residual water
Catalyst BOD5 (mg O2 L
-1) COD (mg O2 L
-1) Biodegradability
Red Volcanic Rock 1253 1945 0,64
N-150 1010 1840 0,54
Fe-Ce-O 70/30 1115 1770 0,62
ZVI 1889 2050 0,58
FeSO4.7H2O 1113 1665 0,67
In order to evaluate catalyst stability the amount of iron leached (mg Fe L-1
) was
quantified at the end of oxidation process and is shown in figure 4.8.
Figure 4.8 – Amount of iron leached after 120 minutes of Dark-Fenton Process for different
catalysts.

CHAPTER 4. RESULTS AND DISCUSSION
TREATMENT OF LIQUID PHARMACEUTICAL INDUSTRY EFFLUENTS BY FENTON’S PROCESSES 43
The lower iron leached value is attained by the commercial catalyst N-150, 2.90 mg Fe L-
1. However, Fe-Ce-O and volcanic rock (RVR) also presented low values, 6.0 and 18.6
respectively, when compared to ZVI with 224 mg Fe L-1 and with the more drastically higher
result for the homogeneous process with 634 mg Fe L-1
(the legal limit for discharge of
wastewater is 2 mg Fe L-1, Decretory-Law nº236/98).
In the following study we only pursued with the laboratorial Fe-Ce-O catalyst as well as
with the low cost solids, red volcanic rock and ZVI, since the commercial catalyst N-150 may
be more expensive without revealing, in general, better performance. Indeed it presented lower
biodegradability results and was very close to other catalysts in TOC, COD and TPh depuration
levels.
4.3.1.1 pH’s influence on the process performance
Since Fenton’s processes are catalyzed by Fe2+
/Fe3+
ions and considering that these ions
are hydrolyzed forming insoluble hydroxides, environment’s pH has a strong role in organic
compounds degradation velocity, since iron ions precipitate when pH is higher than 6 [95],
[109]. At pH 3 Fe3+
dominant species in aqua solution are FeOH3+
[12]. Below optimum pH for
reaction’s success, active species’ concentration is low and for high pH Fe3+
/Fe2+
ions
precipitate as hydroxides [55].
In order to evaluate the influence of pH’s liquid mixture during the treatment process,
values (in range 3-9) of pH 3, 5, 7 and 9 were taken under consideration. pH 3 was chosen
because it is indicated for Fenton’s reaction; pH 5, on other turn, was selected because it is
close to effluent’s pH; pH 7 is ideal for discarding the effluent in environment; lastly, pH 9 to
verify if there is still reaction to a high pH, since to end reaction pH was settled near 10.
It is known that with neutral to alkaline pH there is fast H2O2 decomposition with
molecular oxygen production without corresponding hydroxyl radicals formation, prejudicing
the desirable degradation process [112], since molecular oxygen is not capable of an efficient
organic compounds oxidation at environment’s pressure and temperature. Another important
parameter is active species’ leaching, demanding the need to quantify iron in solution after the
process in order to evaluate catalyst stability and reuse. Several references show that leaching
increases as pH decays [112], [28]. This way it is also essential to estimate the amount of iron in
the liquid after experimental performance because iron has to be lower than 2 mg L-1
, the legal
limit, so that the effluent can be released into natural courses.
Figure 4.9 presents COD and TOC removal efficiency to different used pH, intending for
the select a pH value that has better global catalyst system efficiency, and that provides better
removal rates and higher catalyst stability. For pH 7, it is verified that the COD removal

CHAPTER 4. RESULTS AND DISCUSSION
44 TREATMENT OF LIQUID PHARMACEUTICAL INDUSTRY EFFLUENTS BY FENTON’S PROCESSES
percentage is low, even null in the Fe-Ce-O case. That can be explained through H2O2 fast
decomposition, into molecular oxygen without formation of hydroxyl radicals. At pH9
oxidation is not significant, and that was expected since iron ions begin to precipitate forming
hydroxides.
a) b)
Figure 4.9 – COD (a) and TOC (b) removal to different used pH at 120 minutes in Dark-Fenton.
(Fixed pH during the experimental test. Pressure and Room temperature).
However, TOC results show that there is significant mineralization (above 50%) to all pH
range for ZVI and Fe-Ce-O. For the red volcanic rock (RVR), there is clearly a remarkable
difference between reaction under pH 3 and higher values with TOC depletion being favored at
pH 3. It is known that removed carbon can be due to adsorption or oxidation. In order to identify
which are the paths involved the used catalysts were analyzed after treatment and the results
point out that there is larger adsorption under pH 9 in Fe-Ce-O, around 16.5mg L-1
, while under
pH 3,5 and 7 was 0.3mg.L-1
, 0.4mg.L-1
and 1.4mg.L-1
, respectively. ZVI also had high
adsorption, with the lower one at pH 3, around 0.4mg.L-1, whereas in the cases of pH 5, 7 and 9
had 13.7mg.L-1
, 15.4mg.L-1
and 13.2mg.L-1
of carbon, respectively. The red volcanic rock
presented lower carbon concentration, around 1mg L-1
for pHs 5, 7 and 9.
These result lead to the conclusion that the possibility of using equal to 5 or above may be
excluded once the process’ stability and adequate results obtaining is affected with subsequent
lower degradation [113]. In order to determine pH’s impact in the catalyst stability, the leached
iron was quantified (mg L-1
) after the oxidation’s process performed to different pH values, as
presented in figure 4.10.
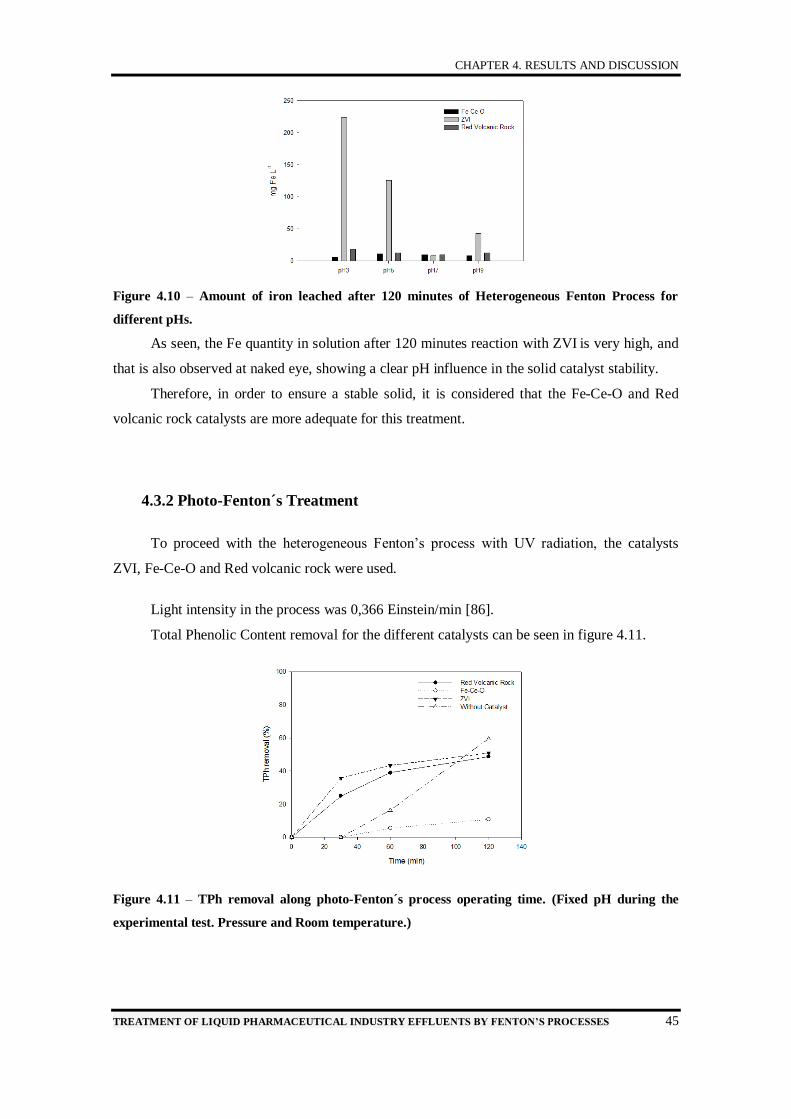
CHAPTER 4. RESULTS AND DISCUSSION
TREATMENT OF LIQUID PHARMACEUTICAL INDUSTRY EFFLUENTS BY FENTON’S PROCESSES 45
Figure 4.10 – Amount of iron leached after 120 minutes of Heterogeneous Fenton Process for
different pHs.
As seen, the Fe quantity in solution after 120 minutes reaction with ZVI is very high, and
that is also observed at naked eye, showing a clear pH influence in the solid catalyst stability.
Therefore, in order to ensure a stable solid, it is considered that the Fe-Ce-O and Red
volcanic rock catalysts are more adequate for this treatment.
4.3.2 Photo-Fenton´s Treatment
To proceed with the heterogeneous Fenton’s process with UV radiation, the catalysts
ZVI, Fe-Ce-O and Red volcanic rock were used.
Light intensity in the process was 0,366 Einstein/min [86].
Total Phenolic Content removal for the different catalysts can be seen in figure 4.11.
Figure 4.11 – TPh removal along photo-Fenton´s process operating time. (Fixed pH during the
experimental test. Pressure and Room temperature.)

CHAPTER 4. RESULTS AND DISCUSSION
46 TREATMENT OF LIQUID PHARMACEUTICAL INDUSTRY EFFLUENTS BY FENTON’S PROCESSES
The red volcanic rock and ZVI present similar behavior, while Fe-Ce-O reveals only 11%
removal, below the expected values, since one could presume to benefit from ultra violet light
instead of an activity reduction (when compared to Dark-Fenton, 34%).
Those solid catalysts (volcanic rock and ZVI) could reach a TPh final degradation around
51% presenting a higher reactive velocity along time when compared to the process carried out
without a catalyst, which, however, allowed a higher depuration at the end of the treatment.
Figure 4.12 presents COD and TOC removal profiles.
a) b)
Figure 4.12 – COD (a) and TOC (b) removal along photo-Fenton´s process operating time. (Fixed
pH during the experimental test. Pressure and Room temperature)
For Chemical Oxygen Demand removal, the most efficient catalyst was the red volcanic
rock, reaching 70% after 30 min and a final efficiency of 80%. All catalysts have high reactive
velocity during the first 30 minutes. Fe-Ce-O 70/30 presents again similar reaction profiles and
inferior oxidation, around 63%, showing lower selectivity for this environmental parameter’s
removal.
In what regards Total Organic Carbon degradation all catalysts have a high reaction rate
in the first 30 minutes. However, ZVI presents a better removal percentage, 47%, being,
therefore, the most efficient catalytic system for TOC removal. The other catalysts showed
lower activity.
The most commonly accepted mechanism for photolysis with UV/H2O2 is the breakdown
of the molecule leading to two hydroxyl radical •OH according to equation 12. However, it
should be noted that there is also the possibility of recombination of these radicals, producing
H2O2 again (equation 13). And if there is excess of H2O2, it can possibly act as radical scavenger
and subsequently promote a low yield because the oxidation of organic matter will be slower. In
literature, there are tests described using less UV light intensity, which supports this assertion.
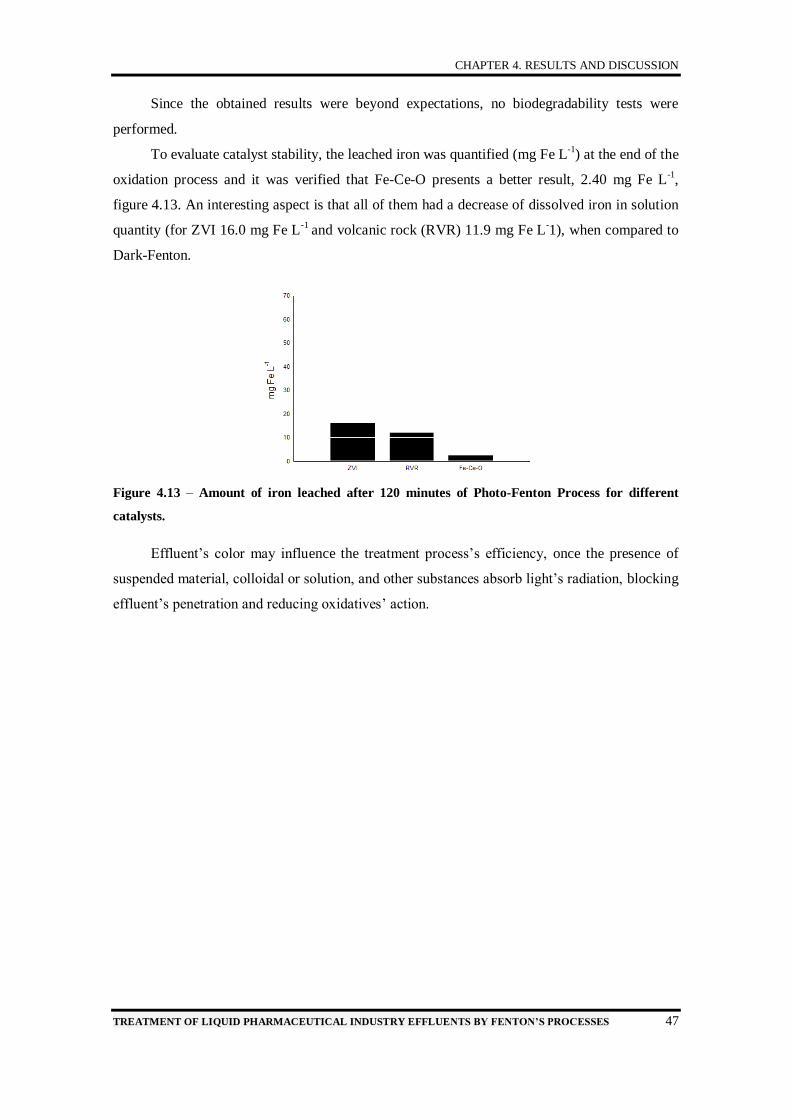
CHAPTER 4. RESULTS AND DISCUSSION
TREATMENT OF LIQUID PHARMACEUTICAL INDUSTRY EFFLUENTS BY FENTON’S PROCESSES 47
Since the obtained results were beyond expectations, no biodegradability tests were
performed.
To evaluate catalyst stability, the leached iron was quantified (mg Fe L-1
) at the end of the
oxidation process and it was verified that Fe-Ce-O presents a better result, 2.40 mg Fe L-1,
figure 4.13. An interesting aspect is that all of them had a decrease of dissolved iron in solution
quantity (for ZVI 16.0 mg Fe L-1
and volcanic rock (RVR) 11.9 mg Fe L-1), when compared to
Dark-Fenton.
Figure 4.13 – Amount of iron leached after 120 minutes of Photo-Fenton Process for different
catalysts.
Effluent’s color may influence the treatment process’s efficiency, once the presence of
suspended material, colloidal or solution, and other substances absorb light’s radiation, blocking
effluent’s penetration and reducing oxidatives’ action.

CHAPTER 5. CONCLUSIONS AND FUTURE WORK SUGGESTION
48 TREATMENT OF LIQUID PHARMACEUTICAL INDUSTRY EFFLUENTS BY FENTON’S PROCESSES
5 CONCLUSIONS AND FUTURE WORK SUGGESTION:
In this part of the thesis, a general overview of the main results is presented, along with
the most relevant conclusions. Suggestions for future work are also bring forward.
5.1 CONCLUSIONS:
This work was done into several steps, and it aimed to determine best operational
conditions for an actual pharmaceutical effluent’s degradation, whose characteristics and
constitution were unknown, through Fenton’s process. Different massic catalysts were tested,
namely, the commercial N-150 (Fe2O3-MnOx), the laboratory made Fe-Ce-O 70/30, and low
cost volcanic rock (nature) and ZVI (metallurgic industry) solids. In order to take advantage
from Fenton’s and to minimize solid residue formation, ultraviolet radiation was studied as
adjuvant in hydroxyl radicals’ formation.
The obtained results award the Fe-Ce-O 70/30 system as most efficient in Dark Fenton
and Red Volcanic Rock in Photo-Fenton. Fe-Ce-O 70/30 in Dark-Fenton, had a TPh 34%
degradation and removals around 59% and 66% for COD and TOC respectively, after 120
minutes of reaction, presenting selectivity towards total mineralization. Due to its high storage
capacity for oxygen in cerium oxide, Fe-Ce-O 70/30 allows a better electronic equilibrium and,
therefore favors oxidative reactions. Besides, it is a stable catalyst, since among all it was the
one presenting lower leached iron quantity. Red Volcanic Rock in Photo-Fenton led to 49% of
TPh decrease and removals around 80% for COD and 40% for TOC after 120 minutes of
reaction.
In what concerns the effect of pH, if, in one hand, reaction efficiency increases with pH
reduction, iron leaching also increases originating activity and catalyst stability reduction.
Moreover, under higher pH there is fast H2O2 decomposition, without corresponding hydroxyl
radicals formation harming the desired degradation process.
In what respects to biodegradability, it was possible to achieve acceptable results.
An important aspect is that the experimental coagulation pre-treatment was able to
remove large amounts of suspended solids and achieve better results in the Fenton process.
Finally, this work points out the catalyst Fe-Ce-O 70/30 and the Red Volcanic Rock as
promising in the catalytic oxidation through Heterogeneous Fenton and Photo-Fenton,
respectively, in the effluent’s degradation. This shows capabilities for implementing these

CHAPTER 5. CONCLUSIONS AND FUTURE WORK SUGGESTION
TREATMENT OF LIQUID PHARMACEUTICAL INDUSTRY EFFLUENTS BY FENTON’S PROCESSES 49
technologies as residual water treatment, so that it can be possible to include in posterior
biological systems.
5.2 FUTURE WORK SUGGESTION:
While preparing this dissertation, it was verified that there is lack of information
concerning hydric environment and human health possible effects in presence of persistent
drugs in the environment. Therefore, information about formed degradation products’ identity
and sample’s toxicity after treatment are fundamental information in order to ensure Fenton’s
process appliance’ safety and effectiveness in treating effluents with drugs’ residua. This way,
biodegradability and toxicity experiments and, mostly, identification of effluent’s active
constituents before and after treatment, are extremely important.
Based on the obtained promising results and considering the industrial interest for this
liquid effluents’ treatment method, it would be important to adjust the process intervenient
variable, such as, catalyst concentration, hydrogen peroxide concentration and reaction time in
order to attempt to achieve better results. Besides, using UV radiation during the process has
proven to involve a capital gain in reducing catalyst’ leaching. This way, it would be very
important to deepen the analysis of this process, as one of the stronger Fenton’s inconvenient is
iron’s high leaching at optimum pH (pH3).
.

CHAPTER 6. REFERENCES
50 TREATMENT OF LIQUID PHARMACEUTICAL INDUSTRY EFFLUENTS BY FENTON’S PROCESSES
6 REFERENCES
[1] AGUIAR, A.; FERRAZ, A.; CONTRERAS, D. et al. Mecanismo e aplicações da Reacção de
Fenton assistida por compostos fenólicos redutores de ferro. Química Nova, v.30, n. 3, 623-
628. 2007.
[2] ALVES,J. F. Aplicação do Reagente de Fenton no Tratamento de Líquidos Lixiviados de
Aterros Sanitários. Dissertação de Mestrado, universidade Federal de Minas Gerais, Brasil.
2004.
[3] ABELLÁN, M. N.; BAYARRI, B.; JIMÉNEZ, J.; COSTA J.; Appl. Catal., B 2007.
[4] ADDAMO, M.; AUGIGLIARO, V.; DI PAOLA, A.; GARCÍA-LOPEZ, E.; LODDO, V.;
MARCI, G.; PALMISANO, L.; J. Appl. Eletrochem. 2005.
[5] ANDREOZZI, R.; CAMPANELLA, L; FRÍASE, B.; GARRIC, J.; GONNELLA, A.; LO
GIUDICE, R.; MAROTTA, R.; PINTO, G.; POLLIO A.; Water Sci. Technol. 2004.
[6] ANDREOZZI, R.; CANTERINO, M.; MAROTTA, R.; PAXÉUS, N.; J. Hazard. Mat. 2005.
[7] ANDREOZZI, R.; CAPRIO, V.; MAROTTA, R.; VOGNA, D.; Water Res. 2003.
[8] ANDREOZZI, R.; MAROTTA, R.; PAXÉUS, N.; Chemosphere. 2003.
[9] ANDREOZZI R., MAROTTA R., PAXEUS N. Pharmaceutical in STP effluents and their
solar photodegradation in aquatic environment. Chemosphere, v.50, p.1319-1330. 2003a.
[10] BACARDIT,J.; STOTZNER, J.; CHAMARRO, E.; ESPULGAS, S. Effect of Salinity on the
Photo-Fenton Process. American Chemical Society. 2007.
[11] BALCIOĞLU, I. A., ÖTKER, M.,. “Treatment of pharmaceutical wastewater containing
antibiotics by O3 and O3/H2O2 processes”, Chemosphere, Vol. 50, pp. 85-95. 2003.
[12] BAUER, R,; FALLMANN, H. The photo-Fenton oxidation – A cheap and efficient
wastewater treatment method. Res. Chem. Intermediat., v. 23, p.341-354. 1997.
[13] BAUTITZ, I. R.; NOGUEIRA, R. F. P.; J. Photochem. Photobiol. A. 2007.
[14] BENDZ, D.; PAXÉUS, N. A.; GINN, T. R.; LOGR, F. J.; J. Hazard. Mater. 2005.
[15] BIGDA, R.J. Cinsider Fentons Chemistry for wasterwater Treatment. Chemical Engineering
Progres,v. 91, n. 12, p. 62-66, 1995.
[16] BILA, D. M.; DEZOTTI, M.; Quim. Nova 2003.
[17] BUITRÓN, G.; GONZÁLES, A.; WAT. SCI. TECH. 1996, 34, 289., Orhon, D.; Tasli, R.;
Sozen, S.; Wat. Sci. Tech. 1999, 40, 1.; Gebara, F.; Wat. Res. 1999.
[18] BUSER H.R., POIGER T., MÜLLER M.D. Occurrence and fate of the pharmaceutical drug
diclofenac in surface waters: rapid photodegradation in a lake. Environ. Sci. Technol., v.32,
p.3449-3456. 1998.

CHAPTER 6. REFERENCES
TREATMENT OF LIQUID PHARMACEUTICAL INDUSTRY EFFLUENTS BY FENTON’S PROCESSES 51
[19] CALAMARI, D.; ZUCCATO, E.; CASTIGLIONI, S.; BAGNATI, R.; FANELLI, R.; En-
viron. Sci. Technol. 2003.
[20] CALZA, P.; SAKKAS, V. A.; MEDANA, C.; BAIOCCHI, C.; DIMOU, A.; PELIZZETTI,
E.; ALBANIS, T.; Appl. Catal. B. 2006.
[21] CALZA, P.; MEDANA, C.; PAZZI, M.; BAIOCCHI, C.; PELIZZETTI, E.; Appl. Catal., B.
2004.
[22] CARBALA, M.; OMIL, F.; LEMA, J. M.; LLOMPART, M.; GARCÍA-JARES, C.;
RODRÍGUEZ, I.; GÓMEZ, M.; TERNES, T.; Water Res. 2004.
[23] CARDOSO, V. C. Estudo do Processo de Coagulação/Floculação por meio da Moringa
oleifera Lam para Obtenção de Água Potável. Universidade Estadual de Maringá – UEM,
Maringá – PR. 2007.
[24] CASTIGLIONI, S.; BAGNATI, R.; FANELLI, R.; POMATI, F.; CALAMARI, D.; ZUC-
CATO, E.; Environ. Sci. Technol. 2006.
[25] CATER, S.R.; STEFAN, M. I.; BOLTON, J.R.; SAFARZADEH-AMIRI, A. UV/H2O2
treatment of methyl terc-butyl ether in contaminated waters. Environ. Sci. Technol., v. 34, p.
659 – 662. 2000.
[26] CESCONETTO NETO, G. Decomposição de Fenol e Efluente da Indústria e Papel e
Celulose por Fotocatálise Heterogênea. Dissertação (Mestrado em Engenharia Química) –
Centro Tecnológico, Universidade Federal de Santa Catarina, Florianópolis. 2002.
[27] CHAMARRO, E., MARCO, A., ESPLUGAS, S., “Use of Fenton reagent to improve
organic chemical biodegradability”. Water Research, Vol. 35, No. 4, p. 1047-1051. 2001.
[28] CHOU, S.; HUANG, C., Application of a supported iron oxyhydroxide catalyst in oxidation
of benzoic acid by hydrogen peroxide. Chemosphere, v. 38, p. 2719-2731. 1999.
[29] CLARA, M.; STRENN, B.; GUNS, O.; MATINEZ, E.; KREUZINGER, N.; KROISS, H.;
Water Res. 2005.
[30] COLEMAN, H. M.; ROUTLEDGE, E. J.; SUMPTER, J. P.; EGGINS, B. R.; BYRNE, J. A.;
Water Res. 2004.
[31] COSTA, R.C.C., SANTOS, F. A., GAMA, L.A., SILVA, L.A., ARDISSON, J.D.A.,
YOSHIDA, M.I., CARVALHO, C.F., LAGO, R.M. Novo Sistema Fenton Baseado no
Compósito Fe0/Fe3O4 Utilizado para Oxidação de Contaminantes Orgânicos com H2O2.
Anuais do 12º Congresso Brasileiro de Catálise, p.999-1003. 2003.
[32] DANTAS, R. F.; CANTERINO, M.; MAROTTA, R.; SANS, C.; ESPLUGAS, S.;
ANDREOZZI, R.; Water Res. 2007.
[33] DI BERNARDO, L.; DANTAS, A. D. B. Métodos e Técnicas de Tratamento de Água. 2ª
ed., v. 1. São Carlos: Rima. 2005.
CHAPTER 6. REFERENCES
52 TREATMENT OF LIQUID PHARMACEUTICAL INDUSTRY EFFLUENTS BY FENTON’S PROCESSES
[34] EATON, ANDREW D., et all, Standard Methods for the examination of Water &
Wastewater – 21st edition, APHA, AWWA, WEF. 2005.
[35] ESPLUGAS S., CONTRERAS, S., OLLIS D.F. Engineering Aspects of the Integration of
chemical and Biological Oxidation: Simple Mechanistic Models of Oxidation treatment.
Journal of Environmental Engineering 130 (9): 967-974. 2004.
[36] ESPLUGAS, S.; GIMENEZ, J.; CONTRERAS, S.; PASCUAL, E.; RODRÍGUEZ, M.
Comparison of Different Advanced Oxidation Processes for Phenol Degradation. Water
Research. v.36, p.1034–1042. 2002.
[37] FENT, K., WESTON, A. e CAMINADA, D.. Ecotoxicology of human pharmaceuticals.
Aquatic toxicology. 76: 122–159. 2006.
[38] FENTON, H.J.H., On a New Reaction of Tartaric Acid (Letter to the editor), Chemical
News, 1876 apud CASTRO, J.P.; FARIA, P. Oxidação Química com Reagente Fenton–
Projeto de Investigação. Faculdade de Engenharia da Universidade do Porto - Departamento
de Engenharia Química. 2001.
[39] FENTON’S REAGENT (Iron-Catalyzed Hydrogen Peroxide). Available at:
www.H2O2.com/applications/industrialwastewater/fentonsreagent.html. Accessed at: Junho de
2012.
[40] FILHO, R., BARREIRO, J., VIEIRA, E. e CASS, B. Fármacos, ETE’s e corpos Hídricos.
Revista Ambi-Água, Taubaté, v. 2, n. 3, p. 54-61. 2007.
[41] FLAHERTY, K. A.; HUANG, C. P., Continuous Flow Applications of Fenton’s Reagent for
the Treatment of Refractory Wastewaters apud CASTRO, J.P.; FARIA, P. Oxidação Química
com Reagente Fenton – Projeto de Investigação. Faculdade de Engenharia da Universidade do
Porto – Departamento de Engenharia Química. 2001.
[42] FLONTON, V.; DELTEIL,C.; PADELLEC, Y; CAMEL, V. Removal of Sorbed Polycyclic
Aromatic Hydrocarbons from Soil, Sludge and Sediment Samples Using the Fenton’s Reagent
Process. Chemosphere, 59, p. 1427-1437. 2005.
[43] FOLIN, O.; CIOCALTEAU, V. “On tyrosine and trytophane determination in proteins”,
Journal Biological Chemical LXXIII: 627. 1927.
[44] FREIRE, R. S.; PELEGRINI, R.; KUBOTA, L. T.; DURÁN, N.; PERALTA-ZAMORA, P.;
Quim. Nova. 2000.
[45] GARRISON, A. W.; POPE, J. D.; ALLEN, F. R. Identification and Analysis of Organic
Pollutants in Water; Keith, C. H., ed.; Ann Arbor Science Publishers: Ann Arbor, cap. 30.
1976.
[46] GAGNE, F.; BLAISE, C.; ANDRE, C.; Ecotox. Environ. Safety. 2006.
[47] GÁLVEZ, J. B.; RODRÍGUEZ, S. M.; Solar detoxification, Unesco: França. 2001.
[48] GERBHARDT, W.; SCHRÖDER, H. F.; J. Chromatogr., A. 2007.

CHAPTER 6. REFERENCES
TREATMENT OF LIQUID PHARMACEUTICAL INDUSTRY EFFLUENTS BY FENTON’S PROCESSES 53
[49] GHISELE, G.; Tese de Doutorado, Universidade Estadual de Campinas, Brasil. 2006.
[50] GÖBEL A., McARDELL C.S., JOSS A., SIEGRIST H., GIGER W. Fate of sulfonamides,
macrolides, and trimethoprim in different wastewater treatment technologies. Sci. Total
Environ., v.372, p.361-371. 2007.
[51] GOLDSTEIN, S., MEYERSTEIN, D., CZPSKI, G. The Fenton Reagents. Free Radical
Biology & Medicine, v.15, p.435-445. 1993.
[52] GOLET, E. M.; ALDER, A. C.; HARTMANN, A.; TERNES, T. A.; GIGER, W.; Anal.
Chem. 2001.
[53] GOLET E.M., ALDER A.C., GIGER W. Environmental exposure and risk assessment of
fluoroquinolone antibacterial agents in wastewater and river water of the Glatt Valley
Watershed, Switzerland. Environ. Sci. Technol., v.36, p.3645-3651. 2002.
[54] GONZÁLEZ, O.; SANS, C.; ESPULGAS, S.; J. Hazard. Mater. 2007.
[55] GONZALEZ, M. C.; BRAUN, A. M. VUV Photolysis of Aqueous-Solutions of Nitrate and
Nitrite. Research on Chemical Intermadiates [S.I.[, v. 21, n. 8-9, p- 837-859. 1995.
[56] GREENBERG A.; CLESCERI L.; EATON A.; Standard Methods for the Examination of
Water and Wastewater, American Public Health Association, Washington. 1985.
[57] GUEDES, A. M. F. M. Oxidação Química com Reagente de Fenton: Aplicação às águas de
cozimento da cortiça. Tese de Mestrado, Faculdade de Engenharia da Universidade do Porto,
Novembro de 1998.
[58] HALLING-SORENSEN, B.; NIELSEN, S. N.; LANZKY, P. F.; INGERSLEV, F.;
HOLTEN-LUTZHOFT, H. C.; JORGENSEN, S. E.; Chemosphere. 1998.
[59] HEBERER, T.; J. Hydrol. 2002.
[60] HEBERER, T.; Toxicol. Lett. 2002.
[61] HEBERER, T.. Occurrence, fate, and removal of pharmaceutical residues in the aquatic
environment: a review of recent research data. Journal of Toxicology Letters. 131: 5 – 17,
2002.
[62] HERNANDO, M. D.; MEZCUA, M.; FERNÁNDEZ-ALBA, A. R.; BARCELÓ, D.; Talanta
2006.
[63] HIDAKA H., YAMADA, S., SUENAGA, S., KUBOTA, H., SERPONE, N., PELIZZETTI,
E., GRATZEL, M. Photodegradation of susfactants. V. Photocatalytic degradation of
surfactants in the presence of semiconductor particles by solar exposure. J. Photochem.
Photobiol. A: Chem., v.47, p.103-112, 1989.
[64] HIGNITE, C.; AZARNOFF, D. L.; Life Sci. 1977.
[65] HIRSCH, R.; TERNES, T.; HABERER, K.; KRATZ, K.; Sci. Total Environ. 1999.
[66] HUBER, M. M.; CANONINCA, S.; PARK, G-Y,; VON GUNTEN, U.; Environ. Sci.
Technol. 2003.

CHAPTER 6. REFERENCES
54 TREATMENT OF LIQUID PHARMACEUTICAL INDUSTRY EFFLUENTS BY FENTON’S PROCESSES
[67] HUBER, M. M.; GÖBEL, A.; JOSS, A.; HERMANN, N.; LÖFFLER, D.; MCARDELL, C.
S.; RIED, A.; SIEGRIST, H.; TERNES, T. A.; GUNTEN, U. V.; Environ. Sci. Technol. 2005.
[68] HUANG, C.P., DONG, C., TANG, Z. Advanced chemical oxidation: its present role and
potential future in hazardous waste treatment. Waste Manage., v.13, p.361- 377. 1993.
[69] IKEHATA K., NAGHASHKAR N.J., EL-DIN M.G. Degradation of aqueous
pharmaceuticals by ozonation and advanced oxidation processes: a review. Ozone: Sci.
Technol., v.28, p.353-414. 2006.
[70] INCE, N.H. “Critical” effect of hydrogen peroxide in photochemical dye degradation. Wat.
Res., v. 33, n. 4, p. 1080 – 1084. 1999.
[71] JONES, O., VOULVOULIS, N. e LESTER, J.. Potential Ecological and Human Health
Risks Associated with the Presence of Pharmaceutically Active Compounds in the Aquatic
Environment. Critical Reviews in Toxicology. 34: 335 – 350. 2004.
[72] JULIO, M.; DI BERNARDO, L.; NEVES, E.F.A. Remoção de substâncias húmicas de água
por meio do reagente de Fenton e da flotação por ar dissolvido. In: 23° Congresso Brasileiro
de Engenharia Sanitária e Ambiental, Campo Grande/MS. Anuais... ABES. 2005.
[73] KANG, Y.W.; HWANG, K.-Y. Effects of reaction conditions on the oxidation efficiency in
the Fenton process. Wat. Res., v. 34, n. 10, p. 2786 – 2790. 2000.
[74] KANIOU, S.; PITARAKIS, K.; BARLAGIANNI, K.; POULIOS, I.; Chemosphere 2005.
[75] KIM, I.; YAMASHITA, N.; TANAKA, H. Performance of UV and UV/H2O2 processes for
the removal of pharmaceuticals detected in secondary effluent of a sewage treatment plant in
Japan. Journal of Hazardous Materials, v. 166, n. 2/3, p. 1134-1140. 2009.
[76] KIM S.D., CHO J., KIM I.S., VANDERFORD B.J., SNYDER S.A. Occurrence and
removal of pharmaceuticals and endocrine disruptors in South Korean surface, drinking, and
waste waters. Water Res., v.41, p.1013-1021. 2007.
[77] KOLPIN, D. W.; FURLONG, E. T.; MEYER, M. T.; THURMAN, E. M.; ZAUGG, S. T.;
BARBER, L. B.; BUXTON, H. T.; Environ. Sci. Technol. 2002.
[78] KÜMMERER K., STEGER-HARTMANN T., MEYER M. Biodegradability of the anti-
tumour agent ifosfamide and its occurrence in hospital effluents and communal sewage. Water
Res., v.31, p.2705-2710. 1997.
[79] KUNZ, A.; PERALTA-ZAMORA, P.; MORAES, S. G.; DURÁN, N.; Quim. Nova 2002.
[80] KUO, W.G. Decolorinzing dye wastewater with Fenton’s Reagent. Water Research, vol. 26,
nº 7, p.881-886. 1992.
[81] LAM, M. W.; MABURY, S. A.; Aquat. Sci. 2005.
[82] LAMBROPOULOU, D. A.; KONSTANTINOU, I. K.; THURMAN, E. M.; FERRER, I.;
HERNANDO, M. D.; FERNÁNDEZ-ALBA, A. R.; ALBANIS, T. A.; E-Proceedings of 1st

CHAPTER 6. REFERENCES
TREATMENT OF LIQUID PHARMACEUTICAL INDUSTRY EFFLUENTS BY FENTON’S PROCESSES 55
European Conference on Environmental Applications of Advanced Oxidation Processes,
Chania, Greece. 2006.
[83] LANGE, L. C.; ALVES, J. F.; AMARAL, M. C. S.; JÚNIOR, W. R. M. Tratamento de
lixiviado de aterro sanitário por processos de oxidação avançados em pregando reagente de
Fenton. Engenharia Sanitária e Ambiental. Rio de Janeiro. 11, 2. 2006.
[84] LARSEN T.A., LIENERT J., JOSS A., SIEGRIST H. How to Avoid Pharmaceuticals in the
Aquatic Environment., J. Biotechnol., v.113, p.295-304. 2004.
[85] LATCH, D. E.; STENDER, B. L.; PACKER, J. L.; ARNOLD, W. A.; MCNEILL, K.;
Environ. Sci. Technol. 2003
[86] LEGRINI, O., OLIVEROS, E., BRAUN, A.M. Photochemical processes for water
treatment. Chem. Rev., v.93, n.2, p.671-698, 1993.
[87] LIMA, U. A.; AQUARONE, E.; BORZANI, W.; SCHMIDELL W. Biotecnologia
Industrial. V.3, 1 ed., São Paulo; Edgard Blucher, p 513-546. 2001.
[88] LINDQVIST, N.; TUHKANEN, T.; KRONBERG, L.; Water Res. 2005.
[89] MIHAYLOV, B.V., HENDRIX, J.L., NELSON, J.H. Comparative catalytic activity of
selected metal oxides and sulfides for the photo-oxidation of cyanide. J. Photochem.
Photobiol. A: Chem., v.72, p.173-177. 1993.
[90] MACHULEK, A.; MORAES, J. E. F.; GIONGO, C. V.; SILVÉRIO, C. A.; FREDRICH, L.
C.; NASCIMENTO, C. A. O.; GONZALEZ, M.C.; QUINA, F. H. Abatement of the Inhibitory
Effect of Chloride Anions on the Photo-Fenton Process. Environmental Science Technology,
41, p. 8459-8463. 2007.
[91] MACIEL, R.; SANT ANNA, G. L.; DEZOTTI, M . Phenol Removal from High Salinity
Effluents Using Fenton’s Reagent and Photo- Fenton Reactions. Chemosphere, 57. 711. 2004.
[92] MANTZAVINOS, D.; LAUER, E.; SAHIBZADA, M. LIVINGSTON, A.; METCALFE, I.;
Water Research, 34 (5) 1620-1628. 2000.
[93] MARTINEZ, E.C., LÓPEZ, G.D. Tratamiento Químico de Contaminantes Orgánicos - El
Processo Fenton. Engenharia Química (Espanha), n°.375, p.149-151. 2001.
[94] MARTINS, R. C., QUINTA-FERREIRA, R. M.; Screening of Ceria-Based and Commercial
Ceramic Catalysts for Catalytic Ozonation of Simulated Olive Mill Wastewaters Industrial
Engineering Chemistry. Res, 48, 1196–1202. 2009.
[95] MARTYANOV, I.N.; SAVINOV, E.N.; PARMON, V.N. A comparative study of efficiency
of photooxidation of organic contaminants in water solutions in various phtochemical and
photocatalytic systems. 1. Phenol photooxidation promoted by hydrogen peroxide in a flow
reactor, Journal of Photochemistry and Photobiology A: Chemistry. v.107, p.227-231. 1997.

CHAPTER 6. REFERENCES
56 TREATMENT OF LIQUID PHARMACEUTICAL INDUSTRY EFFLUENTS BY FENTON’S PROCESSES
[96] MAURI A. R.; Peroxide Promoted Catalytic Wet Air Oxidation of Phenolic Aqueous
Solutions using Activated Carbon as Catalyst, PhD thesis, Department D’Enginyeria Química.
2007.
[97] METCALF, EDDY, INC. Wastewater engineering treatment and reuse, Fourth Edition,
McGrawHill, New York. 2003.
[98] MIHAYLOV, B.V., HENDRIX, J.L., NELSON, J.H. Comparative catalytic activity of
selected metal oxides and sulfides for the photo-oxidation of cyanide. J. Photochem.
Photobiol. A:Chem., Vol.72, p.173-177. 1993.
[99] MONTALTI, M.; MUROV, S. Handbook of photochemistry. Taylor & Francis. 2006.
[100] NAKADA N., TANISHIMA T., SHINOHARA H., KIRI K., TAKADA H. Pharmaceutical
chemicals and endocrine disrupters in municipal wastewater in Tokio and their removal during
activated sludge treatment. Water Res. v.40, p.3297-3303. 2006.
[101] NEYENS, E., BAEYENS, J., A review of classic Fenton’s peroxidation as an advanced
oxidation technique. Journal of Hazardous Materials, Vol. B98, p. 33-50. 2003.
[102] NOGUEIRA, R. F. P. et al. Fundamentos e aplicações ambientais dos processos Fenton e
Foto-Fenton. Química Nova, v. 30, n. 2, p. 400-408. 2007.
[103] NOGUEIRA, R. F. P.; GUIMARÃES, J. R.; Water Res. 2000.
[104] PACKER, J. L.; WERNER, J. J.; LATCH, D. E.; MCNEILL, K.; ARNOLD, W. A.; Aquat.
Sci. 2003.
[105] PEÑARROYA, J. Coupled photochemical-biological system to treat biorecalcitrant
wastewaters. Universitat de Barcelona, 2007.
[106] PEREIRA, V. J.; WEINBERG, H. S.; LINDEN, K. G.; SINGER, P. C.; Environ. Sci.
Technol. 2007.
[107] PÉREZ-ESTRADA, L. A.; MALATO, S.; GERNJAK, W.; AGÜERA, A.; THURMAN, E.
M.; FERRER, I.; FÉRNANDEZ-ALBA, A. R.; Environ. Sci. Technol. 2005.
[108] PÉREZ-ESTRADA, L. A.; MALATO, S.; AGÜERA, A.; FÉRNANDEZ-ALBA, A. R.; E-
Proceedings of 1st European Conference on Environmental Applications of Advanced
Oxidation Processes, Chania, Greece, 2006.
[109] PÉREZ, M., TORRADES, F., DOMÉNECH, X., PERAL, J., Fenton and Photo-Fenton
Oxidation of Textile Effluents. Water Research, v.36, p.2703-2710, 2002.
[110] PIGNATELLO, J. J.; Environ. Sci. Technol. 1992.
[111] RADJENOVIC, J.; PETROVIC, M.; BARCELÓ, D.; Anal. Bional. Chem. 2007.
[112] RAMIREZ J.H..; COSTA C. A.; MADEIRA L. M.; MATA G.; VICENTE M. A.; ROJAS-
CERVANTES M.L.; LÓPEZ-PEINADO A. J.; MARTÍN-ARANDA R.M.; Fenton like
oxidation for Orange II solutions using heterogeneous catalyst based on saponite clay. Applied
Catalysis B: Environmental, 71, 44-56. 2006.

CHAPTER 6. REFERENCES
TREATMENT OF LIQUID PHARMACEUTICAL INDUSTRY EFFLUENTS BY FENTON’S PROCESSES 57
[113] RAMIREZ J.H.; LAMPINEN M.; VICENTE M. A.; COSTA C. A.; MADEIRA L. M.
Experimental Design to Optimize the Oxidation of Orange II Dye Solution using a Clay-based
Fenton-like Catalyst, Industrial and Engineering Chemistry Research, 47, 284-294. 2008.
[114] RAVINA, M.; CAMPANELLA, L.; KIWI, J.; Water Res. 2002.
[115] REYES, C.; FERNÁNDEZ, J.; FREER, J.; MONDACA, M. A.; ZAROR, C.; MALATO, S.;
MANSILLA, H. D.; J. Photochem. Photobiol. 2006.
[116] RICHARDSON, M. L.; BOWRON, J. M.; J. Pharm. Pharmacol. 1985.
[117] RITCHER, C. A., AZEVEDO NETTO, J. M. Tratamento de água – tecnologia atualizada,
São Paulo: Editora Edgard Blücher Ltda. 1991.
[118] SAFARZADEH-AMIRI, A.; BOLTON, J. R.; CATER, S. R.; Solar Energy. 1996.
[119] SANTIAGO, M. Síntese, caracterização e estudos cinéticos da isomerização de compostos
de Ru (II) contendo ligantes (X-bipy). Universidade Federal de São Carlos. 2004.
[120] SANTOS, E. Síntese de monómeros derivatizados com 3-aminopiridina contendo complexos
polipiridínicos de Ru (II) do tipo cis-[RuCl2(α-diimina)] onde α-diimina:2,2’-bioiridina e 1,10-
fenantrolina e 5-Cl-1,10- fenantrolina. Universidade de São Paulo. 2009.
[121] SANTOS, J. L.; APARICIO, I.; ALONSO, E.; CALLEJÓN, M.; Anal. Chim. Acta. 2005,
550, 116.
[122] SHEMER, H.; KUNUKCU, Y. K.; LINDEN, K. G.; Chemosphere. 2006.
[123] SILVA, M. R. A.; TROVÓ, A. G.; NOGUEIRA, R. F. P.; J. Photochem. Photobiol. 2007.
[124] SILVA, A. M. T; CASTELO-BRANCO I. M.; QUINTA-FERREIRA R. M.; LEVEC J.;
Catalytic studies in wet oxidation of effluents from formaldheyde industry, Chemical
Engineering Science, 58, 963-970. 2003.
[125] SILVA, A. M. T.; Treatment of Liquid pollutants by Catalytic wet Oxidation, Department of
Chemical Engineering, Faculty of Sciences and Technology University of Coimbra. 2004.
[126] STUMPF, M.; TERNES, T. A.; WILKEN, R.-D.; RODRIGUES, S. V.; BAUMANN, W.;
Sci. Total Environ. 1999.
[127] TEIXEIRA, C.P.A.B.; JARDIM, W.F. Destruição de compostos orgânicos potencialmente
tóxicos utilizando fotocatálise heterogénea. Campinas, 1997, p. 88, Faculdade de Engenharia
Civil, UNICAMP. 1997.
[128] TERNES, T. A.; Water Res. 1998.
[129] TERNES, T. A.; STUMPF, M.; MUELLER, J.; HABERER, K.; WILKEN, R.-D.; SERVOS,
M.; Sci. Total Environ. 1999.
[130] TERNES, T. A.; STÜBER, J.; HERRMANN, N.; MCDOWELL, D.; RIED, A.; KAMP-
MANN, M.; TEISER, B.; Water Res. 2003.
[131] TROVARELLI, A.; Catalysis by Ceria and Related Materials; Imperial College Press:
London. 2002.
CHAPTER 6. REFERENCES
58 TREATMENT OF LIQUID PHARMACEUTICAL INDUSTRY EFFLUENTS BY FENTON’S PROCESSES
[132] TROVÓ, A. G.; MELO, S. A. S.; NOGUEIRA, R. F. P.; J. Photochem.-Photobiol. 2008.
[133] VELLA, P.A.; MUNDER, J.A. Emerging technologies in hazardous waste management III;
Tedder, D. W.; Pohland, F. G., eds.; American Chemical Society: Washington, cap. 5. 1993.
[134] VOGNA, D.; MAROTTA, R.; ANDREOZZI, R.; NAPOLITANO, A.; D’ISCHIA, M.;
Chemosphere. 2004.
[135] VOGNA, D.; MAROTTA, R.; NAPOLITANO, A.; ANDREOZZI, R.; D ISCHIA, M.;
Water Res. 2004.
[136] WATTS, R. J.; HALLER, D. R.; JONES, A. P.; TELL, A. L.; J. HAZARD. MATER. 2000.
[137] ZEPP, R. G.; FAUST, B. C.; HOIGNE, J.; Environ. Sci. Technol. 1992.
[138] ZHOU, D.; WU, F.; DENG, N.; Chemosphere. 2004.
[139] ZWIENER, C.; FRIMMEL, F. H.; Water Res. 2000.