travel patterns of the low income
TRANSCRIPT
TRAVEL PATTERNS OF
THE LOW INCOME
Apara BanerjeeStacey Bricka, Ph.D.MacroSys, LLC
BELOW POVERTY
ABOVE POVERTY
2018 NHTS WorkshopWashington D.C.August 08, 2018

CONTENTS
Background
Classification of National Household Travel Survey households into Below and Above Poverty thresholds
Average Travel Statistics
Modeshare pattern in relation to different aspects
Conclusion

BACKGROUND
HOUSING EXPENDITURE
TRANSPORTATION
FOOD
Source: Consumer Expenditures–2016 Report. Image: Toonclips.com
• Transport constitutes 16% of an average household expenditure (Consumer Expenditures–2016, Report).
• A large part of it can be linked to the high vehicle ownership cost (Miller, 2018).
• Increasing transportation cost hinders mobility for low income population.
• 12.7 % of the U.S. population resides below poverty level (Census Bureau’s 2016 Estimates)

PREVIOUS STUDIES
Mobility challenges faced by low-income population have beenmostly analyzed from the perspective of
Access to employment opportunities due to spatial disparities.(Rogalsky et al., 2010; Blumenberg et al., 1998)
Specific regions like urban or suburban areas or a specific city.(Hwang et al., 2017; Harrington et al., 2006.)

PURPOSE OF THIS STUDY
To explore the differences in travel behavior between Households Below Poverty (HBP) and Households Above Poverty (HAP) at the National level with focus on:
1. Daily Trip Rates and Distance Travelled
1. Mode of travel in relation to Vehicle ownership Pattern, Trip Purpose and Location.
The study uses the most recent National Household Travel Survey (NHTS) data of 2017 along with data from 2009 for trends.

Federal Poverty Guideline for 2017 and 2009
National Household Travel Survey : Household Size and Income
HHSIZE =1 HHFAMINC CODE: 02 = "$10,000 to $14,999"
If hhsize=1 and (HHFAMINC>'-7'and HHFAMINC<'03') then Flag as Household Below Poverty
CLASSIFICATION OF HOUSEHOLDS
2017 FEDERAL POVERTY GUIDELINE
Persons in Family/Household = 1 Poverty Guideline = $12,060
NHTS

IS TRAVEL A FINANCIAL BURDEN?
According to 2017 NHTS,
• 60% of the HBP agreed that Travel is a financial Burden
• 14% of the HBP disagreed, while for HAP the percentage who disagreed was almost 30%.
Source: FHWA NHTS 2017. Image: Canstockphoto.com

AVERAGE TRAVEL STATISTICS, 2017 NHTS
Above Poverty
Daily Trip Rate for members of HAP –3.5
Average Person Trip Length for trips made by members of HAP – 11.3 miles
Below Poverty
Daily Trip Rate for members of HBP – 2.9
Average Person Trip Length for trips made by members of HBP – 7.2 miles
Source: FHWA NHTS, 2017. Image: 123rf.com

AVERAGE PERSON TRIP LENGTH BY TRIP PURPOSE, 2017 NHTS
13
7.3
10
13.9
11.5
5.5
10.2
9.9
Social/Recreational
Shopping/Errands
Medical/Dentalservices
Work
Below poverty
Above Poverty
Trip miles (Mean)Source: FHWA NHTS, 2017.

According to 2017 NHTS,• HBP, tend to walk, bike or
avail public transit for 21% of their trips.
• 13% of the HAP trips are by walk, bike or public transit.
Percentage of Trips
MODE SHARE (2009 - 2017 NHTS)
Source: FHWA NHTS, 2009 & 2017.
0% 10% 20% 30% 40% 50% 60% 70% 80% 90%
Above Poverty
Below poverty
Above Poverty
Below poverty
Above Poverty
Below poverty
Above Poverty
Below poverty
Above Poverty
Below poverty
Oth
ers
Tra
nsi
tPO
VBik
eW
alk
2009 2017
Others

26%
4%
47%
29%
19%
41%
8%
25%
0.4% 1%
27%
4%
45%
31%
19%
37%
9%
27%
0.4% 2%
Belowpoverty
AbovePoverty
Belowpoverty
AbovePoverty
Belowpoverty
AbovePoverty
Belowpoverty
AbovePoverty
Belowpoverty
AbovePoverty
No Vehicle Single Vehicle 2 Vehicles 3-5 Vehicles More than 5Vehicles
2009
2017
Perc
enta
ge o
f H
ouse
hold
s
In 2017, 27% of HBP have no vehicles contrary to only 4% of HAP.
HOUSEHOLD OWNED VEHICLES (2009 - 2017 NHTS)
Source: FHWA NHTS, 2009 & 2017.

0-2yrs7%
3-5yrs11%
6-9yrs15%
10+ years67%
Below Poverty
0-2yrs14%
3-5yrs20%
6-9yrs20%
10+ years46%
Above Poverty
VEHICLE AGE, NHTS 2017
Source: FHWA NHTS, 2017.
• Mean Vehicle age for HBP was 13 years while for HAP it was 10 years
• 7% of the vehicles owned by HBP were found to be between 0-2 years old while 14% of the vehicles owned by HAP were between 0-2 years old vehicles

52%
33%
9%6%
NoVehicle
SingleVehicle
2Vehicles
3-5Vehicles
Morethan 5
Vehicles
16%
31% 33%
20%
1%
NoVehicle
SingleVehicle
2Vehicles
3-5Vehicles
Morethan 5
Vehicles
Perc
enta
ge o
f Trips
(done b
y
walk
ing, bik
ing a
nd t
ransi
t) Above PovertyBelow Poverty
HOUSEHOLD VEHICLES AND MODE CHOICE, 2017 NHTS
Among the total walk, bike and public transit trips undertaken by
• HBP, 52% were done by people belonging to no vehicle households.• HAP, 33% were done by members belonging to households with 2
vehicles.
Source: FHWA NHTS, 2017.
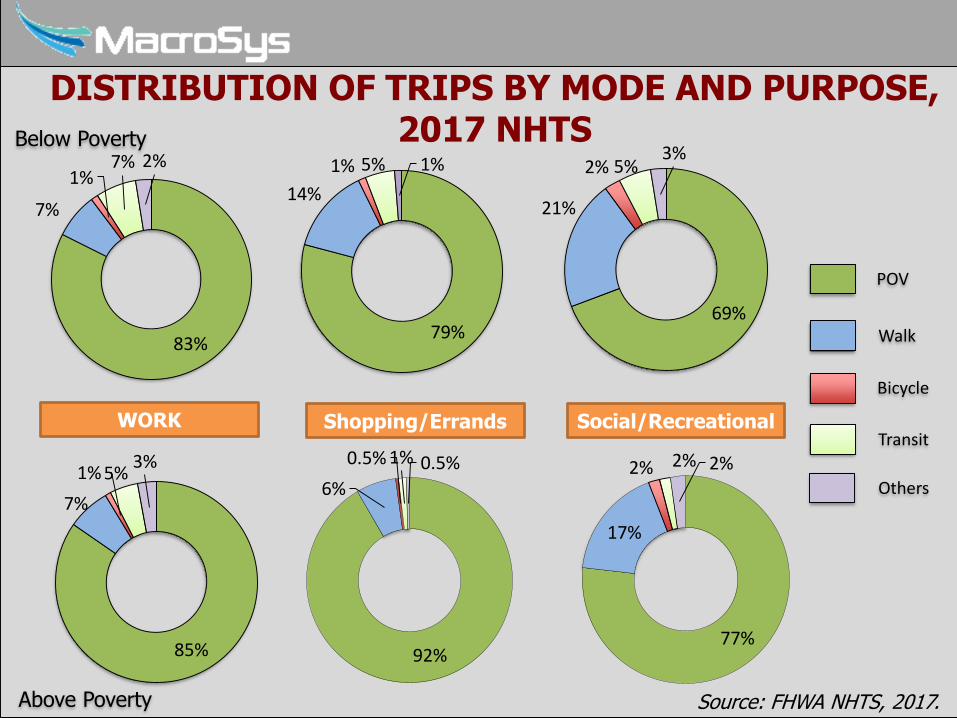
79%
14%
1% 5% 1%
69%
21%
2% 5%3%
85%
7%
1% 5%3%
POV
Walk
Bicycle
Transit
Others
Below Poverty
Above Poverty
DISTRIBUTION OF TRIPS BY MODE AND PURPOSE, 2017 NHTS
Source: FHWA NHTS, 2017.
WORK Shopping/Errands Social/Recreational
77%
17%
2% 2% 2%
83%
7%
1%7% 2%
92%
6%
0.5% 1% 0.5%

26%
16% 15%
8%
12%
7%10%
6%
1% 1% 1% 1% 2% 1% 1% 1%
13%
6% 5%
1%4%
1% 0.4% 0.1%
Belowpoverty
AbovePoverty
Belowpoverty
AbovePoverty
Belowpoverty
AbovePoverty
Belowpoverty
AbovePoverty
County in MSA with >=1M and Heavy Rail
County in MSA with >=1M and no Heavy Rail
County in MSA with < 1M County not in MSA
Perc
enta
ge
of
Trips
Walk
Bicycle
Transit
WALKING, BIKING OR TRANSIT TRIPS BY DIFFERENT AREAS, 2017 NHTS
For a county in MSA with more than 1million population and connected by heavy rail,
• HBP complete 40% of their total trips by walking, biking or using public transport.
• HAP level complete 23% of their trips by walk, bike or public transit.
Source: FHWA NHTS, 2017.

POV TRIPS BY DIFFERENT AREAS, 2017 NHTS
• In MSA’s with population more than 1 million and connected by Heavy Rail, HAP use POV for almost 20% more trips than HBP.
• For counties not in MSA, the percentage of POV trips for HAP and HBP are comparable.
Perc
enta
ge o
f Tr
ips
56%
74% 74%
87%77%
89%85%
90%
Belowpoverty
AbovePoverty
Belowpoverty
AbovePoverty
Belowpoverty
AbovePoverty
Belowpoverty
AbovePoverty
County in MSA with >=1M and Heavy Rail
County in MSA with >=1M and no Heavy Rail
County in MSA with < 1M County not in MSA
Source: FHWA NHTS, 2017.

CONCLUSION
According to 2017 NHTS,
Walk, bike or public transit usage is found to be higher for trips undertaken by HBP than their richer counter parts.
27% of the HBP are no household vehicles.
Alternative transportation (walk, bike, public transit) usage is more for social-recreational or shopping trips in case of HBP.
In large urban areas with rail, HBP use public transit for higher percentage of trips than HAP. But POV still remains the dominant mode.
WAY FORWARD: Further research in these areas will lead to more comprehensive understanding.

REFERENCE
1. Pucher, J. and Renne, J.L., 2003. Socioeconomics of Urban Travel: Evidence from the 2001 NHTS. Transportation Quarterly, 57(3), pp.49-77.
2. Hwang, H.L., Reuscher, T. and Lim, H., 2017. Travel Patterns and Characteristics of LowIncome Subpopulation in New York State. Final Technical Memorandum for Task 14, Oak Ridge National Laboratory.
3. Giuliano, G. and Narayan, D., 2003. Another look at travel patterns and urban form: the US and Great Britain. Urban studies, 40(11), pp.2295-2312.
4. Harrington, B., Kaufman, M., and Rick Evans, R., 2006. Mobility Needs of Low Income and Minority Households Research Study: Colorado. UrbanTransConsultants, Inc. and Colorado Department of Transportation
5. Rogalsky, J., 2010. The working poor and what GIS reveals about the possibilities of public transit. Journal of Transport Geography, 18(2), pp.226-237.
6. Ong, P. and Blumenberg, E., 1998. Job access, commute and travel burden among welfare recipients. Urban Studies, 35(1), pp.77-93.
7. Miller, G.E. 2018, April 1. Transportation Costs: The Second Highest Expense Category is Clearly the Most Ridiculous.
8. Bureau of Labor Statistics , 2017. Consumer Expenditures-2016, USDL-17-1175.U.S. Department of Labor, Washington D.C., USA.

THANK YOU