travel demand analysis for the woodhavven road … · travel demand analysis for the woodhaven road...
TRANSCRIPT

TRAVEL DEMAND ANALYSIS FOR THE
WOODHAvVEN ROAD EXTENSION


TRAVEL DEMAND ANALYSIS FOR THE
WOODHAVEN ROAD EXTENSION
PREPARED FOR THE PENNSYLVANIA DEPARTMENT OF TRANSPORTATION
APRIL 1989
DELAWARE VALLEY REGIONAL PLANNING COMMISSION THE BOURSE BUILDING
21 SOUTH 5TH STREET, PHILADELPHIA, PA 19106

This report, prepared by the Delaware Valley Regional Planning Commission, was financed in part by the Federal Highway Administration and the Pennsylvania Department of Transportation. DVRPC, however, is solely responsible for its findings and conclusions, which may not represent the official view or pOlicies of the funding agencies.
Created in 1965, the Delaware Valley Regional Planning Commission (DVRPC) is an interstate, intercounty and intercity agency which provides continuing, comprehensive and coordinated planning for the orderly growth and development of the Delaware Valley region. The region includes Bucks, Chester, Delaware, and Montgomery counties as well as the City of Philadelphia in Pennsylvania; and Burlington, Camden, Gloucester, and Mercer counties in New Jersey_ The Commission is an advisory agency which divides its planning and service functions among the Office of the Executive Director, the Office of Public Affairs, and four line Divisions: Transportation Planning, Regional Information Services Center, Strategic Planning, and Finance and Administration. DVRPC's mission for the 1980s is to emphasize technical assistance 21!Q services 81!d to conduct high priority studies for member state and local governments, while determining and meeting the needs of the private sector.
The DVRPC logo is adapted from the official seal of the Commission and is designed as a stylized image of the Delaware Valley. The outer ring symbolizes the region as a whole while the diagonal bar signifies the Delaware River flowing through it. The two adjoining crescents represent the Commonwealth of Pennsylvania and the State of New Jersey. The logo combines these elements to depict the areas served by DVRPC.

DELAWARE VALLEY REGIONAL PLANNING COMMISSION
Publication Abstract
TITLE
TRAVEL DEMAND ANALYSIS FOR THE WOODHAVEN ROAD EXTENSION
Geographic Area Covered:
Date Published:
Publication No.
1989
89009
Northeast Philadelphia and Lower Moreland, Montgomery County in Pennsylvania
Key Words: Highway Network, Traffic Simulation, Traffic Demand, Forecasting, Alternative Analysis, Volume, Peak Hour, Design Factors, Land Use, Turning Movements, Air Quality, Vehicle Miles of Travel
ABSTRACT
The report documents the findings of a traffic demand analysis focusing on four highway network alternatives for the proposed extension of Woodhaven Road in Philadelphia and Montgomery counties. Current traffic counts, average daily traffic, AM and PM peak hour volumes for the years 1995 and 2015 are included. Design factors and air quality, vehicle miles of travel (VMT) , and average speed summaries are also reported.
for More In.foTtnlltiOn. COn.tllct:
~t~ ~W Delaware Valley Regional Planning Commission
Regional Information Services Center The Bourse Building 21 South 5th Street
Philadelphia Pa. 19106 (215) 592-1800


DEL;\'NAcRE VA .. LLEY f-tEGIONAL PLANNING COMIV[ISSI01'~
The Boursp Building. 21 Soulh 5th St.. Pl1ilnc!p!phia. PA 19106 (215) 592-1800
Mr .. Harvey l-Iaack, P. E. Deputy Secretary for Planning Pennsylvania Department of Transportation Transportation & Safety Bu.ilding Harrisburg, Pennsylvania 17120
Dear Mr. Haack:
May 1, 1989
Please find enclosed two copies of the report "Travel Demand Analysis for the \Voodhaven Road Extension" prepared by DVRPC in response to a request by the Pennsylvania Department of Transportation.
Also attached is a package of current traffic counts collected by DVRPC personnel and containing 24-hour ATR results, peak hour turning movements at selected intersections, and traffic classifications that are part of the project and were requested by your District 6-0,
\Ve hope that the material enclosed with this submission will help you ii1 the preparation of design location and EIS studies of the much needed 'Woodhaven Road Extension. Let us know if you have any questions.
\Ve also appreciate and thank you for the opportunity given to DVRPC in helping the Department.
JBC/MS:EP Attachments
Cc. Steve Lester, P. E., District 6-0
Very truly yours, .- : I ' (.. ;' /
.... ill: I~ ,". ",LLl> . (I ,/! ~ ';~\
.lotnB', Claffey ':~ ! ••
.Director of Transportatlon Planning


TABLE OF CONTENTS
Page No.
EXECUTIVE SUMMARY. . . . . . . . . . . . . . . . . . . . . . . . . . . . . . . . . . . . . . . . . . .. 1
I. INTRODUCTION. . . . . . . . . . . . . . . . . . . . . . . . . . . . . . . . . . . . . . . . . . . .. 3
II. ASSUMPTIONS AND METHODOLOGY . . . . . . . . . . . . . . . . . . . . . . . . . . .. 5
Land Use Assumptions . . . . . . . . . . . . . . . . . . . . . . . . . . . . . . . . . . . . . . .. 5 Travel Simulation Methodology .................................. 6 Focused Year 2015 Trip Table Preparation ......................... 6 The Focused Highway Assignment ............................... 7
III. ALTERNATIVE DESCRIPTIONS. . . . . . . . . . . . . . . . . . . . . . . . . . . . . . . . .. 9
IV. TRAFFIC ANALYSIS ........... . . . . . . . . . . . . . . . . . . . . . . . . . . . . .. 11
Current Traffic ............................................. 11 Future Traffic .............................................. 13
V. DESIGN FACTORS AND AIR QUALITY SUMMARIES . . . . . . . . . . . . . . . .. 29
VI. FINDINGS. . . . . . . . . . . . . . . . . . . . . . . . . . . . . . . . . . . . . . . . . . . . . . .. 33

Figure 1. Figure 2. Figure 3. Figure 4. Figure 5. Figure 6. Figure 7. Figure 8. Figure 9. Figure 10. Figure 11. Figure 12. Figure 13. Figure 14. Figure 15. Figure 16.
Table 1. Table 2. Table 3.
liST OF FIGURES
Page No. Study Area . . . . . . . . . . . . . . . . . . . . . . . . . . . . . . . . . . . . . . . . . . .. 4 Current Average Daily Traffic ............................... 12 1995 Average Daily Traffic - Alt. 1 ........................... 14 1995 AM/PM Peak Hour Traffic - Alt. 1 ....................... 15 1995 Average Daily Traffic - Alt. 2 ........................... 16 1995 AM /PM Peak Hour Traffic - Alt. 2 .... " .................. 17 1995 Average Daily Traffic - Alt. 3 ........................... 18 1995 AM/PM Peak Hour Traffic - Alt. 3 ....................... 19 2015 Average Daily Traffic - Alt. 1 ....... " ................... 20 2015 AM/PM Peak Hour Traffic - Alt. 1 ....................... 21 2015 Average Daily Traffic - Alt. 2 ........................... 22 2015 AM/PM Peak Hour Traffic - Alt. 2 ....................... 23 2015 Average Daily Traffic - Alt. 3 ........................... 24 2015 AM/PM Peak Hour Traffic - Alt. 3 ....................... 25 2015 Average Daily Traffic - Alt. 4 ........................... 26 2015 AM/PM Peak Hour Traffic - Alt. 4 ....................... 27
liST OF TABLES
Page No.
Year 2015 Design Factors ................................. 30 Pollutant Emission, VMT, Speed Summaries ................... 31 Average Daily Traffic Impacts by Proposed Alternatives ........... 34

EXECUTIVE SUMMARY
The "Travel Demand Analysis for the Woodhaven Road Extension" was prepared at the request of the Pennsylvania Department of Transportation.
In the northeast section of Philadelphia, Woodhaven Road currently ends at Evans Street, after connecting 1-95 and US 1. At that point, traffic is channeled into 8yberry Road to continue westward. 8yberry Road currently carries more than 30,000 vehicles per day at this location. Major proposed land use developments in the area prompted the Department to request the Delaware Valley Regional Planning Commission (DVRPC) to assess traffic impacts as a result of a "Do-Nothing" approach and three different Woodhaven Road Extension Alternatives.
The area under analysis is bounded by US 1 to the east and Pine Road to the far west, while Street and Red Lion Roads respectively form the northern and southern limits.
This study reports the results of a traffic demand analysis of the four alternatives and of morning and evening peak hour turning movements. Design factors and Air Quality summaries are also included.
Through a land use analysis and a focused travel simulation process, described in more detail in the report, traffic projections were derived for the Years 1995 and 2015.
The "Do-Nothing" scheme (Alternative 1) is representative of existing physical and operational features with the exception of a new bridge on 8yberry Road over the Conrail railroad tracks. The other scenarios for the extension of Woodhaven Road include a 4-lane expressway to Philmont Avenue (Alternative 2), a 4-lane arterial to 8ustleton Avenue (Alternative 3) and a 4-lane arterial to 8yberry Road (Alternative 4).
The major findings of this study can be summarized as follows:
a. Alternative 1. In view of new developments and land use changes, the existing network will not be able to handle projected traffic. Current counts show that today's levels of congestion and delays are not up to minimum standards. Increases in traffic by as much as 42 percent, by the Year 2015, on major routes of the area under study will have a detrimental effect on the welfare and economic growth of the area served by 8yberry Road. This alternative is considered impractical and unacceptable.
b. Alternative 2. This alternative has brought to light the significance' of the proposed extension of Woodhaven Road with respect to the present functions and operations of 8yberry Road. Traffic, by the Year 2015, will be diverted from 8yberry Road to the new facility, by as much as 77 percent of the projected trafftc under Alternative 1. It has been estimated that in the future, volumes of traffic using the extension will range from 31,000 to 44,000 vehicles daily. At its point of today's highest congestion 8yberry road will serve a volume of about 9,000 local
1

drivers a day in the Year 2015.
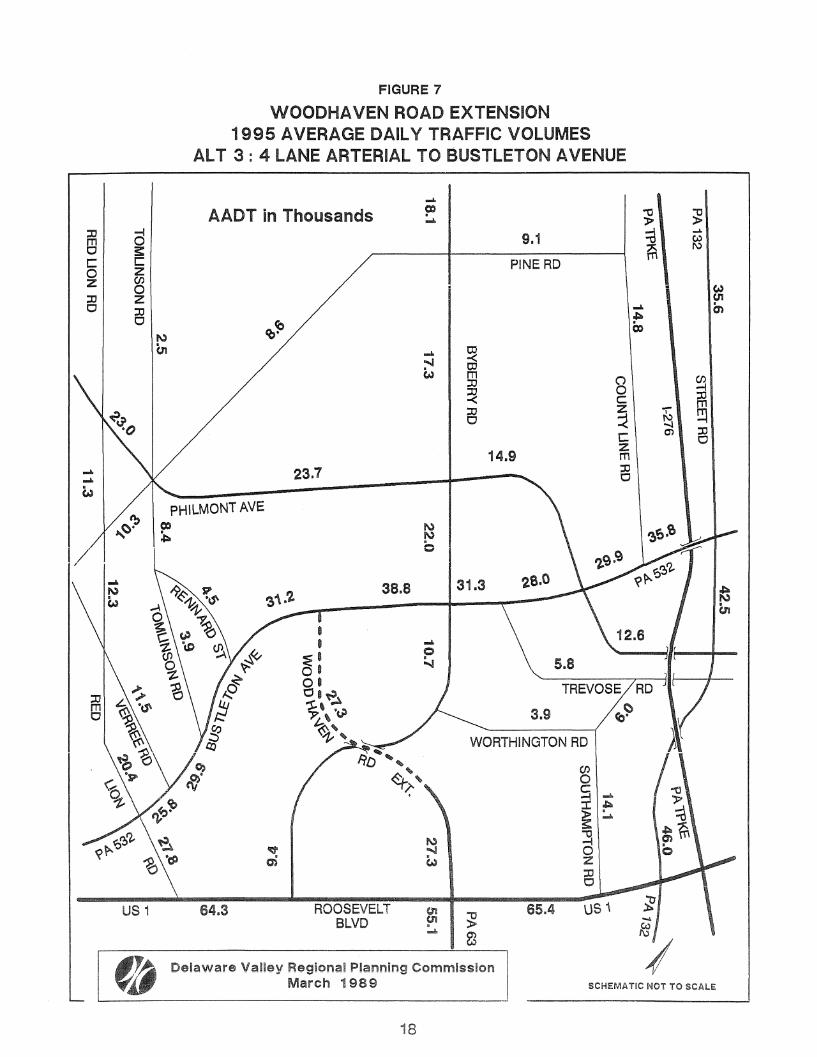
c. Alternative 3. With the extension terminating at Bustleton Avenue, it is anticipated that the most critical segment of road, in this alternative, will be at the approach of Bustleton Avenue south of Byberry Road. At this location, a volume of over 40,000 vehicles per day has been projected. Another major impact of traffic will occur on Byberry Road, between Bustleton and Philmont Avenues, with an estimated volume of 25,200 vehicles per day (three times the magnitude projected in Alternative 2.) In the future, travel on the only link of the extension that connects Bustleton Avenue with Route US 1 will reach approximately 32,000 vehicles per day.
d. Alternative 4. The evaluation of this scheme, an extension of Woodhaven Road to Byberry Road, shows no detrimental effect on any of the intersecting streets. A moderate increase of approximately 4 percent over the Do-Nothing Alternative for most of the highways and roads adjacent to the extension is an indication of a more effective travel pattern distribution than the ones observed in the previous alternatives. Future volumes on the extension are estimated between 15,000 and 36,000 vehicles daily.
The demand for Byberry Road will be reduced to an estimated 11,000 vehicles while other parallel roads within the corridor show lower projected traffic than in any of the other cases considered.
2

I. INTRODUCTION
In recent years the Delaware Valley region has experienced significant changes in population, land use development and employment distribution. The development of industrial parks, office centers, sizeable regional malls and new residential expansions outside the core area of the cities have brought increases in jobs and population in the suburbs. The northeast portion of Philadelphia, along with Eastern Montgomery and Lower Bucks counties, has not been spared by this new trend. Furthermore, auto ownership has increased everywhere. The resulting effect of all these changes has become more evident by the higher degree of congestion existing on current highways and roads.
Some of the principal arterial, already utilized to the limit, can no longer operate at acceptable levels of service when changes in existing land uses occur. Such is the case of Byberry Road in the northeast section of Philadelphia. To make things worse, Woodhaven Road, a four to six lane expressway connecting 1-95 and US 1, ends abruptly at Evans Street, channelling most of its traffic into the residential Byberry Road. The resulting effect for the latter is a situation of continued long delays, snail's pace travel, and higher congestion for all drivers throughout the entire day.
It is on these premises that the Pennsylvania Department of Transportation (PA DOT) has requested the Delaware Valley Regional Planning Commission (DVRPC) to provide the Department with traffic estimates on selected roadways in the Byberry Road corridor. This area of coverage is approximately limited by Red Lion and Street (PA 132) roads at the south and north boundaries and by US 1 and Pine Road at the east and west limits, respectively. A "Do-Nothing" Alternative and three network alternatives formed the •. basis for evaluating traffic impacts caused by a proposed extension of Woodhaven Road to the west of US 1 in the corridor presently served by Byberry Road.
This report has been prepared in response to PA DOT's request. It provides traffic projections for the years 1995 and 2015, a.a. and p.m. peak hour turning movements at selected intersections for the same years, design factors, summaries of Vehicle Miles of Travel (VMT), average speed, and pollutant emissions for the four alternatives under study. Current average daily traffic counts are also included in order to establish a comparative base year of traffic volumes. Section II of the report describes briefly the assumptions and methodology used in the analysis. A description of the four alternatives under study is contained in Section III, while current and prOjected traffic volumes are presented in Section IV. The resulting design factors and summaries for the
. environmental analysis are contained in Section V. Finally, the last section include a summary of findings on the four alternatives.
The location map shown in Figure 1 indicates the extent of the highway network that comprises the Byberry Road corridor and the study area.
3

FIGURE 1
WOODHAVEN ROAD EXTENSION
STUDY AREA
STUDY AREA
Delaware Valley Regional Planning Commission March 1989
4
O~ ____ ~~~~~2 MILES l.

II. ASSUMPTIONS AND METHODOLOGY
Land use assumptions and a calibrated travel simulation methodology are key elements of a sound and reliable traffic forecasting process. The assumptions and simulation methodology used to determine the traffic impacts on the basis of four highway alternatives are briefly described below.
Land Use Assumptions
In order to ensure a realistic traffic simulation for future years, a detailed land use analysis was conducted. The Philadelphia, Bucks and Montgomery county planning commissions were contacted regarding major new developments which may have an impact on traffic volumes within the study area. A copy of a "Woodhaven Expressway Access Study (February 1988)" prepared by a PA DOT consultant was also reviewed and taken into consideration. The anticipated developments listed in these reliable sources were evaluated and compared to the land use developments included in the Year 2010 demographic and employment data adopted by the DVRPC Board in 1987. From this review, DVRPC staff has identified the following major developments which were added to the Year 2010 Plan:
o A development of 192 units, under construction, near the intersection of Byberry Road with the Septa Regional Rail Line (Coresel Station Condominiums)
o The Franklin Park development located on the 288 acre former site of the Liberty Bell Race Track. The development currently under construction is proposed to include a 250 room hotel, 195,000 square feet of office space, a 1.8 million square foot mall and 620,000 square feet of other retail space.
o The change in land use of the Byberry State Hospital, scheduled for closing within two years. The property, consisting of 245 acres, is zoned residential, and although no final plans have been identified as yet, the dedication of 85 acres to a park, with the remaining 160 acres devoted to semi - and fully -detached housing (10 to 14 units per acres), has been considered a reasonable assumption.
o A new residential development of 104 townhouses on Bustleton Pike north of the Pennsylvania Turnpike.
o The construction of four new hotels, with approximately 100 rooms each, in the southwest quadrant of the intersection of Route US 1 with Street Road CPA 132}.
o The development of a parcel of 88 acres along the south side of Street Road, between US 1 and Mechanicsville Road, recentiy rezoned for a high-tech office park.
5

o A recently proposed development of 250,000 square feet of retail space at the corner of County Line Road and Davisville Road.
As stated above, these developments were considered in excess of the Year 2010 Plan for the study area. For the purpose of simulating the Year 2015 traffic, the original Year 2000 Trip Table was surcharged by adding the travel from these land uses to each of the appropriate zones in which they are located. This total surcharge was estimated at approximately 95,000 daily vehicle trips generated during an average weekday.
Travel Simulation Methodology
The focused approach was utilized to estimate traffic volumes for the four network alternatives. All alternatives were simulated on the combined basis of refined Year 2010 demographic and employment estimates adopted by DVRPC and added trips generated from the surcharge of the above mentioned developments to the base year vehicle trip loading matrix. The next step in the focused simulation process involved adding missing local streets to the regional network representing the revised Year 2000 Plan for Highways. Furthermore, simulation zones inside the study area were subdivided so that traffic from existing and proposed developments could be loaded onto the network in a more realistic manner. This process resulted in a traffic assignment model capable of estimating accurate traffic volumes for most streets and intersections within the study area. This focused network explicitly included the impact of all highway facilities outside of the detailed study area on projected volumes. These facilities included all of the proposed improvements reported in the Year 2000 Transportation Plan, such as the widening of the Pennsylvania Turnpike, reconstruction of major expressways, and rehabiHtation of principal and minor arterial within the region.
Focused Year 2015 Trip Table Preparation
Two steps were required to produce the focused Year 2015 trip table for the study from the regional Year 2000 highway travel matrix.
They were:
o Split the census tract trip estimates inside the study area to a block grouplevel trip table.
o Surcharge the Year 2010 trip table to reflect the additional commercial, retail and residential developments in the study area not included in the year base forecast.
The resulting travel matrix included all travel patterns throughout the region, comprising intra-and inter-regional trips.
Inside the detailed study area, three more block group-level traffic loading zones were added by subdividing census tracts. The trip table disaggregstion was accomplished by examining aerial photographs of the study area to determine the existing
6

and likely distribution of development and open space therein. From this analysis, an estimate was made to determine the percentage of travel to be allocated to each split portion of the census tract. This method was used to generate allocation factors for each split zone within the tract. These factors, which added up to one per any census tract, were then used to disaggregate the trip table into its component parts. For the purpose of simulating the Year 2015 traffic, the original trip table was surcharged by adding the travel from these developments to the appropriate split zones. Under the assumption that these developments will be fully operational by the Year 2015, most of them have been either already completed or are under construction.
The Focused Highway Assignment
The final step in the focused simulation process was the assignment of estimated vehicle trips to the highway network to obtain traffic volumes for each highway link. A capacity restrained assignment, based on the "equilibrium" traffic assignment technique, was used for this study. The regional nature of the highway network and trip table underlying the focused assignment process allowed the diversion of travel into and through the detailed study area between various entry and exit points in response to the proposed network modifications of each alternative.
A factor, developed on the basis of a review of historical traffic and socio-economic trends for the area under study, was applied to the Year 2015 estimates in order to derive the required 1995 projected traffic volumes.
7

8

III. ALTERNATIVE DESCRIPTION
A base scheme ("Do-Nothing" Alternative) and three other alternatives were devised to alleviate the traffic problems that are present today in the Woodhaven-Byberry corridor area. The "Do-Nothing" Alternative will involve the construction of a new Byberry Road bridge only. Current alignment conditions will continue in the future with the Woodhaven Road traffic entering and exiting the western end of the expressway at Evans Street. This scheme is labelled as Alternative 1.
Alternative 2 will feature an extension of Woodhaven Road west of US 1 to Philmont Avenue. This alternative will include a four-lane limited access facility with gradeseparated interchanges at Bustleton Avenue and Philmont Avenue. Byberry Road will continue to serve local traffic on this particular segment of the corridor.
A staging alternative which includes the extension of Woodhaven Road west of US 1 to Bustleton Avenue is the basis for Alternative 3. This scheme includes the construction of a four-lane roadway with at-grade intersection at Bustleton Avenue, with Byberry Road also serving this corridor.
Finally, under Alternative 4 the extension of Woodhaven Road will include construction of a four-lane roadway with signalized intersections at Bustleton Avenue, Philmont Avenue, and Byberry Road, respectively. The function of Byberry Road, between US 1 and the Woodhaven Extension, will be again to serve mainly local traffic. It should be noted that in all alternatives the bridge on Byberry Road over the Conrail railroad track will be replaced in accordance with a mandate order by the Public Utility Commission (PUC).
9

FIGURE 2
WOODHAVEN ROAD EXTENSION
CURRENT AVERAGE DAILY TRAFFIC VOLUMES

IV. TRAFFIC ANALYSIS
This section presents the current average daily traffic, future roadway daily volumes and turning movements at selected intersections for the Years 1995 and 2015 a.m. and p.m. peak hours of travel. The information is displayed on Figures 2 through 16.
The current traffic data was collected by DVRPC field personnel. The future daily volumes were derived from the output of a simulation process, discussed in section II. The peak hour turning movements were determined from the 24-hour turns (also derived from the simulation process), and multiplied by a factor. This factor, also known as the "K factor", represents the percent of traffic during the a.m. and p.m. rush hours with respect to the total daily traffic. The factor was derived from field observations collected by DVRPC. Its value is generally stable over time and requires only minor adjustments to determine future peak hour traffic. In the past and under today's accepted standards, this procedure has proved to be satisfactory for planning and design purposes.
For the purpose of this study, only the current and Year 2015 traffic volumes are discussed in the following segments of the report.
Current Traffic
The 24-hour traffic counts, gathered by DVRPC, were collected by means of Automatic Traffic Recorders (ATR) and converted to average daily volumes by application of adjustment factors provided by PA DOT that take into consideration the day of the week and seasonal variations. The resulting counts, thus processed, represent an average daily volume of traffic expected over the course of the entire year.
The total daily traffic volumes for the study area of the proposed Woodhaven Road Extension are indicated in Figure 2. A review of this figure reveals the function of Byberry Road as a natural, although limited, extension of the 6-lane Woodhaven Road present on the east side of US 1. A traffic flow of more than 30,000 vehicles per day (vpd) has been counted on segments of Byberry Road that extends to Bustleton Avenue. The western portions of Byberry Road serve approximately 18,000 and 13,000 drivers at Philmont Avenue and Pine Road, respectively. Two major parallel routes to Byberry Road in this corridor are Red Lion and Street roads, where respective current counts show daily traffic well in excess of 20,000 and 40,000 vpd using the two facilities. The north-south corridor of this study area is well represented by US 1, which carries volumes of traffic
, exceeding 60,000 vpd, and the four-lane Bustleton Avenue averaging daily volumes close to the 30,000 mark. Philmont Avenue is also functionally significant, serving approximately 15,000 drivers a day on the south side of Byberry Road and another 12,000 vehicles on the north side of Byberry Road. Other facilities, such as County Line (12,700 vpd), Southampton (11,900 vpd), Pine (7,000 vpd), Worthington (2,900 vpd), Trevose (4,200 vpd) and Tomlinson roads (with an average 3,000 vpd) complement the highway network of this important corridor.
11

12

Future Traffic
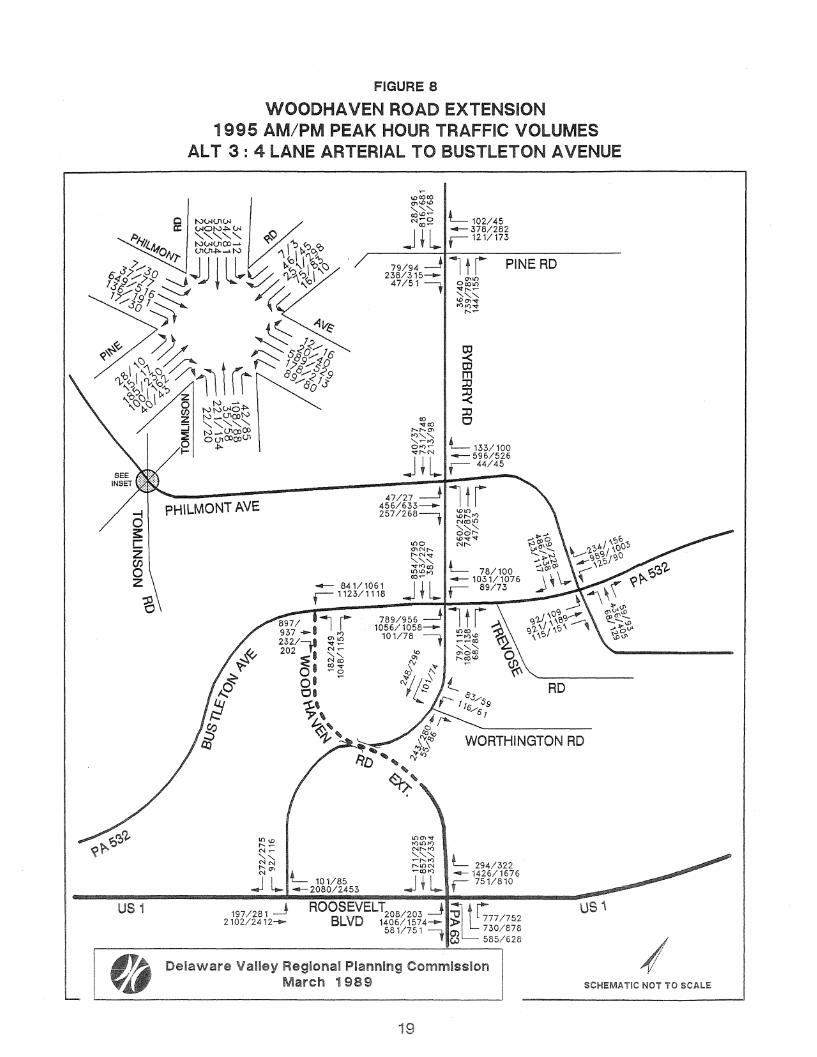
Figures 3 and 4 respectively show the 1995 average daily traffic and peak hour volumes for the a.m. and p.m. periods of the "Do-Nothing" Alternative. The next alternative, the extension of Woodhaven Road to Philmont Avenue as a 4-lane expressway with limited access to Bustleton and Philmont avenues, has an estimated 1995 average daily and rush hour traffic shown in Figures 5 and 6. The last alternative dealing with 1995 traffic projections is the extension to Bustleton Avenue proposed as a 4-lane arterial. The volumes for the average daily and morning and evening peaks of this alternative are indicated in Figures 7 and 8, respectively.
The next set of figures represent values for the Year 2015, the design year for all the alternatives. Figures 9 and 10 display the traffic estimates, average daily, and peak hour volumes, respectively, for the "Do-Nothing" scheme. Along its entire length Byberry Road shows a demand that ranges between 20,000 vpd and approximately 40,000 daily vehicles. These values represent an increase of about 15 percent over current counts. Although such additional traffic might be tolerable on those segments of Byberry Road located west of Philmont Avenue, this alternative will impose critical conditions of unbearable congestion on the links east of Philmont Avenue. Similar increases and a worsening of current traffic problems are also expected on Street Road and Bustleton Avenue, with traffic of approximately 45,000 and 35,000 daily drivers, respectively, using those two facilities during any Year 2015 average day. Significant increases in traffic on Philmont Avenue and County Line Road are also anticipated by the future year. The current Woodhaven Road will contribute to these increases with a Year 2015 estimated traffic of almost 62,000 vehicles a day, as compared to the current volume of 53,000 vpd. This surge in traffic is anticipated because of significant changes in land use proposed along the facility in the stretch between 1-95 and US 1. Major turning movements will follow suit on the pattern of current counts at the intersections of Byberry Road with Bustleton and Philmont avenues and Evans Street.
When Alternative 2, with the proposed extension of Woodhaven Road to Philmont Avenue, is analyzed, it shows additional traffic entering the corridor because of the higher capacity afforded by the proposed expressway. The extension will carry approximately 45,000 vpd on the first segment to Bustleton Avenue and about 32,000 daily vehicles to its terminus at Philmont Avenue. Substantial decreases in traffic have been shown for Street, Southampton, and Red Lion roads. The impact of this alternative can be seen in Figures 11 and 12. In the latter, where turning movements are indicated for the Year 2015
, rush hours, the higher numbers of turns at Bustleton and Philmont Avenues are indicative of the critical role played by the two segments of these facilities that extend between the proposed extension and Byberry Road. On those portions of Byberry Road parallel to the Woodhaven Road Extension, traffic is expected to drop in the Year 2015 below the 10,000 vpd mark, a considerable reduction from the current demand of about 30,000 daily vehicles.
The third alternative which considered the extension of Woodhaven Road to Bustleton Avenue as a 4-lane arterial was also tested. The analysis of this scenario demonstrated the enhanced impact of such a scheme on Bustleton Avenue, where most
13

:D a m c 3: C C 0 z z en
0 :D Z C :D c
1/ I'
I ~-USi
f',)
~
FIGURE 3
WOODHA VEN ROAD EXTENSION 1995 AVERAGE CAlLY TRAFFIC VOLUMES
AL TERNA TIVE 1: DO NOTHING
AADT in Thousands ..do
"'" CfI 8.0
PINE RD
/ ~?J
~ .... III m m
:D ~ ~
:D c
14.6 19.7
PHILMONT AVE CD ...... ~ CD
~
I 31.1 30.S
6.0
3.S
WORTHINGTON RD
't-
~ ~ e (.o:i ~ ~ 'i"'"
63.5 ROOSEVELT ~ ~ BLVD ~ ~
64,3 us'
Delaware Valley Regional Planning Commission
"'tl ~ > =d ....
~ ~
""'" SJl ....
() ~ 0 c: :D m z
~ ~ ~ C 01 :D Z
c m :c 0
I March 1989 L
SCHEMA TIC NOT TO SCALE
14
Col.) O'l Co
t ~

US 1
L
FIGURE 4
WOODHAVEN ROAD EXTENSION 1995 AM/PM PEAK HOUR TRAFFIC VOLUMES
AL TERNA TIVE 1: DO NOTHING
PHILMONT AVE
ot!tO ~~\D ~::'a t<')g~ L102/44
J I L --- 409/303 + ,---- 34/125
84/98 ~ l t r PINE RD 236/314--
23/26 -. "'~:;;
III
0"'''' t<')\O'" ",
N .... ~
'" N",o N~1Il ....
~\01Il
'<tgN L 134/101
J I L -6311510 + ,---- 38/83
L 64/106 -76111167 ,---- 335/263
911110~ l t r 802/972-- . 226/159----., "''''~ ~
, 1.0"-0 -:s:J c ,~(( ~ !P tOl"01 ~L
.... '" "' .... 0 a ~ \' ~\Ot<') Ul
.:-'ft ~ RD
I WORTHINGTON RD
3111314 ~ ROOSEVELT 50/49 ~ "O~r: 2120/2390-+- BLVD 1672/1761--» 846/817
568/819 ~ 771/886 , 589/572
I Delaware Valley Regional Planning Commission March 1989 SCHEMATIC NOT TO SCALE
15

FIGURE 5
WOODHAVEN ROAD EXTENSION 1995 AVERAGE DAILY TRAFFIC VOLUMES
AL T 2 : 4 LANE EXPRESSWAY TO PHILMONT A VENUE
-AADT in Thousands CD "tl ~ N )-
:0 0 ~ -a.
~ 9.3 ~ 3: C C PINE RD 0 z z C/l
0 t :0 Z C :0 - :a:. c
Cb~ w N
w ~ ~
I\) ttl m - :0 (")
~ (,n ~ 0
C :0 ~
-;- ill c ~ C en :0
Z C
27.3 15.4 m 24.3 ::D c
PHILMONT AVE • • ...., I ....,
CD • I\)
(,n
• :""I ;0'1 ! 29.1 • 30.1 ~
~
• • co ~·w a,
5.4 01 CD olb C, ",l:.\ "Ph' 3.B ~, WORTHINGTON RD 0 0 ....
C/l ~, 0
~ -w ~ CD
w ~ Q) CD 0 ,..: b z
::D C
us 1 65.6 ROOSEVELT fa ~ 67.1
BLVD CD ~
I eI~ Delaware Valley Regional Planning Commission March 1989 SCHEMATIC NOT TO SCALE
L I '-16

L
FIGURE 6
WOODHAVEN ROAD EXTENSION· 1995 AM/PM AVERAGE DAILY PEAK HOUR TRAFFIC VOLUMES
AL T 2 : 4 LANE EXPRESSWAY TO PHILMONT A VENUE
US 1
'<t U)t<)co ",r--U) ", coco~
N:g~ L- 102/45 J I L -3711275 t ,136/228
79/94 1 t r PINE RD
AVE
230/308-55/57 -. r--;;!i~
~r--N N;::'~ '<tr--Il}
r--~
~ ~ ~ :0 o
-4911527 ,877/839
L-133/100 -643/577 , 34/38
4/482_ 1 r 315/374,'
• 0
• ~g ~ ,~,
tor)T"""t"D IJ) \D
t::,~ • ;;\~ '<t"'r-- • t<)~U) L 42/89
666/783~ 5411661-
43/39 -.
L 50/65 -960/1210 J I L' _729/984 t ',303/302
j.l , 59/48
RD
WORTHINGTON RD
COU) ~r--
" '<ten '<tU)
Il L 74/65 .J '-2128/2492
154/266 --+ ROOSEVELT 306/248 2189/2473_ BLVD 1394/1558--
558/743 ,
L 335/362 - 1384/1637 , 647/796
Delaware Valley Regional Planning Commission March 1989
17
I SCHEMA TIC NOT TO SCALE
:c ~ c 0 z :c 0
L
d s::: C z en 0 z :c 0
US 1
FIGURE 7
WOODHAVEN ROAD EXTENSION 1995 AVERAGE DAILY TRAFFIC VOLUMES
AL T 3 : 4 LANE ARTERIAL TO BUSTLETON A VENUE
... AADT in Thousands po ...
9.1
PINE RD
N to'!' U, ... ~ .... to W m (") :c
~ 0 c :c ~ 0
c 14.9
z m
23.7 :c 0
PHILMONT AVE CD N ~ N
C
38.8 31.3
, , ... :E'
0
01 ~ 5.8
01 o.~ -:;t.'v 3.9 "Ph \ ~', WORTHINGTON RD
en 0
~ ... ~
~ :... N :!I
~ .... 0 oi W z
:c 0
64.3 ROOSEVELT (11
~ 65.4
BLVD (11
:... ~
Delaware Valley Regional Planning Commission
"tl ~ .".
~ ....
~ ~
~ ... en ~ Co
~ :c m
i!:) ~ ~ C'l :c
0
~ U,
ej March 1989 SCHEMATIC NOT TO SCALE
18
L
d 3: C z en o z
"8
US 1
FIGURE 8
WOODHAVEN ROAD EXTENSION 1995 AM/PM PEAK HOUR TRAFFIC VOLUMES
AL T 3 : 4 LANE ARTERIAL TO BUSTLETON AVENUE
PHILMONT AVE
Ill", ... ~ N~
~~
- 84111061 r 1123/1118
"'", Il L 101185 ..,J __ 2080/2453
197/281 ~ ROOSEVEL 2102/2412-- BLVD
<0 ~<O
...... en ...", a;;;~ L 1331100 ~"'N -596/526 J t L .- 44/45
RD
WORTHINGTON RD
L 294/322 -- 1426/1676 ~ 7511810 ,
I Delaware Valley Regional Planning Commission March 1989 SCHEMA TIC NOT TO SCALE
19

8 d 3:
C c 0 z z en
0 :::0 Z C :::0
C
..6 I\.)
N
,'fJ ,
US 1
L tj
I\)
c.n
FIGURE 9
WOODHAVEN ROAD EXTENSION 2015 AVERAGE DAILY TRAFFIC VOLUMES
AL TERNA TIVE 1 : DO NOTHING
AADT in Thousands I\.) Q N
9.2 PINE RD
O)~ ~
..6 OJ m
!D :::0 ..6 ~
:0 1:1
16.8 22.6
PHILMONT AVE ..6
I\.) ..6
j.,) I\.)
en
32.9 35.2
fg CA:> 6.7
4.1 39.1
WORTHINGTON RD
{I) 0
~ I\) a en CA:>
z :::0 C
66.4 ROOSEVELT en ~ 70.8 BLVD ..6
:..a ~
Delaware Valley Regional Planning Commission
"'0 ~ )10 -I ~
~ UJ ~
..6
...a . ~
(") ~ 0 :::0 C m ~
j'" !!l ~ C
0) :0
Z c
m :D c
March 1989 SCHEMATIC NOT TO SCAL.E
20
~ I\) . C/o)
~ ~

US i
FIGURE 10
WOODHAVEN ROAD EXTENSION 2015 AM/PM PEAK HOUR TRAFFIC VOLUMES
Al TERNA TIVE 1: DO NOTHING
PHILMONT AVE
L117/51 -459/348 V- 39/144
96/113~ l t r 2711361----26/28 t o~55
PINE RD
JfL
"'co~
""" <flr--N NNtn
<Xl
L154/116 ..... -725/586 V- 44/95
41131 ~ l t r 607/731----145/220 ----.. ~:;;N
, NOC,)lJ")
"" " "'tnN ",..,.<fl ~r--
L 74/122 -875/1227 ,385/302
/ WORTHINGTON RD C)C)
"
357/361 ~ EVELT 58/56 2207/2747--- BLVD 1541)1979
653/827 677/1657
Delaware Valley Regional Planning Commission March 1989
us 'I
SCHEMATIC NOT TO SCALE

::c d g} !: c ·c 0 z z en
0 ::c z c ::c
0
.... .... N
US 1
L Ij
FIGURE 11
WOODHAVEN ROAD EXTENSION 2015 AVERAGE DAILY TRAFFIC VOLUMES
AL T 2 : 4 LANE EXPRESSWAY TO PHILMONT AVENUE
AADT in Thousands 1'1,) 1'1,) "t! b ):-
~ 10.6 PINE RD
.... c.n
~'P . ....
w ~ ~
1'1,) OJ .m (') oI:lo :0 en ~ 0
c: :0 ~ c
c Z
31.4 17.7 m ::c 27.9 c
PHILMONT AVE I I
CD I co C Iw en .~ ; -..I
! 33.5 I 34.6
• • CD
~:t iD . 6.2 01 Co C. ~1\ 4.3 "," ~ .. WORTHINGTON RD
~D""" en ~, 0
~ .... c.n
~ iD
t ~ 0) 0 o:i Co z
::c c
70.5 ROOSEVELT m ~ 74.1 BLVD
Co ~
Delaware Valley Regional Planning Commission
~ -"
~
~ :0 m
"i !!l ~ C) :0 c
-0 ':P ~ ~~ w
March 1989 SCHEMATIC NOT TO SCALE
22
w !D c.n
~ N CD

FIGURE 12
WOODHA VEN ROAD EXTENSION 2015 AM/PM AVERAGE DAilY PEAK HOUR TRAFFIC VOLUMES
AL T 2 : 4 LANE EXPRESSWAY TO PHILMONT AVENUE
US 1
L 117/51 ""'-426/315 r 156/261
90/107~ l; r 264/354- I
63/65 l r<):;~ u)"'''' "'-"'-"'cccc", '<tcc" cc~
PINE RD
L 152/114 --738/663 r 39/43
PHILMONT
.....- 564/605 ,1007/964
765/899 ~ l t r 6211759-
49/44 l AVE
RD
WORTHINGTON RD
" 0" "'<0 "'-"'-0", cc"
It L 85/74 .,.J L..... -- 2422/ 1951
L 384/416 ....- 1567/1938
III "'~" - 9431914 ...,JH .... ,
177 /305 ~ ROOSEVELT 3511285 2492/2899- BLVD 1579/1848
6411853
Deia\AJare Valley Regional Planning Commission March 1989
23
SCHEMA 1'!C NOT TO SCALE

of the traffic is expected at the point where the proposed extension ends. Estimates of traffic as high as 45,000 vpd are projected to the north of the Bustleton - Woodhaven intersection. An substantial increase in volumes is also expected on the south side of Bustleton at this location. Under this alternative, displayed in Figure 13, the corridor demand decreases by approximately 18 percent when compared with the traffic estimates of Alternative 2. Most of this reduction in traffic is balanced by increases on Street, Southampton and Red Lion roads. Figure 14 depicts the impact of heavy turning movements at the Bustleton and Byberry intersections, in the immediate vicinity of the extension terminus. Byberry Road is serving more drivers in this scheme than in Alternative 2. An increase in traffic of about 30 percent is estimated for Byberry Road when comparisons are made between the Year 2015 traffic projections of Alternative 2 and the estimates in Figure 13 (Alternative 3).
Lastly, at PA DOT's request, the case of the Woodhaven Road Extension built as a 4-lane arterial and connecting US 1 with Byberry Road, west of Philmont Avenue, was considered as Alternative 4. The resulting average daily traffic and peak hour turns for this scheme are presented in Figures 15 and 16, respectively. A review of the traffic estimates shown in Figure 15 indicates that this scenario is more likely to provide a better pattern distribution of the Year 2015 traffic demand than any of the other alternatives treated. In this alternative, the traffic generated in the area under study is expected to be molded into the network configuration with the least amount of intersection encroachments at all crossings involved (see Figure 16). As the proposed new facility progresses westward toward Byberry Road, the amount of traffic on the extension is gradually dispersed into the surrounding routes, until finally it merges with Byberry Road with a total traffic contribution of approximately 15,000 vpd. At that point Byberry Road, converges with an additional 8,000 drivers continuing their travel to and from the western points of this corridor.
24

FIGURE 13
WOODHAVEN ROAD EXTENSION 2015 AVERAGE DAilY TRAFFIC VOLUMES
Al T 3 : 4 LANE ARTERIAL TO BUSTlETON A VENUE
I\)
AADT in Thousands Q
~ ~ CtJ ". ::0 d 10.4 =d -"
m c.,)
CJ s:: ~ I\j
c C PINE RD 0 z z en
0 .j:I. ::0 Z Q CJ ::0 ..... to
CJ eo O;tp b
II.)
Co II.) ~ II.) OJ b m ("')
~ ::0
~ 0 C
::0 Z - m I !:4 CJ ~ ~
C en ::0 Cl
16.9 z m
27.2 ::0 CJ
PHILMONT AVE (C) N m en
~
44.5 35.9 ,:::. ,:::. N
• • ..... :E 8
w b 6,6 o· oe TREVOSE RD
::0 OOt.P m :t.\ ~~ 4.4 (0" "'to\
~', WORTHINGTON RD
en 0 S ::r: ~
~ w :':1 ...b 0
'I'"' Co Z 'il""
::0 0
US 1 68.2 ROOSEVELT m ~
73.5 BLVD !\)
, a. I
gs I I De!aw'are Valley Regional Planning Commission
L March 1989 I SCHEMATIC NOT TO SCALI[ I
'--- -..-J

L
a :s:: c z (J)
o z
e
US 1
FIGURE 14
WOODHA VEN ROAD EXTENSION 2015 AM/PM PEAK HOUR TRAFFIC VOLUMES
AL T 3 : 4 LANE ARTERIAL TO BUSTLETON A VENUE
PHILMONT AVE
sicico ~"" ~~~ L ",,,,~ 117/51
j I~l -- 434/324 , r 138/198
901107 273/362
54/58
PINE RD
"'''' ",,,,~
""oo~
""" ",0"" ;. "";;!;~ '-152/114
J I L ...- 684/604 • r 50151
53/30 ~ 1 f i 524/727- I I 295/308----., "'~
, 00 0
- 966/1219 r 1290/1284
"'''' r-1..0f'l") O'lNLrJ
"'~"' "" "". 000'" ",,,,,,, "'00
"" " '. . ;;;~~ L- 89/114
j "'l L - 1185/1236 , r 102183
RD
WORTHINGTON RD
226/322 ~ ROOSEVEL T238/233 ~ 2416/2772-- BLVD 1616/1809---
6671863.
L 337/369 .....-- 1638/1926 r 8631930
672/721
Delaware Valley Regionai Planning Commission March 1989
26
us i
SCHEMA TIC NOT TO SCALE

:0 d m 0 3: c C 0 z z (J?
0 :0 Z 0 :0
0
US i
w t.J
FIGURE 15
WOODHAVEN ROAD EXTENSION 2015 AVERAGE DAilY TRAFFIC VOLUMES
ALT 4: 4 lANE ARTERIAL TO BYBERRY ROAD
I\,)
AADT in Thousands ~
N 10.2
PINE RD
N w
~r:> w ~ OJ
~r:, _ ......... m " • <IfJ''''
:0
" ~ , :0 , 0
I 00 , b • •
17.5 26.7 23,9
• PHILMONT AVE
, • 00 NG eD :..,. Fl, ~ m.
• • 33.1 32.S @
• • ...!.
~e Q
0& CD 5.9
"'0 » =tl ~
~
en b
C) 0 c
~ c z m :0 0
01 TREVOSE RD O,t,P. -:t"",
ro~ J"h\ .~ 3.9 <%.""'"", WORTHINGTON RD
CJ) 0 S .... ::c m ~ :...
(II) w ~ (1! 0:;) N z ,..
::0 0
68.8 ROOSEVELT fl ~ 72.3 BLVD
~ ~
~ -'-c.> I\)
ol:!o Q :..,.
~ ill i'"'
~ 0'1 :0
0
f3 u,
Deh~\vare Valley Regional Planning Commission March 1989 _______ SC_H_EM_A_TIC_N_O_T_TO_S_CA_L_E __ J
27

US 1
FIGURE 16
WOODHAVEN ROAD EXTENSION 2015 AM/PM PEAK HOUR TRAFFIC VOLUMES AL T 4: 4 LANE ARTERIAL TO BYBERRY ROAD
PHILMONT
AVE
L117/51 --- 405/299 r 160/255
90/107~ -I t r 248/333---
PINE RD
59/52 \?"l~~
.---411>
;' <P 719/804
; , o I
t--'" I ",~" ~L()" "':'iJ, - 548/524 ...J ",227/167
69/61 -h 1 t r 510/522-, ''''''0.0 299/368--;1. cn't"
V·""'''' It '" ~ ~. ~~~
~~~ , "''''~ "-. " "'6":: • 't~" L 46/87
- • _803/1127 ',384/329
"!:o'" ,~, .... "
"'''~ 't",,, !:O~
4-152/114 -729/645 , 44/46
TREVOSE RD
208/308 -.J 2433/2779-
L 96/81 -2397/2826
ROOSEVELT 259/248~ BLVD 161111795---
6511849
WORTHINGTON RD
658/705
Delaware Valley Regional Planning Commission March 1989
28
" ! ~/ I SCHEMA TIC Nor TO SCALE ~

V. DESIGN FACTORS AND AIR QUALITY SUMMARIES
In addition to an analysis of the travel demand for the alternatives of the proposed Woodhaven Road Extension, PA DOT has also requested Year 2015 design factors and Air Quality summaries. This information is necessary and will be used for an overall evaluation of alternative designs and potential impacts on specific facilities.
The design factors for the Woodhaven Road and for other arterials in the area are compiled in Table 1. The indicated values were determined by DVRPC staff on the basis of actual observations made in the study area, and of comparative analyses with other areas of the region having analogous characteristics and corresponding facilities of similar function and design.
Table 2 reports the summaries for pollutant emission, Vehicle Miles of Travel (VMT) and speed average for the four alternatives tested. This information was gathered from the simulation process for Planning Area 12 of the DVRPC regional system. This area is bounded by the Delaware River, the Bucks and Montgomery county lines, and by the Pennypack Creek in Philadelphia. The air quality summaries will be used by PA DOT in their preparation of an Environmental Impact Statement (EIS) study.
29

cu
a
Ch
arac
teri
stic
Per
cen
t D
aily
Tra
ffic
in
Pea
k H
our
(K)
Dir
ecti
on
al S
pli
t o
f T
raff
ic i
n P
eak
Hou
r (D
)
Per
cen
t o
f T
rUck
T
raff
ic i
n P
eak
Hou
r (T
)
Dir
ecti
on
al S
pli
t o
f T
raff
ic i
n D
aily
Tra
vel
(O
F)
Per
cen
t o
f T
rUck
in
D
aily
Tra
vel
(T
F)
Med
ium
. T
rUck
*
Hea
vey
Trl
lck*
Tab
le 1
Woo
dhav
en R
oad
Ext
ensi
on
Yea
r 20
15 D
esig
n F
acto
rs
(in
per
cen
t)
Woo
dhav
en E
xten
sion
E
xpre
ssw
av
Art
eri
al
8.5
9
.5
52.0
51
.5
8.0
7
.0
50
.0
50.0
11
.0
10
.0
70
.0
73
.0
30.0
27
.0
US 1
B
ust
leto
n A
ve
oth
ers
8.0
8
.2
9.0
52.0
5
3.0
5
5.0
8.5
7
.0
5.0
50.0
50
.0
50
.0
12
.0
9.0
8
.0
70.0
60
.0
65.0
30.0
40
.0
35.0
* M
edim
n tr
uck
is d
efin
ed a
s a
tru
ck w
ith
2 a
xle
s, w
hil
e he
avy
tru
ck i
s d
isti
ng
uis
hed
by
3 o
r m
ore
axle
s.

Alt
e:rn
ativ
e
1.
Do-
Not
hing
2.
Exp
re::
,sw
ay t
o P
hib
no
nt
3.
Art
eri
al
to B
us-
tIet
on
4.
Art
eri
al
to B
yb
e.rt
y
Tab
le 2
Woo
dhav
en R
oad
Ex
ten
sio
n
Po
llu
tan
t E
mis
sio
n,
VM
1' f
Spe
ed s
umm
arie
s (P
lann
ing"
Are
a
12)
Em
issi
on
in
Kg.
(0
00)
Tra
vel
(0
00)
CO
N
MH
C
NOX
VM
1'
28
,82
6
1,9
01
3
,46
3
1,7
30
.8
27
,44
2
1,8
02
3
,59
6
1,7
63
.0
28
,55
9
1,8
78
3
,46
5
1,7
33
.5
28
,64
8
1,8
86
3
,46
8
1,7
36
.4
Av
erag
e (m
ph)
~
20
.9
24
.5
22
.0
22
.2
* P
lann
il1(
J ar
ea 1
2 is
lim
ited
by
th
e D
elaw
are
Riv
er,
the B
ucks
an
d M
ontg
omer
y C
ount
y li
nes
an
d
by
th
e P
enny
pack
Cre
ek
in P
hil
ad
elp
hia
co:
NMHC
: HO
X:
WI[
[' :
HP
H:
carb
on
Mon
oxid
e H
ydro
Car
bo
ns
Nit
ric O
Xid
as
Veh
icle
Mil
es o
f T
rav
el
Mil
es P
er H
our

32

VI. FINDINGS
This report provides an assessment of the impact of future traffic for alternative network configurations in an area bounded by Pine and Red Lion roads, Route US 1 and Street Road in the Northeast limits of Philadelphia. The impact is evaluated by comparing Year 2015 travel estimates for highway networks with and without a proposed extension of Woodhaven Road. A summary of this traffic impact is shown in Table 3.
Four schemes were investigated: Do-Nothing (Alternative 1) and three different proposed extensions. These included a limited access expressway to Philmont Avenue (Alternative 2), a 4-lane arterial to 8ustleton Avenue (Alternative 3), and 4-lane arterial to 8yberry Road (Alternative 4). A review of Table 3 indicates the following findings:
o In Alternative 1, the "Do-Nothing" scenario, 8yberry Road is expected to operate under forced traffic flow conditions with an increase in traffic of 25 percent over the current counts of approximately 32,000 vehicles per day. Under existing physical conditions, with the exception of a new bridge over the Conrail railroad tracks, this facility will most likely undergo severe delays during most average weekdays in the Year 2015, with operational breakdown and far worse delays than those experienced by drivers today. Routes parallel to 8yberry Road such as Red Lion, Southampton, and Street roads show higher increases in traffic for the future when this alternative is compared to the others.
o The analysis of Alternative 2, an expressway extension of Woodhaven Road to Philmont Avenue, brings to light the function that the proposed facility can be expected to assume in accommodating the Year 2015 travel volumes. These are estimated at 32,000 and 45,000 vehicles per day between Philmont Avenue and US 1. Concurrently, travel on 8yberry Road is expected to decrease by as much as 77 percent from current counts. Similarly, other routes parallel to the proposed extension show decreases in estimated traffic for the Year 2015 that average approximately 15 percent when compared to Alternative 1 projections. A severe impact in this alternative is anticipated on the segment of Philmont Avenue that directs the travel flow back to 8yberry Road. A traffic volume of approximately 30,000 vehicles is projected at this location on a daily basis.
o Under the Alternative 3 scenario, a 4-lane arterial is proposed to link US 1 with 8ustleton Avenue. The traffic served by the new facility decreases by about 13,000 vehicles a day compared with the volume estimated in Alternative 2. This reduction is balanced by an increase in traffic of approximately 3,000 vehicles on 8yberry Road and similar or higher increments on adjacent roads. This diversion of volumes is due to the characteristics of a shorter extension and the lower operational standards that an arterial, instead of an expressway, can offer. The most critical link of this alternative network appears to be, as expected, the segment of 8ustleton Avenue that leads the extension back onto 8yberry Road. Traffic on this section is estimated to reach a volume of more
33

Tab
le 3
Woo
dhav
en R
oad
Ex
ten
sio
n
Ave
rage
Da.
ily
Tra
ffic
Im
pa
cts
of
Pro
pose
d A
lter
nat
ives
(A
DI'
in 0
00)
CU
rren
t Y
ear
2015
Alt
ern
ativ
es
(Alt
.LB
ase)
* A
DI'
1.IX
>-N
othi
ng
2.E
xpw
y to
3
.Art
eri
al
to
4.A
rteri
al
to
Facil
ity
B
etw
ee
n
(in
000
) (B
ase)
F
hilm
ont
Bu
stle
ton
B
yb
eny
Byb
err
y R
d P
ine-
fhil
mo
nt
11
.9
19
.1
24
.6
(+28
.8)
22
.0
(+15
.2)
23.3
(+
22.0
) fh
ilm
on
t-B
ust
1et
on
1
7.4
2
2.6
8
.6
(-6
2.0
) 2
5.2
(+
11.5
) 9
.2
(-5
9.3
) B
ust1
eton
-Wor
thin
gton
3
2.0
3
9.9
9
.9
(-7
5.2
) 1
3.0
(-
67
.4)
10
.9
(-7
2.7
) W
orth
ingt
on-W
oodh
aven
3
0.9
3
9.1
8
.9
(-7
7.2
) 1
1.9
(-
69
.6)
10
.3
(-7
3.7
)
Bu
stle
ton
Ave
R
enna
rd-W
oodh
aven
Ex
t 2
9.9
3
2.9
3
0.8
(-
6.4
) 3
4.6
(+
5.2
) 3
0.8
(-
6.4
) W
oodh
aven
Ex
t.-B
yb
erry
2
9.9
3
2.9
3
4.6
(+
5.2
) 4
4.5
(+
35.3
) 3
3.1
(+
0.6
) fh
ilm
on
t-co
un
ty L
ine
29
.4
35
.6
33
.8
(-5
.1)
34
.3
(-3
.7)
36
.9
(+ 3
.7)
~
Fhi
lmon
t A
ve
Pin
e-W
oodh
aven
Ex
t 1
4.6
2
2.6
2
7.9
(+
23.4
) 2
7.2
(+
20.3
) 1
8.1
(+
18.1
) W
oodh
aven
Ex
t. -B
yb
erry
1
4.6
2
2.6
3
1.4
(+
38.9
) 27
.2
(+20
.3)
23
.9
(+ 5
.8)
By
ber
ry-B
ust
leto
n
11
.9
16
.8
17
.7
(+ 5
.4)
16
.9
(+ 0
.6)
17
.5
(+ 4
.2)
stre
et
Roa
d U
S 1
-Tre
vo
se
45
.7
51
.0
47
.3
(-7
.3)
50
.3
(-1
.4)
49.4
(-
3.1
)
coun
ty L
ine
Rd
Pin
e-B
ust
leto
n
12
.7
17
.4
15
.1
(-1
3.2
) 1
8.0
(+
3.5
) 1
6.0
(-
8.1
)
Red
lio
n R
d U
S l-
Bu
st1
eto
n
27
.5
29
.3
23
.7
(-1
9.1
) 2
7.0
(-
7.9
) 2
6.0
(-
11.3
)
US
1 S
outh
ampt
on-W
oodh
aven
6
1.8
7
0.8
7
4.1
(+
4.7
) 7
3.5
(+
3.8
) 7
2.3
(+
2.1
)
Woo
dhav
en R
d
US
l-'I
ho
rnto
n
53
.2
61. 7
6
8.8
(+
11.5
) 6
2.6
(+
1.5
) 6
3.4
(+
2.8
)
Woo
dhav
en E
xt.
u
s l-
Bu
stle
ton
4
4.8
3
1.8
3
5.2
B
ust
1et
on
-Fh
ilm
on
t 31
. 7
26
.6
Ph
ilm
on
t-B
yb
eny
1
5.0
* E
Xpr
esse
d in
perc
en
t

than 44,000 vehicles per day by the Year 2015. Such an increase represents approximately 39 percent more traffic than current counts for the same segment of Bustleton Avenue.
o As possibly the most complete highway alternative under analysis in this report, the proposed extension of Woodhaven Road to Byberry Road with at-grade intersections with Bustleton and Philmont avenues offers a true alternate to all the "through the area" travellers that use this corridor routinely. Traffic volumes on the extension are projected in the range between 15,000 and 35,000 vehicles per day by Year 2015. Substantial reductions in traffic are also estimated on the parallel routes like Byberry Road where the impact is translated to a reduction of 62 to 77 percent from the "Do-Nothing" Alternative traffic, on Street Road (3 percent), County Line Road (8 percent), and Red Lion Road (11 percent). Bustleton and Philmont avenues, on the other hand, display tolerable and moderate increases over any of the alternatives studied.
From the findings of all alternatives tested, it is concluded that this corridor will maintain today's local and regional significance in the future. While the movements of people and goods are two important factors contributing to the continued welfare and growth of an area, other factors must also be carefully analyzed before the selection of one alternative over the other. Safety and socio-economic impacts, as well as financial and environmental concerns, must be fully investigated and examined in determining the most viable and feasible alternative that will correct the unbearable level of traffic congestion and cater best to the growing needs of the area served by this corridor.
35
