transverse post-tensioning of …onlinepubs.trb.org/onlinepubs/trr/1978/665v2/665v2-029.pdf ·...
TRANSCRIPT

TRANSVERSE POST-TENSIONING OF LONGITUDINALLY LAMINATED TIMBER BRIDGE DECKS
R.J. Taylor and P.F. Csagoly, Ontario Ministry of Transportation and Communications
Longitudinally, nail-laminated timber bridge decks are used extensively in northern Canada, where the cold and dry climate discourages the activities of fungi and termites. The loadcarrying capacity of these structures is dependent upon their ability to effectively distribute wheel loads among the laminates; this being a function of the friction and the holding power of the nails. Due to overloads, volumetric changes and environmental effects, the holding power tends to diminish resulting in a subsequent reduction in the load-carrying capacity of the bridge. Construction of these nail-laminated systems involves extensive labour, since thousands of nails have to be driven into hundreds of laminates. Quality control is quite difficult as it requires continuous supervision to ensure that all the nails are properly placed and driven. This report describes the application of transverse post-tensioning to an existing longitudinally nail-laminated timber deck structure in Ontario . This 3-span continuous bridge portrayed the delaminating problem, and as such, presented an appropriate test site for a post-tensioning system. Load testing was done before and after post-tensioning to determine its effects on the structure's response. An evaluation of the test results indicated that the structure's load-carrying capacity was increased by at least 100%. Transverse post-tensioning, in effect, replaces the need for nailing and hence reduces the labour required for construction. Quality control extends only to ensuring that adequate post-tensioning forces exist to provide the friction necessary for load distribution, allowing for anticipated losses due to creep. This confined deck system exhibits better resistance to the 'environment, as it eliminates the penetration of foreign materials between the laminations.
The Ontario Ministry of Transportation and Communications is conducting an ongoing load testing program, in which a varying number of bridges are analyzed and tested each year. The primary objective of the program is to establish a safe load-carrying capacity, while increasing knowledge of the behaviour of bridges under load .
236
Prior to the start of a load testing season, an inspection is undertaken to determine which structures would most benefit from load testing. It is during these inspections that many inherent problems related to specific structural designs become apparent. One such problem concerns the delamination of Longitudinally Nail-Laminated Timber Deck structures (L.N.L.).
Since the L.N.L. system depends extensively on its ability to distribute wheel loads transversely, delamination of the system can cause a severe reduction in the capacity of the structure. In some instances, where some of the nails no longer perform their function, the capacity of the structure rests upon those laminates directly under the applied load.
Hebert Creek Bridge displayed the characteristic problems of a delaminated L.N.L. structure. The bridge was posted for a reduced load of 15 tons (133 kN) and identified for replacement in 1976. This bridge was selected as a test site for the development and testing of a transverse post-tensioning system. This system would create adequate friction to ensure load sharing of the laminations, while closing the deck tightly to prevent further deterioration.
This report is primarily concerned with the design and installation of the post-tensioning system for the Hebert Creek Bridge and the load testing of the structure before and after the system was stressed.
Sile Description
Hebert Creek Bridge is a 2-lane structure located on Highway 539 about 5 km (3 mi.) north of Highway 64, near Field, Ontario. The 3-span continuous structure was designed and built for an H20 truck load in 1951.
The 16. 76 m (55 ft.) long structure consists of two side spans of 5.33 m (17.5 ft.) and one center span of 6.10 m (20 ft.), as shown in Figure 1. The 51 mm x 305 mm (2 in. x 12 in.) timber laminations were placed on edge and oriented longitudinally, as illustrated in Figure 2. The timbers were so arranged to produce longitudinal discontinuities of the laminates at the one third span points and support points only. In addition, for any one transverse section the joints would occur at every third lamination.

2.29m 305m
Figure 2. Hebert Creek cross section of deck at pier. ,.....
Im= 3.28 FEET Imm =0.039 INCH
3.05m
305mmx 305mm PILE CAP
19 mmfllBOLT
16mmfll LAG SCREW
3.05 m
203mm x 203mm GUARDRAIL POST
LJ!MINATIONS
3.05m 2.29m
237
Figure 1. Hebert Creek Hwy. 539 elevation .
.....
Im =328 fL Imm =0.039 in~
APPROXIMATELY 152 mm WIDE SPACERS CUT TO FIT AT POSTS
WIDTH OF LAMINATED DECK 8.38 m 150 mm ASPHALT
19mmr/l DRIFT 80l.l'S
LAMINATES TOE NAILED AT SCONTINUOUS LOCATIONS ONLY
5 Ii l,52m
Figure 3. Creep testing machine .
.....

238
Pre-Testing Evaluation
The structure was initially evaluated according to AASHTO (1) Specifications and the original H20 design loading was confirmed. A precise computer analysis of the structure, prior to post-tensioning, was not feasible due to the non-linear mechanical nature of the deteriorated nail-laminated system.
However, a computer analysis was performed which was intended to represent the post-tensioned structure. The analysis was conducted using a program called ORTHOP (3) assuming that the transverse transfer of load is performed by shear, with no transverse flexural stiffness. The analysis predicted a maximum longitudinal flexural stress of 6200 kPa (900 psi) under the maximum load of a 417 kN (93,800 lb.) tandem of the test vehicle. The maximum transverse vertical shear stress was established as 138 kPa (20 psi) which was incorporated in the design of the post-tensioning system. The maximum anticipated deflection of the posttensioned structure under the test vehicle was 10 mm (0.4 in.), assuming a modulus of elasticity of 10.3 x 10⁶ kPa (1.5 x 10⁶ psi).
Allowances for support movements were not incorporated in the analysis, therefore, the actual displacements were expected to be higher.
Post-Tensioning
Creep Tests
Creep is considered to be one of the most important considerations in post-tensioning timber perpendicular to the grain. Under sustained stress the timber will creep considerably, reducing the initial stress that was introduced into the system. To evaluate the effects of creep, an investigation was conducted prior to the actual design of a post-tensioning system.
Two test specimens, composed of seven pieces of timber approximately 279 mm x 279 mm x 41 mm (11 in. x 11 in. x 1 5/8 in.), were constructed and installed into the testing apparatus as displayed in Figure 3. Both specimens were stressed to 1034 kPa (150 psi), however, the load springs were removed from one specimen to introduce a variation in the stiffness of the system. Both load and strain measurements were taken over a period of 2000 h.
The results of these tests are displayed in Figures 4 and 5 and indicate that an equilibrium was reached at approximately 1000 h. Plotting the ratio of the initial to the final stress against the stiffness of the test apparatus produces the two points on the curve given in Figure 6. With these points and the two known boundary conditions, an approximate solution to the curve was developed. This relationship was used to account for the effects of creep in the design of the posttensioning system.
Further creep tests are being performed to gain an understanding of the effects of the environment on the test specimens under sustained load. This is being performed as a separate investigation since it involves a considerable amount of time and special equipment.
Design
An important aspect of the design is the evaluation of the minimum permanent stress required between the timber laminations, to ensure proper load transfer. An analysis was performed using a
program called ORTHOP (]), as described in the preLetiLlug analysis. Under che maximum candern load of the test vehicle, 417 kN (93,800 lb.), the maximum transverse shear stress was calculated to be 138 kPa (20 psi). Assuming a conservative coefficient of friction between the timber surfaces of 0.5 (~),
the required minimum prestress would be 276 kPa (40 psi). Using the relationship for creep developed in the preceding section, and assuming an initial stress of 1034 kPa (150 psi) on the timber, the stiffness of the required post-tensioning system should be about 70 000 kN/m (400,000 lb.fin.).
The selection of the post-tensioning system used at Hebert Creek was based upon the following considerations:
1. Ductility - The system must be ductile enough to compensate for losses due to creep. A minimum design strength of 793 MPa (115 ksi) was required to provide a stiffness of 70 000 kNfm (400,000 lb.fin.) based upon a modulus of elasticity of steel of 200 x 106 kPa (29 x 106 psi).
2. Adjustability - Since re-prestressing may be a necessary maintenance procedure, it should be entirely readjustable.
3. Protection - Since the system would not be embedded in concrete or grouted, as is the case with concrete design, environmental protection should be provided.
4. Practicality - The system should be such that it can be handled easily by local Ministry personnel and could be installed with little disruption to traffic flow.
After evaluating various systems available, a post-tensioning bar manufactured by Dywidag Canada Ltd. was selected. This system incorporates a high strength bar with spiral deformations, which use anchorage nuts containing complementary deformations. This system can be quickly re-adjusted and can be handled easily by the local Ministry personnel. As well, the 16 mm (5f8 in.) diameter bars have an ultimate strength of 1082 MPa (157 ksi) and can be safely loaded to the required stress of 793 HPa (ll5 ksi).
The layout of bars shown in Figure 7, with two bars at each station, provides an initial transverse stress of 1034 kPa (150 psi) on the timber decking. The anchorage bulkhead, as shown in Figure 8, consists of new 76 mm x 305 mm (3 in. x 12 in.) select structural Douglas Fir placed the full length of both sides of the timber deck and secured in place with 178 mm (7 in.) spikes. Steel anchorage plates, 305 mm x 457 mm x 38 mm (12 in. x 18 in. x l~ in.), bear directly against this timber at each post-tensioning station. Protection of the bars is provided by enclosing the bars in grease filled P.V.C. piping, a method which has already been used by Dywidag Canada Ltd. Steel sleeves are welded onto the steel plates and, under relative movement, telescope into the P.V.C. piping to maintain an enclosed environment. Plastic caps are placed over the anchorage nuts and filled with grease to prevent deterioration of the anchorage system.
To facilitate installation, the guardrail posts and curbs were removed from the structure. The top P.V.C. pipes, with the bars inside, were placed into transverse grooves cut in the asphalt. The bottom P.V.C. pipes with bars inside were secured to the underside of the timber deck with standard metal pipe brackets and wood screws, supported at every 0.91 m (3 ft.) along their length. Installation of the system, including the replacement of the curbs and posts but not including the stressing operation, took just over two working days with

,.. - "' ... - .. STRESS r---..; .
12
_,_ -I
1-f- No. I MACHINE 1--INITIAL STRESS 1034 kPa
Q SPRINGS RETAINED
e . --1- ---,_
6
--- -~ ,_ -- ---~- -f--- ---- ---~ ll""" --2- -
~ --
TIME (HOURS)
l'.l g3 ~ R § 8 - -
~ ~,., 1-.. ,-:..... .
i_. f!!! ~~
- - -
.l.I .... IT
.__ , ~,,
V-v .,.d
I
:-~ ,_
I .
a a. -
-
239
!050 Figure 4. Results of creep tests, 2000 h.
IOOO _.
"'- f'9'!5 0
10-0: I-VI 9 00
I kPaaQ.t4'5 lb/lnl
Figure 5 . 2000 h.
Results of creep tests, ,.. - "' -I> en "'0
TIME (HOURS)
~ § "'8 .. f> ~ -
80 0
1.0
.91
6~00
IOOO
~ - - _.___ '- _...._
~ 12
....__ - .____ ----.....
- ~ '-- ,_ - - --~ 800
10 -- - f- - :. ~
~ " "' "- - li 700 --- UUl lAL SfRESS 1034 \Po - -'- -- ,_ SPRINGS REMOVED
. ...... II! e I I
-~ -~ - -r 600
- ,_ --6 --_,_ "' -- --- WO
~ -
,_ [,A .:----- ,:.- ... - - -- 400
4 v ~ 300 - :...-" .- "-' vi ~ 2
STRAIN ,_ ~ ..
.: !\. - -- ,__,_ 100
I kPa s O 145 lb/in 2
KNOWN CONDITIONS ( R, r)
(I) (O, 1.0) Figure 6. Ratio of final to initial s tress versus stiffness of post-tensioning system.
( 2) ( 6300, 0 .91) (DERIVED FROM CREEP TESTS) ( 3) ( 118600, 0 I~) (DERIVED FROM CREEP TESTS) (4) CURVE ASSYMPTOTIC TO R AXIS
BASIC EQUATION ___.__ + c RM+b
128.2 APPROX SOLUTION r= ----- +o
R 1.JB + 128.2
WHERE R=..!li..x-1-m IOOO
118 600 R
RI STIFFNESS OF POST-TENSIONING SYSTEM I, kN/m
..
1KN/m - 5.71 lb/in.

240
four men (approximately 70 man-hours).
Stressing
Two jacks were used in tandem at one posttensioning location to stress both the top and bottom bars simultaneously and to maintain a uniform pressure on the steel-timber contact surface.
Each location along the length of the bridge was stressed in turn to one half of the required load. Five complete passes were necessary to maintain some amount of tension at all of the posttensioning locations. After a further seven passes an average load of 222 kN (50,000 lb.) was obtained at each post-tensioning location, which provided a normal pressure of 827 kPa (120 psi) on the timber deck. Further stressing was not possible as the rotation of some steel plates was causing local crushing of the timber bulkhead.
Though narrowing of the deck was anticipated it was not expected to exceed 150 mm (6 in.). However, a maximum of 450 mm (18 in.) occurred across some locations of the bridge.
It is estimated that about 60% of the movement of the structure occurred during the first five stressing operations. These took a total of 2 full working days to perform. The remaining 40% occurred in the last seven passes which also took two full working days. The stressing operation required the constant participation of at least three men.
Instrumentation and TestiJ1g
The instrumentation layout, as shown in Figure 9, consisted of 44 linear displacement transducers used to measure vertical displacements across the center of the north end span and center span, where maximum deflections were anticipated. The remaining transducers were positioned to record the vertical movement of the timber piles at the north abutment and the two interior piers. The south abutment was monitored with dial gauges.
The demac points were used to measure extreme fiber strain on the underside of the timber deck at the location of maximum moment occurring at 2.13 m (7 ft.) from the north abutment. The points were equally spaced from the west edge of the structure to the centerline, and each was oriented longitudinally in the center of the bottom face of a lamination.
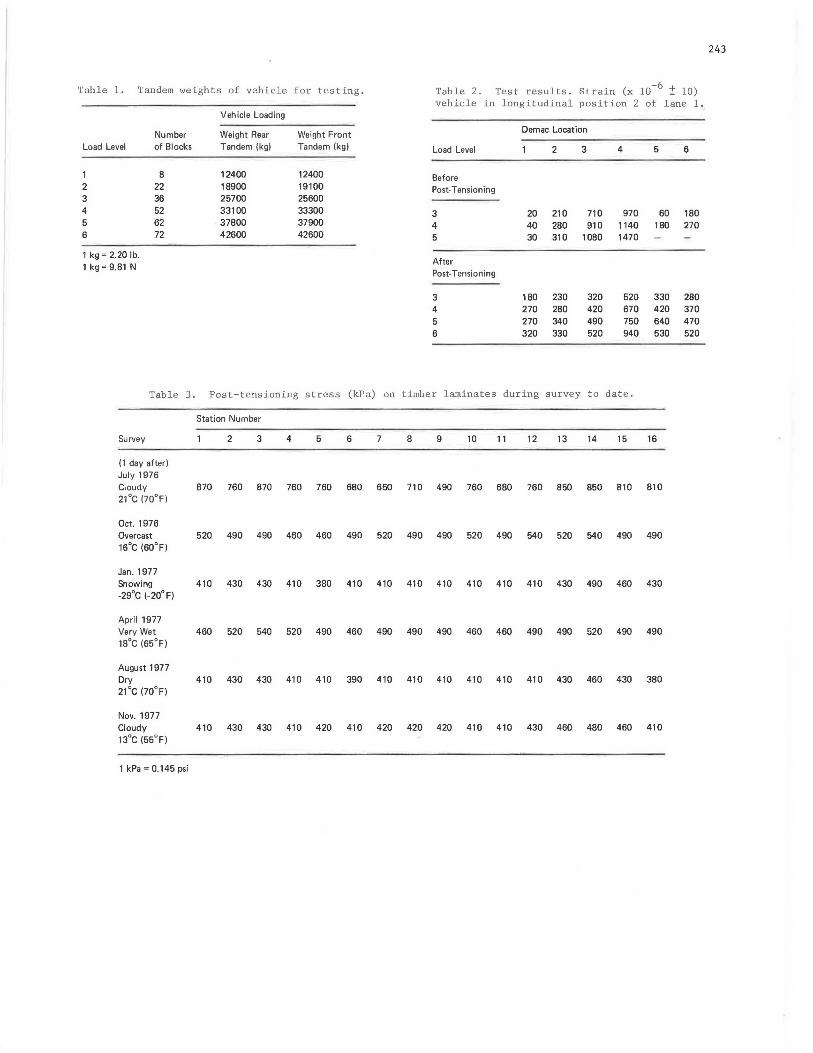
The structure was tested in July 1976 using the Ministry's test vehicles, before and after post-tensioning. Testing was repeated 2~ months later in October when the majority of the posttensioning losses was believed to have occurred. The vehicle was loaded to produce six increasing vehicle weights as indicated in Table 1, and was positioned in 18 static locations, as shown in Figure 10. Dial gauges at the south abutment were monitored whenever the vehicle was placed in the fifth or sixth longitudinal position of each lane.
Few problems were encountered while testing the structure apart from deformation of the asphalt pavement under the heavy wheel loads, which is a common occurrence during load testing.
Post Testing Evaluation
Test Results
Prior to post-tensioning, the load testing was terminated during the application of load level 5.
Under this loading, the failure of a timber lamination occurred at vehicle position 2 of lane l (Figure 10). Just prior to failure, the maximum deflection and maximum strain were 25 mm (1 in.) and 1470 micro strain, respectively. However, measurements were not taken at the actual time of the failure as the vehicle was being removed to prevent further damage to the bridge. It is believed that the deflections and strains would have been much higher at the time of failure, as visual observation displayed a sudden vertical movement of the laminations directly under the wheels of the vehicle . This vertical movement suggests that a loss of transverse shear capacity occurred which resulted in the overloading of several laminates and the failure of one.
Immediately after post-tensioning was completed, the structure was re-tested and the maximum load level, as shown in Table 1, was reached. No signs of structural deficiency were observed and the maximum deflections and strain were 16 mm (0.62 in.) and 940 micro strain, respective.ly. These maxima again occurred under the same vehicle position as in the previous test. In comparison to the unposttensioned structure the maximum measurements under load level 5 were 14 mm (0.56 in.) and 750 micro strain of deflection and strain, respectively.
Figures 11 and 12 compare some transverse deflection curvatures from the load tests. These curves illustrate clearly the dramatic effects of the structure's response due to post-tensioning and indicate that the maximum deflection was reduced by 40% immediately after post-tensioning. The figures also show an additional 12% reduction in deflections under the final testing of the posttensioned structure. It is believed that the new asphalt, which adds slightly to the stiffness and increases the load distribution, may account for the additional reduction in vertical displacements.
Table 2 displays the strain results obtained from the load testing of the structure in both cases. Strains were not measured during the final testing when the post-tensioning losses had occurred. Under load level 5 the maximum strain measured was reduced by 50% when the structure was post-tensioned. This reflects directly on the flexural capacity of the structure. Table 3 shows the relative changes in normal stresses in the timber laminates over a period of l~ years. The table indicates that the normal stress has not changed significantly since the bridge was last tested in October 1976.
Post ·.res t ing Analysis
The action of the post-tensioned structure was not correctly represented by the computer analysis performed before testing. Under posttensioning forces the structure performed similar to an orthotropic plate, with a very small transverse flexural rigidity. An orthotropic (]) analysis was performed assuming the transverse to longitudinal stiffness ratio to be approximately 1/20, based upon figures from the Wood Handbook (4). A shear modulus was estimated at 1/16 (~) of the -longitudinal modulus of elasticity. The results of this analysis are displayed in Figures 13 and 14 compared to the test results of July and October 1976. Although the overall displacement diagrams are similar to the test data, there exists definite discrepancies in curvature between the points of load application. Variation of the modulus of rigidity and Poisson's ratio had little apparent effect on the curvatures. However, reducing the

lt_PIER
I
I '
I i
kL ...
lt_PIER
'
! I I
-· Im z 3 2 8 fl I mm z 0 .0 59 in
Figure 8 . Details of anchorage and protection. .....
(i) ®
METAL SLEEVE ATTACHED TO PLATE
51 mm P.llC. SLEEVE FITTED OVER STEEL SLEEVE FILLED WITH GREASE.
Im =3. 2Bfl. I mm c .039 In
Figure 7. Plan view pos t-tens ioning . .... Steel Plates 38 mm x 457 mm x 305 mm
at 16 post tensioning stations - secured by 152 mm spikes
2 Select Structural 76 mm x 305 mm Wood Bulkhead each side comes in 3 pieces 2 @5.5 m and 1@ 6.10 m secured by 178 mm spikes
3 Bars 16 mm </> in 51 mm P.V.C. Sleeve top bars below asphalt
- bottom bars secured by clamps to underdeck
PLASTIC CAP
SIDE VIEW
DETAILS Of ANCHOR.AGE SYSTEM
241
»~-
~ I ~
@
FRONT VIEW
e DEMEC GAUGE Figure 9. Plan showing inst rume n-• DISf'l.ACEMENT TRAHSIJUCER •DIAL GAUGE
•
36.
36.
34.
33.
32.
31 •
30.
29.
28.
27 •
Figure 10 . Load vehicle positions. ..... r
3.0!IM 2.21m tat ion locations. .... • l•6 18. • 3 •4 I 17. •5 I •6 iu 16. •7 •B I 15. •9 I •IC
' · 4 14 • •II
•12 I 13 • •13 I
12. I· 3
PILE CAP II• PILE CAP
10.
9 •
• 20 8. lm=3.28fl. Imm• 0 ,0391ncll
u o ..
I LAM[ 1
I ·:~::. ,-- - -ICCOl'llltC _____ -_sr_· -
• LANC t L_ ------t-c;.;ru----i==----_-_ -_-_-:::..-:::..::_ ....
I U..-3
LOHGITUOIMAL PDSl''TIOHSi-~ .....
NOTE!VDllCU. l .te:Kt: D OHTO THE STllWCTUfl(..AHO LONGITUOtHAL PO!l'nONS ME WIY-H AUll!fl€Jif(:( TO 1)4£ At:AR MOST AXLE
. u~
......
150mm PftOJECTION
001t11t1 CURii
x x Ii ,, j i ; ;
<;I ! ii!
~ e 0
.I "1 ,...
Im s 3 21ft, I "'Ill z0.0391n .

242
TRANSDUCER LOCATION NUMBER
o'';9 __ ~10!.___~lr7 __ ,16~-~·r~--,••:....--J:,....--l2:. ... ~!f---1r---T'--...;:...---; Figure 11. Vertical displacements at L/2 of north end span, load level 4, lane 1, longitudinal position 2.
E ~11----1-E
- DEFORE POST- TENSIONING
- - IMMEDIATELY AFTER POST-TENSIONING
- •- 1112 MONTHS AFTER POST- -TENSIONING t + ~O mm NEW ASPHALT!
--c
~._ _ __. __ _._ __ __._ __ .._ _ __JL----L----'----'---'---_. __ _._ _ __,
Figure 12. Vertical displacements at of north end span, load level 4, lane longitudinal position 2.
L/2
2' ~
~ z "'
TRANSDUCER LOCATION NUMBER
o'•---=~'ao:---9~""'"-r--~1~'----1r4--~'J'---~1~2--+----'F--::::""'l>--:::;;,.-~~ ..
~ 10 1---f---+---l---,~-~ ~-"·l--+-I' ~ _, ".. 0 _, 1~ 1---+---+---l---+-l--l--if---!·--jf---f--4--1---"---+---l---I .. 0
~ -- IMMEDIATELY AFTER POsT· "' TENSIONING >
20 t---!---t----t----t----'<;tl----t--1-+-f-- -- 1 112 MONTl!S AFTER POST· TENSIONING I+ ~Omm NEW ASPHALT I
2~'----'---'-----'----'---'---_. __ ........_ __ _._ __ '--_ _. __ ......_ _ __.
~ WHEEL POSITIONS r.;. (TRANSDUCER LOCATIONS l
Figure 13. Normalized vertical disp lacements compared to an orthotropic analysis at L/2 of north end span, load level 6, lane 1, longitudinal position 2 .
19 17 16 14 13 12 I I
0,
v i.:.--
z
~I ~ -
I - --._ - ---
\ I ' J
J *LOAD LEVEL #5 JUL 176 -
·~ +LOAD LEVLL #6 OCT./76
e ORTHOP POST TESTING ANALYSIS
I
0.6
08
I.cl
Figure 14. Normalized vertical displacements compared to an orthotropic analysis at L/2 of north end span, load level 6, lane 2, longitudinal position 2. ~
0 .2
0 .6 --
o.e --
7
J
--c
17 16 I~
Wl£EL P09TIONS
12
I TRANSDUCER LOCATIONS I J II IO 9 I
--+---I~-. LOAD LEVEL #5 JLL. f1'6 +LOAD LEVEL #5 OCT.176 e OATHOP POST TESTING
ANALYSIS
243
Tab le 1. Tandem weights of vehicle for testing. Table 2. Test results. Strain (x 10-6 ± 10) vehicle in longitudinal position 2 of lane 1 .
Vehicle Loading
Number Weight Rear Weight Front Demac Location
Load Level of Blocks Tandem (kg) Tandem (kg) Load Level 2 3 4 5 6
8 12400 12400 Before 2 22 18900 19100 Post-Tensioning 3 36 25700 25600 4 52 33100 33300 3 20 210 710 970 60 180 5 62 37800 37900 4 40 280 910 1140 180 270 6 72 42600 42600 5 30 310 1080 1470
1 kg= 2.20 lb. After
1 kg= 9.81 N Post-Tensioning
3 180 230 320 520 330 280 4 270 280 420 670 420 370 5 270 340 490 750 640 470 6 320 330 520 940 530 520
Table 3. Post-tensioning stress (kPa) on timber laminates during survey to date.
Station Number
Survey 2 3 4 5 6 7 8 9 10 11 12 13 14 15 16
( 1 day after I July 1976 Cloudy 870 760 870 760 760 680 650 710 490 760 680 760 850 850 810 810 21°C (70°FI
Oct. 1976 Overcast 520 490 490 460 460 490 520 490 490 520 490 540 520 540 490 490 16°C (60°F)
Jan. 1977 Snowing 410 430 430 410 380 410 410 410 410 410 410 410 430 490 460 430 -29°C (-20°FI
April 1977 Very Wet 460 520 540 520 490 460 490 490 490 460 460 490 490 520 490 490 18°C (65°F)
August 1977 Dry 410 430 430 410 410 390 410 410 410 410 410 410 430 460 430 380 21°C (70°F)
Nov. 1977 Cloudy 410 430 430 410 420 410 420 420 420 410 410 430 460 480 460 410 13°C (55°F)
1 kPa = 0.145 psi

244
transverse flexural stiffness considerably tended to produce closer agreement with the test results. It is believed that the transverse flexural rigidity is dependent upon the magnitude of the applied transverse moment. When high enough, this moment will begin to separate the laminations as the posttensioning stress is overcome. This creates the need for a non-linear analysis which not only accounts for this changing transverse flexural stiffness, but also considers the longitudinal discontinuities produced by the butt joints. However, a non-linear analysis is considered beyond the scope of this report.
Although not acceptable for design, the orthotropic analysis does indicate that the actual longitudinal modulus of elasticity of the Hebert Creek Bridge was drastically overestimated in the pre-testing analysis. A more realistic value of 7.6 x 10⁶ kPa (1.1 x 10⁶ psi), as compared to the former value of 10.3 x 10⁶ kPa (1.5 x 10⁶ psi), was needed to produce the overall magnitude of the deflections that were obtained from the field test data. As well, the orthotropic analysis indicates that the maximum transverse shear stress, which was used in the post-tensioning design, was conservative.
Conclusions
The post-tensioning performed on the Hebert Creek Bridge was more than adequate to establish the structure as capable of safely carrying the Ministry's testing vehicle, which represents the heaviest commercial vehicle weights in the province. The flexural capacity, as indicated by the maximum strains in Table 2, was almost doubled. The maximum strain of 940 micro strain provides a stress of 7170 kPa (1040 psi), assuming a modulus of elasticity of 7.6 x 10⁶ kPa (1.1 x 10⁶ psi) as indicated in the previous section. This stress corresponds to an assumed distribution width of at least 1650 mm (66 in.) for flexural design of one line of wheels. This is over twice the design width of 810 mm (32 in.) specified by AASHTO (J),(~) .
Coupled with this, the maximum stress of 7170 kPa (1040 psi) is less than the original design strength of the timber of 8300 kPa (1200 psi), and yet was induced by a vehicle load which produces a moment 60% larger than the AASHTO design moment.
Existing nail-laminated structures can be adequately upgraded by post-tensioning with a system equivalent to that provided on Hebert Creek. The fact that the structure now becomes overdesigned cannot be accommodated. Only by increasing the spans of the structures, which would only be practical in new bridges, could the extra strength be utilized.
Using this system in new structures, the additional capacity could be utilized by increasing spans and maintaining the present deck thicknesses. This would be most beneficial where multi-span structures are encountered, as it would decrease the number of supports required.
Confinement of the deck system in Hebert Creek and the reduced deflections has virtually eliminated the passage of moisture through the deck. This was confirmed by observing the structure under various climatic conditions during the collection of the data given in Table 3. The reduced deflections lower the tendency of the asphalt to break up which resists the penetration of moisture to the deck below.
Future Research
One of the most important considerations is the development of an analytical understanding of the post-tensioned structure. Presently, an investigation is being formulated, in cooperation with Queen's University in Kingston, Ontario, to establish an acceptable design procedure for new bridges. The program includes the testing of small and large-sr.;i l P. models to establish a better understanding of the flexural and torsional properties of the post-tensioned deck system. As well, further creep tests are to be performed to determine the effects of environmental changes on the post-tensioning forces.
The local failures of the timber bulkhead due to rotation of the steel anchorage plates indicate that a practical design is required which ensures dimensional stability and resists rotation. It is hoped that a continuous anchorage system can be developed which does not require extensive labour or machinery for installation. Along with this, investigations are underway to determine whether a high strength tendon can be manufactured which would not require external protection. This would require less work to install and give better peace of mind, as the physical protection provided at Hebert Creek is never totally dependable.
Finally, tests are to be performed to produce acceptable friction coefficients for design of various timbers. The tests will subject the timber to different environmental conditions and preservative treatments aimed at representing the field conditions.
References
1. AASHTO. Standard Specifications for Highway Bridges. Eleventh Edition, Washington, D.C., 1973.
2. Canadian Standards Association, S6-1974. Design of Highway Bridges. Ontario, 1974.
3. B. Bakht and R.C. Bullen. Analysis of Orthotropic Right Bridge Decks. Highway Engineering Computer Branch/B/15 (ORTHOP), Department of Environment, 1973.
4. U.S. Forest Products Laboratory. Wood Handbook: Wood as an Engineering Material. U.S. Department of Agriculture, Handbook No. 72, Washington, D.C., 1974.