transportu
DESCRIPTION
This presentation was part of my Freshman Business Experience start-up business project. My group came up with the idea toTRANSCRIPT

The 5 CommodoresKelsey Ellefson
James Sharp Albert Price
Shon DavidsonMollye Peters

Service Idea• Geared towards:
COLLEGE STUDENTS• Transportation to various college
campuses across the state of Indiana
• Students feel safe• Familiar drop-offs at Student
Unions• Fun ride

Why are we Unique?• Cheap fares
• College budget• Save money• Compared to competitors
• Specific Target Market• College students

Form of Business Ownership• Limited Partnership• Owners
• The 5 Commodores

Economy, Competitors, and Global Environment
• Gas Prices• Alternative fuels• Competition:
Greyhound, Peter Pan,
Coach• Compare global services to our business
• Makes our business better

Strength/Weaknesses of BusinessSTRENGTHS
• Affordable• Safe Alternative• Enjoyable atmosphere• Familiar company• Cleanliness• Networking
WEAKNESSES• Price of gas• Time• Size• Need to establish
reputation
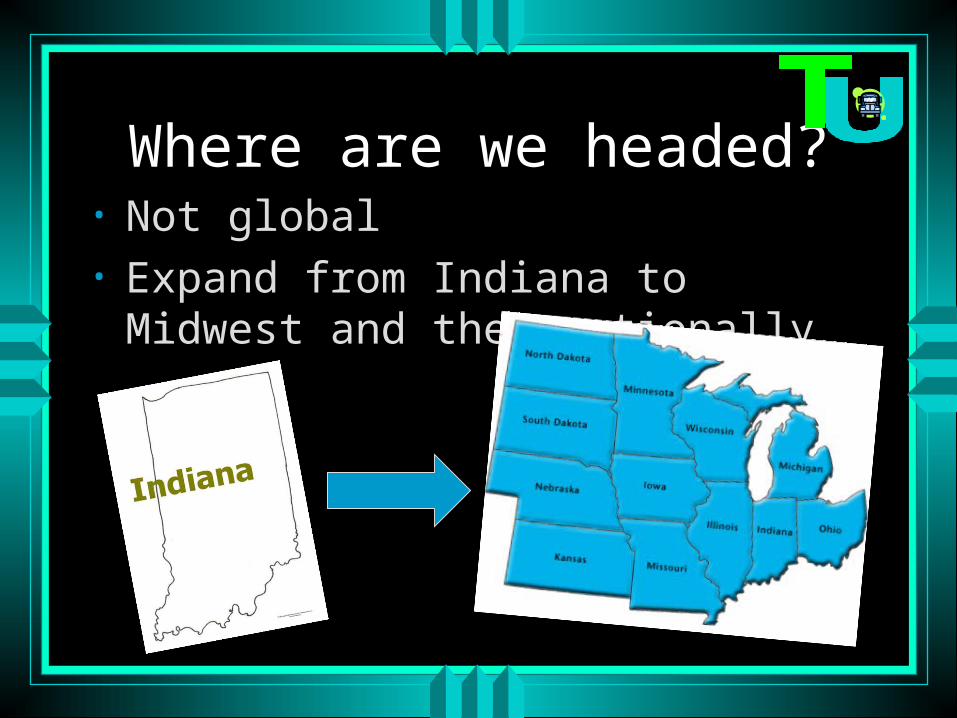
Where are we headed?• Not global• Expand from Indiana to Midwest and then
nationally

Who is our Market?
• Age: 18-24 M/F • College Students• Small Budget • Need transportation

Where’s the Locale?• Indiana• Hub in Indianapolis • Branches to University’s throughout
Indiana • 3-4 hours away
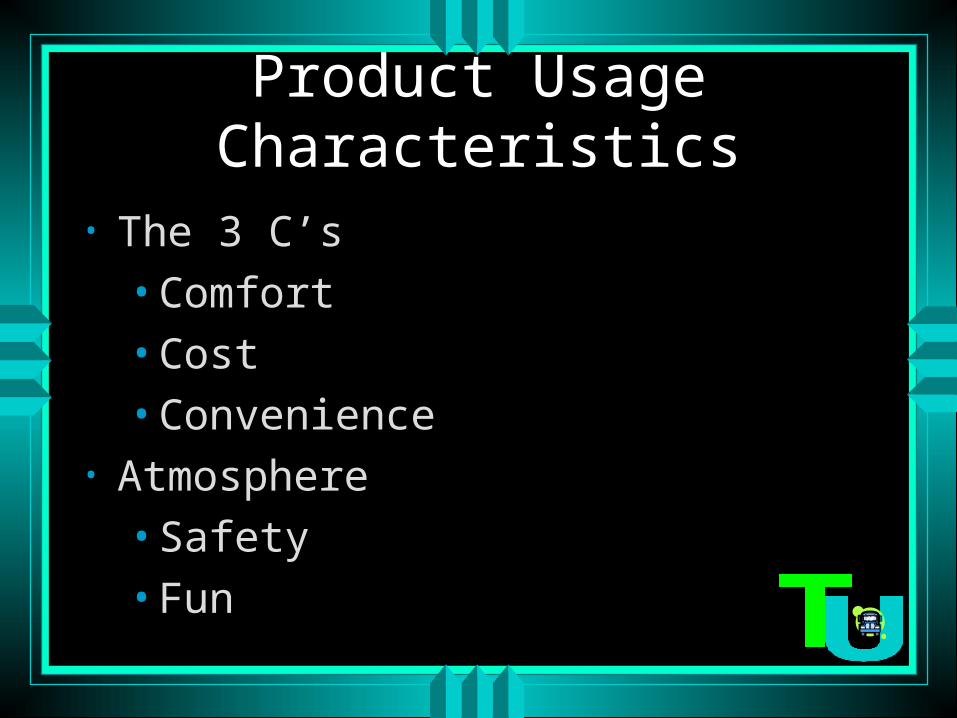
Product Usage Characteristics• The 3 C’s
• Comfort
• Cost
• Convenience• Atmosphere
• Safety
• Fun

Marketing Mix • SERVICE-Hip, cool form of transportation for
college students
• PRICE- $32 round trip (including food)• PLACE-A college campus near you!• PROMOTION-
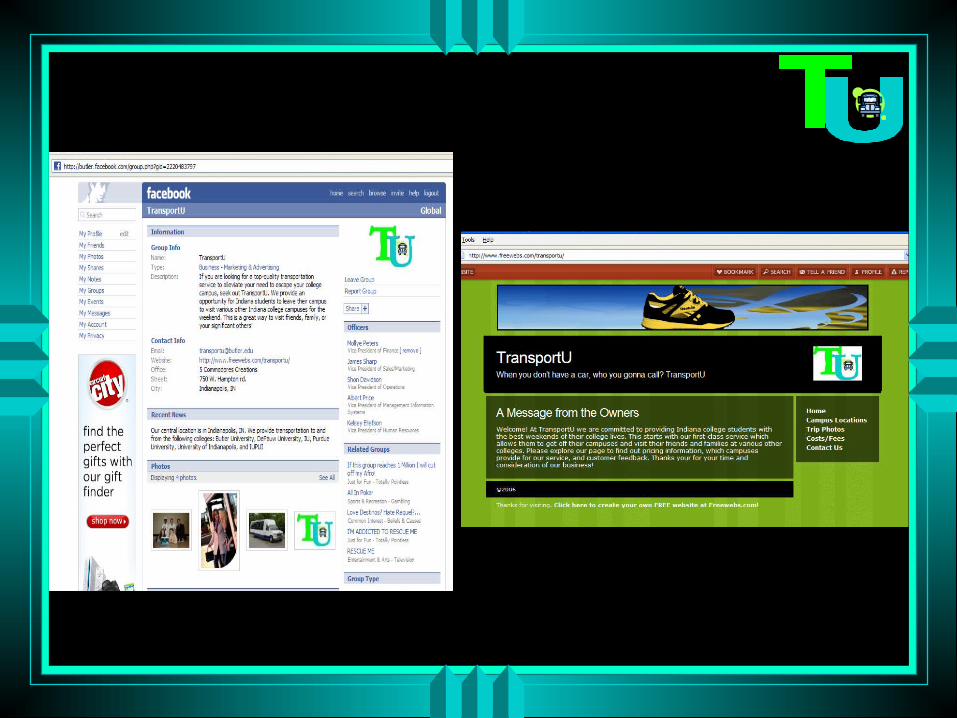
• Direct-Facebook, Website, Flyers, Newspapers, Radio, Memorabilia
• Indirect- Word of mouth

Mission Statement• We provide an alternative, low cost
transportation service specifically for college students. This allows them to travel conveniently and comfortably to other campuses within our network. At the same time, we provide them with a social atmosphere that is both fun and safe along the way.

Incentives “Driver of the Month”
Bonus Pay and Job Security
Happy, Excited Customer Who is Having Fun
Quality Excitement and Commitment
to Job
Increases Revenueand Loyalty Board of Directors
Workers/ Employees
Management Philosophy

Organizational Chart
Albert VP MIS
Mollye VP Finance
James VP Sales
Marketing
Shon VP Operations
Kelsey VP Human
Resources

Field Operations
Corporate Manager
MechanicsBus Drivers CashiersSupervisors

Production/OperationsNecessary Resources
• Buses• Bus Drivers• Mechanics• Fuel• Tires• Hub Location• Stops
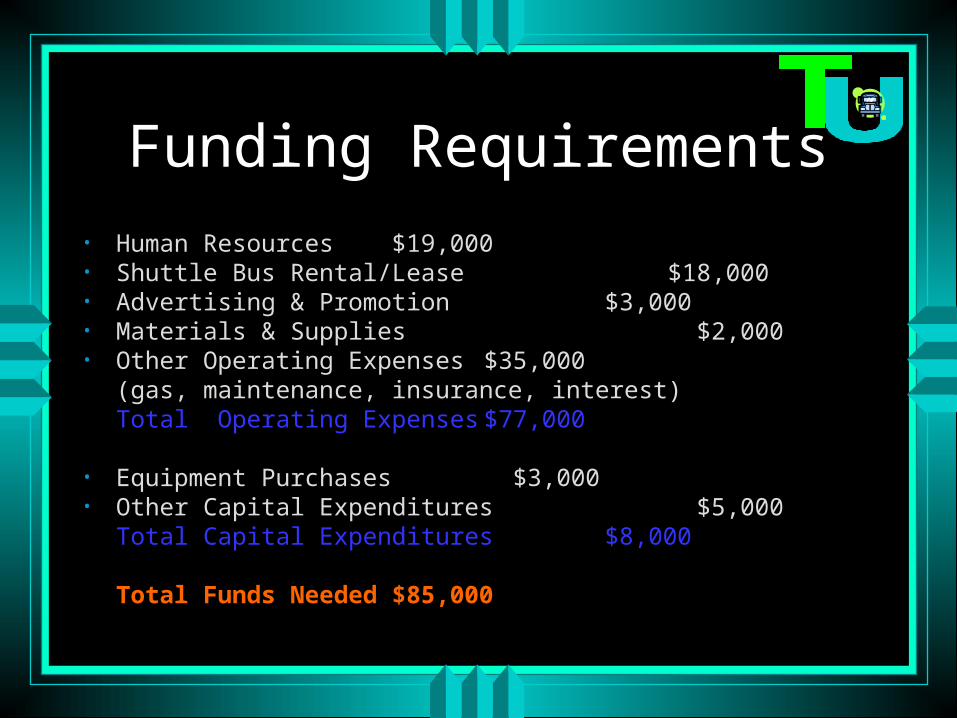
Funding Requirements
• Human Resources $19,000• Shuttle Bus Rental/Lease $18,000• Advertising & Promotion $3,000• Materials & Supplies $2,000• Other Operating Expenses $35,000
(gas, maintenance, insurance, interest) Total Operating Expenses $77,000
• Equipment Purchases $3,000• Other Capital Expenditures $5,000
Total Capital Expenditures $8,000
Total Funds Needed $85,000

Funding Sources
$6,000 , 20%
$18,000, 60%
$6,000, 20%
Total Owners' Equity
Total Limited Partners'EquityTotal Bank Borrowings

Start Up Funding Requirements
Name Amount
Salaries--Manager $1,000
Advertising $1,000
Rent/Renovations $1,320
Insurance $1,000
Miscellaneous (1% sales) $1,000
Equipment
Computers & Software $2,000
Other Capital Expenditures $1000
Total $7,320

Profits and Sales 2007-2008 Fiscal Year
($20,000.00)
$0.00
$20,000.00
$40,000.00
$60,000.00
$80,000.00
$100,000.00
$120,000.00
Start-Up Quarter 1 Quarter 2 Quarter3 Quarter 4 Total
Sales
Total Expenses
Profit

Profits and Sales 2007-2008 Fiscal Year
($2,000.00)
$0.00
$2,000.00
$4,000.00
$6,000.00
$8,000.00
$10,000.00
$12,000.00
$14,000.00
Sep Oct Nov Dec Jan Feb Mar Apr May Jun Jul Aug
Sales
Total Expenses
Profit

Fixed and Variable Expenses for 2007-2008 Operational Year
Total Expenses $76,335.28
Fixed Costs
Name Amount
Managers Salaries $13,000
Rent/Renovations $17,160
Insurance $13,000
Total $43,160
Variable Cost
Name% of Sales Amount
Drivers Salaries 0 $5,984
Maintenance & Repairs 4 $3,941
Total 12 $9,925
Other Expenses $23,250

Fixed and Variable Expenses for 2007-2008 Operational Year
$0.00
$10,000.00
$20,000.00
$30,000.00
$40,000.00
$50,000.00
$60,000.00
$70,000.00
$80,000.00
$90,000.00
Start Up Quarter 1 Quarter 2 Quarter 3 Quarter 4 Total
Fixed Costs
Variable Costs
Other Expenses
Total Expenses

Division of Total Expenses
56.54%
13.00%
30.46%
Fixed CostsVariable CostsOther Costs

Cash Flow StatementDescription
Start Up
Quarter 1
Quarter 2
Quarter 3
Quarter 4 Total
Beginning Cash Balance $0 $21,680 $26,806 $31,964 $44,566 $0
Initial Equity from Owner $6,000 $0 $0 $0 $0 $6,000
Initial Equity from Limited Partners $18,000 $0 $0 $0 $0 $18,000
Income/Loss ($5,320) $5,126 $9,658 $12,603 $127 $22,193
Bank Borrowings $6,000 $0 ($4,500) $0 $0 $1,500
New Equipment ($3,000) $0 $0 $0 $0 ($3,000)
Ending Cash $21,680 $26,806 $31,964 $44,566 $44,693 $44,693

Ratios• Industry*
• ROS= 7.0%• ROE= 47.2%
• TransportU• ROS= 22.3%• ROE= 92.5%
*Industry and Financial Consulting Services . (2005). Industry norms & key business ratios (p.82). New Jersey: Dun & Bradstreet, Inc.
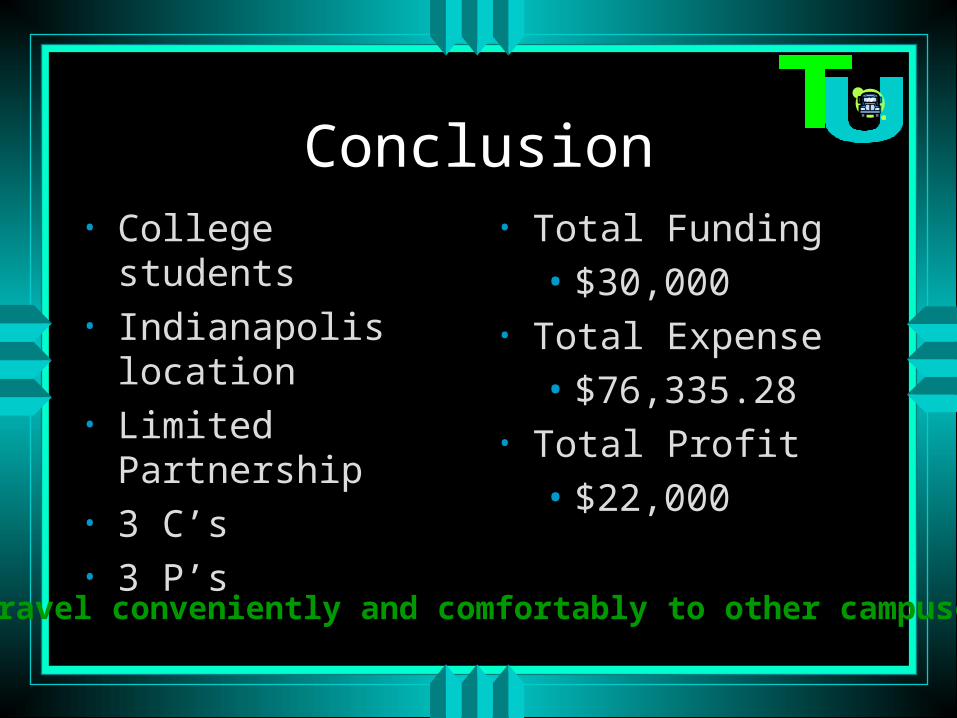
Conclusion• College students• Indianapolis location• Limited Partnership• 3 C’s• 3 P’s
• Total Funding• $30,000
• Total Expense• $76,335.28
• Total Profit• $22,000
“Travel conveniently and comfortably to other campuses”