transportation research record 1109 69 a...
TRANSCRIPT

TRANSPORTATION RESEARCH RECORD 1109 69
A Systems Approach for Design and Evaluation of Alternatives for Concrete Pavement Rehabilitation B. FRANK McCULLOUGH AND WAHEED UDDIN
To design and evaluate concrete pavement rehabilitation alternatives effectively It is necessary to consider the existing condition of pavements and to establish decision criteria for triggering the necessary pavement maintenance or rehabilitation actions. A methodology based on a systems approach to designing and evaluating cost-effective alternatives for concrete pavement rehabilitation is presented. The Pavement Rehabilitation Design System (PRDS-1) computer program Incorporates this methodology. The program uses mechanistic analysis to generate numerous rehabilitation design alternatives and perform economic evaluation. The evaluation technique is sensitive to both the performance and the cost of the competing alternatives. Resurfacing alternatives include bituminous concrete, jointed portland cement concrete, and continuously reinforced concrete. The PRDS-1 program was used to evaluate typical concrete pavements for overlay thicknesses and associated life-cycle costs. A comparison of resurfacing alternatives with several restoration alternatives indicates that In certain cases restoration alternatives are more economical.
A large portion of the highway infrastructure of the United States is currently in place. Heavy traffic, environmental effects, and material properties and their interactions are primary causes of deterioration of the existing highway systems, the result of which is future need for significant pavement rehabilitation. Pavement rehabilitation is closely associated with pavement maintenance practices and costs. Rehabilitation alternatives for concrete pavements can be categorized as overlay of existing surface, restoration of the pavement structure, recycling, and reconstruction. To select cost-effective pavement rehabilitation strategies it is necessary to evaluate the existing condition of the pavement design and present and future overlay and maintenance requirements and make economic assessments of various design strategies.
In a recent study for the Pennsylvania Department of Transportation (PennDOT), the systems approach was used to develop a comprehensive computer program for the rehabilitation design of flexible and rigid pavements. The primary objectives were to identify and review alternate resurfacing strategies, examine restoration techniques, and develop a method of selecting cost-effective alternatives. The development and implementation of a computer program, Pavement Rehabilitation Design System, Version 1 (PRDS-1), for rehabilitation design of flexible and rigid pavements is described. An economic comparison of resurfacing and restoration alternatives is also included.
B. F. McCullough, Department of Civil Engineering, University of Texas at Austin, Austin, Tex. 78712. W. Uddin, ARE, Inc., 2600 Dellana Lane, Austin, Tex. 78746.
REVIEW OF ALTERNATIVE REHABILITATION STRATEGIES
An extensive literature review to examine the state of the art in alternate resurfacing techniques and the use of new and nonconventional materials (1) showed that rehabilitation strategies for concrete pavements may be separated into four broad categories: overlay of existing surface, reconditioning and recycling of existing surface, restoration of the pavement structure, and reconstruction.
Constructing an overlay on the existing pavement is the traditional approach to rehabilitation. The addition of a new layer of material, depending on its thickness, can be considered a major structural improvement. Bond breakers, construction fabrics, and special overlay materials have been used to eliminate or reduce the severity of reflective cracking.
Reconditioning the existing surface involves reworking the pavement surface. by cold milling, heater planer, or heater scarifier to remove surface irregularities for a smoother riding surface, to improve drainage, or to correct local ·skid resistance problems. Because of a combination of economic and material availability factors, a great deal of attention has recently been placed on recycling pavement materials. A large variety of recycling techniques has evolved (2, 3).
Restoration of concrete pavements is another promising way to improve the structural condition and extend the life of a pavement. Pavement restoration is the application of a set of special procedures to repair all visible and known manifestations of distress. For the purpose of this paper, concrete pavement restoration (CPR) is defined as a rehabilitation methodology that does not include any overlay, resurfacing, or reconstruction. Examples of restoration techniques are joint sealing and repair, undersealing and slab jacking, diamond grinding, cold milling, concrete and asphalt patching, and concrete slab replacement. Typical kinds of rigid pavement distress that can be treated with concrete pavement restoration techniques are surface defects (scaling, raveling, polishing, depression, and punch-outs); cracking (longitudinal, transverse, and block); and joint-related distress (faulting, spalling, D-cracking, and blowups).
The fourth option to resurfacing is to remove the pavement structure and reconstruct. This alternative may be applicable to severely distressed pavement sections and used to correct drainage problems or to correct or change the pavement's geometrics or grade line. In reality, complete reconstruction of a pavement requires the design and construction of a new pavement structure and is therefore beyond the scope of this study.
70
PRDS METHODOLOGY
The systems approach to pavement rehabilitation design, developed at the University of Texas, formed the methodology for the evaluation and analysis procedure (4-6) developed in the present study (1). The systems methodology provides a user with criteria for selecting an optimal pavement rehabilitation strategy. Recent research at the University of Texas has provided a computer model, the Rigid Pavement Rehabilitation Design System (RPRDS-1) (6, 7). This model uses elastic layer theory to compute stresses and strains in the various pavement layers. These data are then used to evaluate expected pavement life. _Life-cycle costs are computed and reduced to present worth for economic comparison of alternative strategies. In the present study, this program was extended to include flexible pavement analysis. The revised program is titled the Pavement Rehabilitation Design System (PRDS-1).
Extensive test runs were made on the PRDS-1 program to verify the analysis of concrete pavements. The sensitivity of the design selection to traffic delay cost variables and values of Young's modulus was studied to verify the reasonableness of the model. The results of these runs were used for implementation.
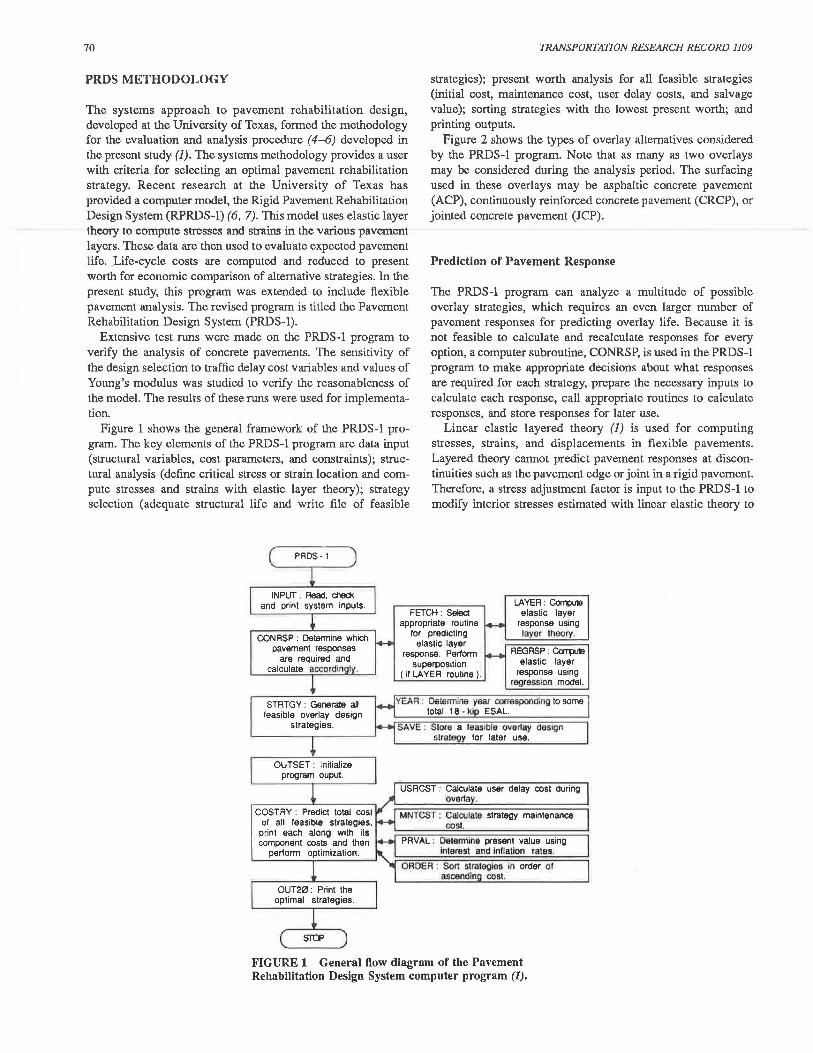
Figure 1 shows the general framework of the PRDS-1 program. The key elements of the PRDS-1 program are data input (structural variables, cost parameters, and constraints); structural analysis (define critical stress or strain location and compute stresses and strains with elastic layer theory); strategy selection (adequate structural life and write file of feasible
PRDS-1
TRANSPORTATION RESEARCH RECORD 1109
strategies); present worth analysis for all feasible strategies (initial cost, maintenance cost, user delay costs, and salvage value); sorting strategies with the lowest present worth; and printing outputs.
Figure 2 shows the types of overlay alternatives considered by the PRDS-1 program. Note that as many as two overlays may be considered during the analysis period. The surfacing used in these overlays may be asphaltic concrete pavement (ACP), continuously reinforced concrete pavement (CRCP), or jointed concrete pavement (JCP).
Prediction of Pavement Response
The PRDS-1 program can analyze a multitude of possible overlay strategies, which requires an even larger number of pavement responses for predicting overlay life. Because it is not feasible to calculate and recalculate responses for every option, a computer subroutine, CONRSP, is used in the PRDS-1 program to make appropriate decisions about what responses are required for each strategy, prepare the necessary inputs to calculate each response, call appropriate routines to calculate responses, and store responses for later use.
Linear elastic layered theory (1) is used for computing stresses, strains, and displacements in flexible pavements. Layered theory cannot predict pavement responses at discontinuities such as the pavement edge or joint in a rigid pavement. Therefore, a stress adjustment factor is input to the PRDS-1 to modify interior stresses estimated with linear elastic theory to
INPUT: Read, check and print system inputs.
CONRSP : Determine which pavement responses
are required and calculate aCA;ordln I .
FETCH : Select appropriate routine
tor predicting elastic layer
response. Perform superposition
LA YER : ConllUfB elastic layer
response using layer 1heory.
REGRSP : Carl)UE elastic layer
response using regresslon model.
STRTGY : Generale aU feasible overlay design
strategies.
OUTSET : Initialize program ouput.
COSTRY : Predict total cosl of all feasible strategies,
print each along with its component costs and then
perform optimization.
OUT20 : Print the optimal strategies.
(ii LAYER routine).
tore a feasible overlay design s1rategy for later use.
USRCST : Calculate user delay cos1 during ·overla .
MNTCST : Calculate strategy maintenance cost.
PRVAL : Delermine present value using Interest and lnllallon rates.
ORDER ; Sort strategies in order of ascendln cost.
FIGURE 1 General flow diagram of the Pavement Rehabilitation Design System computer program (1).

McCullough and Uddin
EXlST'ING PAV91ENT
JCP
FIRST CNER..AY
..... · · IC,
...• . ··IC,
AC ;::·:: •••••• • JCP
·· · · a=o>
Bonded • • • ········· AC JCP
Unbonded - • •••• • - - · · ·AC JCP
Unbonded - - - - ·· ·····-AC a=o>
.. AC
AC :·'.:::'. .. ..... JCP
. a=o>
Bonded ······· ·····AC a=o>
Unbonded -- - · • - ······AC a=o>
Unbonded ······ ······AC JCP
FIGURE 2 Overlay design strategies available In PRDS-1 with regard to existing types of pavement and overlay.
represent the critical stress near an edge or corner of rigid pavements. The assumed loading and pavement configurations for calculating these stresses are shown in Figure 3.
To develop these stress factors, solutions based on the finite element method were used to adjust interior stresses to critical stresses for each type of rigid pavement-overlay combination permitted by the PRDS-1 program. A list of the critical stress factors is included in the PRDS-1 user's manual (8). The SAP-2 finite element computer program (9) was used to develop these factors using the following procedure:
Simulated 18 - kip Axle Load
71
• Interior responses were determined using SAP-2, • Critical responses near an edge or corner were determined
with SAP-2, and • The critical stress adjustment factor was computed as the
ratio between the critical stress and the interior stress.
Prediction of Fatigue Life
Fatigue equations for load-associated cracking are used in the PRDS-1 program to determine the number of equivalent single axle load (ESAL) applications that a pavement structure can carry before it reaches some limiting failure criterion. This is accomplished by relating the critical stress in a rigid pavement, or critical strain in a flexible pavement, to the number of 18-kip ESAL applications needed to reach a specified level of cracking. Structural capacity of pavement is calculated in terms of remaining life, which requires the assumption that Miner's damage hypothesis is valid for highway pavements .
PCC Fatigue Equations
Two fatigue equations (Figure 4) are used in the PRDS-1 program. These equations were developed from an analysis of AASHO Road Test data and data from condition surveys of rigid pavements in Texas (10-12). These equations are an improvement over the original portland cement concrete (PCC) fatigue equation developed for the Federal Highway Administration by ARE, Inc. (13 ).
The equation for PCC surface layers uses a failure criterion of a cracking index of 50 ft per 1,000 ft2. In its development seasonal variation in subgrade strength and a simulation of actual axle loadings used at the AASHO Road Test were considered. For overlaid PCC pavements, the second PCC equation is used. This equation is an adjustment of the first equation based on results that showed that overlaid pavements in Texas were far exceeding their predicted fatigue life (14). The adjusted equation is used in the PRDS-1 program for predicting the life of overlaid rigid pavements with PCC shoulders.
Simulated 18 - kip Axle Load
SUBBASE SUlBl\SE !--~~~~~~~~~~~~~~
9..ffiP.A[~ SB3AAO:
(a) Interior Condition ( b) Edge Condition (With PCC Shoulder)
FIGURE 3 Interior and edge stress conditions for one of the overlay strategies considered in the PRDS-1 (an existing PCC pavement with an unbounded PCC overlay with PCC shoulders); the ratio of edge to interior stress is used for adjusting stress predicted by elastic layer theory (7).

72
I/)
c:
~ .E ~
Cl)
z I/)
c: 0
~ <d a.. a.
100
10
Taute Equation (.! .. ~)
Overlaid Pavements
(I )3 .2
~ 8 - 43000 O' c
TRANSPORTATION RESEARCH RECORD 1109
<: Taute Equation (..!.!) _J
<: CJ') Non - Overlaid Pavements ARE Equation (~ UJ
a. :.i:
II )3.0 N1 a • 46000 \Zl'c II )3.21
N1 B • 23440 'C c:o c
2 4 6 8 10
Ratio of Concrete Flexural Strength (f) to Critical Stress in Concrete ( ac)
FIGURE 4 Comparison of PCC fatigue equations.
Asphalt Concrete Fatigue Equation
The equation used in the PRDS-1 program to predict fatigue life was developed from laboratory fatigue tests and adjusted with data obtained from the AASHO Road Tests for asphalt concrete pavements with less than 10 percent cracking in the wheelpath area (15, 16). This fatigue equation is expressed as
log N1 = 15.947 - 3.291 log (e/10-6) - 0.854 log (E*/lfY)
where
N1 = number of 18-kip ESAL applications to "failure," e = maximum asphalt concrete tensile strain, and
E* = asphalt concrete complex modulus (psi).
Year Corresponding to Overlay Placement
Overlay placement times are specified in the PRDS-1 program in terms of percentage remaining life of the pavement structure. To compute the time required to reach a specific level of remaining life, the program first computes the allowable number of applications to failure using the appropriate fatigue equation. The amount of traffic carried by a pavement to a level of remaining life is computed by multiplying the allowable number of applications by the remaining life value. The time required to apply this amount of traffic is computed using the traffic growth model and the initial traffic level and growth rate specified.
Design Constraints
The PRDS-1 program limits the number of thickness design alternatives by omitting those that provide excessive lifetimes. When a feasible thickness design has been generated, no further designs in which the overlay thickness is greater are considered The primary design constraints used in the PRDS-1 to determine feasible overlay strategies are length of analysis period, minimum time between overlays, maximum period of heavy maintenance, and maximum total overlay thickness.
Cost Models
The PRDS-1 program includes the following models for cost analysis of feasible strategies: traffic delay cost, overlay construction cost, distress and maintenance cost, value of extended life, and salvage value. All costs are discounted to present worth to allow for economic comparison of alternatives.
Traffic Delay Cost
The traffic delay model computes user delay time and traffic delay costs associated with traffic passing through an overlay zone. The model used in the PRDS-1 program was originally developed by Scrivner et al. (17). The model first predicts the delay times incurred by each vehicle as it passes through the restricted overlay zone. Daily distributions of traffic for rural and urban areas as well as the incremental user delay costs per unit Lime are built into the routine. These, along with the user-

McCullough and Uddin
specified traffic volumes and periods during which the delays will occur, are used to determine the total overall traffic delay cost. The cost is then converted to a per-square-yard basis and discounted to present worth.
Overlay Construction Cost
The components of the overlay construction cost model are site establishment cost, surface preparation cost, overlay and shoulder placement cost, and steel reinforcement cost. Each of these cost components is determined on a per-square-yard basis and summed to get total overlay construction costs.
Distress and Maintenance Cost Model
The PRDS-1 program predicts distress using rates of distress development specified by the user. The life of a pavement overlay strategy is divided into several periods as shown in Figure 5. The first is the zero distress rate period between 0 and 20 percent of the overlay life. Typically, few severe distress manifestations will occur during this period. The second, between 20 and 60 percent of the overlay life, is the initial distress rate period during which distress develops at a low but significant rate. The third period, between 60 and 100 percent of the overlay life, represents a secondary rate of distress development, which will occur up to the end of the overlay fatigue life. From this point to the maximum allowable number
100
80
73
of years of heavy maintenance, the periods consist of I-year intervals during which distress development should increase geometrically. The user, then, must define values for the initial distress rate, the secondary distress rate, and the distress rate for each year up to the maximum allowable number of years of heavy maintenance. The user also specifies the cost of repairing a typical manifestation of distress or defect.
With this information, the program increments its way through the life of a strategy, multiplying the number of defects that occurs during a given year by the cost of repairing them. These costs are then discounted to present worth. When the end of the analysis period is reached, these yearly costs are accumulated to give the total maintenance cost of the strategy.
Value of Extended Life
This quantity represents a future return cost that results from the additional years of service past the end of the analysis period that some strategies will provide because they are "overdesigns." Provision is made in the PRDS-1 for the user to assign some value on a per-square-yard basis to each additional year of service.
Salvage Value
Salvage value accounts for the value of the overlay structure after it reaches the end of its life. This does not necessarily
a.. () a: ()
c
Numbers indicates rates of defect development (number/mile/year)
..... (J) a. (/)
u (J)
~ Cl
60
40
20
0
Zero Distress ln~ial Distress Rate Rate • Period Pariod
50
Secondary Distress Rate Period
Period of Heavy Maintenance
5
100
8
Percent of CRCP Life Predicted by Fatique Analysis FIGURE 5 Normalized graph of the development of CRCP defects in Texas (6).
40
16
150

74
correspond to the end of the analysis period because some strategies may last significantly longer. Salvage value is computed by multiplying the total cost of overlay construction by a percentage specified by the user and discounting to present worth. Only the value of overlay construction cost is considered. Original pavement construction cost need not be considered because it is the same for all strategies.
Economic Analysis and Ranking
The net present value model is used to account for the time value of money. The discount rate is used to calculate present worth of future costs. This rate is somewhat less than the prime interest rate offered for investments and represents the "true" growth in the value of money. The PRDS-1 program sorts the top 20 strategics in order of increasing present worth of total cost.
IMPLEMENTATION OF THE PRDS-1 PROGRAM
Input values were selected for Pennsylvania conditions and alternative strategies were analyzed for several cases of flexible and rigid pavements. Details of various sets of runs of the PRDS-1 program are presented in project reports (1, 9). These analyses provided valuable information on the behavior of the model for a variety of conditions. This information was used to make a detailed study of alternative overlay strategies for four pavement types: continuously reinforced concrete pavements (CRCP), jointed concrete pavements (JCP), flexible pavement with an asphalt-stabilized base, and flexible pavement with a granular base.
A four-lane highway was considered for these examples. The results of CRCP and JCP examples are presented in this paper. A factorial design was used to investigate the influence of traffic volume and subgrade types. The user of this program should take care in the assignment of 18-kip ESAL applications. The AASHTO traffic equivalency factors for tandem axles can be appreciably higher on rigid pavements than are those for axles of the same weight on flexible pavements. Subgrade modulus was analyzed at three levels: low (8,000 psi), medium (14,000 psi), and high (20,000 psi).
CRCP Analysis
A summary of results for the subgrades of 14,000 psi is given in Table 1. At low traffic levels, AC overlays are generally the most cost-effective, followed by PCC overlays with flexible shoulders. There is a significant cost difference factor of approximately 2.5 between AC and PCC overlay strategies at low traffic levels. The cost is generally lower when the first overlay is placed at 0 percent remaining life.
At medium traffic levels, AC overlays are still generally the least expensive. The difference between AC and PCC overlays is still significant but to a lesser degree than was the case for low traffic levels. A cost ratio of 1.78 was obtained at the low subgrade level. The timing of the first overlay is not particularly significant. Tf overlay placement is postponed because
TRANSPORTATION RESEARCH RECORD 1109
of the effect of the discount rate on the cost of additional overlay thickness, AC overlay thickness is sensitive to both the timing of the first overlay and the subgrade conditions; PCC overlay thickness is not sensitive to these two variables.
User delay cost is not very significant at medium traffic levels. At high traffic levels, user delay cost overrides all other cost considerations. Hence, the optimal strategy is to build an overlay to last the entire period at the start of the analysis period.
J CP Analysis
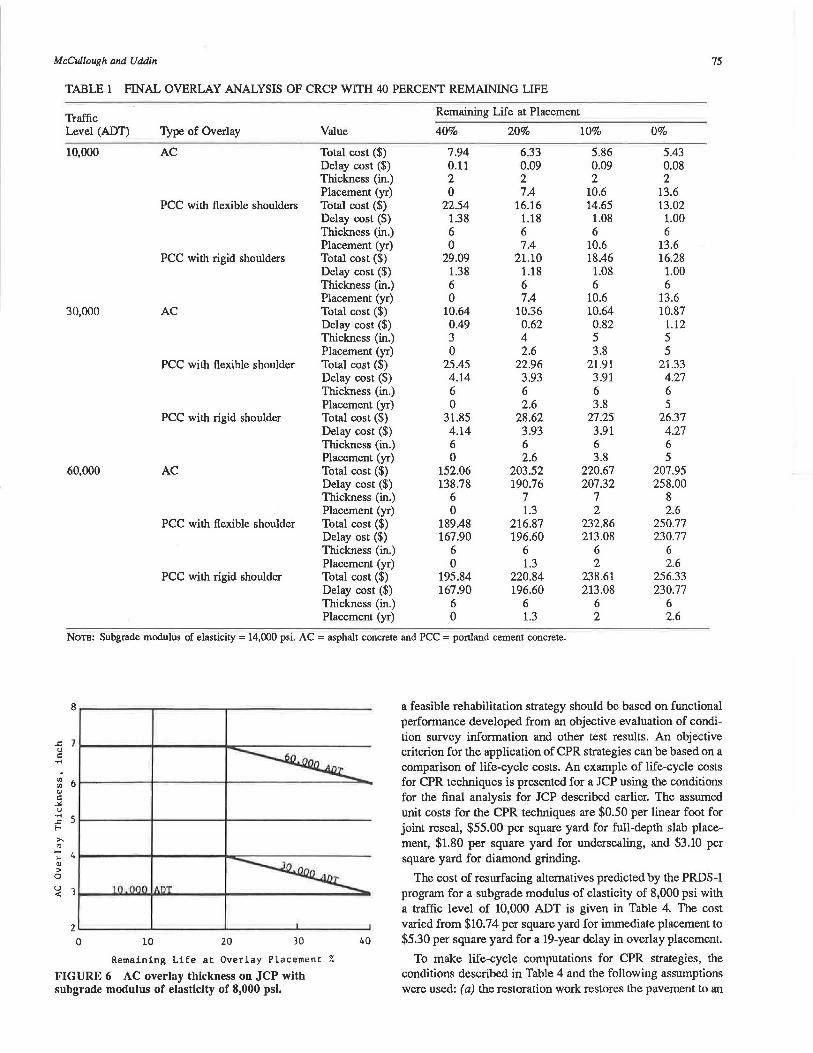
At all traffic levels, AC overlays are generally significantly cheaper than PCC overlays with AC-to-PCC cost ratios between 2 and 4. At low traffic levels, the influence of both subgrade condition and time of first overlay placement is not significant for AC overlay thickness. The timing of the first overlay, however, has a significant effect on the total rehabilitation cost. An increase of 79 percent in total overlay cost can result if the overlay is placed at 20 percent remaining life instead of 0 percent because costs are discounted over a longer period. Delay costs are not significant at low traffic levels.
An example of overlay thickness versus remaining life for a low subgrade modulus is shown in Figure 6. At medium traffic levels, both subgrade condition and timing of first overlay placement have some influence on the selected AC overlay thickness. Postponing the overlay to remaining life values lower than tht< initial condition can result in an increase in total overlay cost of up to 23 percent.
Delay costs are more significant when the interaction between subgrade and overlay timing results in increased overlay thickness and can be up to 17 percent of the total overlay cost. At 0 percent initial remaining life, subgrade condition does not have a significant effect on overlay thickness because of the required increase in thickness. The poor condition of the existing pavement causes the user delay costs to be fairly significant. At high traffic levels it is generally cheaper to place the first overlay as soon as possible; increased overlay thickness and even higher traffic levels result in higher total overlay cost if the overlay is delayed.
Cost-Effective Overlay Strategies
The cost-effective overlay strategies for Pennsylvania conditions are given in Table 2 for continuously reinforced concrete pavement and in Table 3 for jointed concrete pavement. These recommendations are based on the conditions and assumptions used in the analysis. Strategies for specific projects should be based on an analysis of existing conditions for the project.
CONCRETE PAVEMENT RESTORATION AS A REHABILITATION STRATEGY
Concrete pavement restoration (CPR) alternatives to resurfacing can be based on economic or policy considerations. The PRDS-1 program cannot directly consider life-cycle costs for restoration without an overlay. Criteria for considering CPR as
McCullough and Uddin 75
TABLE 1 FINAL OVERLAY ANALYSIS OF CRCP WITH 40 PERCENT REMAINING LIFE
Traffic Remaining Life at Placement
Level (ADT) Type of Overlay Value 40% 20% 10% 0%
10,000 AC Total cost ($) 7.94 6.33 5.86 5.43 Delay cost ($) 0.11 0.09 0.09 0.08 Thickness (in.) 2 2 2 2 Placement (yr) 0 7.4 10.6 13.6
PCC with flexible shoulders Total cost ($) 22.54 16.16 14.65 13.02 Delay cost ($) 1.38 1.18 1.08 1.00 Thickness (in.) 6 6 6 6 Placement (yr) 0 7.4 10.6 13.6
PCC with rigid shoulders Total cost ($) 29.09 21.10 18.46 16.28 Delay cost ($) 1.38 1.18 1.08 1.00 Thickness (in.) 6 6 6 6 Placement (yr) 0 7.4 10.6 13.6
30,000 AC Total cost ($) 10.64 10.36 10.64 10.87 Delay cost ($) 0.49 0.62 0.82 1.12 Thickness (in.) 3 4 5 5 Placement (yr) 0 2.6 3.8 5
PCC with flexible shoulder Total cost ($) 25.45 22.96 21.91 21.33 Delay cost ($) 4.14 3.93 3.91 4.27 Thickness (in.) 6 6 6 6 Placement (yr) 0 2.6 3.8 5
PCC with rigid shoulder Total cost ($) 31.85 28.62 27.25 26.37 Delay cost ($) 4.14 3.93 3.91 4.27 Thickness (in.) 6 6 6 6 Placement (yr) 0 2.6 3.8 5
60,000 AC Total cost ($) 152.06 203.52 220.67 207.95 Delay cost ($) 138.78 190.76 207.32 258.00 Thickness (in.) 6 7 7 8 Placement (yr) 0 1.3 2 2.6
PCC with flexible shoulder Total cost ($) 189.48 216.87 232.86 250.77 Delay ost ($) 167.90 196.60 213.08 230.77 Thickness (in.) 6 6 6 6 Placement (yr) 0 1.3 2 2.6
PCC with rigid shoulder Total cost ($) 195.84 220.84 238.61 256.33 Delay cost ($) 167.90 196.60 213.08 230.77 Thickness (in.) 6 6 6 6 Placement (yr) 0 1.3 2 2.6
NoTB: Subgrade modulus of elasticity = 14,000 psi. AC = asphalt concrete and PCC = portland cement concrete.
8
.r:. 7 u c .... .
rJl 6 rJl <lJ c
-"" u ..... s .r:. ... >-"' ...... 4 .... <lJ > a u ) <
2 0 10 20 30
Remaining Life at Overlay Placement %
FIGURE 6 AC overlay thickness on JCP with subgrade modulus of elasticity of 8,000 psi.
40
a feasible rehabilitation strategy should be based on functional performance developed from an objective evaluation of condition survey information and other test results. An objective criterion for the application of CPR strategies can be based on a comparison of life-cycle costs. An example of life-cycle costs for CPR techniques is presented for a JCP using the conditions for the final analysis for JCP described earlier. The assumed unit costs for the CPR techniques are $0.50 per linear foot for joint reseal, $55.00 per square yard for full-depth slab placement, $1.80 per square yard for undersealing, and $3.10 per square yard for diamond grinding .
The cost of resurfacing alternatives predicted by the PRDS-1 program for a subgrade modulus of elasticity of 8,000 psi with a traffic level of 10,000 ADT is given in Table 4. The cost varied from $10.74 per square yard for immediate placement to $5.30 per square yard for a 19-year delay in overlay placement.
To make life-cycle computations for CPR strategies, the conditions described in Table 4 and the following assumptions were used: (a) the restoration work restores the pavement to an

76 TRANSPORTATION RESEARCH RECORD 1109
TABLE 2 RECOMMENDATIONS FOR ECONOMICAL OVERLAY STRATEGIES OF CRCP BASED ON PRDS-1 ANALYSIS
Subgrade Condition (elastic modulus)
Low (8,000 psi)
Medium (14,000 psi)
High (20,000 psi)
Traffic Level
Low
AC overlay, intermediate placement delay
AC overlay, long placement delay
AC overlay, long placement delay
Medium
AC overlay, immediate placement
AC overlay, moderate placement delay
AC overlay, moderate placement delay
High
PCC overlay or AC overlaya, immediate placement
AC overlay or PCC overlay, immediate placement
AC overlay, immediate placement
NoTB: Moderate placement delay-optimum strategy calls for routine maintenance for ~ years then placement of overlay; lnte!Tilediate placement delay--optirnum strategy calls for routine maintenance for 10 years then placement of overlay; long placement delay--optirnurn strategy calls for routine maintenance for 15 years then placement of overlay. Analysis included user delay costs. Initial remaining fatigue life of existing pavement was 40 percent. aFor high traffic levels AC and PCC overlay costs are very close. The overlay listed first had the lowest predicted present cost.
TABLE 3 RECOMMENDATION FOR MOST ECONOMICAL OVERLAY STRATEGIES FOR JOINTED CONCRETE PAVEMENTS BASED ON PRDS-1 ANALYSIS
Subgrade Condition (elastic modulus)
Low (8,000 psi)
Medium (14,000 psi)
High (20,000 psi)
Traffic Level
Low
AC overlay, long placement delay
AC overlay, long placement delay
AC overlay, long placement delay
Medium
AC overlay, moderate placement delay
AC overlay, intermediate placement delay
AC overlay, intermediate placement delay
High
AC overlay, immediate placement
AC overlay, immediate placement
AC overlay, immediate placement
NoTB: Moderate placement delay--optirnurn strategy calls for routine maintenance for 5 years then placement of overlay; inte!Tilediate placement delay--optirnum strategy calls for routine maintenance for 10 years then placement of overlay; long placement delay--optirnum strategy calls for routine maintenance for 20 to 30 years then placement of overlay. Initial remaining fatig11e life of existing pavement was 40 percent. Analysis included user delay costs.
acceptable level of service for the duration of the analysis period, (b) delay costs computed for application of an immediate overlay by PRDS-1 are applicable for the restoration work, (c) all restoration work is performed immediately, and (d) user delay cost equals $0.16 per square yard. The following level of restoration work is assumed.
The computation of restoration cost is as follows:
Surface area of section = 1 mi (5,280 ft) x 24 ft/9 = 14,080 yd2,
Joint resealing cost = 80 joints x 24 ft/joint x $0.5/ft = $960,
• There are three conditions for full-depth slab replacement: Case A, replace 2 slabs; Case B, replace 20 slabs; and Case C, replace 30 slabs.
• Joint resealing is required on 80 of the 88 joints. • Undersealing is required for an area of 600 yd2. • Diamond grinding is needed to remove faulting on 50
percent of the joints. Assuming grinding on one side of joint over an area 4 ft x 24 ft, grinding area= 44 (4 ft x 24 ft)/9 ft2 = 469 yd2.
Undersealing cost = 600 yd2 x $1.8/yd2 = $1,080, Grinding cost = 469 yd2 x $3.l/yd2 = $1,454,
and Cost for full-depth slab replacement for one
slab = [(60 ft x 12 ft)/9] x $55 yd2 = $4,400/slab.
In Case A (replacement of 2 slabs),
TABLE 4 SUMMARY DATA FOR LIFE-CYCLE COST EXAMPLE
Details of Remaining Life at Overlay Placement
Overlay Strategy 40% 20% 10% 0%
Total cost per square lard $10.74 $ 7.10 $ 6.08 $ 5.30 User dcl.ay cost. ($/yd ) 0.16 0.13 0.11 0.10 Overlay thickness (in.) 3 3 3 3 Years until placement 0 10.4 14.7 18.7
NoTB: AC overlay; ADT = 10,000; Esuh = 8,000 psi; remaining life of pavement = 40%. Surface type = 10-in. JCP without concrete shoulder, number of lanes = 2 (one direction), lane width = 12 ft, project length = 1 mi, number of existing defects = 2 at 40% remaining life, and joint spacing = 60 ft.

McCullough and Uddin
Total cost = restoration cost + traffic delay cost, Restoration cost = [$960 + $1,080 + $1,454 +
2($4,400))/14,080 yd2 = $0.87 /yd2, and Total cost = $0.87/yd2 + $0.16/yd2 = $1.03/yd2.
In Case B (replacement of 20 slabs),
Restoration cost = [$3,494 + 20($4,400))/14,080 yd2 = $6.50/yd2, and
Total cost = $6.50/yd2 + $0.16/yd2 = $6.66/yd2.
In Case C (replacement of 30 slabs),
Restoration cost = [$3,494 + 30($4,400))/14,080 yd2
= $9.62/yd2 and Total cost = $9.62/yd2 + $0.16/yd2 = $9.78/yd2.
These assumptions and calculations are made only for illustration. The ranking of the resurfacing and restoration options for this example by cost is given in the following table.
Cost Rank ($tyd2) Strategy
1 1.03 Restoration Case A 2 5.30 3-in. AC overlay placed at 19
years 3 6.08 3-in. AC overlay placed at 14
years 4 6.66 Restoration Case B 5 7.10 3-in. AC overlay placed at 10
years 6 9.78 Restoration Case C 7 10.74 3-in. AC overlay placed
immediately
Thus, depending on the level of restoration required for this pavement, restoration can be an economical alternative to resurfacing. For this analysis, only one period of restoration was performed at the start of the analysis period. Field conditions may necessitate future restoration and repair work that is not accounted for in this analysis.
SUMMARY AND RECOMMENDATIONS
The development and implementation of the PRDS-1 computer program that uses a systems approach to economic and structural evaluation of rehabilitation alternatives have been described. This computer model was exercised for rigid and flexible pavements using inputs representative of Pennsylvania conditions. Recommendations on economical resurfacing strategies for flexible pavements based on this analysis were presented. Costs for feasible overlay strategies were compared with the cost of restoration techniques.
PRDS-1 considers a wide range of cost variables in the economic analysis. Undoubtedly there are other cost variables that could be considered in the life-cycle analysis. Fatigue is used as the only limiting criterion in the program. The PRDS-1 program is written in a modular structure such that it may be readily modified when performance models for other types of pavement distress become available.
77
ACKNOWLEDGMENTS
The authors gratefully acknowledge the reviews and contribution of Bary Falkenstein (previously with PennDOT) and the contributions of J. P. Zaniewski, Steve Seeds, and Gary Elkins of ARE, Inc., to this research study.
REFERENCES
1. J. P. Zaniewski, B. F. McCullough, W. Uddin, and G. E. Elkins. Alternate Resurfacing Strategies. Final Report, Vol. 1, Report FHWA-PA-85-019. Pennsylvania Department of Transportation, Harrisburg, Sept. 1985.
2. J. A. Epps, D. N. Little, R. J. Holmgreen, and R. L. Terrel. NCHRP Report 224: Guidelines for Recycling Pavemenl Materials. TRB, National Research Council, Washington, D.C., Sept 1980.
3. NCHRP Synlhesis of Highway Practice 54: Recycling MaJerials for Highways. HRB, National Research Council, Washington, D.C., 1973.
4. F. H. Scrivner, W. M. Moore, W.R. McFarland, and G. R. Carey. A Systems Approach to the Flexible Pavement Design Problem. Research Report 32-11. Texas Transportation Institute, Texas A&M University System, College Station, 1968.
5. R. K. Kher, W. R. Hudson, and F. F. McCullough. A Systems Analysis of Rigid Pavement Design. Research Report 123-5. Texas Highway Department, Austin; . Texas Transportation Institute, Texas A&M University, College Station; and Center for Highway Research, The University of Texas at Austin, Nov. 1970.
6. S. B. Seeds, B. F. McCullough, and W. R. Hudson. A Design System for Rigid Pavement Rehabilitation. Research Report 249-2. Center for Transportation Research, The University of Texas at Austin, June 1981.
7. S. B. Seeds, W. R. Hudson, and B. F. McCullough. A Rigid Pavement Rehabilitation Design System. In Proc., 2nd International Conference on Rigid Pavemenl Design, Purdue University, West Lafayette, Ind., April 1981.
8. J. P. Zaniewski, B. F. McCullough, W. Uddin, and G. E. Elkins. Alternate Resurfacing Strategies. Final Report, Vol. 2, Report FHWA-PA-85-011. ARE, Inc., Austin, Tex.; Pennsylvania Department of Transportation, Harrisburg, Sept. 1985.
9. E. L. Wilson. SOUD SAP, A Static Analysis Program for ThreeDimensional Solid Structures. Structural Engineering Laboratory, University of California, Berkeley, 1971.
10. Special Report 61E: The AASHO Road Test: Report 5-Pavemenl Research. HRB, National Research Council, Washington, D.C., 1962.
11. A. Taute, B. F. McCullough, and W. R. Hudson. lmprovements to the Materials Characterization and Fatigue Life Prediction Methods of the Texas Rigid Pavement Overlay Design Procedure. Research Report 249-1. Center for Transportation Research, The University of Texas at Austin, March 1981.
12. M. Gutierrez de Velasco and B. F. McCullough. Summary Report for 1978 CRCP Co11ditio11 Survey in Texas. Research Report 177-20. Center for Transportation Research, The University of Texas at Austin, Dec. 1979.
13. H. J. Treybig, B. F. McCullough, P. Smith, and H. Von Quintus. Overlay Design and Reflection Cracking Analysis for Rigid Pavements, Vol. 1: Development of New Design Criteria. Research Report FHWA-RD-77-66. FHWA, U.S. Department of Transportation, Aug. 1977.
14. 0. Schnitter, W. R. Hudson, and B. F. McCullough, A Rigid Pavement Overlay Design Procedure for lhe Texas SDHPT. Research Report 177-13. Center for Highway Research, The University of Texas at Austin, May 1978.
15. F. Finn, C. L. Saraf, R. Kulkarni, K. Nair, W. Smith, and A. Abdullah. Development of Pavemenl Structural Subsystems. Vol. 1: Final Report, NCHRP Project 1-lOB. TRB, National Research Council, Washington, D.C., Feb. 1977.

78
16. C. L. Monismith, J. A. Epps, D. A. Kasianchuck, and D. B. McLean. Asphalt Mixlure Behavior in Repeated Flexure. Report TE-70-5. Institute of Transportation and Traffic Engineering, University of California, Berkeley, 1972.
17. F. H. Scrivner, W. M. Moore, W.R. McFarland, and G. R. Carey. A Systems Approach to the Flexible Pavement Design Problem. Research Report 32-11. Texas Transportation Institute, Texas A&M University System, College Station, 1968.
TRANSPORTATION RESEARCH RECORD 1109
The contents of this paper reflect the views of the authors who are responsible for the facts and the accuracy of the data presented herein. The contents do not necessarily reflect the official views or policies of either the Federal Highway Administration, U.S. Department ofTransportation, or the Commonwealth of Pennsylvania.
Publication of this paper sponsored by Committee on Rigid Pavement Construction and Rehabilitation.