transportation research part d - pdfs.semanticscholar.org · ownership in california in section...
TRANSCRIPT
Transportation Research Part D 32 (2014) 421–434
Contents lists available at ScienceDirect
Transportation Research Part D
journal homepage: www.elsevier .com/ locate/ t rd
Incorporating social impact on new product adoption in choicemodeling: A case study in green vehicles
http://dx.doi.org/10.1016/j.trd.2014.08.0071361-9209/� 2014 Elsevier Ltd. All rights reserved.
⇑ Corresponding author.E-mail address: [email protected] (W. Chen).
Lin He a, Mingxian Wang b, Wei Chen b,⇑, Guenter Conzelmann c
a Environmental Energy Technologies Division, Lawrence Berkeley National Laboratory, 1 Cyclotron Road MS 90R4000, Berkeley, CA 94720, United Statesb Mechanical Engineering, Northwestern University, 2145 Sheridan Road, Tech B224, Evanston, IL 60208, United Statesc Center for Energy, Environmental, and Economic Systems Analysis, Argonne National Laboratory, Argonne, IL 60439, United States
a r t i c l e i n f o a b s t r a c t
Keywords:Discrete choice analysisSocial impactSocial network simulationsProduct adoptionHybrid vehicles
While discrete choice analysis is prevalent in capturing consumer preferences and describ-ing their choice behaviors in product design, the traditional choice modeling approachassumes that each individual makes independent decisions, without considering the socialimpact. However, empirical studies show that choice is social – influenced by many factorsbeyond engineering performance of a product and consumer attributes. To alleviate thislimitation, we propose a new choice modeling framework to capture the dynamic influencefrom social networks on consumer adoption of new products. By introducing social influ-ence attributes into a choice utility function, social network simulation is integrated withthe traditional discrete choice analysis in a three-stage process. Our study shows the needfor considering social impact in forecasting new product adoption. Using hybrid electricvehicles as an example, our work illustrates the procedure of social network construction,social influence evaluation, and choice model estimation based on data from the NationalHousehold Travel Survey. Our study also demonstrates several interesting findings on thedynamic nature of new technology adoption and how social networks may influencehybrid electric vehicle adoption.
� 2014 Elsevier Ltd. All rights reserved.
Introduction
While the use of Discrete Choice Analysis (DCA) is prevalent in modeling consumer preferences and describing theirchoice behaviors in product design (Frischknecht et al., 2010; Li and Azarm, 2000; Michalek et al., 2006; Wassenaar andChen, 2003; Williams et al., 2008), individuals’ choices are studied without social contexts in most cases. Empirical studiesshow that social context, such as ‘‘neighbor’’ effects may impact consumer choice behavior (Case, 1992). Often times, socialcontext influences consumer attitudes towards new products, such as those involving green technology. As an example, aconsumer’s decision in choosing an eco-friendly alternative fuel vehicle, such as a hybrid electric vehicle (HEV) or plug-inhybrid electric vehicle (PHEV), may be influenced by neighbors and friends or others who share similar social status orprofile. In the broad market of consumer products, a large amount of product reviews and recommendations are now madeavailable through rapidly growing online shopping websites and social networking sites which accelerate the social impacton product adoption. Integrating social network simulation into consumer choice modeling and developing methods for

Nomenclature
A consumer-desired product attributesa rewiring probabilityb coefficients in consumer’s choice utility functiondij social distance from consumer i to consumer jE usage context attributeseik random disturbance of consumer choice utility of product k by consumer iHEV Hybrid electric vehicleLij social link from consumer i to consumer jlij strength of social connection from consumer i to consumer jMNL Multinomial logitMt market share at time tNi,t social impact on consumer j’s attitude towards product adoption at time tPHEV Plug-in hybrid electric vehiclec coefficients in social impact functionS consumer profile attributesWik,t observed (deterministic) part of the consumer choice utility of product k by consumer i at time tX engineering design options or variablesxm
i value of consumer j in the mth social dimension
422 L. He et al. / Transportation Research Part D 32 (2014) 421–434
predicting the social influence on consumer choices and their attitudes towards adopting new green products is the focus ofthis research.
While the existing work demonstrated the benefits of using DCA in modeling consumer choice behavior (He et al., 2012b;Hoyle et al., 2011; MacDonald et al., 2009; Shiau and Michalek, 2009; Sullivan et al., 2011), the merits of DCA are limited dueto its assumption of consumers making individual decisions in isolation of each other. As many behavioral economists andpsychologists have noted, choice is social. In other words, an individual’s decisions are not immune to the influence of others.This is especially the case in forecasting the adoption (first-time purchases) of new green products, which is a critical butchallenging task. A handful of recent research projects focus on forecasting the HEV/PHEV market potential as the vehicledesign evolves and the technology matures. A few pilot projects have been conducted to better understand consumers’knowledge and awareness of PHEV (Axsen and Kurani, 2008). For choice modeling of alternative fuel vehicles, He et al.(2012a) quantitatively assessed the impact of vehicle usage on HEV choice and demonstrated that consumers driving locallytend to prefer HEV more than consumers with longer commutes. Sullivan et al. (2005) suggested that consumers make pur-chasing decisions based on their own personal attributes as well as vehicle attributes. They later developed an agent-basedsimulation approach for modeling market penetration of PHEVs under a variety of consumer, economic, and policy condi-tions (Sullivan et al., 2009). Struben and Sterman (2008) simulated word-of-mouth effects in alternative fuel vehicle diffu-sion using a Logit-like choice model. However, existing studies still mostly focus on understanding the impact of marketingattributes and largely ignore the social impacts on consumers’ choices. The effects of peer influence on product attributepreference have been studied in market science by Narayan et al. (2011) who modeled three different mechanisms of socialinfluence. By combining traditional conjoint analysis on product features with peer influence, their work showed that peerinfluence causes people to change perspective on product importance, and that some product attributes are more sensitiveto change than others.
The research objective of this work is to develop an alternative choice modeling framework considering the social impacton new product adoption by integrating methods rooted in social network theories, agent-based modeling, and discretechoice analysis. In contrast to Narayan’s approach that heavily relies on customer survey data to evaluate the attitude changebefore and after exposure to peer influence, our approach acknowledges the lacking of customer survey data and employsagent-based simulations to simulate social network influence. This framework can be used by product designers to estimatewillingness-to-pay for new technology, illustrate consumer preferences and tradeoffs among multiple product design attri-butes, and forecast product market share for a target market with given social-demographic attributes. By introducing thesocial influence attributes into the choice utility function, the social network simulation is integrated with the traditionaldiscrete choice analysis by following the procedure of social network construction, social influence evaluation, and choice modelestimation. To the authors’ knowledge, this work is the first in literature that integrates network simulation for assessingsocial influence into choice modeling. In the rest of this paper, we will first provide a review of the literature on social net-work theories and existing work on integrating social interactions in choice models in section ‘Social network theories andintegration with choice modeling’. The proposed choice modeling framework considering social impacts is presented in sec-tion ‘Choice modeling frame work considering social impact’, followed by a case study of modeling hybrid electric vehicle

L. He et al. / Transportation Research Part D 32 (2014) 421–434 423
ownership in California in section ‘Case study of green product adoption: HEV ownership in California’. Discussions and con-clusions are included in section ‘Conclusions’.
Social network theories and integration with choice modeling
With the growing public awareness of the complex ‘‘connectedness’’ of modern society, the idea of social networks hasbeen gaining more attention (Easley and Kleinberg, 2010; Faust and Wasserman, 1994). A social network is defined as agroup of people who are connected to some or all of the others following a random or particular pattern in graph. For exam-ple, Facebook, the leading online social network site has so far attracted 1 billion active users (Facebook), demonstrating thepower of interpersonal connections in our daily lives. In the following subsections, fundamentals in social network theories,as well as the integration of social network simulations into choice modeling will be discussed.
Social network basics
There are two key elements of a social network which includes nodes, representing members of the network, i.e. consum-ers in the context of product design, and links, illustrating the connections between members, i.e. social interactions betweenlinked consumers. For example, the graph in Fig. 1 consists of 4 nodes labeled A, B, C, and D, with four links between them.Two nodes are ‘‘friends’’ if they are connected by a link, e.g., A and B, B and D. The term ‘‘friends’’ has a broad meaning in ourproposed social network simulation. As to be explained in section ‘Choice modeling framework considering social impact’,the axes x(1) and x(2) are example of consumer attributes that are used to describe a social space. In this research, social dis-tance based on the similarity of consumer attributes is used to determine whether a link between two consumers exists ornot.
Homophily refers to the principle that friends tend to be similar. Typically, friends are similar either along their social-economic attributes, such as racial and ethnic background, age, where they live, occupations, income, or their behaviors,interests, beliefs, and opinions. The tendency of people to form friendships with others who are like them is often definedas selection, in that people are selecting friends with similar characteristics. The process of selection is the basis for the socialnetwork construction (stage I of the proposed choice modeling framework described in section ‘Choice modeling frameworkconsidering social impact’). On the other hand, people may modify their behaviors to bring them more closely into alignmentwith the behaviors of those who they connect with in the network. This process has been described as social influence(Friedkin, 2006), which can be viewed as the reverse of selection: with selection, the individual characteristics drive the for-mation of links, while with social influence, the existing links in the network serve to shape people’s behavior, attitudes, etc.In the context of product design, consumers are often influenced by the choices of those who they connect with in the net-work when they purchase a new product. The process of social influence is the basis for stage II (social influence evaluation)of the proposed choice modeling framework described in section ‘Choice modeling framework considering social impact’.
Depending on the specific network structure, distinctive influences through social networks have been observed, mod-eled, and researched in numerous domains, including social science and humanities. The meaning of ‘‘connectedness’’encompasses two related issues in social network modeling and simulation: one is the network structure – the media ofsocial impact; the other is the behavioral interactions – the mechanism of social impact. How to integrate these two key ele-ments of social network into consumer behavior simulation and choice modeling are discussed next in more detail.
Integration with choice modeling: literature
The importance of incorporating social influence in modeling choice behavior has been stated by McFadden (2010) andmany other scholars. McFadden decomposed the causes of the sociality of choice by stating that choice is influenced by infor-mation from a peer group, heuristics rooted in the behavior of others, analogies or anecdotal information garnered fromassociates, and constraints imposed by others.
Economists are among the pioneers in quantitatively modeling the interdependence of choices. Social interactions areintroduced in binary logit (Brock and Durlauf, 2001), multinomial logit (Brock and Durlauf, 2002), and nested logit models
A
B
C D
x(1)
x(2)
dAB
Fig. 1. Simple network graph.

424 L. He et al. / Transportation Research Part D 32 (2014) 421–434
(Dugundji and Gulyas, 2003a) by allowing a given consumer’s choice for a particular alternative to be dependent on the over-all market share, that is, the global (aggregated) social network effects. A more general framework is presented in Dugundjiand Gulyas (2003b) for studying local (disaggregated) social network effects in discrete choice models, where networkeffects are calculated within each market segment. Modeling preference interdependence among consumers was also stud-ied by Yang and Allenby (2003) based on a Bayesian spatial autoregressive multivariate binomial probit modeling approach.
In the transportation domain, Carrasco et al. demonstrated approaches for collecting social network data (Carrasco et al.,2008), and incorporated social network information into the activity-travel behavior modeling framework to better under-stand social activities and key aspects of the underlying behavioral process (Carrasco and Miller, 2006). Tran (2012) developedan agent-based modeling (ABM) framework to demonstrate the important role that network influence plays in acceleratingenergy innovation diffusion. Although ABM can provide a distribution of possible outcomes, calibration of model parametersis challenging which makes the prediction even more difficult. Dugundji and Gulyas (Dugundji and Walker, 2005) utilizedsimulated network data for modeling intercity travel behavior by introducing local social network effects into the choice util-ity with varying network densities. Páez et al. (2008) presented a multinomial logit model of residential location choice usingsimulated network data with varying degrees of distributions and clustering parameters. To capture social influences withoutexplicit knowledge of the individual networks, Walker et al. (2011) introduced a local social network effect in their choicemodel, namely, the percent of population choosing a specific alternative within their peer group defined based on thesocio-economic status (income, education, age) and the spatial proximity of residential locations. Although these approachesaddress the local social network effect, they only capture semi-disaggregate level preferences and are subject to uncertaintydepending on the level of segmentation (or definition of peer groups) and the condition of sharp boundary – people at theboundary of peer groups are assumed to be isolated from neighboring peer groups.
While the growing number of publications in the economics and transportation fields provided the theoretical foundationto incorporate social interactions into choice modeling, a major limitation of the aforementioned methods is the assumptionthat the social impact is the primary critical factor in the choice model. In many fields, including product design, other factorssuch as product performance, characteristics of consumers, as well as the product usage contexts, are shown to be critical inconsumers’ choices. When social network effects are present, taking them into account in the choice model can lead to dif-ferent product designs decisions. Consider a simple social network with 3 people where all consumers are related to eachother. There are two product options available and the designer is to decide which product to offer in the market. Consumercan choose between product 1 and not-to-buy (outside goods), or between product 2 and not-to-buy. A Logit model with util-ities and choice probabilities is given in Table 1. A product is considered as a better option for the designer if the aggregatechoice probability across all consumers is higher. Without considering social impact, we only focus on time t = 1, where prod-uct 2 is the better option (66.66% aggregate choice probability versus 33.34% of product 1). Note the individual choice prob-ability is assessed based on binomial logit model. Now, suppose person 2 makes a choice at t = 1 and persons 1 and 3 were tofollow at t = 2, person 2’s purchase at t = 1 influences persons 1 and 3 by increasing their individual utility of product 1 by 5respectively (underlined values in the table). As a result, product 1 becomes the better choice, because its aggregate choiceprobability becomes higher than that of product 1 (58.68% versus 41.32%) due to the increased chance of person 3 choosingproduct 1.
As demonstrated in the above conceptual example, capturing the social impact and modeling the dynamic and stochasticnature of product adoption in a systematic way does matter in product design. Hence, research is needed to address theunique challenges in incorporating social influences in choice modeling for product design applications.
Table 1Illustration of social impact on individual utility and choice probability.
Person Utilities Choice probability
Product 1 Product 2 Not to buy Product 1 (%) Product 2 (%)
t = 11 20 28 18 88.08 100.002 32 28 30 88.08 11.923 20 24 22 11.92 88.08
Aggregated 62.69 66.67
t = 21 25 28 18 99.91 100.002 32 28 30 88.08 11.923 25 24 22 95.26 88.08
Aggregated 94.42 66.67
Total1 98.50 100.002 88.08 11.923 85.32 88.08
Aggregated 90.63 66.67

L. He et al. / Transportation Research Part D 32 (2014) 421–434 425
Choice modeling frame work considering social impact
An alternative three-stage choice modeling framework is developed in this research to quantitatively capture the impactof social network on consumer choice behavior for product design. The adoption of alternative fuel vehicles under socialinfluence is used as an example to demonstrate the proposed framework.
The proposed choice modeling framework consists of the following three stages: (I) social network construction, in which avirtual environment is created where consumers interact with their linked network members; (II) social influence evaluation,where the network influence is evaluated in the form of social influence attributes by simulating how consumers communicatewith their linked network members and the accumulated influence each receives; and (III) choice model estimation, in whichconsumers’ rational decisions based on the utility maximization theory are studied to quantify the impact from social influencemodeled in stage II together with other product and consumer attributes. The details of each stage are discussed as follows.
Stage I: social network construction
Social network construction is the process of creating network links based on existing data – the predefined networkstructure and the descriptive information associated with each node (consumer). Due to the complexity in social networkdata collection, often there is limited data, if any, available on the real social network structure among the sample popula-tion. An alternative is to construct the network through simulations based on certain hypotheses of a network structureusing collected consumer attributes, such as the socio-demographic and usage context attributes. In our case study of hybridelectric vehicle (HEV), we use the National Household Travel Survey (NHTS) to obtain the demographic and usage contextattributes of the population. Our network construction follows commonly used social network structures, such as thesmall-world network with short average path length (Watts and Strogatz, 1998a) and the scale-free network with power-law degree distribution (Barabási and Albert, 1999). The former is demonstrated in our case study (section ‘Case study ofgreen product adoption: HEV ownership in California’), while the latter is suitable for explaining network mechanisms suchas preferential attachment – one classic example being the World Wide Web.
Within the network construct, links are generated to simulate interpersonal interactions. Rogers (1995) suggested thatinterpersonal influence can occur among individuals who are homophilous (i.e., similar to each other) or who are heteroph-ilous (i.e., dissimilar to each other). Homophilous connections, or close links, represent the connections among neighbors,friends, and other regular contacts (e.g. coworkers), whereas heterophilous connections, or distant links, represent the linkscreated due to acquaintances and other information sources (e.g. online reviewers). Foundational to forming the links is theconcept of social distance, which is defined as the distance between locations of two nodes (consumers) in a social space. Theterm social space is inspired by Krugman’s work on economic geography (Krugman, 1990). A social space can be constructedbased on the attributes that are used to describe the consumer social dimensions.
dij ¼X
m
jxmi � xm
j jp
!1=p
ð1Þ
As shown in Eq. (1), dij is defined as the p-norm distance in social space between consumer i and j, while xmi represents the
attributes in the m-dimensional social space. For product choice modeling, attributes x of consumer social dimensioninclude, but are not limited to, consumer profile attributes S and usage context attributes E. For categorical attributes, suchas gender and race, data transformations are needed to calculate the distance d. Referring back to Fig. 1 which shows a simplenetwork graph with four nodes A, B, C, and D, in a two dimensional space formed by x(1) and x(2), there are four links betweenthe nodes. The length of the link, in this case, represents the Euclidean distance between two nodes, distance dAB between Aand B for example. This basic form of distance function is employed in our case study (section ‘Case study of green productadoption: HEV ownership in California’).
Based on the homophily principle, two nodes with shorter social distance are more likely to be connected. The distance-decay function method reflects the hypothesis that the degree of influence between nodes should decrease as their attributesbecome more dissimilar (Festinger, 1954). As shown as follows, the strength of a connection in social space is a function ofthe distance between nodes (Páez et al., 2008):
lij ¼c1 expð�c2d2
ijÞ; for i–j
0; for i ¼ j
(ð2Þ
In Eq. (2), c1 is the parameter controlling the magnitude of the effect and c2 is controlling the rate of decay. To determinewhether a link exists (1) or not (0), the distance decay function in Eq. (2) is replaced with a significance criterion of a giventhreshold, as shown in Eq. (3).
Lij ¼1; if lij P bi
0; otherwise
�ð3Þ
where bi is the threshold value determined by the modeler. Other treatments, such as relative connection strength, can beused to model more complex network structures.

426 L. He et al. / Transportation Research Part D 32 (2014) 421–434
Stage II: social influence evaluation
Once a network is constructed, social influences on consumer preferences are evaluated by simulating the interactionsbetween consumers in the network. As a result, social influence attribute Ni,t is defined as the collection of influences fromall other consumers linked to a focal consumer i at time t. Because the social influence is a function of time t, N is evaluatedfor each of the time periods. This attribute is then added into the consumer choice utility function to capture the social influ-ence on product adoption. Three types of social network influence are studied in Snijders (2001): structural effects on net-work dynamics, effects on network dynamics associated with covariates, and effects on behavior evolution. In our study, forsimplicity, we assume the structure of the social network constructed in Stage I is stable over time, that is, links among con-sumers do not change over time. Hence, only the third type, effect on behavioral evolution, is relevant in our case. Formu-lations for evaluating the social influence attributes associated with several popular effects on behavior evolution arepresented in Table 2. For example, the average friend effect is defined as the average degree of impact from linked contactswith similar behavior. Because social behavior y (in this case choice behavior) of other consumers in the network changesover time, the average friend effect is updated at each time iteration t. This process will be discussed in more details in sec-tion ‘Case study of green product adoption: HEV ownership in California’.
Market surveys or empirical studies, such as interviews, are often needed to better understand the importance of socialinfluences and which effect in Table 2 is the most relevant to the problem of interest. For instance, some individuals arehighly influenced by their neighbors, coworkers, or other close contacts with whom they communicate daily, while otherpeople are likely to trust suggestions and advice from their remote contacts, such as online product reviews, or blog postsfrom people with similar lifestyle. These effects are modeled as close links and distant links, respectively, in the small wordnetwork tested in our case study presented in section ‘Case study of green product adoption: HEV ownership in California’. Inessence, the social influence attributes N are modeled as a function of the binary link variable Lij based on networksimulations.
Stage III: choice model estimation
In the traditional choice modeling framework, a predictive model of choice share Q is established using Discrete ChoiceAnalysis, DCA, which is based upon the assumption that individuals seek to maximize their personal consumer choice utility,u, when selecting a product from a choice set. The choice utility is derived by assuming that the individual’s (i) true choiceutility, u, for a design alternative, k, consists of an observed part W, and an unobserved random disturbance e (unobservedutility):
Table 2Commo
Beha
TendAverTotaAverAverIn-dOut-
uik ¼Wik þ eik ð4Þ
As shown in Eq. (5), the observed or deterministic part of the utility Wik is expressed as a function of consumer desiredproduct attributes Aik, of respondent i, alternative k; usage context attributes Ei; and consumer profile attributes Si of respon-dent i,
Wik ¼Wðb : Aik;Ei; SiÞ ð5Þ
In this work, we introduce a new element, the social influence attributes Ni,t, into the utility function as shown in Eq. (6).
Wik;t ¼Wðb : Aik; Si;Ei;Ni;tÞ ð6Þ
Not only does Ni,t change for different respondent i, it is also time dependent of time variable t, which reflects the dynamicnature of social network influence: in each time period, consumers make choice decisions, which may change the socialinfluence attributes of their linked network members. Hence, the coefficients b are estimated based on the collected marketdata over a period of time assuming the growth of market share of a product is a result of social network impact. From theobserved part of utility, Wik,t, the probability Pik of an individual i choosing a given alternative k, and the resulting choicebehavior yi,t can be estimated.
nly considered effects on behavioral evolution.
vioral effects Definition Mathematical formulation
ency effect Individual constants representing basic tendency Ni ¼ ci
age similarity effect Average degree of consumer being similar to their friends Ni ¼P
j lij.P
jLij
l similarity effect Total degree of consumer being similar to their friends Ni ¼P
j lijage friend effect Average degree of impact from linked contacts with similar behavior y Ni;t ¼ yi;t�1
PjLijyj;t�1
.PjLij
age friend effect variation Average degree of impact from linked contacts with behavior y Ni;t ¼P
jLijyj;t�1
.PjLij
egree effect Number of friends linked to a consumer Ni ¼P
jLji
degree effect Number of friends linked from a consumer Ni ¼P
jLij
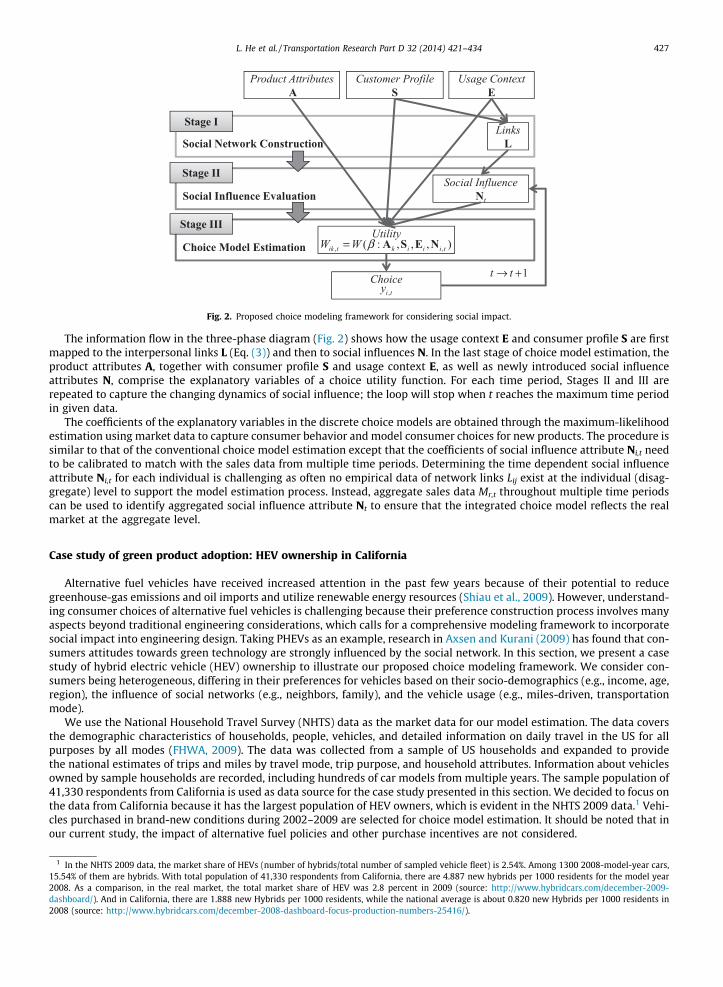
Fig. 2. Proposed choice modeling framework for considering social impact.
L. He et al. / Transportation Research Part D 32 (2014) 421–434 427
The information flow in the three-phase diagram (Fig. 2) shows how the usage context E and consumer profile S are firstmapped to the interpersonal links L (Eq. (3)) and then to social influences N. In the last stage of choice model estimation, theproduct attributes A, together with consumer profile S and usage context E, as well as newly introduced social influenceattributes N, comprise the explanatory variables of a choice utility function. For each time period, Stages II and III arerepeated to capture the changing dynamics of social influence; the loop will stop when t reaches the maximum time periodin given data.
The coefficients of the explanatory variables in the discrete choice models are obtained through the maximum-likelihoodestimation using market data to capture consumer behavior and model consumer choices for new products. The procedure issimilar to that of the conventional choice model estimation except that the coefficients of social influence attribute Ni,t needto be calibrated to match with the sales data from multiple time periods. Determining the time dependent social influenceattribute Ni,t for each individual is challenging as often no empirical data of network links Lij exist at the individual (disag-gregate) level to support the model estimation process. Instead, aggregate sales data Mr,t throughout multiple time periodscan be used to identify aggregated social influence attribute Nt to ensure that the integrated choice model reflects the realmarket at the aggregate level.
Case study of green product adoption: HEV ownership in California
Alternative fuel vehicles have received increased attention in the past few years because of their potential to reducegreenhouse-gas emissions and oil imports and utilize renewable energy resources (Shiau et al., 2009). However, understand-ing consumer choices of alternative fuel vehicles is challenging because their preference construction process involves manyaspects beyond traditional engineering considerations, which calls for a comprehensive modeling framework to incorporatesocial impact into engineering design. Taking PHEVs as an example, research in Axsen and Kurani (2009) has found that con-sumers attitudes towards green technology are strongly influenced by the social network. In this section, we present a casestudy of hybrid electric vehicle (HEV) ownership to illustrate our proposed choice modeling framework. We consider con-sumers being heterogeneous, differing in their preferences for vehicles based on their socio-demographics (e.g., income, age,region), the influence of social networks (e.g., neighbors, family), and the vehicle usage (e.g., miles-driven, transportationmode).
We use the National Household Travel Survey (NHTS) data as the market data for our model estimation. The data coversthe demographic characteristics of households, people, vehicles, and detailed information on daily travel in the US for allpurposes by all modes (FHWA, 2009). The data was collected from a sample of US households and expanded to providethe national estimates of trips and miles by travel mode, trip purpose, and household attributes. Information about vehiclesowned by sample households are recorded, including hundreds of car models from multiple years. The sample population of41,330 respondents from California is used as data source for the case study presented in this section. We decided to focus onthe data from California because it has the largest population of HEV owners, which is evident in the NHTS 2009 data.1 Vehi-cles purchased in brand-new conditions during 2002–2009 are selected for choice model estimation. It should be noted that inour current study, the impact of alternative fuel policies and other purchase incentives are not considered.
1 In the NHTS 2009 data, the market share of HEVs (number of hybrids/total number of sampled vehicle fleet) is 2.54%. Among 1300 2008-model-year cars,15.54% of them are hybrids. With total population of 41,330 respondents from California, there are 4.887 new hybrids per 1000 residents for the model year2008. As a comparison, in the real market, the total market share of HEV was 2.8 percent in 2009 (source: http://www.hybridcars.com/december-2009-dashboard/). And in California, there are 1.888 new Hybrids per 1000 residents, while the national average is about 0.820 new Hybrids per 1000 residents in2008 (source: http://www.hybridcars.com/december-2008-dashboard-focus-production-numbers-25416/).
Social Network Simulation
•Small-world network
Customer Attributes• geographical location
Network Parameters• number of friends• rewiring probability
Social Influences• average friend effect
Network Properties• clustering coefficients• average path length
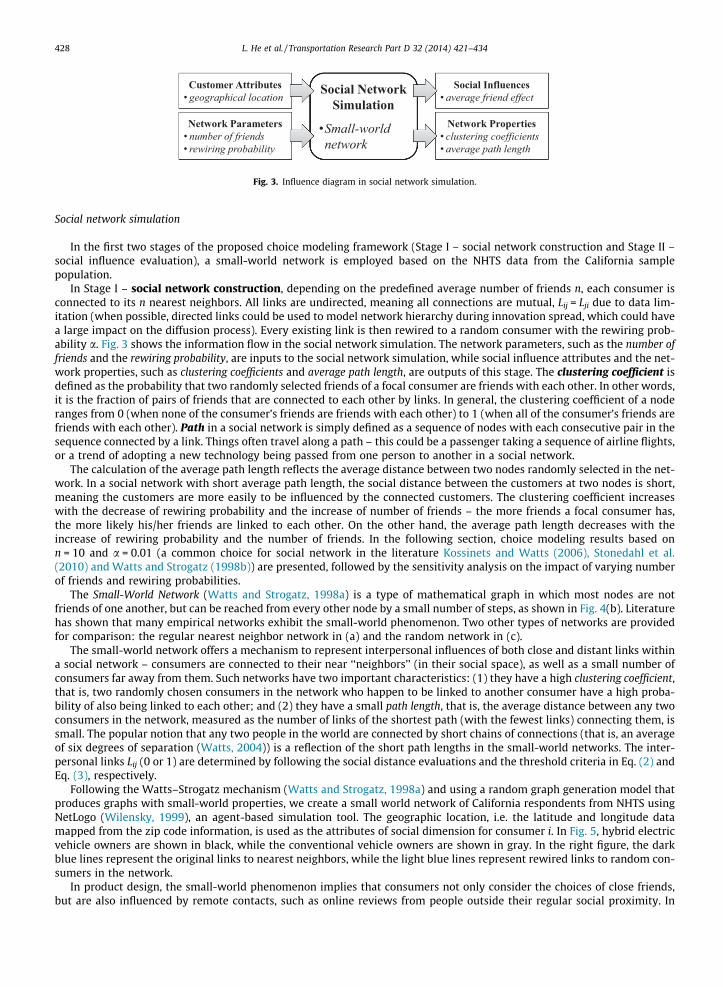
Fig. 3. Influence diagram in social network simulation.
428 L. He et al. / Transportation Research Part D 32 (2014) 421–434
Social network simulation
In the first two stages of the proposed choice modeling framework (Stage I – social network construction and Stage II –social influence evaluation), a small-world network is employed based on the NHTS data from the California samplepopulation.
In Stage I – social network construction, depending on the predefined average number of friends n, each consumer isconnected to its n nearest neighbors. All links are undirected, meaning all connections are mutual, Lij = Lji due to data lim-itation (when possible, directed links could be used to model network hierarchy during innovation spread, which could havea large impact on the diffusion process). Every existing link is then rewired to a random consumer with the rewiring prob-ability a. Fig. 3 shows the information flow in the social network simulation. The network parameters, such as the number offriends and the rewiring probability, are inputs to the social network simulation, while social influence attributes and the net-work properties, such as clustering coefficients and average path length, are outputs of this stage. The clustering coefficient isdefined as the probability that two randomly selected friends of a focal consumer are friends with each other. In other words,it is the fraction of pairs of friends that are connected to each other by links. In general, the clustering coefficient of a noderanges from 0 (when none of the consumer’s friends are friends with each other) to 1 (when all of the consumer’s friends arefriends with each other). Path in a social network is simply defined as a sequence of nodes with each consecutive pair in thesequence connected by a link. Things often travel along a path – this could be a passenger taking a sequence of airline flights,or a trend of adopting a new technology being passed from one person to another in a social network.
The calculation of the average path length reflects the average distance between two nodes randomly selected in the net-work. In a social network with short average path length, the social distance between the customers at two nodes is short,meaning the customers are more easily to be influenced by the connected customers. The clustering coefficient increaseswith the decrease of rewiring probability and the increase of number of friends – the more friends a focal consumer has,the more likely his/her friends are linked to each other. On the other hand, the average path length decreases with theincrease of rewiring probability and the number of friends. In the following section, choice modeling results based onn = 10 and a = 0.01 (a common choice for social network in the literature Kossinets and Watts (2006), Stonedahl et al.(2010) and Watts and Strogatz (1998b)) are presented, followed by the sensitivity analysis on the impact of varying numberof friends and rewiring probabilities.
The Small-World Network (Watts and Strogatz, 1998a) is a type of mathematical graph in which most nodes are notfriends of one another, but can be reached from every other node by a small number of steps, as shown in Fig. 4(b). Literaturehas shown that many empirical networks exhibit the small-world phenomenon. Two other types of networks are providedfor comparison: the regular nearest neighbor network in (a) and the random network in (c).
The small-world network offers a mechanism to represent interpersonal influences of both close and distant links withina social network – consumers are connected to their near ‘‘neighbors’’ (in their social space), as well as a small number ofconsumers far away from them. Such networks have two important characteristics: (1) they have a high clustering coefficient,that is, two randomly chosen consumers in the network who happen to be linked to another consumer have a high proba-bility of also being linked to each other; and (2) they have a small path length, that is, the average distance between any twoconsumers in the network, measured as the number of links of the shortest path (with the fewest links) connecting them, issmall. The popular notion that any two people in the world are connected by short chains of connections (that is, an averageof six degrees of separation (Watts, 2004)) is a reflection of the short path lengths in the small-world networks. The inter-personal links Lij (0 or 1) are determined by following the social distance evaluations and the threshold criteria in Eq. (2) andEq. (3), respectively.
Following the Watts–Strogatz mechanism (Watts and Strogatz, 1998a) and using a random graph generation model thatproduces graphs with small-world properties, we create a small world network of California respondents from NHTS usingNetLogo (Wilensky, 1999), an agent-based simulation tool. The geographic location, i.e. the latitude and longitude datamapped from the zip code information, is used as the attributes of social dimension for consumer i. In Fig. 5, hybrid electricvehicle owners are shown in black, while the conventional vehicle owners are shown in gray. In the right figure, the darkblue lines represent the original links to nearest neighbors, while the light blue lines represent rewired links to random con-sumers in the network.
In product design, the small-world phenomenon implies that consumers not only consider the choices of close friends,but are also influenced by remote contacts, such as online reviews from people outside their regular social proximity. In

Fig. 4. Social network with different rewiring probabilities: (a) regular nearest neighbor (a = 0.0), (b) small world (a = 0.1), and (c) random network(a = 1.0).
hybrid vehicle ownerconventional vehicle owner
nearest neighbor linksrewired distant links
Fig. 5. California sample population from NHTS: left: geographical map; right: small-world network with n = 10, a = 0.01.
L. He et al. / Transportation Research Part D 32 (2014) 421–434 429
Stage II – social influence evaluation, we employ a variation of average friend effect described in Table 2, as shown in Eq.(7):
Ni;t ¼X
j
Lijyj;t�1
,Xj
Lij ð7Þ
where yj,t�1 is a binary variable that represents the choice behavior at previous time period t�1: 1 for a hybrid electric vehi-cle owner, and 0 for a conventional vehicle owner. This social influence attribute can be regarded as the percentage of hybridelectric vehicle owners in the focal consumer’s circle of friends. The simulated value of social influence attribute in Eq. (7) ispassed as an input to the choice model. The evaluation process iterates for each of the time periods t = 1 . . . T, to capture thedynamic nature of the social influence attribute.
Estimation of discrete choice models
Data from 13,802 respondents in California who owned vehicles of model years 2002–2009 are selected for building thediscrete choice model. Note that 2002 is the first year HEVs appeared in the NHTS data. While vehicles from multiple yearsare considered in our choice modeling, consumer profile and usage context attributes are based on data collected in 2009.Therefore, the choice model estimation results shown below are valid under the assumption that there is no significantchange in consumer profile and usage context from 2002 to 2009. Because the NHTS data provides no information aboutother vehicles considered by the respondents, three vehicles other than the one purchased are randomly selected from aset of 262 car models based on a uniform distribution to compose an individual choice set of four vehicles. McFadden(1978) has shown that a multinomial logit model estimate using choice sets composed of randomly selected members drawn

430 L. He et al. / Transportation Research Part D 32 (2014) 421–434
with a uniform distribution from the set of all choice alternatives will result in consistent estimates of the model parameters.Later in the sensitivity analysis, we study the impact of the number of vehicles in a choice set.
As shown in Fig. 6, seven consumer-desired vehicle attributes A are selected including price, miles per gallon (mpg), vehi-cle origin, vehicle size, vehicle type, area, acceleration (torque/vehicle weight), and an HEV indicator. The attribute ‘‘price’’represents the money respondents paid, excluding taxes, registration, trade-in value, etc. The miles per gallon comes fromthe combined mpg published by the US Environmental Protection Agency (EPA, 2008) and used as 100/miles per gallon in themodel specification to represent number of gallons required to drive 100 miles. Vehicle origins are categorized as domestic,European, Japanese, and Korean. Vehicle sizes are grouped into compact, midsize, large, and premium. Vehicle type includesmini (such as compact vehicles), car (such as sedans), sport utility vehicles (SUV), minivan, van, multi-activity vehicles(MAV), and pickup. Vehicle area is defined as the product of vehicle length and vehicle width, reflecting the general sizeof the car, while the power, i.e. torque, divided by vehicle weight, is used as an approximate measure of the acceleration fea-ture. The hybrid electric vehicle indicator, is coded as 1 for hybrids, and 0 for conventional vehicles.
Gender, age, household income, number of children under age 18, education level, are included as consumer profile attributesS. Numerous combinations of consumer attributes are tested in the choice modeling process. In the final choice model, onlythree consumer profile attributes, household income, number of children, and education level, are statistically significant. As forthe vehicle usage attributes E, the most commonly considered vehicle usage attributes miles driven daily is included.
The choice probability function of multinomial logit model is shown in Eq. (8). The log-likelihood function shown in Eq.(9) is maximized in Maximum Likelihood Estimation. The structure of the utility function is shown in Eq. (10), where inter-actions between A, E, S, and N are explicitly modeled. Alternative specific constants (ASC) for each of the car models are notincluded in the utility function. While this may decrease the goodness-of-fit of the model, it allows choice prediction of newvehicles in product design.
Pik;t ¼exp Wik;tP
l exp Wil;tð8Þ
b_
¼ arg maxb
XT
t¼1
XIt
i¼1
XK
k¼1
yik;t log Pik;t
!ð9Þ
W ¼ bA � Aþ bA�SA � Sþ bA�EA � Eþ bA�NA � N ð10Þ
Following the choice modeling procedure in stage III described in section ‘Choice modeling framework considering socialimpact’, interactions between consumer-desired product attributes A, consumer profile S, usage context attributes E, and thesocial influence attribute N are explicitly modeled in the utility function. The coefficients for all attributes and their inter-actions based on a multinomial logit model estimation (MNL with N) are compared to the estimation results from a multi-nomial logit model without ‘‘social network influence’’ (MNL without N). In this research, we propose to measure the ‘‘HEVpreference’’, which reflects a consumer’s attitude toward new hybrid technology, as a collective effect of all utility termsinvolving the hybrid electric vehicle (HEV) indicator, that is, HEV, interaction between HEV and high education level, inter-action between HEV and fuel price, and interaction between HEV and social impact, as shown in Table 3.
Goodness-of-fit measures based upon the log-likelihood of the converged model, such as the likelihood ratio index q2
(also known as pseudo R-square), reflect how well the estimated model predicts actual individual choices in the data set.Higher values of q2 indicate better predictions of the choices. As shown at the top of Table 3, a slightly higher q2 value of0.1459 are achieved using the MNL model with social influence attribute N versus the MNL model without N. The q2 valueof 0.1459 means that the MNL model with N has a 14.59% increase in the log-likelihood function, compared to the initial
Fig. 6. Selected attributes included in choice utility function.

Table 3Model statistics and coefficients of MNL with N and MNL without N (N = social influence).
MNL with N MNL without N
Likelihood ratio index q2 0.1459 0.1457Log likelihood at convergence �9968445.2 �9970466.7
Attributes Coeff. Std. err. Coeff. Std. err.
Price(k)/income �0.1598 0.0006 �0.1598 0.0006100/miles per gallon �0.8970 0.0013 �0.8960 0.0013100/miles per gallon ⁄miles driven daily �0.0007 0.0000 �0.0007 0.0000
Vehicle origin(domestic as base)European 0.0740 0.0020 0.0743 0.0020Japanese 0.8144 0.0011 0.8141 0.0011Korean �0.5864 0.0022 �0.5862 0.0022
Vehicle size (compact as base)Medium �0.4954 0.0013 �0.4957 0.0013Large �0.5031 0.0025 �0.5026 0.0025Premium �0.6153 0.0017 �0.6156 0.0017
Vehicle type (car as base)MAV �0.7805 0.0013 �0.7797 0.0013Mini car �0.4588 0.0031 �0.4600 0.0031Minivan �1.3492 0.0032 �1.3497 0.0032Minivan ⁄ number of children 0.6068 0.0016 0.6073 0.0016Pickup �0.4422 0.0020 �0.4432 0.0020SUV �0.8448 0.0024 �0.8447 0.0024SUV ⁄ number of children �0.2108 0.0021 �0.2101 0.0021Van �1.7665 0.0065 �1.7677 0.0065Area 0.0832 0.0006 0.0833 0.0006Acceleration 18.7690 0.0600 18.7885 0.0600
HEV preferenceHybrid electric vehicle (HEV) �2.0804 0.0080 �2.1592 0.0079Hybrid electric vehicle ⁄ high education level 0.6388 0.0034 0.6380 0.0034Hybrid electric vehicle ⁄ fuel price 0.7560 0.0030 0.8022 0.0029Hybrid electric vehicle ⁄ social impact 3.2379 0.0508 / /
L. He et al. / Transportation Research Part D 32 (2014) 421–434 431
model with zero information. Even though the proposed choice modeling framework captures the systematic heterogeneityof consumers by explicitly modeling the consumer attributes including the social influence attribute as model inputs, thedifferences between the two models are relatively small. A closer look into the data set revealed the underlying reason:HEV owners comprise a small percentage (7.59%) of the whole sample population, resulting into a limited number of obser-vations with non-zero social influence attribute values (0.67%).
From the results of the MNL including N attributes in modeling, we note that all coefficients are statistically significant atthe 0.01 level. The coefficients for price/income and 100/miles per gallon are negative as expected. Only three consumer profileattributes, household income, number of children, and education level, are statistically significant. A negative estimator for 100/miles driven daily ⁄miles driven daily indicates that the usage context attribute has a negative impact on consumer preferenceon the inverse of MPG measure, gasoline needed to travel 100 miles in this case. Similarly, the positive sign of minivan ⁄ num-ber of children suggests that households with children prefer minivans, which is consistent with our expectations. However,SUV ⁄ number of children has an unexpected sign, which is likely due to its correlation with other variables included in themodel. In cases where many attributes are correlated with each other, analyses of substitution effects for new predictiondata with similar correlation pattern is recommended. Under the HEV preference in Table 3, it is found that consumers havenegative attitudes toward the HEV indicator, excluding all interactions. This may be caused by uncertainty associated withthe new technology and limited consumer knowledge. Higher education level positively impacts people’s attitude towardHEV. A similar effect is seen with the average fuel price in a certain time period. As expected, the social impact (HEV ⁄ socialimpact) has a large positive impact on the hybrid electric vehicle attitude. It should be noted that in estimating the socialimpact over multiple years, we adopt a simplistic treatment where one coefficient b is identified for the term (Hybrid electricvehicle ⁄ social impact) using the data over eight years due to limited number of HEV owners. If multiple coefficients areconsidered for each time period, potential correlations among the coefficients in the time series can be identified.
The Likelihood Ratio Test (LRT) is commonly used (Hensher et al., 2005) to measure the performance of one model rel-ative to another. In our LRT, the null hypothesis is that the two models are identical, meaning including the social influence Ndoes not make difference. The log-likelihood ratio statistic (also known as deviance) from the compared models is computedagainst the critical value from a chi-square distribution with the degrees of freedom equal to the difference in the number ofexplanatory variables between the compared models. As the LRT result shows (Table 4), the estimated value of test statistic(4340.17) exceeds the critical value of the 0.001 level of confidence (10.83), and thus we reject the null hypothesis that the
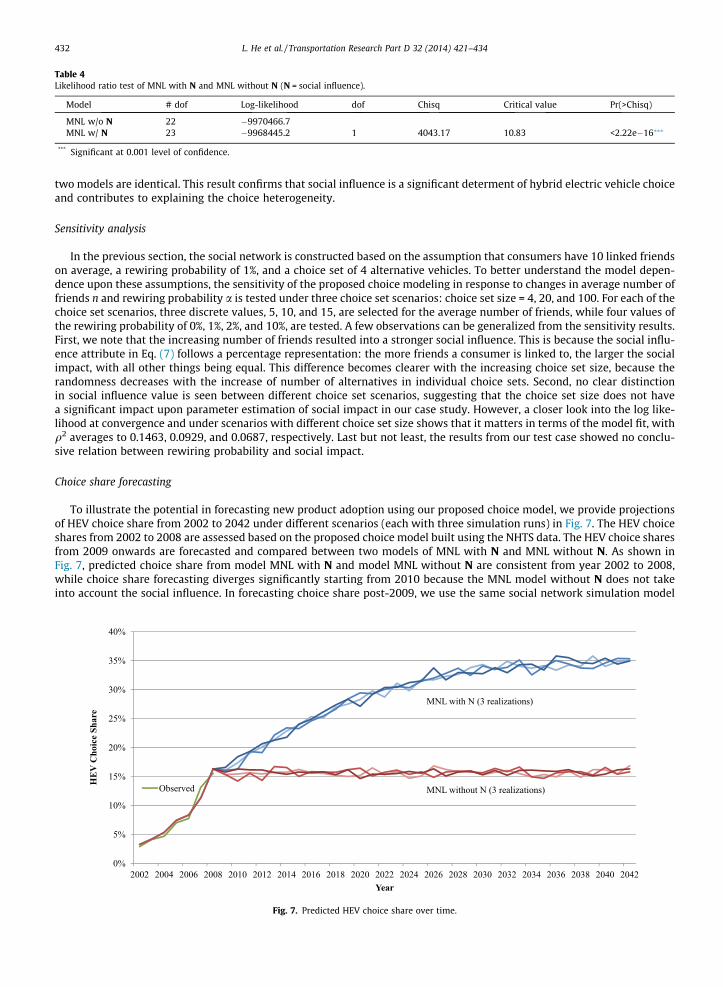
Table 4Likelihood ratio test of MNL with N and MNL without N (N = social influence).
Model # dof Log-likelihood dof Chisq Critical value Pr(>Chisq)
MNL w/o N 22 �9970466.7MNL w/ N 23 �9968445.2 1 4043.17 10.83 <2.22e�16⁄⁄⁄
*** Significant at 0.001 level of confidence.
432 L. He et al. / Transportation Research Part D 32 (2014) 421–434
two models are identical. This result confirms that social influence is a significant determent of hybrid electric vehicle choiceand contributes to explaining the choice heterogeneity.
Sensitivity analysis
In the previous section, the social network is constructed based on the assumption that consumers have 10 linked friendson average, a rewiring probability of 1%, and a choice set of 4 alternative vehicles. To better understand the model depen-dence upon these assumptions, the sensitivity of the proposed choice modeling in response to changes in average number offriends n and rewiring probability a is tested under three choice set scenarios: choice set size = 4, 20, and 100. For each of thechoice set scenarios, three discrete values, 5, 10, and 15, are selected for the average number of friends, while four values ofthe rewiring probability of 0%, 1%, 2%, and 10%, are tested. A few observations can be generalized from the sensitivity results.First, we note that the increasing number of friends resulted into a stronger social influence. This is because the social influ-ence attribute in Eq. (7) follows a percentage representation: the more friends a consumer is linked to, the larger the socialimpact, with all other things being equal. This difference becomes clearer with the increasing choice set size, because therandomness decreases with the increase of number of alternatives in individual choice sets. Second, no clear distinctionin social influence value is seen between different choice set scenarios, suggesting that the choice set size does not havea significant impact upon parameter estimation of social impact in our case study. However, a closer look into the log like-lihood at convergence and under scenarios with different choice set size shows that it matters in terms of the model fit, withq2 averages to 0.1463, 0.0929, and 0.0687, respectively. Last but not least, the results from our test case showed no conclu-sive relation between rewiring probability and social impact.
Choice share forecasting
To illustrate the potential in forecasting new product adoption using our proposed choice model, we provide projectionsof HEV choice share from 2002 to 2042 under different scenarios (each with three simulation runs) in Fig. 7. The HEV choiceshares from 2002 to 2008 are assessed based on the proposed choice model built using the NHTS data. The HEV choice sharesfrom 2009 onwards are forecasted and compared between two models of MNL with N and MNL without N. As shown inFig. 7, predicted choice share from model MNL with N and model MNL without N are consistent from year 2002 to 2008,while choice share forecasting diverges significantly starting from 2010 because the MNL model without N does not takeinto account the social influence. In forecasting choice share post-2009, we use the same social network simulation model
0%
5%
10%
15%
20%
25%
30%
35%
40%
2002 2004 2006 2008 2010 2012 2014 2016 2018 2020 2022 2024 2026 2028 2030 2032 2034 2036 2038 2040 2042
HE
V C
hoic
e Sh
are
Year
Observed
MNL with N (3 realizations)
MNL without N (3 realizations)
Fig. 7. Predicted HEV choice share over time.

L. He et al. / Transportation Research Part D 32 (2014) 421–434 433
as described in section ‘Social network simulation’, assuming that an average of 7% of the consumer population, following aPoisson distribution, enter the market each year to shop for a new car. This assumption is supported by historical data from2002 to 2008. With the increasing value of social influence attribute, the HEV choice share is forecasted to grow significantlyin the next decades with a gradually decreasing growth rate, while the forecast from MNL without N stays constant due tothe exclusion of dynamic social influence attributes in the utility function. Fig. 7 shows an S-shaped curve from MNL with Nfor HEV adoption in the future. The fact that the curve follows an S-shape is consistent with the product diffusion literature(Bass, 1969). The zigzagging in the curve reflects the assumption that the number of new consumers entering the marketvaries each year following a Poisson distribution. It should be noted that the forecast of HEV over time is intended toillustrate the potential of the proposed method in dynamic demand estimation rather than attempting to provide an accu-rate prediction of HEV adoption in the next 30 years. There are a number of factors which have not been considered in thisforecast, such as gas price trend, inflation in vehicle price and consumer income, new HEV models entering the market andtechnology advancements.
Conclusions
In this work, we propose an integrated choice modeling framework considering social impact for forecasting new productadoption. To the authors’ best knowledge, this is the first attempt in engineering design research to develop analytical tech-niques that integrate discrete choice models with social network simulations at the individual consumer level to addresssimultaneously the interactions between product, consumer, and social influence in product design. Modeling social contextwithin a choice modeling framework introduces a new dimension for understanding consumer attitudes towards new prod-ucts, and at the same time, provides engineering designers the flexibility of using such models to guide engineering designdecisions by optimizing the product attributes in the model. Together with the engineering performance and cost models,consumer choices can be linked to engineering design decisions, such as battery size and fuel economy target, as illustratedin He (2012). This integration offers a dynamic view of consumer choice of new products, in which consumer preferencesmay change over time due to social influence.
A case study of hybrid electric vehicle owners in California illustrates the potential benefits of the proposed methods insupporting the design of green products. Alternative fuel vehicles have received wide attention lately, and HEVs/PHEVsappear to be the most promising technologies at this time given recent technology developments, government incentives,and importantly, social impact on consumer choice of new products. Before these new vehicles enter the US market, fore-casting their full market potential is of great interest to the manufacturers, and government agencies. From a broader systempoint of view, such choice models can be further integrated into a multi-agent energy market simulation framework to studythe impact of consumer vehicle choice on the future electric generation, transmission, and distribution system.
It should be noted that our paper is focused on presenting the general framework and procedure of the proposed meth-odology with an illustrative case study demonstrating the potential usage of the approach. Due to the lack of real social net-work data, assumptions had to be made for network construction and social influence evaluation. These assumptions shouldbe validated in the future based on empirical studies of social network characteristics to ensure the accuracy of model pre-dictions. In addition, there exist multiple channels and activism mechanisms of social influence, e.g., advertisement, educa-tion programs, and online forum that are beyond the social network influence modeled in this research. Future research willbe aimed for integrating findings from social behavior studies in understanding social influence processes such as compli-ance, identification, and internalization into the modeling of social influence on new product adoption. Due to the indepen-dence of irrelevant alternatives assumption, the multinomial logit model presented in this work has limitations whichwarrant future research investigation by implementing other choice modeling techniques such as the Hierarchical Bayesmixed logit model. Moreover, there are potential confounding issues because both the social impact term N and the choiceutility W is a function of consumer profile attributes S. To extend and refine the current work, the two-stage Berry, Levinsoh,and Pakes method in Walker et al. (2011) could be considered to correct the endogeneity in a choice model with confoundingattributes.
Acknowledgements
Grant supports from National Science Foundation (CMMI-0700585 and DUE-0920047) and ISEN (Initiative for Sustain-ability and Energy at Northwestern) are greatly appreciated.
References
Axsen, J., Kurani, K., 2008. The Early US Market for PHEVs: Anticipating Consumer Awareness, Recharge Potential, Design Priorities and Energy Impacts.Institute of Transportation Studies, University of California Davis, Davis, CA.
Axsen, J., Kurani, K., 2009. Interpersonal Influence within Car Buyers’ Social Networks: Five Perspectives on Plug-in Hybrid Electric Vehicle DemonstrationParticipants. Institute of Transportation Studies, University of California Davis, Davis, CA.
Barabási, A.L., Albert, R., 1999. Emergence of scaling in random networks. Science 286 (5439), 509.Bass, F.M., 1969. A new product growth for model consumer durables. Manage. Sci. 15 (5), 215–227.Brock, W.A., Durlauf, S.N., 2001. Discrete choice with social interactions. Rev. Econ. Stud. 68 (2), 235–260.Brock, W.A., Durlauf, S.N., 2002. A multinomial-choice model of neighborhood effects. Am. Econ. Rev. 92 (2), 298–303.Carrasco, J.A., Miller, E.J., 2006. Exploring the propensity to perform social activities: a social network approach. Transportation 33 (5), 463–480.

434 L. He et al. / Transportation Research Part D 32 (2014) 421–434
Carrasco, J.A., Hogan, B., Wellman, B., Miller, E.J., 2008. Collecting social network data to study social activity-travel behavior: an egocentric approach.Environ. Plan. B, Plan. Des. 35 (6), 961.
Case, A., 1992. Neighborhood influence and technological change. Reg. Sci. Urban Econ. 22 (3), 491–508.Dugundji, E., Gulyas, L., 2003a. Empirical estimation and multi-agent based simulation of a discrete choice model with network interaction effects. In:
Proceedings of the 8th International Conference on Computers in Urban Planning and Urban Management. Sendai, Japan.Dugundji, E.R., Gulyas, L., 2003b. An exploration of the role of global versus local and social versus spatial networks in transportation mode choice behavior
in the Netherlands. In: Proceedings of AGENT.Dugundji, E.R., Walker, J.L., 2005. Discrete choice with social and spatial network interdependencies: an empirical example using mixed generalized
extreme value models with field and panel effects. Transport. Res. Rec: J. Transport. Res. Board 1921 (1), 70–78.Easley, D., Kleinberg, J., 2010. Networks, Crowds, and Markets: Reasoning About a Highly Connected World. Cambridge Univ Pr..EPA, U.E.P.A., 2008. Fuel Economy Guide 2008. In: http://www.fueleconomy.gov/feg/feg2008.pdf (Ed.).Facebook. Statistics <http://www.facebook.com/press/info.php?statistics> (accessed 24.01.12).Faust, K., Wasserman, S., 1994. Social Network Analysis: Methods and Applications. Cambridge University Press, New York.Festinger, L., 1954. A Theory of Social Comparison Processes. Bobbs-Merrill.FHWA, 2009. National Household Travel Survey (NHTS), version 2.0 datasets, November 2010 ed. Federal Highway Administration.Friedkin, N.E., 2006. A Structural Theory of Social Influence. Cambridge University Press.Frischknecht, B.D., Whitefoot, K., Papalambros, P.Y., 2010. On the suitability of econometric demand models in design for market systems. J. Mech. Des. 132,
121007.He, L., 2012. Usage and Social Context-based Choice Modeling for Engineering Design, Mechanical Engineering. Northwestern University, Evanston, IL.He, L., Chen, W., Conzelmann, G., 2012a. Impact of vehicle usage on consumer choice of hybrid electric vehicles. Transport. Res. Part D: Transp. Environ. 17
(3), 208–214.He, L., Chen, W., Hoyle, C., Yannou, B., 2012b. Choice modeling for usage context-based design. J. Mech. Des. 134 (3), 031007.Hensher, D.A., Rose, J.M., Greene, W.H., 2005. Applied Choice Analysis: A Primer. Cambridge University Press.Hoyle, C., Chen, W., Wang, N., Gomez-Levi, G., 2011. Understanding and modelling heterogeneity of human preferences for engineering design. J. Eng. Des.
22 (8), 583–601.Kossinets, G., Watts, D.J., 2006. Empirical analysis of an evolving social network. Science 311 (5757), 88–90.Krugman, P., 1990. Increasing Returns and Economic Geography. National Bureau of Economic Research.Li, H., Azarm, S., 2000. Product design selection under uncertainty and with competitive advantage. J. Mech. Des. 122 (4), 411–418.MacDonald, E.F., Gonzalez, R., Papalambros, P.Y., 2009. Preference inconsistency in multidisciplinary design decision making. J. Mech. Des. 131, 031009.McFadden, D., 1978. Modelling the Choice of Residential Location. Institute of Transportation Studies, University of California.McFadden, D., 2010. Sociality, rationality, and the ecology of choice. In: Hess, S., Daly, A. (Eds.), Choice Modelling: The State-of-the-Art and the State-of-
Practice: Proceedings from the Inaugural International Choice Modelling Conference. Emerald Group Publishing.Michalek, J.J., Ceryan, O., Papalambros, P.Y., 2006. Balancing marketing and manufacturing objectives in product line design. J. Mech. Des. 128, 1196.Narayan, V., Rao, V.R., Saunders, C., 2011. How peer influence affects attribute preferences: a Bayesian updating mechanism. Market. Sci. 30 (2), 368–384.Páez, A., Scott, D.M., Volz, E., 2008. A discrete-choice approach to modeling social influence on individual decision making. Environ. Plan. B: Plan. Des. 35 (6),
1055–1069.Rogers, E., 1995. Diffusion of Innovations, forth ed. Free Press, NY.Shiau, C.S.N., Michalek, J.J., 2009. Optimal product design under price competition. J. Mech. Des. 131, 071003.Shiau, C., Samaras, C., Hauffe, R., Michalek, J., 2009. Impact of battery weight and charging patterns on the economic and environmental benefits of plug-in
hybrid vehicles. Energy Policy 37 (7), 2653–2663.Snijders, T.A.B., 2001. The statistical evaluation of social network dynamics. Sociol. Methodol. 31 (1), 361–395.Stonedahl, F., Rand, W., Wilensky, U., 2010. Evolving viral marketing strategies. In: GECCO.Struben, J., Sterman, J.D., 2008. Transition challenges for alternative fuel vehicle and transportation systems. Environ. Plan. B, Plan. Des. 35 (6), 1070.Sullivan, J.L., Stephan, C., Goodman, B., Everson, M., 2005. Market Penetration of More sustainable vehicles: the HEV case. In: Proceedings of the Agent 2005
Conference on Generative Social Processes, Models, and Mechanisms, pp. 295–306.Sullivan, J.L., Salmeen, I.T., Simon, C.P., 2009. PHEV marketplace penetration: an agent based simulation. UMTRI-2009-32.Sullivan, E., Ferguson, S., Donndelinger, J.A., 2011. Exploring differences in preference heterogeneity representation and their influence in product family
design. In: Proceedings of the 2011 ASME Design Engineering Technical Conferences and Computers in Engineering Conference. Washington, DC, pp.DETC2011-48596.
Tran, M., 2012. Agent-behaviour and network influence on energy innovation diffusion. Commun. Nonlinear Sci. Numer. Simul. 17 (9), 3682–3695.Walker, J.L., Ehlers, E., Banerjee, I., Dugundji, E.R., 2011. Correcting for endogeneity in behavioral choice models with social influence variables. Transport.
Res. Part A: Policy Pract.Wassenaar, H.J., Chen, W., 2003. An approach to decision-based design with discrete choice analysis for demand modeling. J. Mech. Des. 125, 490.Watts, D.J., 2004. Six Degrees: The Science of a Connected Age. WW Norton & Company.Watts, D., Strogatz, S., 1998a. Collective dynamics of ‘small-world’ networks. Nature 393 (6684), 440–442.Watts, D.J., Strogatz, S.H., 1998b. Collective dynamics of ‘small-world’ networks. Nature 393 (6684), 440–442.Wilensky, U., 1999. NetLogo. Center for Connected Learning and Computer-Based Modeling, Northwestern University, Evanston, IL.Williams, N., Azarm, S., Kannan, P., 2008. Engineering product design optimization for retail channel acceptance. J. Mech. Des. 130, 061402.Yang, S., Allenby, G.M., 2003. Modeling interdependent consumer preferences. J. Mark. Res. 40 (3), 282–294.