transportation operations group toward a consistent and robust integrated multi-resolution modeling...
TRANSCRIPT

Transportation Operations Group
Toward a Consistent and Robust Integrated Multi-Resolution Modeling
Approach for Traffic Analysis
May 17-21, 2009
Jeff Shelton, TTIYi-Chang Chiu, Univ. of Arizona
TRB – Transportation Planning ConferenceHouston, TX

Transportation Operations Group
Outline
Introduction– Mesoscopic– Microscopic
Multi-Resolution Modeling– Concept– Conversion Process– Modeling Issues
Case Study
Applications
Transportation Operations Group
Outline
Introduction– Mesoscopic– Microscopic
Multi-Resolution Modeling– Concept– Conversion Process– Modeling Issues
Case Study
Applications

Transportation Operations Group
Introduction
Integrating mesoscopic dynamic traffic assignment (DTA) and microscopic traffic simulation and assignment models can be advantageous for region-wide operational planning projects– DTA – region-wide estimation of traffic redistribution– Microscopic – local operational analysis
The integration synergizes the strengths of both models.
Challenges remain in model translation and interface
Modeling issues to be addressed– Consistency– Situation in which feedback is needed
Transportation Operations Group
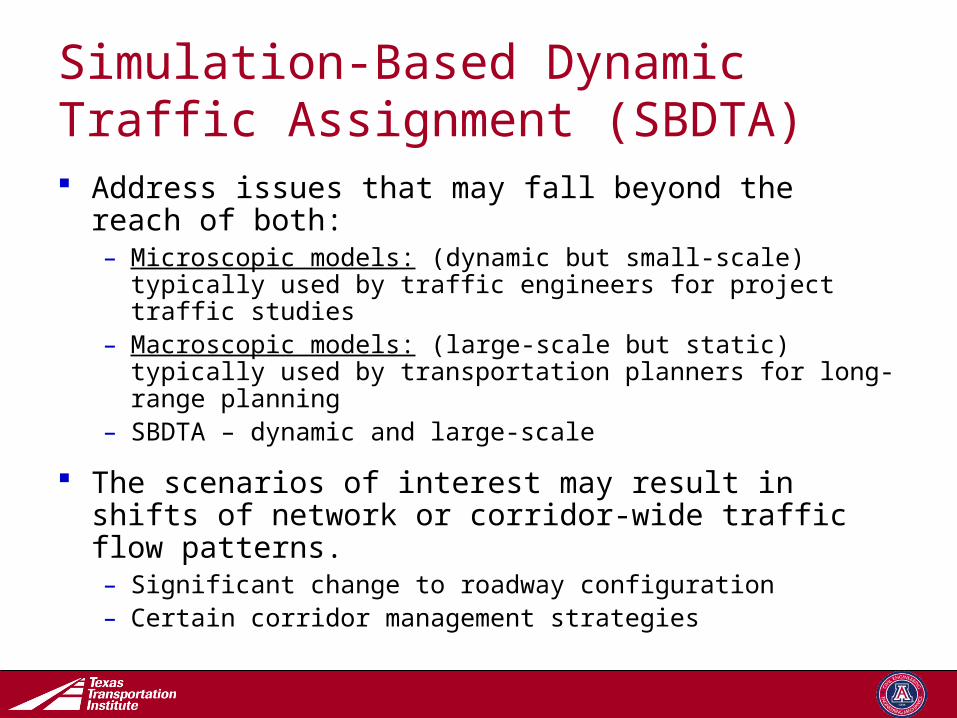
Simulation-Based Dynamic Traffic Assignment (SBDTA) Address issues that may fall beyond the reach of
both:– Microscopic models: (dynamic but small-scale) typically
used by traffic engineers for project traffic studies– Macroscopic models: (large-scale but static) typically
used by transportation planners for long-range planning– SBDTA – dynamic and large-scale
The scenarios of interest may result in shifts of network or corridor-wide traffic flow patterns.– Significant change to roadway configuration– Certain corridor management strategies

Transportation Operations Group
Mesoscopic Dynamic Traffic Assignment DynusT v2.0
– Free version available for DYNASMART-P users
Dynamic simulation and assignment tool for regional operational planning analysis
Equilibrium-based Dynamic Traffic Assignment– Assigned paths are based on
experienced (actual) travel time
Applications– Assess impacts of ITS
technologies– Work zone planning and traffic
management– Evaluate HOV/HOT lanes– Congestion pricing– Special event/emergency
evacuation

Transportation Operations Group
Microscopic
VISSIM 5.1
A driver-behavior-based simulation tool capable of performing multiple applications including– Analyzing complex intersections – Border crossings inspection
booths– Managed lanes – University campus settings
Fined-grained analysis– Vehicle interactions– Individual lane analysis
Simulate multiple modes of transportation simultaneously 3-D graphics
Transportation Operations Group
Outline
Introduction– Mesoscopic– Microscopic
Multi-Resolution Modeling– Concept– Conversion Process– Modeling Issues
Case Study
Applications
Transportation Operations Group
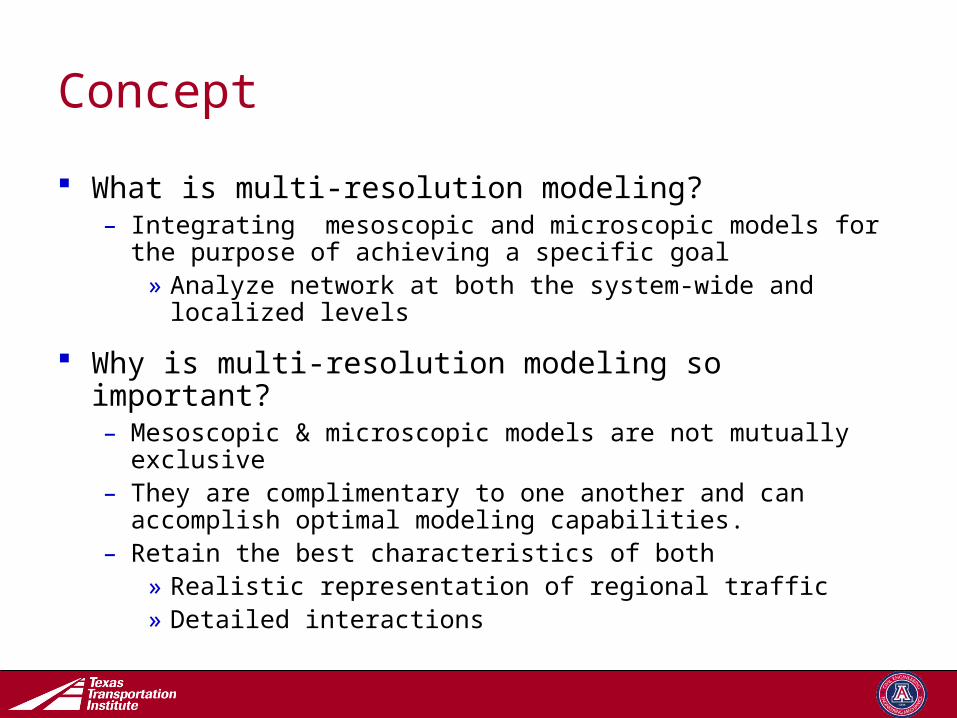
Concept
What is multi-resolution modeling?– Integrating mesoscopic and microscopic models for the
purpose of achieving a specific goal» Analyze network at both the system-wide and
localized levels
Why is multi-resolution modeling so important?– Mesoscopic & microscopic models are not mutually
exclusive– They are complimentary to one another and can
accomplish optimal modeling capabilities.– Retain the best characteristics of both
» Realistic representation of regional traffic» Detailed interactions

Transportation Operations Group
Concept
Mesoscopic Model Model Conversion
Process Integration
Tool
MicroscopicModel

Transportation Operations Group
Concept
DynusT VISSIMVISUMSub-Area
Transportation Operations Group
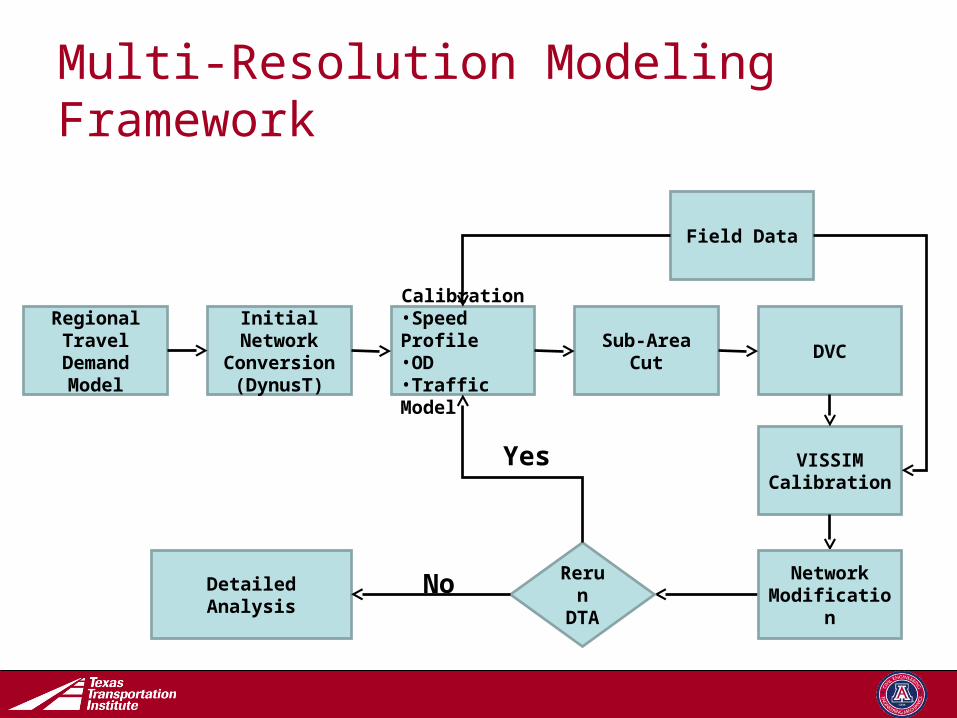
Multi-Resolution Modeling Framework
Regional Travel
Demand Model
Initial Network
Conversion (DynusT)
Calibration•Speed Profile•OD•Traffic Model
Sub-Area Cut
DVC
VISSIMCalibration
Network Modificatio
n
Field Data
Rerun
DTA
Detailed Analysis
No
Yes

Transportation Operations Group
DTA Model Preparation
Convert the GIS layer of the Travel Demand Model to Mesoscopic format.
Disaggregate 24-hour matrix based upon car & truck– Home to work– Work to home– Home to private– Private to home– Thru– External Local– Non-home based external local
Multiply each matrix by corresponding hourly factor

Transportation Operations Group
DTA Model Preparation
H-W W-H H-P P-HTHR
UEXLO
NHBEXLO
Multiply each matrix by
hourly factor
Summation of matrices gives you directional
1-hour matrix

Transportation Operations Group
DTA Model Preparation
24 - one hour matrices

Transportation Operations Group
Calibration
Traffic flow model– Traffic simulation in
DynusT is based upon the Anisotropic Mesoscopic Simulation (AMS) model
– Moves vehicles based upon speed-density (v-k) relationship
– v-k relationship is derived from Greenshields equation

Transportation Operations Group
Calibration
Time-Dependent OD – Minimize the deviation
between simulated and actual screen line counts & speed profile
– Iterative process– Program solves
linearized quadratic minimization problem
– Results in updated OD matrices
Traffic Network Traffic Flow Model
Intersection Controls
Estimated Time-Dependent OD
Matrices
Traffic Assignment/Simulation
Linear Optimization
Model
Optimized Affected, Time-Dependent OD
Pairs
Results
Up
date
Dem
an
d
Assignment Results

Transportation Operations Group
Conversion Process
Sub-area cut– Remove unneeded
sections of network– Renumbering of new
zones, nodes and links– Retains paths and flows
that travel through the sub-area
Transportation Operations Group
Conversion Process
DynusT-VISSIM Converter– Developed by researchers
from TTI and UA– Converts roadway
network to VISUM network
– Retains network geometry
– Converts all time-dependent paths and flows
– Creates separate transportation systems (car, truck)

Transportation Operations Group
Conversion Process
Microscopic model– Calibrate VISSIM model
to reflect realistic roadway conditions
– Perform detailed “fine-grained” analyses» Speed profile for
individual lanes» Lane-changing
behaviors» Vehicle interactions
at merge areas– Create 3-D graphics for
presentations

Transportation Operations Group
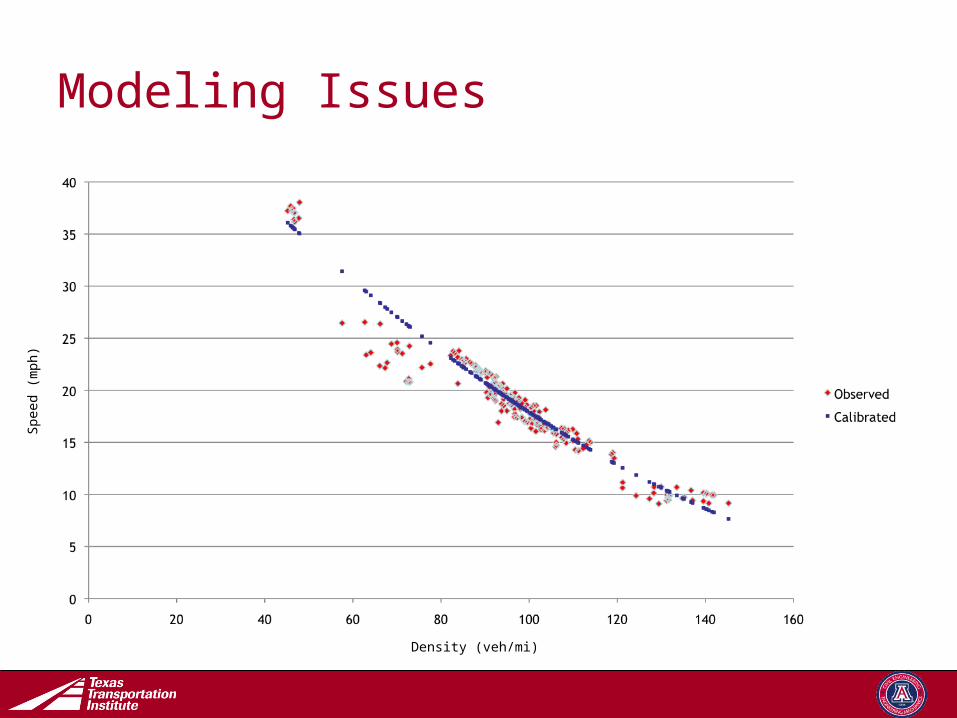
Modeling Issues
Consistency– Network
» Lane configuration» Geometric design
– Paths and flow» Verify same origin/destination paths» Verify number of vehicles generated
– Speed profile» Perform field data collection to determine speed and
vehicle counts» Obtain v-k curve from simulation output» Calibrate models with field data
Transportation Operations Group
Modeling Issues
Density (veh/mi)
Sp
eed
(m
ph
)
Transportation Operations Group
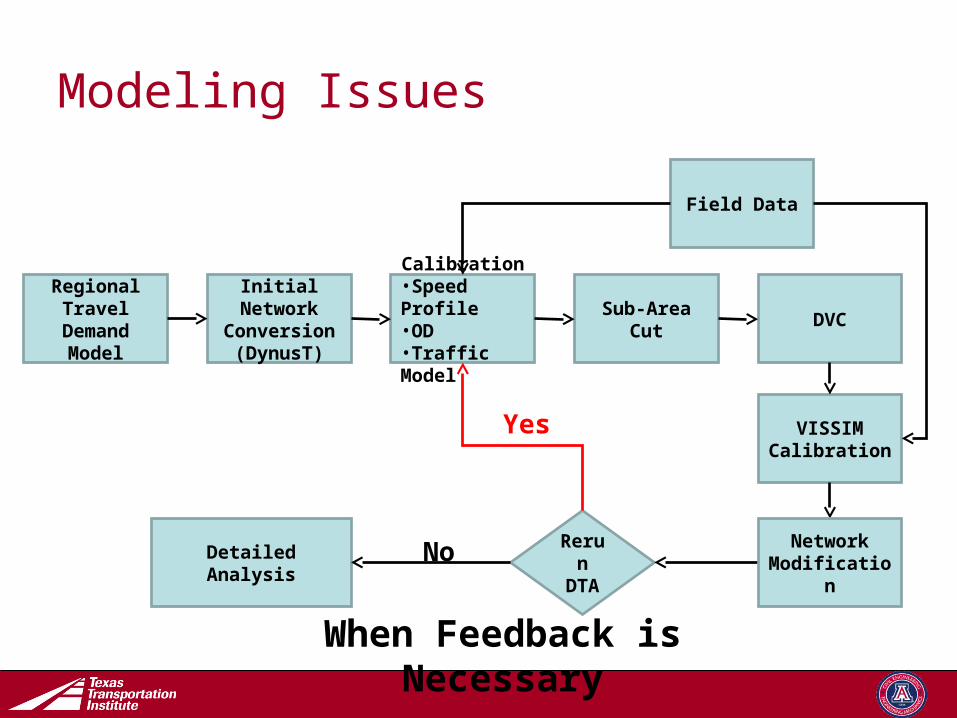
Modeling Issues
When Feedback is Necessary
Rerun
DTA
Regional Travel
Demand Model
Initial Network
Conversion (DynusT)
Calibration•Speed Profile•OD•Traffic Model
Sub-Area Cut
DVC
VISSIMCalibration
Network Modificatio
n
Field Data
Detailed Analysis
No
Yes

Transportation Operations Group
Outline
Introduction– Mesoscopic– Microscopic
Multi-Resolution Modeling– Concept– Conversion Process– Modeling Issues
Case Study
Applications

Transportation Operations Group
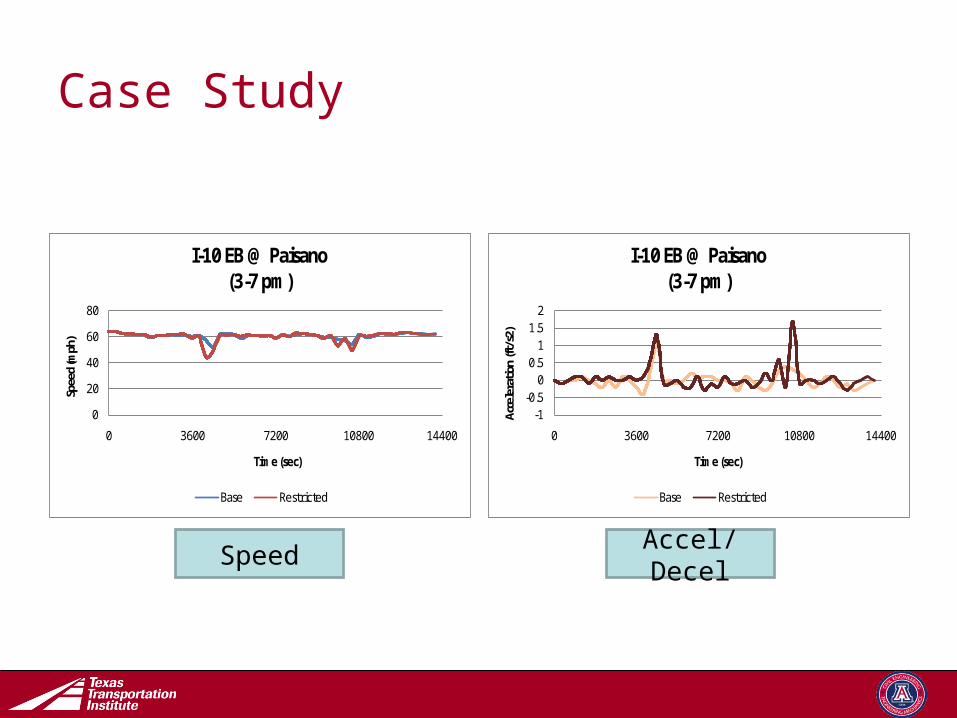
Case Study
City Council proposes
ordinance to restrict trucks from using left
lane on I-10 corridor
How does the ordinance affect the
freeway and surrounding arterials?
Transportation Operations Group
Case Study
Which type of model do I use?

Transportation Operations Group
Case Study
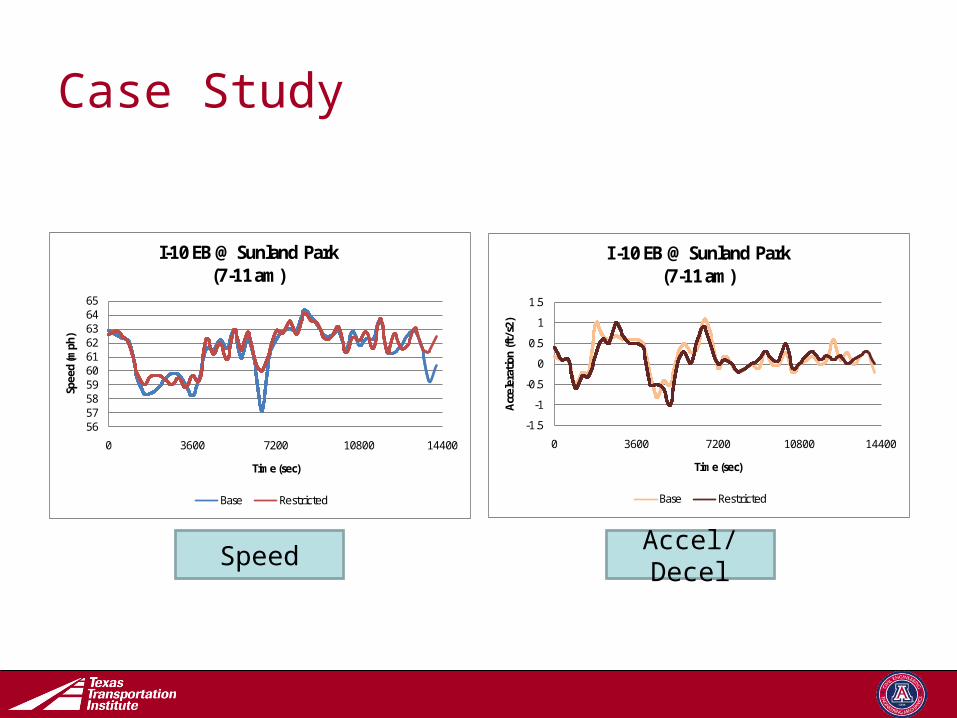
Truck restricted lanes– A case study to analyze the effectiveness of restricting
trucks from left-most fast lane on freeway– 22-mile corridor of I-10 in El Paso, TX– Analyze a.m. peak, p.m. peak, & mid-day– Determine benefits
» Speed on left-most lane» Acceleration/Deceleration patterns» Vehicle interactions at merge areas
– DynusT estimates region-wide truck trajectories (route and flows)
– VISSIM models detailed IH-10 truck lane operations given truck trajectories

Transportation Operations Group
Model Development
106 Origin/Destination links - 1895 Routes created
Transportation Operations Group
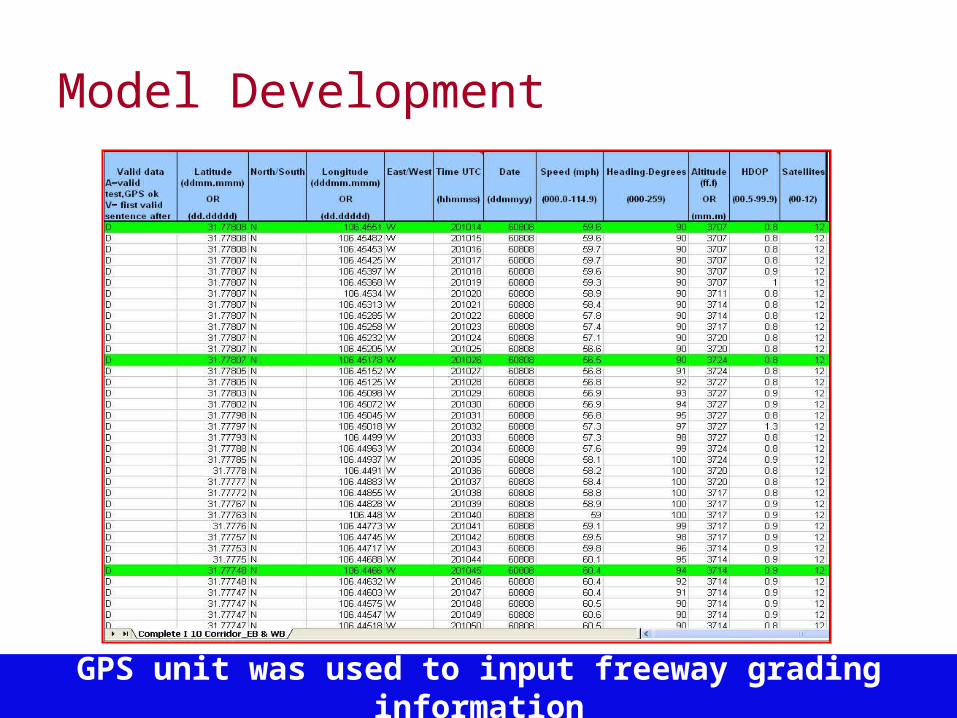
Model Development
GPS unit was used to input freeway grading information

Transportation Operations Group
Model Development
Field data collection-freeway speed
profile (PM peak hour)
Transportation Operations Group
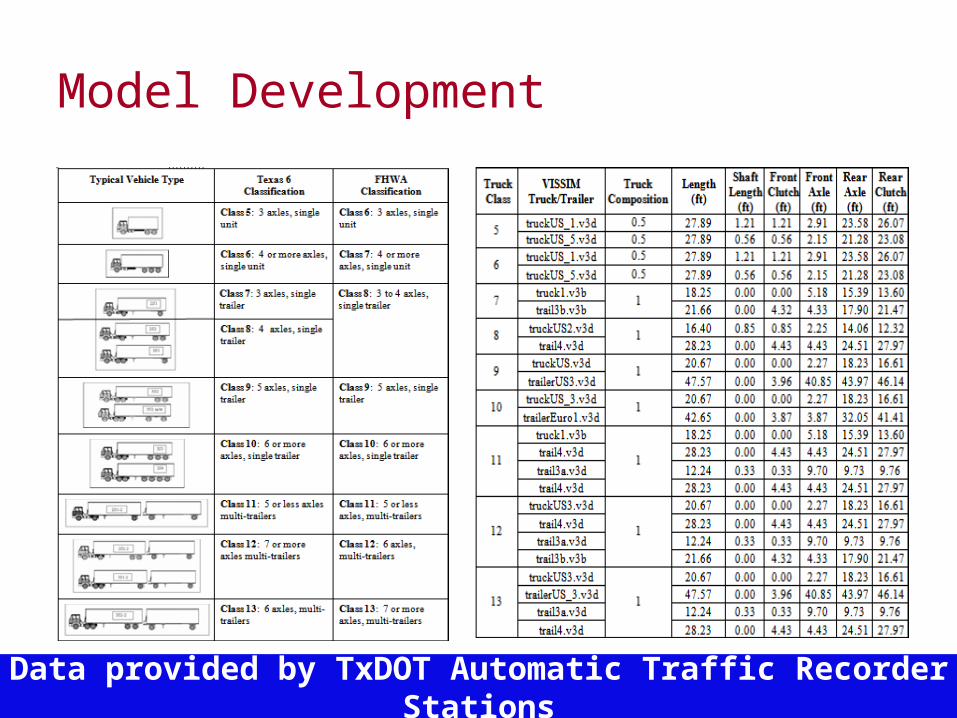
Model Development
Data provided by TxDOT Automatic Traffic Recorder Stations

Transportation Operations Group
Model Development
Transportation Operations Group
Case Study
56575859606162636465
0 3600 7200 10800 14400
Spee
d (m
ph)
Time (sec)
I-10 EB @ Sunland Park(7-11 am)
Base Restricted
-1.5
-1
-0.5
0
0.5
1
1.5
0 3600 7200 10800 14400
Acce
lera
tion
(ft/s
2)
Time (sec)
I -10 EB @ Sunland Park(7-11 am)
Base Restricted
SpeedAccel/Decel
Transportation Operations Group
Case Study
0
20
40
60
80
0 3600 7200 10800 14400
Spee
d (m
ph)
Time (sec)
I-10 EB @ Paisano(3-7 pm)
Base Restricted
-1-0.5
00.51
1.52
0 3600 7200 10800 14400
Acce
lera
tion
(ft/s
2)
Time (sec)
I-10 EB @ Paisano(3-7 pm)
Base Restricted
SpeedAccel/Decel

Transportation Operations Group
Case Study
0
20
40
60
80
0 3600 7200 10800 14400
Spee
d (m
ph)
Time (sec)
I-10 WB @ PaisanoLeft Lane (3-7 pm)
Base Restricted
0
20
40
60
80
0 3600 7200 10800 14400
Spee
d (m
ph)
Time (sec)
I-10 WB @ PaisanoRight Lane (3-7 pm)
Base Restricted
Speed – Left vs. Right Lane

Transportation Operations Group
Outline
Introduction– Mesoscopic– Microscopic
Multi-Resolution Modeling– Concept– Conversion Process– Modeling Issues
Case Study
Applications
Transportation Operations Group
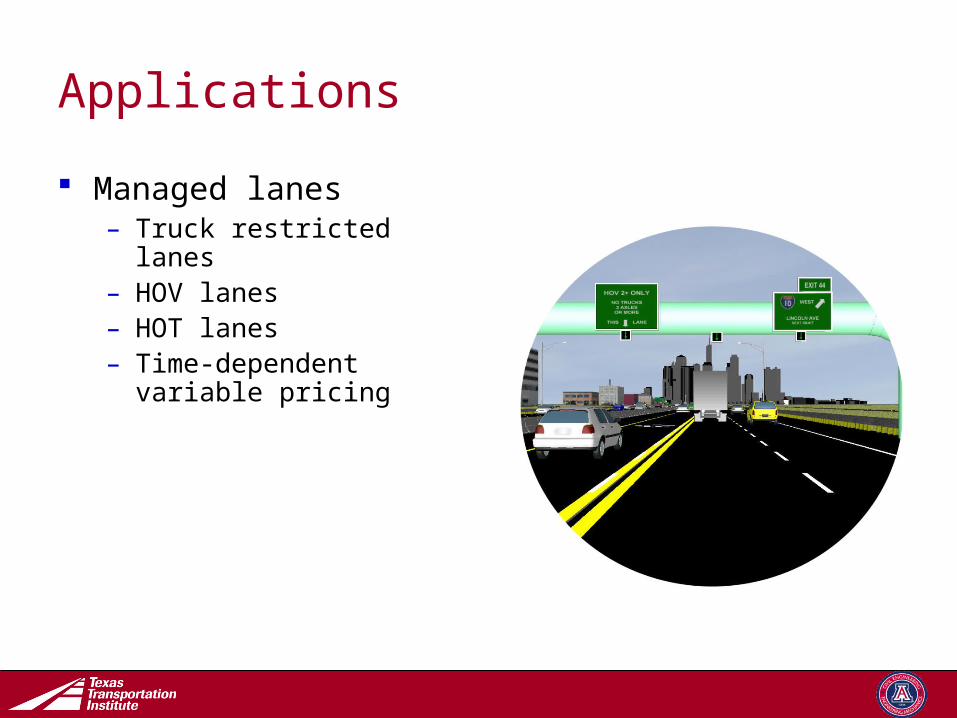
Applications
Managed lanes– Truck restricted lanes– HOV lanes– HOT lanes– Time-dependent
variable pricing
Transportation Operations Group
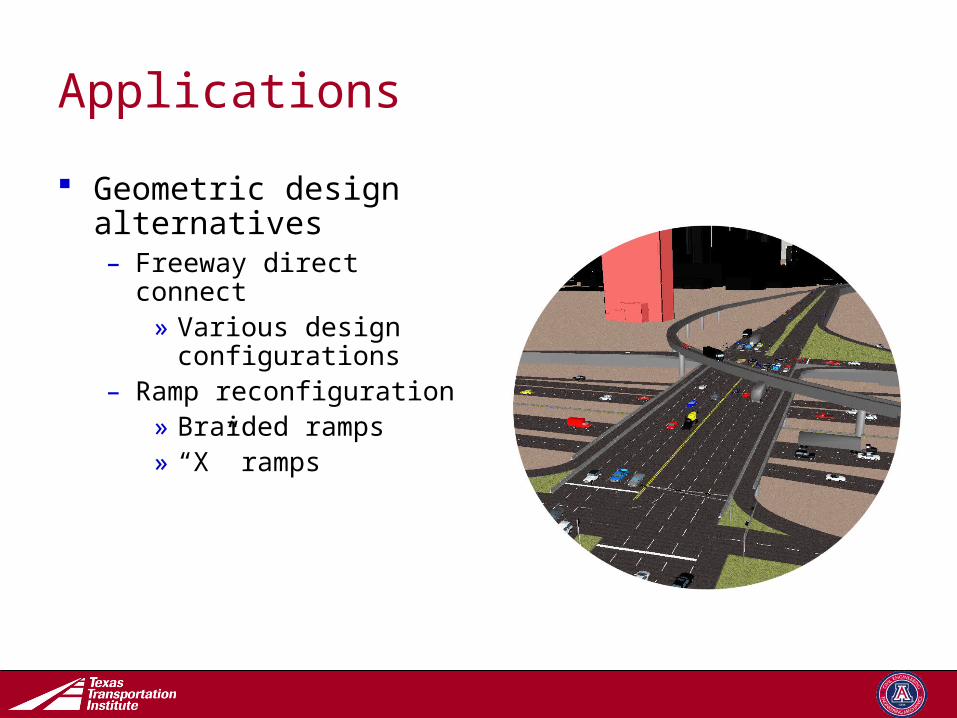
Applications
Geometric design alternatives– Freeway direct connect
» Various design configurations
– Ramp reconfiguration» Braided ramps» “X” ramps

Transportation Operations Group
Applications
Traffic impact studies– New retail shopping
centers» Driveways» Pedestrian crossings
– University campus planning» Integrating various
modes of transportation (e.g. student, faculty, staff, pedestrians, transit)
» New parking facilities» Campus core closure
– Traffic calming

Transportation Operations Group
Questions ?