transportation and environment: problems in delhi and … · transportation and environment:...
TRANSCRIPT

Transportation and Environment: Problems in Delhi and Beijing
Prof. Peter Rogers and Karolin Kokaz
September 28, 2000

• Recently with the population growth and economic expansion, the number of vehicles has been increasing rapidly in China and India.
• Automobile emissions are the most rapidly growing source of urban air pollution in most developing cities.
• These emissions contribute to a disproportionate amount to human exposure. And also, the highest polluting vehicles provide an huge amount of these total emissions.
• Therefore, targeting vehicular pollution control is more cost effective than the industrial sector.
• The following slides include some international comparisons in transport system characteristics of different cities in the world, the description of Delhi’s and Beijing’s transportation sector and its effect on the environment.

Share of Air Pollutant Emissions from the Mobile Sector
CO HC NOx SO2 PMMexico, 1994 100% 53.3% 70% 26.5% 4.3%Santiago, 1992 94.2% 82.7% 84.6% 24% 11.5%São Paulo, 1995 96.4% 90.9% 97.3% 85.5% 42.7%Rio de Janeiro, 1978 96.4% 73.2% 69.6% 9.5% 3.5%Beijing, 1992 63.4% 73.5% 21.7%Beijing, 1995 86.2% 49.1% 10%Delhi, 1995 80.5% 95.2% 69.4% 4.6% 6.6%
As the polluting industries which are scattered all around the urban area in Delhi and Beijing move out to the suburban areas and thetransportation sector continue to grow, the share of mobile sources emissions will keep on rising.
Source: World Bank Report. Vehicular Air Pollution: Experience from Seven Latin American Urban Cities, 1997. Data in Beijing comes from the report titled China’s Strategies for Controlling Motor Vehicle Emissions, 1997.

Comparison of passenger trip mix among big cities in the world
BusCarLight railSubwayMCNMVOthers
100%0% 20% 40% 60% 80%
Beijing
Mexico city
Seoul
Bangkok
Rio de Janeiro
Buenos Aires
New York
London
Paris
Tokyo 1990
1990
1990
1990
1992
1995
1992
1992
1992
1995
Delhi, 1994 Buses Cars Light Rail/Subway MC NMV Others% 62.00% 6.94% 0.00% 17.59% 6.61% 6.86%
Others: Autorickshaws Taxis Rail Others% 2.80% 0.06% 0.38% 3.62%

Comparison of Vehicle Ownership and Pollution in Big Cities in the World
Veh
icle
ow
ners
hip,
mill
ion
NO
xco
ncen
tratio
n, µ
g/m
3
Data for Delhi vehicle number is in 1997, NOx pollution is monthly average in 1998. Data for Beijing is in 1998. Others are in 1990.
7.2
9.310.2
2.9
1.4
3.9
0
2
4
6
8
10
12
London New York Paris Tokyo Delhi Beijing0
20
40
60
80
100
120

Comparison of Road Infrastructure & # of Vehicles in Big Cities in the World
Road Supply (m/person) Total Vehicles per km of RoadNew York (1991) 4.70 99
Paris (1991) 0.90 410London (1991) 1.90 186Tokyo (1991) 1.90 140Beijing (1995) 0.94 50Delhi (1992) 2.17 90
Source: Newman and Kenworthy (1991). For Beijing; "China's Strategies for Controlling Motor Vehicle Emissions: Summary Report", China Environmental Technical Assistance Project: B-9-3, World Bank, May 1998.

Air Pollution in Different Cities in the World in 1995 (µg/m3)
City TSP SO2 NO2Beijing 377 90 122Delhi 415 24 41Tokyo 49 18 68Mexico City 279 74 130London 25 77New York 26 79Los Angeles 9 74

WHO Standards and Standards in BeijingTime-Weighted Average OtherWHO / Beijing
1 hour 24 hours 1 year Averaging TimesNOx (µg/m3) / 150 / 100 30 / 50 95 (4 hours)Ozone (µg/m3) 150-200 / 160 100-120 (8 hours)SO2 (µg/m3) 350 / 500 125 / 150 40-60 / 60 500 (10 min)TSP (µg/m3) 120 / 300 60-90 / 200PM-10 (µg/m3) 70 / 150 50 / 100CO (mg/m3) 30 / 10 / 4 60 (30min)
100 (15 min)
Pollutant Concentration in Ambient Air WHO(µg/m3) Industrial Residential Sensitive (µg/m3)SO2 80 60 15 40-60NOx 80 60 15SPM 360 140 70 60-90PM10 120 60 50 50CO (mg/m3) 5 2 1
Annual Ambient Air Quality Standards in Delhi

Beijing
New housing
• 5 ring roads
• new housing under construction around the 5th ring road area
• 14 satellite cities being built in the suburban and rural areas
• This suburbanization and decentralization plan of Beijing will increase future pass-km demand and put more strain on the transportation system.
• Car ownership (1995): 9 vehicles/1000 people

• 1 meter resolution black-and-white image of the Forbidden City, Beijing. • IKONOS satellite collected the image on October 20, 1999.
Beijing, China

0
1000000
2000000
3000000
4000000
5000000
6000000
7000000
no. o
f veh
icle
s
1980
1983
1986
1989
1992
1995
1998
2001
2004
2007
2010
2013
2016
2019
Vehicle Growth in Beijing
MCHDDVHDGVLDVBusesTaxisCars
0
100000
200000
300000
400000
500000
600000
700000
800000
900000
No. o
f Veh
icles
1980
1981
1982
1983
1984
1985
1986
1987
1988
1989
1990
1991
1992
1993
1994
1995
Historical Vehicle Growth in Beijing
MCsTaxisBusesHDDVHDGVLDVCars

Fuel Consumption by Vehicle Type
0
5,000
10,000
15,000
20,000
25,000
30,000
mill
ion
liter
s/ye
ar MCHDDVHDGVLDVBusesTaxisCars
• Fuel consumption increases by 8 times from 1995 to 2020
• This will result in a need for increased imports in the future.

02000400060008000
100001200014000160001800020000
tons
/day
1980
1983
1986
1989
1992
1995
1998
2001
2004
2007
2010
2013
2016
2019
CO Emissions from Vehicles in Beijing
MCHDDVHDGVLDVBusesTaxisCars
0
500
1000
1500
2000
2500
3000
3500
tons
/day
1980
1983
1986
1989
1992
1995
1998
2001
2004
2007
2010
2013
2016
2019
HC Emissions from Vehicles in Beijing
MCHDDVHDGVLDVBusesTaxisCars
0
100
200
300
400
500
600
700
800
tons
/day
1980
1983
1986
1989
1992
1995
1998
2001
2004
2007
2010
2013
2016
2019
NOx Emissions from Vehicles in Beijing
MCHDDVHDGVLDVBusesTaxisCars
0
1
2
3
4
5
6
7
tons
/day
1980
1983
1986
1989
1992
1995
1998
2001
2004
2007
2010
2013
2016
2019
TSP Emissions from Vehicles in Beijing
MCHDDVHDGVLDVBusesTaxisCars

0
10
20
30
40
50
60
70
80
tons
/day
1980
1983
1986
1989
1992
1995
1998
2001
2004
2007
2010
2013
2016
2019
SO2 Emissions from Vehicles in Beijing
MCHDDVHDGVLDVBusesTaxisCars
020000400006000080000
100000120000140000160000180000
tons
/day
1980
1983
1986
1989
1992
1995
1998
2001
2004
2007
2010
2013
2016
2019
CO2 Emissions from Vehicles in Beijing
MCHDDVHDGVLDVBusesTaxisCars

Delhi
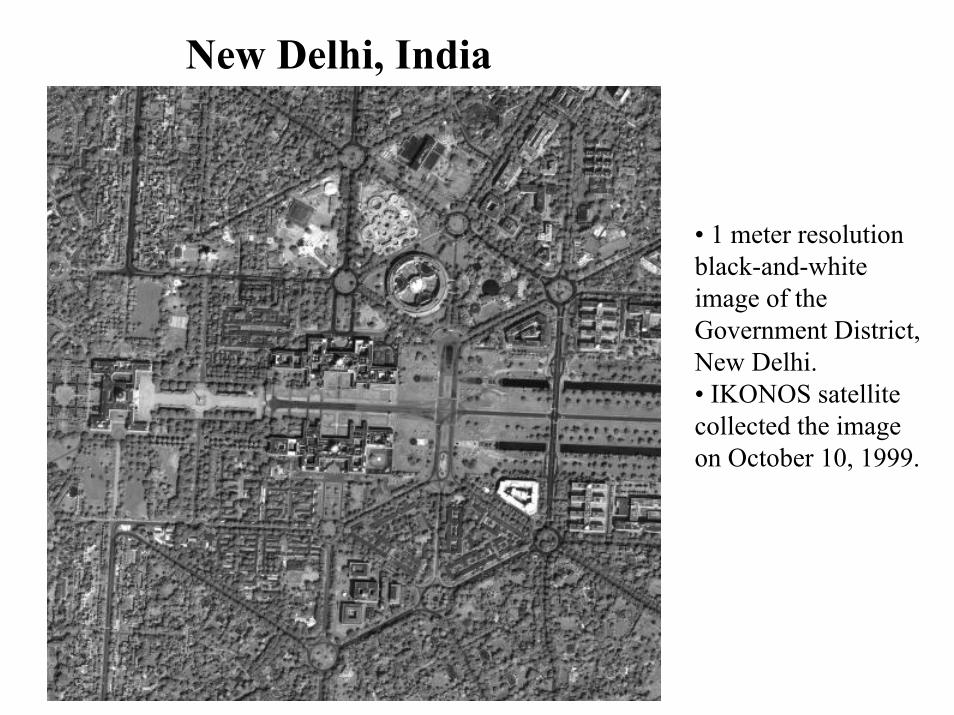
New Delhi, India
• 1 meter resolution black-and-white image of the Government District, New Delhi.• IKONOS satellite collected the image on October 10, 1999.

Land Use Change: Delhi 1974 - 1999 (25yrs.)Increase in population of 4.2 million; 60,000 hectares of agricultural land lost

Delhi’s Vehicle FleetGrowth of Population and Registered Motor Vehicles in Delhi
1970-1971 1980-1981 1990-1991 1995population (millions) 3.65 6.22 9.42# of vehicles 204,078 557,000 1,813,000 2,432,320
year 1996 1997 1998 1999 2001 2006 2011# of vehicles 2,734,400 2,904,359 3,033,000 3,210,000 3,924,000 6,000,000population (million) 13.42 14.37 17.16 19.51
• Delhi has 1% of all the country’s population but 10% of the total vehicles registered in India (largest vehicle population in the country).
• Population more than doubled while number of vehicles changed by 9 times from 1970 to 1990.
• Vehicle numbers include two wheelers.

Delhi’s Vehicle Fleet
• Average ownership of private vehicles: 178 vehicles/1000 people in 1995-1996. Total # of motor vehicles per 1000 people was 205 in 1993 (and 238 in 1998).
• Delhi has the highest road length in India: 1284km/100km2 area (26,379km of total length in 1998/99)
• Car ownership (1995): 52 vehicles/1000 people
•Delhi has one of the highest per capita road lengths and lowest number of vehicles per unit road length when compared with large cities around the world.
• Delhi’s roads, if good traffic management is applied, can accommodate 2-3 times the existing number of vehicles.
• Source: Indian Institute of Technology, May 1997

Congestion & Traffic Accidents in DelhiDelhi 1972 1981 1991 1997 1999 2001 2011road length (km) 8,380 14,320 21,670 25,949 26,379# of vehicles (millions) 0.214 2.848 3.21 3.924 6Speeds (km/hr) 23 19 18 15 10 5
• Road length increased by 3 times from 1972 to 1997 in Delhi while # of vehicles increased by 13 times!• TERI 1996: Delhi is the most congested city in India.• Average speeds during peak hour range from 10 to 15 km/hr in central areas and from 25-40 km/hr in arterial streets. Delhi’s traffic fatalities in 1993 were more than double those of all other major Indian cities combined.
•Delhi’s traffic fatalities in 1993 were more than double those of all other major Indian cities combined.
Current Road Accidents in Delhi:Average No. of Persons Killed / Day - 5 Average No. of persons injured - 13 Buses contribute to the majority of the accidents
Source: http://www.delhimetrorail.com

-
500,000
1,000,000
1,500,000
2,000,000
2,500,000
3,000,000
No. o
f Veh
icle
s Re
gist
ered
Apr
-71
Apr
-73
Apr
-75
Apr
-77
Apr
-79
Apr
-81
Apr
-83
Apr
-85
Apr
-87
Apr
-89
Apr
-91
Apr
-93
Apr
-95
Historical Vehicle Growth: Delhi
Goods Vehicles
Buses
Taxi
Autorickshaw
Scooter/M.Cycle
Car/Jeep/Stn.Wgn.
-
5,000,000
10,000,000
15,000,000
20,000,000
25,000,000
No. o
f Veh
icle
s
1985
1987
1989
1991
1993
1995
1997
1999
2001
2003
2005
2007
2009
2011
2013
2015
2017
2019
2021
2023
2025
Vehicle Growth: Delhi
Trucks
Buses
Taxis
Autos
2Str-2Wh
Car

-
50,000
100,000
150,000
200,000
250,000
Emis
sion
s (t
ons/
day)
1985
1987
1989
1991
1993
1995
1997
1999
2001
2003
2005
2007
2009
2011
2013
2015
2017
2019
2021
2023
2025
Total Emissions from Vehicles in Delhi from 1995 to 2025
Trucks
Buses
Taxis
Autos
2Str-2Wh
Car
Number of Vehicles and Emissions Trendin Delhi from 1995 to 2020
0
1
2
3
4
5
6
7
# vehiclesCONOxSO2HCPbTSPPM10CO2
Index: 1995=1

Air pollution kills in Delhi!Air Pollutant Emissions (1990s):Domestic - 8%Industrial - 12%Power Plants - 16%Motor Vehicles - 64% (67% in 1997)
Main sources of pollution are:vehicular emissionsuntreated industrial smokeuntreated water effluence
Percentage Share of Air Pollution by Various Sources in Delhi(%) 1970-1971 1980-1981 1990-1991 2000-2001
Industrial 56 40 29 20Vehicular 23 42 63 72Domestic 21 18 8 8
• With the Supreme Court directive of relocating polluting industries outside Delhi, share of vehicular pollution will go up significantly.• Vehicle emissions account for 65% of the air pollution in Delhi and cause a similar proportion of the 9,900 deaths due to air pollution each year.

WHO announces Delhi to be one of the top ten most polluted cities in the world!
• Particle levels in Delhi consistently remain 3 to 5 times the national standards and maximum levels have even reached 8 times the standards during the winter of 1998.• Particulate pollution kills 1 person per hour in Delhi• WHO: Delhi is the 4th most polluted city in the world in terms of SPM.• One out of two policemen suffers from respiratory diseases and one in every four have been diagnosed positive for initial symptoms of tuberculosis (Times of India, October 1998).• If air pollution is reduced to WHO annual average standards then 7500 premature deaths, 4 millions hospital admissions and sickness requiring medical treatment, and 242 millions of incidence of minor sicknesses (including RADs and RSDs) could be avoided in Delhi. (Source:Jian Xie,Jitendra J. Shah, Carter J. Brandon, “Fighting Urban Transport Air Pollution for Local and Global Good: The case of two-stroke engine three-wheelers in Delhi”, 1998.)

Transport Sector and Emissions in Beijing & Delhi
• Delhi has 2 to 3 times more vehicles than Beijing.
• Delhi vehicles have 2 to 3 times higher fuel efficiencies.
• Higher VKT/day for Beijing drivers.
• Higher total emission from transport in Beijing for all pollutants except TSP (about 20 times higher in Delhi).
• Cleaner vehicles in Delhi (emission factors for all vehicles lower than Beijing ones except for TSP which is about 20 times higher).
• Beijing air pollution: higher SO2 and NOx concentration but lower TSP concentration compared to Delhi.
• Much more transport infrastructure in Delhi (high road area - 23% -and extensive length of roads).
• Higher speeds on Delhi roads.

Emission Factors in 1996 in Beijing and Delhi (g/km)Delhi CO NOx SO2 HC TSP CO2cras/jeeps/s.wagons 12.20 1.90 0.053 3.60 0.19 3992wheelers 8.30 0.10 0.023 4.87 0.14 68autorickshaws 11.75 0.26 0.03 6.97 0.27 298taxis 20.48 1.95 0.053 4.17 0.19 399buses 12.51 20.71 1.45 2.05 2.93 1233trucks 8.50 14.07 0.98 1.39 1.99 838BeijingCars 64.57 1.79 0.187 6.64 0.011 399LDV 75.68 4.71 0.217 13.92 0.013 466HDGV 169.49 4.60 0.407 12.00 0.024 342.31HDDV 23.07 45.40 2.644 7.58 0.529 1249Buses 100.72 24.71 1.215 10.19 0.215 795.6taxis 72.27 2.00 0.180 7.24 0.011 410MC 17.13 0.09 0.050 5.91 0.003 186
• Emission factors of vehicles in Beijing are higher for all pollutants except for TSP which is about 20 times higher in Delhi.

Emission Factors in 2020 in Beijing and Delhi (g/km)
Delhi CO NOx SO2 HC TSP CO2cras/jeeps/s.wagons 4.61 0.68 0.05 0.82 0.04 3992wheelers 2.83 0.1 0.02 2.63 0.08 68autorickshaws 6.06 0.26 0.03 3.3 0.05 116taxis 4.38 0.66 0.05 0.79 0.04 399buses 6.68 11.46 0.56 0.91 1.31 1233trucks 4.44 7.63 0.36 0.6 0.86 838BeijingCars 23.98 0.59 0.17 3.25 0.01 254LDV 49.61 2.42 0.23 10.09 0.01 422HDGV 187.04 2.54 0.50 17.16 0.03 215HDDV 33.82 23.47 3.48 6.41 0.70 991Buses 111.13 29.94 1.56 13.72 0.28 603taxis 75.74 3.13 0.17 8.77 0.01 300MC 39.62 0.09 0.05 5.74 0.00 160
• Beijing’s emission factors in the future includes the detrimental effect of speed while Delhi’s emission factors have no speed effect in their projections.

Total Emissions from Transport in Beijing and Delhi (tons/year)
1995 CO NOx SO2 HC TSP CO2Beijing 1627111 120846 5759 235024 818 9922926Delhi 252154 100489 6849 80393 15486 8135730
2000Beijing 2892822 171906 11793 397028 1216 17523711Delhi 403094 171495 10771 134064 25012 15983254
2020Beijing 7149756 290540 41992 1132125 3278 60153968Delhi 826388 404906 22422 272274 46397 77589630
• Higher total emissions from motor vehicles of all pollutants inBeijing except TSP which is much higher (about 20 times) in Delhi.

Beijing Avg. VKT/day Fuel EfficiencyVehicle Type km/day km/lt 1995Cars 81 7.69LDV 75 6.67HDGV 63 3.57HDDV 48 3.33Buses 148 4taxis 212 8MC 27 28.57
Delhi Avg. VKT/day Fuel EfficiencyVehicle Type km/day km/lt 1995cras/jeeps/s.wagons 27 14.182wheelers 13.5 44.44autorickshaws 120 20.41taxis 85 9.43buses 186 3.7trucks 100 8
• Delhi vehicles has 2 to 3 times higher fuel efficiencies.
• Beijing vehicle owners drive more on average than Delhi drivers.

Fuel Consumption for Transport in Beijing & Delhi (million lt/yr)
gasoline diesel gasoline diesel gasoline dieselBeijing 2929 325 5660 423 25390 630Delhi 670 897 984 1171 4018 3102
1995 2000 2020
• More diesel use ( about 3 times in 1995 and 2000 and almost 5 times in 2020) and less gasoline use (around 1/5th) in Delhi.
• Although the percentage of diesel vehicles is similar in 1995 (6.5-7%), vehicle km traveled is very different in the two cities (19% in Beijing to 54% in Delhi). As a result, percentage of diesel fuel used for transport is 10% in Beijing while it is 57% in Delhi.
• Amount of diesel vehicles and diesel fuel use decreases by a lot in Beijing but much less in Delhi (2020: 1% of vehicles use diesel fuel in Beijing while 5% in Delhi and 2.4% of fuel use is diesel in Beijing while the same figure for Delhi is 44%).

Fuel Prices 1995 2000Delhi gasoline 0.58 0.55$/lt diesel 0.29 0.26Beijing gasoline 0.25 0.31$/lt diesel 0.23 0.29• Diesel slightly less expensive (subsidized) and gasoline about 2 times more expensive in Delhi.
Incomes (average hourly wage):$/hr 1995 2000 2020Beijing 0.49 0.62 1.65Delhi 0.37 0.47 1.25
• Averages wages about 32% higher in Beijing. GDP/capita of China is higher (more than 2 times) than India.

Beijing’s and Delhi’s Population, Vehicle Fleet, and Their Projections for 2020
Delhi, June 1997 # of Vehicles % Modal ShareCars/Jeeps/Station Wagons 720,921 25%MC/SC/MPD 1,906,232 66%Taxis 15,362 1%Autorickshaws 80,210 3%Trucks 142,290 5%Buses 39,344 1%
Beijing, 1997 # of Vehicles % Modal ShareCars 178,566 16%MC 289,231 26%Taxis 58,976 5%LDV 438,157 40%HDGV 77,053 7%HDDV 57,088 5%Buses 7,269 1%
1995 2000 2020# of vehicles 858,482 1,669,447 6,951,405population 11,705,000 12,511,209 13,860,955# of vehicles 2,432,320 3,597,021 17,755,356population 11,232,000 13,964,000 21,937,000
Delhi
Beijing
• 2 to 3 times more # of vehicles in Delhi.
• Similar population in 1995 and 2000 in Delhi and Beijing but higher growth for Delhi resulting in a much larger population in 2020 in Delhi (due to controlled population growth in Beijing).
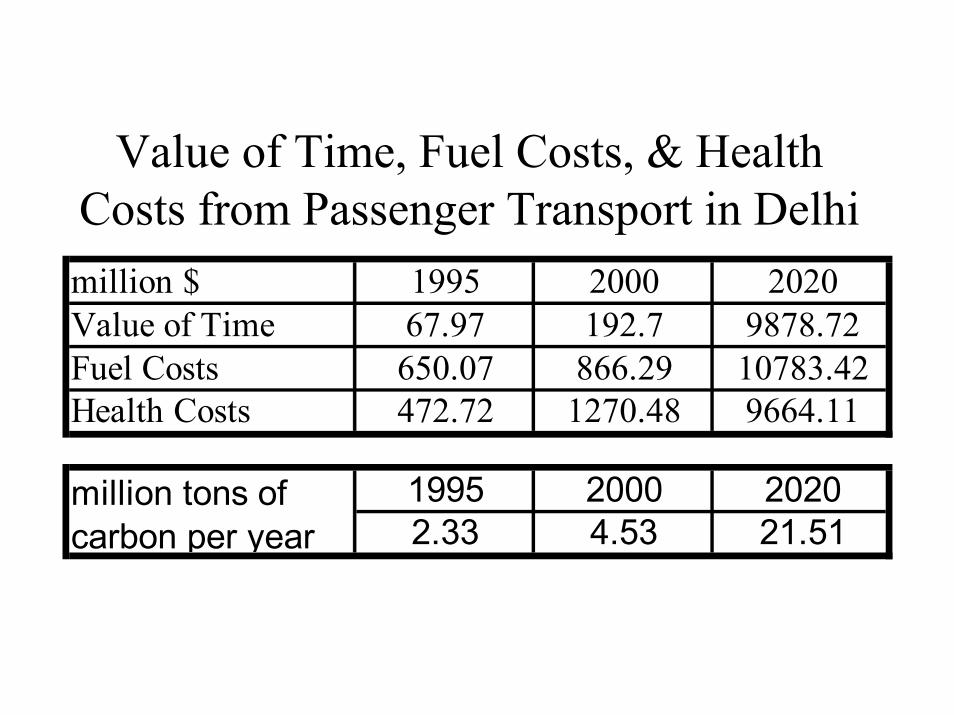
Value of Time, Fuel Costs, & Health Costs from Passenger Transport in Delhimillion $ 1995 2000 2020Value of Time 67.97 192.7 9878.72Fuel Costs 650.07 866.29 10783.42Health Costs 472.72 1270.48 9664.11
1995 2000 20202.33 4.53 21.51
million tons of carbon per year

Value of Time, Fuel Costs, & Health Costs from Passenger Transport in 2020
Under Different Scenarios for Delhimillion $ 2020 2020 with 2000's speed DifferenceValue of Time 9878.72 5174.57 4704.15Fuel Costs 10783.42 8094.67 2688.75Health Costs 9664.11 6175.15 3488.96Total 30326.25 19444.39 10881.86

Value of Time, Fuel Costs, & Health Costs from Passenger Transport in Beijing
million $ 1995 2000 2020Value of Time 182.33 743.63 19,514.94Fuel Costs 641.00 1,569.22 19,509.85Health Costs 975.18 1,898.65 15,117.62
1995 2000 20203.40 6.02 19.47
million tons of carbon per year

Value of Time, Fuel Costs, & Health Costs from Passenger Transport in 2020 Under Different Scenarios for Beijing
At 6 km/hr At 16km/hr With Tokyo's pass-trip mixmillion $ 2020 2020 2020Value of Time 19,514.94 9,348.51 8,631.77Fuel Cost 19,509.85 15,281.42 17,879.25Health Costs 15,117.62 11,794.00 8,635.45Total 54,142.41 36,423.93 35,146.47

• On average a car in India weighs 800kg!
• On average cars in Delhi emit the following amounts of gases in 1 year:
1999 CO NOx SO2 HCkg/car/year 160.2 16.26 0.4928 28.88% gas weight of car weight 20.03% 2.03% 0.06% 3.61%1999 Pb TSP PM10 CO2kg/car/year 0.1971 1.577 1.281 3932% gas weight of car weight 0.02% 0.20% 0.16% 491.52%

STRATEGY:
Move people not vehicles!
For a more efficient transportation system:
* use low energy use per passenger-km modes
* use low emissions per passenger-km modes
* use modes with low road space consumption per passenger
Public transportation (buses, subway, light rail) achieves best values of above parameters. Therefore, their development is essential for attaining a sustainable transportation system in the future.

1. Clean fuels, clean vehicle technologies (electronic fuel injection, catalytic converters), new vehicle emission standards
2. Infrastructure investments - build new roads to add more capacity
3. Traffic and demand management (manage existing street space to maximize available capacity and implement vehicle use controls)
4. I/M programs
5. Improve public transit
6. Land-use planning
Effect on:
- speeds
- emission factors
- fuel efficiencies
- traffic flow
- driver behavior
1. Reduction of emissions per vehicle kilometers traveled
2. Reduction of the total number of vehicle kilometers traveled
• New capacity attracts new demand and so traffic congestion will continue as long as incomes, population, and vehicle ownership continue to grow.
• So while managing road space, also implement vehicle use controls (rather than vehicle ownership controls) and develop public transit!

Pollution Control Options for The Transportation Sector• Technology options (such as new vehicle emission standards, fuelreformulation, alternative fuels) alone are not enough - standards will still be exceeded• Infrastructure investments (build roads and develop infrastructure to sustain the growth in transportation) - road area in Beijing is 6.1% and in Delhi is 23%, whereas in other developed cities goes up to 30%• Traffic management options to reduce congestion and increase speeds (a set of transportation system improvements such as arranging the traffic flow direction, and installation and better coordination of traffic signals)• Employer based controls such as giving transit passes, arranging telecommuting programs, providing ride-matching information and services, and modified work schedules• Enhanced I/M and accelerated vehicle retirement programs• Improve public transit as a good alternative for the commuters and also by options such as parking management and road fees discourage extensive use of cars• Environmental education and awareness programs• Land use management