transport tracker november 2017
TRANSCRIPT

Global Transport
Transport Tracker
November 2017
kpmg.com
Market trends and views

Create Note: Option 4a
Create Note: Option 1a

Create Note: Option 4bCreate Note:
Option 1b

3© 2017 KPMG International Cooperative (“KPMG International”). KPMG International provides no client services and is a Swiss entity with which the independent member firms of the KPMG network are affiliated. | Transport Tracker
We are delighted to present the eighth edition of the KPMG International Transport Tracker, aregular publication looking at the latest market indicators and trends in the global transport market.
Market fundamentals
AviationShipping andsea freight
Case studiesExpress logisticsDisruptive technologies
M&A in transport

© 2017 KPMG International Cooperative (“KPMG International”). KPMG International provides no client services and is a Swiss entity with which the independent member firms of the KPMG network are affiliated. |4 Transport Tracker
Contents
Page
Market fundamentals 5
Shipping and sea freight 7
Aviation 11
Disruptive technologies 15
Express logistics 19
M&A in transport 23
Case studies 27

© 2017 KPMG International Cooperative (“KPMG International”). KPMG International provides no client services and is a Swiss entity with which the independent member firms of the KPMG network are affiliated. |5 Transport Tracker
Market fundamentalsNew world order breeds uncertain future The global economy has shown signs of steady recovery, following significant uncertainty in 2016 with the election of Donald Trump in the U.S. and Brexit in the UK the standout unexpected events. Indeed, the global economy appeared victim to such events and, according to CBP statistics, World Trade fell by 1.1% in October 2016(f); this was significantly worse than the anticipated 0.5% expected fall and led many to mark 2016 as one of the slowest for growth in trade and output since 2008.
Trade appears to have recovered somewhat in 2017, growing by approximately 2.5% to October(f). The growth expectations for 2017, originally revised down by the World Trade Organisation, were re-set at 3.6% in September 2017. This followed a sharp acceleration in global trade in the first half of the year.
Disruption, however, is far from over and the risks of protectionism, geopolitical tension and natural disasters remain into 2018 forecasts. The World Trade Organisation has recommended a healthy dose of caution be taken when reviewing any increased optimism about world trade and has set the predicted world trade growth in 2018 at 3.2%(f).
The transportation of physical goods and passengers will undoubtedly remain the core business model of most transport companies. Indeed During President Trump’s recent visit to China, President Xi Jinping oversaw an order of over 300 aircraft from USA firm Boeing(g) into the heavily-competitive Chinese passenger aviation market.
There have also been other large aircraft orders of note, with over 430 European Airbus planes ordered recently by US low-cost carrier portfolio owner Indigo Partners(h). This highlights firms’ confidence in the growth of traditional core business of moving physical goods and passengers around the globe, seemingly buoying the rise in share prices across all Transport modes and an overall rise of 16% across Transport & Logistics.
On the flipside, new studies claim that in this age of digitization, flows of data and information now generate more economic value than the global trade of physical goods. This combats the theory that globalization is coming to a halt, it actually lives on but in the guise of soaring numbers of data exchanges across the globe. This opens up a wealth of opportunities and markets for agile, innovative digital market entrants but at the same time serves to threaten the business models of established industry leaders.
There will also be additional business opportunities around the data flows that these companies manage – but still do not fully exploit. Venture capital funds have already discovered the disruptive power of digital market entrants in this physically-focused industry(i).
Share prices(end of October 2017 YOY):
Transport and Logistics overall(a)16%
Transportinfrastructure(b)18%
Airlines(c)18%
Road and Rail(d)30%
Shipping(e)19%
Note: (a) Source: Bloomberg World Transportation Index(b) Source: MSCI World Transportation Infrastructure Index(c) Source: Bloomberg World Airlines Index(d) Source: MSCI World Road & Rail(e) Source: Bloomberg Shipping Index(f) https://www.wto.org/english/news_e/pres17_e/pr800_e.htm (g) http://www.airguideonline.com/china-orders-300-boeing-jets-to-meet-rising-demand/ (h) http://www.independent.co.uk/news/business/news/airbus-record-deal-indigo-partners-430-planes-a320-aviation-manufacturers-a8055636.html(i) http://www.slideshare.net/KPMG_Deutschland/startups-in-logistics-forwarding
Dr. Steffen WagnerGlobal Head of Transport & Leisure

6© 2017 KPMG International Cooperative (“KPMG International”). KPMG International provides no client services and is a Swiss entity with which the independent member firms of the KPMG network are affiliated. | Transport Tracker
Global Purchasing Manager Indices (PMI) World trade and industrial production index
Fuel and oil prices Share prices of transport subsectors
The Chinese economy (GDP) expanded by 6.8%(a) in the third quarter of 2017 and growth is projected at 6.3% for 2018, although this may seem a comfort to those fearful of a slowdown of China’s economy, there remain some concerns around the sustainability of this, as China looks to fulfil short term targets.
The Purchasing Manager Indices for Global, US, China and Eurozone, having all finished 2016 above the 50 percent growth mark, increased during 2017, indicating an improving economic health of the manufacturing sector around the globe. Whilst China’s increase was modest, the Eurozone and the US growth led to a one percentage point rise in the Global Purchasing Manager Index between October 2016 and October 2017.
The IMF has projected global growth at 3.7% in 2018, revised up by 0.1% from April 2017 due to notable pickups in investment, trade, and industrial production, coupled with strengthening business and consumer confidence supporting the recovery(b). Certain risks to economic growth remain however, which include geopolitical crises, terrorist threats and protectionist measures which are high on the agenda of most country leaders.
For further analysis on the effects of Brexit on the vote to leave, please visit our web page.
Oil prices remained relatively stable over the course of 2017, having recovered dramatically since the record lows at the start of 2016. This is possibly due to the execution of the OPEC agreement to reduce production by about 1.2 million barrels per day beginning in January 2017(c).As ever, there is no shortage of speculation over how oil will fare over 2018 but some change is expected as the OPEC cuts have been extended to at least March 2018.
Share prices for road, rail and transport infrastructure more generally have continued to fare somewhat better (even showing some growth over the year) than airline or shipping sector share prices. Airlines were particularly sensitive to the potential impacts of Brexit and its implications for airspace freedoms, but have recovered well over the course of the year. Shipping companies suffered at the hands of the global shipping crisis but have since started to recover as the gap between demand and capacity continues to narrow and freight rates start to rise.
Note: (a) https://www.ft.com/content/3533b1b0-ddfb-11e6-9d7c-be108f1c1dce(b) http://www.imf.org/external/pubs/ft/weo/2016/02/(c) ttp://uk.reuters.com/article/us-oil-prices-poll-idUKKBN13X146
50
52
54
56
58
60
62
Nov
-16
Dec
-16
Jan-
17
Feb-
17
Mar
-17
Apr
-17
May
-17
Jun-
17
Jul-1
7
Aug
-17
Sep
-17
Oct
-17
Global PMI US PMIEurozone PMI China PMI
60
70
80
90
100
110
120
130
140
Dec
-16
Jan-
17
Feb-
17
Mar
-17
Apr
-17
May
-17
Jun-
17
Jul-1
7
Aug
-17
Sep
-17
Oct
-17
Nov
-17
Dec
201
6 =
100
Bloomberg 380 Centistoke Bunker Fuel PriceBloomberg Jet Fuel FOB ARA Spot BargesBrent Crued Oil (ICE)Brent Crude Oil (ICE)
0%
1%
2%
3%
4%
5%
6%
Sep
-16
Oct
-16
Nov
-16
Dec
-16
Jan-
17
Feb-
17
Mar
-17
Apr
-17
May
-17
Jun-
17
Jul-1
7
Aug
-17
YoY
World trade Industrial Production
80
90
100
110
120
130
140D
ec-1
6
Jan-
17
Feb-
17
Mar
-17
Apr
-17
May
-17
Jun-
17
Jul-1
7
Aug
-17
Sep
-17
Oct
-17
Nov
-17
Dec
201
6 =
100
Bloomberg World Transportation IndexBloomberg World Airlines IndexBloomberg Shipping IndexMSCI World Transportation Infrastructure IndexMSCI World Road & Rail
Market fundamentals AviationShipping and
sea freight Case studiesExpress logisticsDisruptive technologies M&A in transport
Source: CPB Netherlands Bureau for Economic Policy Analysis
Source: Bloomberg, ICE (Intercontinental Exchange) Source: Bloomberg, KPMG Research
Note: Values above 50 indicate growthSource: Institute for Supply Management (ISM), Markit, JP Morgan, China
Federation of Logistics & Purchasing

© 2017 KPMG International Cooperative (“KPMG International”). KPMG International provides no client services and is a Swiss entity with which the independent member firms of the KPMG network are affiliated. |7 Transport Tracker
Shipping and sea freightNavigating rough seas in the Shipping industryDevelopment of markets
After a strong last quarter in 2016, global shipping seems to be recovering and has shown steady growth. Container Throughput Index has grown in line with the predictions of the World Trade Organization’s (WTO’s) latest World Trade Outlook Indicator (WTOI) and achieved yet another all-time high in the middle of this year. Strong performance expectations for container shipping support a sustained momentum for trade growth; this, however, could be undermined by policy shocks and some level of caution should be maintained.
Falling behind the 3 per cent average growth over the last four decades, world seaborne trade increased by 2.6 per cent in 2016. But as the industry continues to pick up pace, forecasts show a compound annual growth rate of 3.2 per cent between 2017 and 2022. The strong demand is however offset by steadily increasing shipping capacity, which reached 1.86 billion dead-weight tons this year. A similar steady decrease in order-books and the positive outlook should however gradually restrain overcapacity and improve utilization.
The shipping sector has to shed weight and become more efficient. While building fewer ships and scrapping more, Shared Economy seems to be the panacea to most; economies of scale coming from increased volumes of mergers & acquisitions or the creation of mega alliances.
Consolidation
One may be forgiven for thinking that the consolidation wave within the Shipping industry reached its peak in 2017. Especially with regard to the liner companies, where the impact of consolidation is huge; once a mid-sized shipping company, today a super-sized company.
It is, however, not only the liner companies that are affected; the first consolidations have now taken place in the charter business and there are also talks of such consolidations within pure ship management companies. It would, therefore, appear that the end of consolidation is not yet in sight.
The whole industry is under pressure; hardly a month goes by without news on mergers & acquisitions in the shipping industry and shipping companies are in the process of exploring their strategic alternatives. Insolvency and financing problems also continue to trigger change in the industry; there have always been joint ventures, partnerships and alliances between shipping companies but the current trends might lead to a dramatic change of course in this area.
What is really driving the trend toward consolidation?
Producers of consumer goods and oil companies are, in turn, putting pressure on their suppliers – including suppliers of transportation – to provide a higher level of service and to do so at a lower cost. This suggests that there might be some benefit in being larger in size, having the ability to serve the customer in more locations.
To remain competitive, a company must focus on improving asset utilization (generating more revenue from the same asset) as well as reducing costs and improving margins. Consolidation represents a way that a company can achieve both of these objectives.
Note: (1) https://www.wto.org/english/news_e/pres17_e/pr791_e.htm
(2) http://unctad.org/en/pages/newsdetails.aspx?OriginalVersionID=1587
(3) http://unctad.org/en/pages/newsdetails.aspx?OriginalVersionID=1587

8© 2017 KPMG International Cooperative (“KPMG International”). KPMG International provides no client services and is a Swiss entity with which the independent member firms of the KPMG network are affiliated. | Transport Tracker
Share prices of shipping subsectorsBaltic shipping indices
Container Throughput Index Orderbook in % of capacity
Total fleet capacity (DWT) Container freight and time charter rates
0%1%2%3%4%5%6%7%8%9%
114116118120122124126128130
Oct
-16
Nov
-16
Dec
-16
Jan-
17
Feb-
17
Mar
-17
Apr
-17
May
-17
Jun-
17
Jul-1
7
Aug
-17
Sep
-17
YoY
Inde
x se
ason
ally
adj
uste
d
Index seasonally adjustedYoY seasonally adjusted
95
97
99
101
103
105
107
Dec
-16
Jan-
17
Feb-
17
Mar
-17
Apr
-17
May
-17
Jun-
17
Jul-1
7
Aug
-17
Sep
-17
Oct
-17
Nov
-17
Dec
201
6 =
100
Dry Bulk CarrierContainershipsCrude Oil Tankers
8
10
12
14
16
18
20
Dec
-16
Jan-
17
Feb-
17
Mar
-17
Apr
-17
May
-17
Jun-
17
Jul-1
7
Aug
-17
Sep
-17
Oct
-17
Nov
-17
% o
f ex
istin
g D
WT
Dry Bulk Carrier Containerships
Crude Oil Tankers Oil Product Tanker
60708090
100110120130140D
ec-1
6
Jan-
17
Feb-
17
Mar
-17
Apr
-17
May
-17
Jun-
17
Jul-1
7
Aug
-17
Sep
-17
Oct
-17
Nov
-17
Dec
201
6 =
100
Container Time Charter Index (New ConTex)
Shanghai (Export) Containerized Freight Index (SCFI)
China (Export) Containerized Freight Index
55
75
95
115
135
155
175
195
Dec
-16
Jan-
17
Feb-
17
Mar
-17
Apr
-17
May
-17
Jun-
17
Jul-1
7
Aug
-17
Sep
-17
Oct
-17
Nov
-17
Dec
201
6 =
100
Baltic Dry IndexBaltic Dirty Tanker IndexBaltic Clean Tanker Index
8090
100110120130140150160170
Dec
-16
Jan-
17
Feb-
17
Mar
-17
Apr
-17
May
-17
Jun-
17
Jul-1
7
Aug
-17
Sep
-17
Oct
-17
Nov
-17
Dec
201
6 =
100
General ShippingDry Bulk ShippingContainer ShippingTankers
Market fundamentals AviationShipping and
sea freight Case studiesExpress logisticsDisruptive technologies M&A in transport
Note: Based on flash estimates of 73 ports, 2008 = 100Source: Institute of Shipping Economics and Logistics (ISL) Source: Global Insight
Source: Global InsightSource: Vereingung Hamburger Schiffsmakler und Schiffsagenten (VHSS), Shanghai Shipping
Exchange
Source: Bloomberg, KPMG ResearchSource: Baltic Exchange

© 2017 KPMG International Cooperative (“KPMG International”). KPMG International provides no client services and is a Swiss entity with which the independent member firms of the KPMG network are affiliated. |9 Transport Tracker
Shipping and sea freight (cont.)Further, the overcapacity in the market leads to increased and sustained levels of competition. The first response by liner companies to this was the creation of alliances.
Slot sharing is one way to improve service without adding capacity. Alliances offer the ability to provide increased service levels, again without adding capacity. Some alliances have even afforded shipping companies the ability to reduce capacity by selling ships, terminals or other infrastructure. Improving capacity utilization gives companies a lower unit cost in providing the service, as fixed costs (including capital costs) are spread over more revenue units.
It appears that those entities that were once in alliances have now moved a step further and have become consolidated into single companies.
Compliance and regulations
The increasing regulations in the economy puts yet more pressure on the shipping industry as the transportation business is based on complex and international business models. Anti-trust laws, anti-bribery conventions, data protection, trade sanctions and industry-specific regulations contain some of the intangible compliance regulations that impact the shipping industry. Anti-corruption regulations, in particular, are a big challenge for the industry, to which careful consideration should be afforded.
The global supply chain is subject to many different laws and regulations that govern when goods move from one country to another. Shipping companies are in the middle of the global supply chain and therefore have to meet all of the regulations simultaneously. This often leads to more administrative effort and a great degree of corporate responsibility.
It is worth noting that most companies set up entire business units to take care of regulations and compliance standards, headed by one single individual – the Compliance Officer. Compliance, however, cannot be delegated to one person within companies in the shipping industry; to be compliant is a duty of the whole company from top to bottom. Being compliant means being transparent – not only for customers but also for business partners.
Transparency, however, is not something that traditionally characterizes the shipping industry as, besides from the big liner companies, most of the shipping companies are family-owned. With competition leading the markets, transparency is hardly high on the list of a prudent board’s priorities. This may make good business sense as compliance with increasing regulation becomes more and more difficult and forces companies to react.
Nonetheless compliance remains and will continue to be one of the major issues for shipping companies, as any violations could lead to massive reputational damage, which could realistically threaten the whole business model. Consequently, an increasing number of companies are implementing compliance management systems.
Digitalization in respect to compliance and regulation could be both a curse and a blessing concurrently. On the one hand, digitalization of business processes gives the chance to implement electronic and automatic controls. On the other hand, the basis for compliance management systems are awareness, responsibility, documentation and monitoring. This disparity between progress and regulation is something for shipping companies to consider and guidelines for how to treat different compliance regulations should be carefully considered and implemented; it is indeed a “must have”.
Hartmut HeckertGlobal Head of Shipping

10© 2017 KPMG International Cooperative (“KPMG International”). KPMG International provides no client services and is a Swiss entity with which the independent member firms of the KPMG network are affiliated. | Transport Tracker
The shipping sector has to shed weight and become more efficient
Hartmut HeckertGlobal Head of Shipping
“”
Market fundamentals AviationShipping and
sea freight Case studiesExpress logisticsDisruptive technologies M&A in transport
Alliances market share
33%
11%31%
25%
2M + HKK THE ALLIANCE
OCEAN ALLIANCE Others
© 2017 KPMG International Cooperative (“KPMG International”). KPMG International provides no client services and is a Swiss entity with which the independent member firms of the KPMG network are affiliated. |11 Transport Tracker
Aviation
Going for growth: will disruption stymie traffic growth for global aviation?According to IATA’s recent publication, global passenger traffic demand has increased over the last year with YoY revenue passenger kilometer (“RPK”) growth in July of 6.8%(a) and H1 growth in passenger volumes being the fastest seen in the first half of a year since 2005(b). Demand has been bolstered by increased connectivity and city-pair connections, with economic conditions proving conducive to traffic that is still moving ahead of capacity growth, reflected in higher load factors and improved share performance with BI Global indices up since Q3’16.
While RPKs may be growing, so too are unit costs which are applying pressure on breakeven points for carriers. Oil prices now over 60 USD/bbl at the beginning of November 2017, as compared to the sub 40 USD/bbl levels seen in January 2016. Although such prices remain substantially lower than the 5-10 year average, airlines may consider further efforts to enhance fleet fuel efficiency e.g. through accelerated aircraft upgrades and leaner turnaround procedures.
Efficiencies would be further enhanced by streamlining of airport operations as airport infrastructure remains prominent on both public and private infrastructure investment agendas. Whilst we see continued announcements and some new facilities opening, such as Changi’s T4 on 31 October 2017, the continued development of facilities is a requisite to sustained growth, with many airports currently facing capacity constraints, which will only come under further strain as traffic increases(c). This is particularly true in ASPAC and at some key locations such as Heathrow.
The growing frequency of disruptive events has confronted the industry with a more uncertain operating environment; the sudden imposition of bans on travel to the US and cabin bans on large personal electronic devices (“PEDs”) both being good examples. With significant regulatory change on the horizon in the wake of Brexit, concerns over third country carrier operations in the EU and other future change catalysts, what does this all mean for the industry?
Ripples in the industry expected from regulatory change in Europe
The European market is currently facing a period of substantial change and regulatory flux with the ongoing negotiation of the UK’s withdrawal from the EU, the potential introduction of regulatory changes in relation to Third Country Carriers (“TCCs”); and an increasingly competitive market for European airlines which has left a number of carriers to be sold under distress or abruptly shut down.
Aviation and post-Brexit Britain
The estimated impact on UK passenger traffic remains challenging to predict. Any decrease should also be considered in the context of traffic for other European hubs and routing of passengers through large international airports elsewhere outside the continent.
The UK is expected to have to negotiate an agreement with the ECAA to renew their access post-Brexit(d) as well as negotiating and replacing third country agreements which could be an arduous task. Airlines need to plan for the scenario where the UK would no longer be covered under the EU-US open skies agreement post final settlement of the separation.
While renegotiations of each of the aforementioned may provide the UK with an opportunity to establish more favourable terms, this would be dependent on the perceived strength of the UK’s negotiating position as compared to their larger combined political capital under the aegis of the EU. This question is particularly pertinent given the recent reluctance of the United States, prior to the announcement of the Airbus transaction, to acquiesce to the UK’s request for the reinstatement of the Bombardier contract, the abrupt termination of which would have a significant impact on the company’s workforce in Northern Ireland and threaten as many as 400 jobs.
Potential regulatory changes in relation to the EU and Third Country Carriers
The highly competitive airlines in the Middle East and Asia continue to challenge European carriers and airports for passenger traffic. This has been as a result of certain advantages which such carriers have, for example the growth of emerging markets and affiliated traffic and the operation of hub-and-spoke business models with bases situated in strategic global crossroads. These factors have been supported by sizeable investment in infrastructure and top-of-the-range aircraft fleets.

12© 2017 KPMG International Cooperative (“KPMG International”). KPMG International provides no client services and is a Swiss entity with which the independent member firms of the KPMG network are affiliated. | Transport Tracker
OPEC Basket Price (US$) Passenger traffic growth (RPK) (Moving two months average)
0
2
4
6
8
10
12
14
Oct
-16
Nov
-16
Dec
-16
Jan-
17
Feb-
17
Mar
-17
Apr
-17
May
-17
Jun-
17
Jul-1
7
Aug
-17
Sep
-17
YoY
in %
Global EuropeNorth America ASPACMiddle East LATAMAfrica
0
2
4
6
8
10
12
14
Oct
-16
Nov
-16
Dec
-16
Jan-
17
Feb-
17
Mar
-17
Apr
-17
May
-17
Jun-
17
Jul-1
7
Aug
-17
Sep
-17
YoY
in %
Global EuropeNorth America ASPACMiddle East LatamAfrica
60
65
70
75
80
85
90O
ct-1
6
Nov
-16
Dec
-16
Jan-
17
Feb-
17
Mar
-17
Apr
-17
May
-17
Jun-
17
Jul-1
7
Aug
-17
Sep
-17
%
Global EuropeNorth America ASPACMiddle East Latam
1.00 1.50 2.00 2.50 3.00 3.50 4.00 4.50 5.00 5.50 6.00
2.00
3.00
4.00
5.00
6.00
7.00
8.00
2008
2009
2010
2011
2012
2013
2014
2015
CASK excl FASK FSCCASK excl FASK LCCCASK-FASK Difference
1.00
2.00
3.00
4.00
5.00
6.00
7.00
8.00
9.00
2.00 3.00 4.00 5.00 6.00 7.00 8.00 9.00
10.00 11.00
2008
2009
2010
2011
2012
2013
2014
2015
CASK FSCCASK LCCCASK difference
Market fundamentals AviationShipping and
sea freight Case studiesExpress logisticsDisruptive technologies M&A in transport
Passenger capacity growth (ASK) (moving two months average)
Passenger load factor (moving two months average)
CASK excl. FASK CASK-FASK
Note: Two months rolling average Source: International Air Transport Association (IATA)
Source: OPEC
Note: Financial assessment is based on a subset of global airlines and does not represent individual performance
Source: KPMG Analysis, The Airline Analyst, OPEC, IATA
Note: Financial assessment is based on a subset of global airlines and does not represent individual performance
Source: KPMG Analysis, The Airline Analyst, OPEC, IATA
Note: Two months rolling averageSource: International Air Transport Association (IATA)
Note: Two months rolling averageSource: International Air Transport Association (IATA)
0
20
40
60
80
100
120
140
Apr
-201
0
Oct
-201
0A
pr-2
011
Oct
-201
1
Apr
-201
2
Oct
-201
2A
pr-2
013
Oct
-201
3A
pr-2
014
Oct
-201
4A
pr-2
015
Oct
-201
5
Apr
-201
6
Oct
-201
6A
pr-2
017
Oct
-201
7
Source: OPEC
LATAMLATAM

© 2017 KPMG International Cooperative (“KPMG International”). KPMG International provides no client services and is a Swiss entity with which the independent member firms of the KPMG network are affiliated. |13 Transport Tracker
Aviation (cont.)Several airlines operating out of the EU have expressed concerns that market share gains made by certain TCCs may be as a result of unfair practices by third country governments, carriers, or airports. The EU Commission, Council and Parliament all concluded that there is a need to develop more effective instruments to safeguard fair competition, noting that the current framework for resolution of the issue seems somewhat insufficient. As a result the EU commission is evaluating the current legal framework and potentially developing an instrument through which to better approach the issue.
Ultimately any foreseeable changes to EU regulation in relation to TCCs may be expected to take considerable time to implement as terms would need to be agreed upon, ratified and incorporated into existing frameworks. Given that such changes could have a significant impact on market participants ranging from strategy and investment through to financing and reporting requirements, we will be following this developing situation very closely.
Shifting aviation landscape with other catalysts for change developing on the horizon
Competition from Low Cost Carriers
Pressures felt by European flag carriers have been amplified by competition from low cost carriers which have become increasingly popular, accounting for 48% of EU market seat capacity in 2015(e). Competition is already intense with Monarch Airlines having filed for administration in October 2017 following in the footsteps of Alitalia and Air Berlin earlier in the year. The recent discussions between the latter and Lufthansa in relation to the acquisition of certain aircraft and Niki (a subsidiary of Air Berlin) may point to growing consolidation and partnerships on the continent as competition intensifies.
While joint ventures have been used by some carriers as a means by which to enhance optionality and competitive service offering, some LCCs are now seeking out their own JV partners such as Ryanair’s recent flight partnership with Air Europa. Following the adjusted post-Brexit strategies of leading UK-based LCCs, the carriers may look to further increase their presence on the continent. Indeed easyJet already have around 100 aircraft on the mainland and a base in Switzerland and they have also recently secured an Austrian Air Operator Certificate and license for establishment of easyJet Europe.
Green initiatives
Airlines have already begun to take steps to embrace green initiatives, such as Singapore Airlines’ operation of a number of ‘green package’ flights on their San Francisco-Singapore route and easyJet’s planned support for electric planes on short-haul routes. Such initiatives are expected to grow in prevalence as CSR becomes a growing focus for carriers, supported by collaboration and regulation through the ICAO Carbon Offset and Reduction Scheme for International Aviation (“CORSIA”).
Consumer preference and technology
The pace of technology growth provides the industry with opportunities to harness smart-tech and further enhance their service offerings and operations. This should in turn afford global travelers the opportunity to travel with greater convenience and cost efficiency. The growing prevalence of mobile apps have made travel booking and price comparison easier for travelers with 40% of digital travel sales in the US expected to be generated through mobile devices in 2017(f).
While the increasing digitization of travel is good news for both suppliers and consumers alike, it also emboldens consumer preference and brand sensitivity. The advent of social media has brought real time visibility to developing narratives and re-emphasized the importance of brand vigilance and media management for companies, with United Airlines’ forcible removal of a passenger in early 2017 being a good example.
Note: (a) ‘Air Passenger Market Analysis’, IATA (July 2017), http://www.iata.org/whatwedo/Documents/economics/passenger-analysis-jul-2017.pdf
(b) ‘Airlines Financial Monitor’, IATA (June 2017 – July 2017), http://www.iata.org/whatwedo/Documents/economics/Airlines-Financial-Monitor-Jul-17.pdf
(c) IATA Annual Review 2017 [SF]
(d) Aviation and the European Common Aviation Area (ECAA), Institute for Government, 14 August 2017, www.instituteforgovernment.org.uk
(e) European Commission, Commission Staff Working Document ‘proposal for a Regulation of the European Parliament and of the Council on safeguarding competition in air transport, repealing Regulation (EC) No. 868/2004, Brussels 8.6.2017 SWD(2017) 182 final
(f) https://www.emarketer.com/Article/Mobile-Drives-Growth-of-Online-Travel-Bookings/1016053
Malcolm RamsayGlobal Head of Aviation

14© 2017 KPMG International Cooperative (“KPMG International”). KPMG International provides no client services and is a Swiss entity with which the independent member firms of the KPMG network are affiliated. | Transport Tracker
Share prices by region
Air freight price index
While the increasing digitization of travel is good news for both suppliers and consumers alike, it also emboldens consumer preference and brand sensitivity
Malcolm RamsayGlobal Head of Aviation
“”
-4-202468101214
70
75
80
85
90
95
100
105
Oct
-16
Nov
-16
Dec
-16
Jan-
17
Feb-
17
Mar
-17
Apr
-17
May
-17
Jun-
17
Jul-1
7
Aug
-17
Sep
-17
YoY
(%)
Pric
e In
dex
Drewry Air Freight Price Index
Drewry Air Freight YoY (%)
6080
100120140160180200220240260
Dec
-16
Jan-
17
Feb-
17
Mar
-17
Apr
-17
May
-17
Jun-
17
Jul-1
7
Aug
-17
Sep
-17
Oct
-17
Nov
-17
Dec
201
6 =
100
Bloomberg World Airlines IndexBloomberg EMEA Airlines IndexBloomberg United States Airlines IndexBloomberg Asia Pacific Airlines IndexBI Latin America Airlines Competitive Peers
Share prices by business model
Freight traffic growth (FTK) (moving two months average)
-10-505
101520253035
Oct
-16
Nov
-16
Dec
-16
Jan-
17
Feb-
17
Mar
-17
Apr
-17
May
-17
Jun-
17
Jul-1
7
Aug
-17
Sep
-17
YoY
in %
Global EuropeNorth America ASPACMiddle East LatamAfrica
90
100
110
120
130
140
150
Dec
-16
Jan-
17
Feb-
17
Mar
-17
Apr
-17
May
-17
Jun-
17
Jul-1
7
Aug
-17
Sep
-17
Oct
-17
Nov
-17
Dec
201
6 =
100
BI Global Airlines Full-Service Valuation Peers
BI Global Airlines Low-Cost Carriers Valuation Peers
Market fundamentals AviationShipping and
sea freight Case studiesExpress logisticsDisruptive technologies M&A in transport
Source: Drewry
Source: Bloomberg, KPMG Research
Note: Two months rolling averageSource: International Air Transport Association (IATA)
Source: Bloomberg, KPMG Research
LATAM

© 2017 KPMG International Cooperative (“KPMG International”). KPMG International provides no client services and is a Swiss entity with which the independent member firms of the KPMG network are affiliated. |15 Transport Tracker
Disruptive technologiesThe power of disruption case study: HyperloopHistory & concept
In 2013, Elon Musk presented a white paper to the world(a). In this document, the billionaire tech visionary who had already made his fortune with Paypal and had advanced electric automobile production and commercial space flight with Tesla and SpaceX, respectively, proposed a new form of transportation – the Hyperloop.
There has now been enough publicity around the technology that most people are familiar with its high-level concept. In short, the Hyperloop technology consists of a vacuum tube that contains a very low pressure environment. Its purpose is to remove most of the drag that an ordinary vehicle encounters while in motion. Inside the tube a single pod, about the size of a standard sized shipping container, travels on a guideway powered by an electro-magnetic motor which allows it to reach very high speeds in the range of 600mph.
In truth this idea was not actually new – various people have theorized about its potential over the course of the last century. Perhaps because of Musk’s preeminent status as a visionary, however, the white paper galvanized the tech world and reignited enthusiasm for the possibility of a fifth form of transportation – superfast, clean and efficient and with the power to fundamentally change the way we work, live, and travel. Musk didn’t plan to develop the technology himself given his involvement with numerous other projects. Instead, he threw down the gauntlet to anyone who could make it happen through an open source concept.
Present day
Fast forward to 2017 and the Hyperloop concept has gathered remarkable momentum in four years. There are now numerous start-ups and universities in the mix as well as a healthy amount of investment dollars working to bring it to reality. Many of the main players are based in Los Angeles, California, a city that is itself experiencing reinvention into a tech hub and new media centre. The likes of Hyperloop One, Hyperloop Transportation Technologies, SpaceX, and Arrivo are all located within LA and are all engaged in a race to bring the technology to market.
The current leader is likely Hyperloop One(b); it has an impressive and continuously expanding campus in the Los Angeles Arts District(c) that employs a wealth of top engineering and business talent. It’s also got a handful of financial backers(d) with deep pockets in the form of DP World (Dubai), SNCF (France) and GE Ventures (USA)(e),
amongst others. Hyperloop Transportation Technologies, meanwhile, has taken a crowdfunding approach(f) to investment where developers trade their time and knowledge for equity. All of these organizations have ambitious plans and have been successful in cementing agreements with countries and regions all over the world.
In September 2017 Hyperloop One raised a further $85M in funding. This included an investment from Richard Branson which came with an agreement to rebrand the company as Virgin Hyperloop One.
One likely reason for the groundswell of interest in the technology is the realization by everyone from Google to city planners that very soon our interaction with transportation will change as a result of Autonomous Vehicles (AV), technology enabled infrastructure, and the wider Internet of Things (IoT). Many companies, both new and established, are making rapid advancements toward AV production. We can now say without fear of hyperbole that we are on the precipice of their widespread use. These advanced transit concepts have many people thinking about how the way we live and work will be fundamentally altered by transformative technologies. The Hyperloop concept clearly fits into this paradigm shift and so it appears that the timing for its development might be right.
Note: (a) http://www.businessinsider.com/elon-musk-hyperloop-plan-2013-8
(b) https://www.theguardian.com/technology/2017/oct/12/richard-branson-virgin-group-invests-hyperloop-one
(c) http://www.latimes.com/business/la-fi-hyperloop-20150325-story.html
(d) https://futurism.com/hyperloop-one-now-has-245-million-make-transportation-system-reality/
(e) https://www.ge.com/reports/data-vision-x-ray-app-help-hospitals-cut-costs/
(f) https://techcrunch.com/2016/12/01/hyperloop-transportation-technologies-claims-more-than-100-million-in-total-investment/

16© 2017 KPMG International Cooperative (“KPMG International”). KPMG International provides no client services and is a Swiss entity with which the independent member firms of the KPMG network are affiliated. | Transport Tracker
Market fundamentals AviationShipping and
sea freight Case studiesExpress logisticsDisruptive technologies M&A in transport

© 2017 KPMG International Cooperative (“KPMG International”). KPMG International provides no client services and is a Swiss entity with which the independent member firms of the KPMG network are affiliated. |17 Transport Tracker
Disruptive technologies (cont.)Challenges
But what of the challenges to this transformative concept? Potential challenges include that the technology will simply never work or its capital and operating costs will outweigh any financial or economic benefit.
There has also been concern about basic ride comfort – hurtling through a tube faster than the speed of sound is not a natural state for most humans. The G-forces encountered on even relatively shallow bends at such speeds could be enough to cause most travellers to lose their lunch.
There are also significant safety hurdles which will need addressing – a 2016 Report for NASA by the Volpe National Transportation Systems Centre(g) cited emergency deceleration, emergency access and egress, on-board passenger emergency and evacuation, stranded capsule, system malfunction or power outage as significant safety hurdles to overcome. And that’s not to mention the regulatory framework that will need to be developed prior to its first deployment.
Cost is also a contentious area. For many proponents of the technology, Elon Musk’s declaration that a LA-SF link could be built for approximately $6Bn(h) (a fraction of the comparable high-speed rail cost) did the nascent industry few favours. He set an extremely low benchmark to which any future projects, especially in that corridor, would be measured. Only time will prove whether those early estimates can be achieved.
From a funding perspective, initial projects are likely to require public sector support. The U.S. government has some recent history of investing in new transportation infrastructure technologies (e.g. Maglev)(i) but in recent times has appeared more reluctant to provide funds for speculative technologies. The argument of opportunity cost for improving existing infrastructure modes will likely remain strong, especially in developed countries. It is likely that early projects will be located in places like the Middle East(j) where regulation is less onerous, policy more malleable and funding more available.
Possibilities
The proponents of Hyperloop are very confident that the technology will be a success. Hyperloop One has already made strides forward in its proof of concept at its Nevada testing facility(j). KPMG in the U.S. has worked with the company since its early stages –building out its analytical tools, analyzing potential projects around the world for both freight and passenger applications, providing sector and regional insight, and establishing options for project level commercial and financial structuring. The joint working continues with Hyperloop One having recently published a short list of global priority projects.
So should it indeed become a part of our collective transportation future, what exactly will Hyperloop allow us to do?
It will allow us to fundamentally reimagine travel and with it the way we live and work, the way the economy operates, and the way we interact with other people for both business and pleasure. We’ll be able to travel from Los Angeles to San Francisco, have dinner and return home in the same evening. We’ll be able to take a lunch time business meeting in Rome and be back in Paris to pick the kids up from school in the afternoon. Containers will be evacuated from high value coastal areas to interior hubs for efficient processing. The ships that carry them may never even come into port. Maybe we’ll clear up congested road networks and remove bulk freight from our cities altogether. We’ll live far away from where we work but the commute will be quick, easy and stress free. At least that’s the promise.
The Hyperloop is an intriguing concept. We will have to see whether it fulfils all the promises that are being made. Nevertheless, this is one example of the sea change that is coming in the transportation field over the next decade. We must get ready for these changes because they are coming whether we like it our not.
Note: (g) https://ntl.bts.gov/lib/59000/59300/59393/DOT-VNTSC-NASA-16-01.pdf
(h) http://www.businessinsider.com/elon-musk-hyperloop-plan-2013-8
(i) https://www.fra.dot.gov/eLib/Details/L17207
(j) https://hyperloop-one.com/hyperloop-one-reveals-first-images-nevada-desert-development-site-devloop-middle-east-rail
(k) https://hyperloop-one.com/hyperloop-one-reveals-first-images-nevada-desert-development-site-devloop-middle-east-rail
Some or all of the services described herein may not be permissible for KPMG Audit clients and their affiliates
Christopher LivingstoneDirector, KPMG in the U.S.

18© 2017 KPMG International Cooperative (“KPMG International”). KPMG International provides no client services and is a Swiss entity with which the independent member firms of the KPMG network are affiliated. | Transport Tracker
[Hyperloop] has the potential to ignite economies and bring us closer together
Christopher LivingstoneDirector
“”
Market fundamentals AviationShipping and
sea freight Case studiesExpress logisticsDisruptive technologies M&A in transport

© 2017 KPMG International Cooperative (“KPMG International”). KPMG International provides no client services and is a Swiss entity with which the independent member firms of the KPMG network are affiliated. |19 Transport Tracker
Express logisticsDelivering everything for the customer
Customers demand convenience in the delivery process
In the past the postman delivered parcels (mainly during the morning) at the home address of a mail-order consignee. If he/she wasn’t at home the postman either left a note to pick up the item at the local post office or came back the following day for a second delivery attempt.
This behaviour can still be found in the delivery industry, though it is clearly no longer the state-of-the-art in parcel delivery. In old times of printed catalogues and ordering by mail or telephone, the mail order company provided a standard lead time. This has changed dramatically over the last 15 years. The term mail-order business has not only changed into terms such as e-commerce and online retail, but the entire process has changed from push to pull. The power shifting to the consumer mandates the retailer to react on the customer’s demand and not vice versa.
If a retailer is not able to fulfil the increasing customer requirements of receiving their parcel when they want it, the business model is likely unsustainable and may come to an abrupt and severe end.
These changes in demand are not simply related only to speed (same day), but furthermore in reliability; i.e. to match delivery time windows as well as the offering around where to collect or to pick-up the item to the customer’s need. Understandably, from the retailers’ perspective speed is likely still of paramount importance as consumers may change towards other buying opportunities due to non-availability of an e-commerce item. This time sensitivity leads to new delivery options and business process models. Consumers, however, prefer a low-cost delivery model with an effortless return process. This growing demand in services goes in parallel with an increase in volatility of volumes.
Customer centricity is key! A report titled Demand-driven supply chain 2.0, produced by KPMG International and released in 2016, documented that companies are starting to acknowledge that the supply chain has one over-riding priority: keeping customers happy, creating a better customer experience. There is increasing evidence of the link between customer experience and profitability – those companies that are adopting demand-driven supply chains enjoy increased sales, reduced operating expenses and improved working capital; this is done by focusing on the customer experience.
The advent of mobile devices, data and social networks in the last 10 years empowered the customers with greater choice (domestic and global), faster reviews and lower switching costs. On the other hand, retailers and logistics service providers gained more visibility along the delivery process and an easier aggregation of different services. This has led to more competition of service offerings and generally lower prices for customers. Finally these developments have also facilitated greater convenience and seamless customer experience in buying, paying, receiving and returning.
Disruption to the status quo
The planned vertical integration of Amazon and Alibaba in certain markets leads to an increasing competition between postal administration entities, CEP and logistics providers. Network providers have high fixed costs due to infrastructure, fleet and necessary staff, often backed by unions. These fixed costs lead to a certain non-flexibility in case of a changing business environment or reacting to volatile parcel volumes during Christmas or other parcel sensitive holidays (e.g. Black Friday).

20© 2017 KPMG International Cooperative (“KPMG International”). KPMG International provides no client services and is a Swiss entity with which the independent member firms of the KPMG network are affiliated. | Transport Tracker
Logistics Confidence Index
Consumer confidence indices Express logistics share prices
-15-13-11-9-7-5-3-11
9095
100105110115120125130135
Oct
-16
Nov
-16
Dec
-16
Jan-
17
Feb-
17
Mar
-17
Apr
-17
May
-17
Jun-
17
Jul-1
7
Aug
-17
Sep
-17
Balance/diffusion index
China Brazil
USA EU 27 (rhs)
7580859095
100105110115120125130
Nov
-16
Dec
-16
Jan-
17
Feb-
17
Mar
-17
Apr
-17
May
-17
Jun-
17
Jul-1
7
Aug
-17
Sep
-17
Nov
201
6 =
100
Global Europe
North America ASPAC
40
45
50
55
60
Sep
-16
Oct
-16
Nov
-16
Dec
-16
Jan-
17
Feb-
17
Mar
-17
Apr
-17
May
-17
Jun-
17
Jul-1
7
Aug
-17
Uni
ts
Situation Expectations
Confidence
Market fundamentals AviationShipping and
sea freight Case studiesExpress logisticsDisruptive technologies M&A in transport
Note: Above 50 indicates higher volumes, below 50 indicates lower volumes"Source: Stifel, Transport Intelligence
Source: National Bureau of Statistics of China, CNI (Confederacao Nacional dasIndustrias, Conference Board, European Commission) Source: Bloomberg, KPMG Research

© 2017 KPMG International Cooperative (“KPMG International”). KPMG International provides no client services and is a Swiss entity with which the independent member firms of the KPMG network are affiliated. |21 Transport Tracker
Express logistics (cont.)Currently, the topic of Crowd Logistics (CL) is of crucial importance. Uber, for instance, is a successful logistics provider who is following the Crowd Logistics business model. In this business model the service is mostly yielded by the crowd (and not by the staff of the company). The persons within the crowd either demand or provide a service. Thereby, the company itself solely acts as a mediator.
The mediator is responsible for the coordination and therefore mostly provides an IT platform capable to track communication, manage master data and fulfil payment transactions. This new business model is based on the idea of sharing economy by crowdsourcing and crowdfunding and benefits from short innovation-to-market time and new methods of customer communication. The fact that Amazon decided in June 2015 to use their customers (the crowd) for the last-mile-delivery shows that the topic of Crowd Logistics is of great interest for practice and science alike.
CL now expands towards last mile options and delivery models. Examples such as ParcelBright and Veeqo in the UK or DoorDash in the US created an urban delivery model while, for example, MakeSpace developed crowd-sourcing storage space enabling flexi-delivery options. These operationally-flexible models generate cost advantages for new entrants. The scalability & sustainability, however, remains to be further evaluated. These innovative models also offer local offline retailers cheap and easy access to add delivery services in a certain radius around their physical shops.
In addition these new asset-light and low fixed-cost business models create challenges and opportunities for legacy companies such as postal service providers and CEP carriers. These opportunities could be a cooperation, consolidation of services or collaboration in certain regions or products (FMCG, food, etc.). 80% of retailers see a positive and measurable impact on customer satisfaction by offering multiple delivery options to shoppers.
B2C and e-commerce shipping remain the growth engines in domestic markets and are becoming so in the international markets. B2C has grown faster than B2B in most of the markets and the outgrowing of low-margin B2C volumes with a better delivery performance leads to a certain cannibalization of existing B2B services. B2C will even surpass B2B in terms of parcel volumes in Asia and in North America, not only in standard shipping, but also in express. B2C will continue to grow revenue at an estimated 6% per year in North America, 5% per year in Western Europe and nearly 14% per year in Asia-Pacific.
Internationally, whilst B2C still plays a relatively minor role with roughly 10% of shipments going to private households, B2C volumes are increasing by 12% annually due to a broad increase of international ecommerce.
Document shipping is stagnating and even declining, both domestically and internationally. Not surprisingly, much of the document shipping has been replaced by email or local letter services – a global trend not likely to subside.
Justin ZatouroffGlobal Head of Post and Express Logistics

22© 2017 KPMG International Cooperative (“KPMG International”). KPMG International provides no client services and is a Swiss entity with which the independent member firms of the KPMG network are affiliated. | Transport Tracker
Customer centricity is key!
Justin ZatouroffGlobal Head of Post& Express Logistics
“”
Market fundamentals AviationShipping and
sea freight Case studiesExpress logisticsDisruptive technologies M&A in transport

© 2017 KPMG International Cooperative (“KPMG International”). KPMG International provides no client services and is a Swiss entity with which the independent member firms of the KPMG network are affiliated. |23 Transport Tracker
M&A in transportDoes risk-aversion in the transportation and logistics industry limit opportunities for digitalization? Traditional vs. start-up
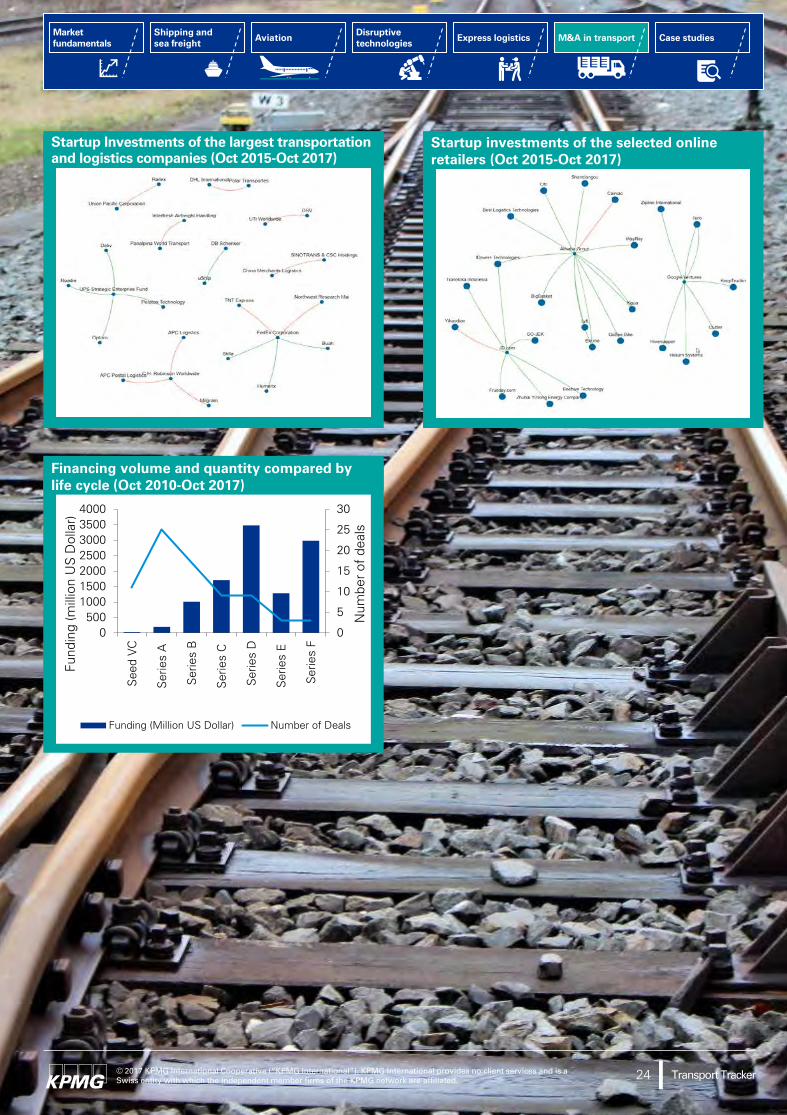
An analysis of start-up investments of the 20 leading transportation and logistics companies(a) appears to support the above hypothesis. In contrast hereto, online retailers are heavily investing; the top five online retailers and technology drivers (Google, Alibaba, JD.com, Amazon, and eBay) have already invested financing shares in 17 start-ups in 2017, while their established competitors managed only nine transactions. Over the period from 2010 to 2017, online retailers have completed more than three times as many investment rounds than the top ten logistics companies, and more than seven times than the ten leading transportation companies.
Among the established transportation and logistics companies, only UPS has its Strategic Enterprise Fund to “enhance the evolving business model of UPS(b)“ as a vehicle for, traditionally risky, investments in new market entrants and innovative solution providers. Other competitors like FedEx are showing increasing interest in direct involvement in start-ups, as indicated by several business plan contests.
Through numerous investments, such as the freight forwarding service uShip, DB Schenker has also indicated great interest in disruptive companies. Nevertheless, the remaining established companies appear to be operating in a rather cautious and highly selective manner, which appears in stark contrast with the high interest of the new market participants.
The high activity of the online retailers is far from surprising; these entities are enhancing and optimizing their own logistical infrastructure, systems and enterprise architecture through acquiring the solutions and competencies of the new companies. In addition to economic performance, the agile structure of the tech companies favours easier integration of start-ups. The infrastructure, IT-systems and processes of the newer market agents are more elastic than those of the traditional companies, allowing a faster implementation of modifications and acceptance of major changes.
Investment focus on capacity management
Both traditional and online investors have shown significant interest for new systems regarding capacity management of their present fleets within the scope of “On-Demand Delivery Platforms” and “Freight Transportation Marketplaces”. Investments in “Software Solutions” underscore the importance of efficient IT-based systems and processes for aligning companies with digitization. “Alternative Vehicle Technologies” follows the trend of the automotive and trucking industry towards an enhanced fleet and vehicle management method.
The higher willingness to take risks of the new market participants is also reflected in their respective investment behaviour and timing. Whilst the traditional transport and logistics companies are primarily involved in later rounds of financing (from Series D onwards), the online retailers dare to participate even in the earliest rounds of funding. Of course, seed investments are exposed to a higher default risk, but at the same time enable the respective investors early access to new and innovative ideas, which can be integrated early into existing systems and infrastructures; developing them further to maturity in order to use them optimally internally.
Note: (a) Forbes, The World's Largest Transportation Companies (https://www.forbes.com/sites/antoinegara/2017/05/24/2017-global-2000-the-worlds-largest-transportation-companies/#6f5b2356406d; Trending Top Most, Top 10 Logistics Companies in The World (http://www.trendingtopmost.com/worlds-popular-list-top-10/2017-2018-2019-2020-2021/business/logistics-companies-world-india-best-largest-revenue)
(b) UPS Corporate Website (https://www.ups.com/sef/)
24© 2017 KPMG International Cooperative (“KPMG International”). KPMG International provides no client services and is a Swiss entity with which the independent member firms of the KPMG network are affiliated. | Transport Tracker
Market fundamentals AviationShipping and
sea freight Case studiesExpress logisticsDisruptive technologies M&A in transport
Startup Investments of the largest transportation and logistics companies (Oct 2015-Oct 2017)
Startup investments of the selected online retailers (Oct 2015-Oct 2017)
Financing volume and quantity compared by life cycle (Oct 2010-Oct 2017)
0
5
10
15
20
25
30
0500
1000150020002500300035004000
See
d V
C
Ser
ies
A
Ser
ies
B
Ser
ies
C
Ser
ies
D
Ser
ies
E
Ser
ies
F
Num
ber o
f de
als
Fund
ing
(mill
ion
US
Dol
lar)
Funding (Million US Dollar) Number of Deals

© 2017 KPMG International Cooperative (“KPMG International”). KPMG International provides no client services and is a Swiss entity with which the independent member firms of the KPMG network are affiliated. |25 Transport Tracker
M&A in transport (cont.)Regional focus crucial for global investors
In addition the analysis reveals further trends; online retailers appear to prioritize local rather than international investments. Alibaba especially stands out, with more than half of the funds reviewed in the analysis being local investments. Additionally, the European and American investors appeared to seek predominantly local investment opportunities within their respective geographies.
Other ways to drive digitalization
New market entrants act more agilely and dynamically than their established competitors, creating new threats as well as opportunities for established market participants. So do the established market agents really miss out on digitalization?
Integration of start-ups gets ever more complicated when the buy-side entity has long-established in-house systems and processes (often running for decades), as well as arduous and drawn-out decision making processes.
There are, however, several examples that give reason to believe that the established market participants have developed their own approach to develop their businesses proactively. As they are more risk averse, they focus more on cooperation and internal developments rather than acquiring too many ‘new kids on the block’ who may suffer from a clash in cultures when working in an established, settled and less agile environment.
Instead they organise trips to innovative hotspots such as Silicon Valley, Israel or Berlin to gain inspiration, knowledge and business relationships for their internal development teams.
In-house innovation laboratories can promote the exchange and development of internal ideas. There are many such examples of this kind of set-up, such as the Lufthansa Innovation Hub, the DHL Innovation Centre and the co-working space of Deutsche Bahn, DB mindbox.
There is also active involvement in sector cooperation, such as the Digital Hub Logistics Hamburg, which works with the support of logistic providers like GLS, the port logistic operator HHLA and shipping & logistics provider MSC.
Partnerships with research institutes like the Dachser Enterprise Lab in cooperation with the Fraunhofer-Institut für Materialfluss and Logistik IML are also proving successful for the promotion, exchange and development of innovative ideas within established business.
A proof of concept can be found at the Deutsche Post DHL Group: by introducing the fully electrical StreetScooter in collaboration with the RWTH Universität von Aachen (prior to any major automotive company), they were able to start serial production. Moreover, their own platform Saloodo! provides an end-to-end solution of freight forwarding to senders and transportation companies.
DB Schenker, in cooperation with EasyMile, has started to experiment on the implementation of autonomous busses in Leipzig.
The above examples of different approaches give strong reason to believe that the traditional transportation and logistics companies are finding their own approach to adapt their business model to the newest developments.
Whether the more risk-averse, predominately European market participants, the more risk-seeking American and Asian companies or the online-based competitors will benefit more from their respective strategies remains to be seen. It is clear, however, that those that benefit the most will be the entities driving the Transport & Logistics sector going forward.
Dr. Steffen WagnerGlobal Head of Transport & Leisure

26© 2017 KPMG International Cooperative (“KPMG International”). KPMG International provides no client services and is a Swiss entity with which the independent member firms of the KPMG network are affiliated. | Transport Tracker
New market entrants act more agilely and dynamically than their established competitors
Dr Steffen WagnerGlobal Head of Transport & Leisure
“”
Market fundamentals AviationShipping and
sea freight Case studiesExpress logisticsDisruptive technologies M&A in transport
Timeline of number of deals (Oct 2010-Oct 2017)
0
5
10
15
20
25
30
2010 2011 2012 2013 2014 2015 2016 2017
Online RetailersEstablished Player LogisticsEstablished Player Transport
© 2017 KPMG International Cooperative (“KPMG International”). KPMG International provides no client services and is a Swiss entity with which the independent member firms of the KPMG network are affiliated. |27 Transport Tracker
Global case studies in transport & logisticsMajor parcel and delivery provider – operating model development and staff engagementClient challenge
The client recognised that to remain relevant and profitable they needed to dramatically change the way they do business – to become more innovative and customer-centric and to digitise. It was understood that technology was fundamental to this success, and with the appointment of a new CIO and leadership team, IT was looking to implement a new operating model and significantly transform their culture to achieve the vision.
KPMG response
KPMG professionals recognised that the client’s people were the most critical factor in their future success. KPMG showed the client passion and enthusiasm for what they were trying to do and demonstrated creativity and innovation in helping them achieve the desired outcomes. KPMG worked with the client and developed real relationships and communicated in an honest and open way. Specifically:
— KPMG facilitated two interactive, highly personal workshops with the IT leadership team to help them build alignment across the team and define their future IT Customer Centric Operating Model.
— A detailed current state analysis of IT was compiled to support the development of an IT operating model.
— Most importantly, KPMG professionals recognised that deep engagement and commitment by all 1000 IT staff members was critical. Twenty-four workshops were facilitated across six states over two weeks and enabled each staff member to define what the future success of IT looked like and make suggestions on how things needed to be improved.
— KPMG facilitated a five-day off site leadership workshop to address leadership issues and develop leadership expectations. In a two-day, highly interactive session, IT leadership used the current state analysis and staff feedback to develop the IT Customer Centric Operating Model.
Benefit to client
KPMG worked with the client's IT team to achieve the following outcomes:
— Built strategic alignment among the newly appointed senior leadership team and positioned leadership to drive and embed ongoing behavioural changes required for IT to be successful.
— Developed a detailed customer centric operating model and strategic work plan to implement the new operating model.
— Through deep staff engagement, made the client IT journey personal to all employees, gave them the opportunity to define their future and subsequently created buy in and optimism for the future of IT at the client.

28© 2017 KPMG International Cooperative (“KPMG International”). KPMG International provides no client services and is a Swiss entity with which the independent member firms of the KPMG network are affiliated. | Transport Tracker
Market fundamentals AviationShipping and
sea freight Case studiesExpress logisticsDisruptive technologies M&A in transport

© 2017 KPMG International Cooperative (“KPMG International”). KPMG International provides no client services and is a Swiss entity with which the independent member firms of the KPMG network are affiliated. |29 Transport Tracker
Global case studies in transport & logistics (cont.)LA Metro – risk allocation and inventory screeningClient challenge
As part of the Risk Allocation Matrix (RAM) action plan, Los Angeles Metropolitan Transportation Authority (LA Metro) is exploring options and opportunities to seek revenue and save costs from its non-monetary assets through a strategic mix of cost cutting, revenue generation and fare adjustments to avoid more drastic and reactionary measures in the future.
KPMG response
KPMG in the U.S. was appointed as an advisor to LA Metro’s RAM action plan. The current set of activities/tasks include:
1. Kick-off meeting and project management
2. RAM workshop
3. Opportunity screening and
4. Final report
KPMG in the U.S. assisted the department with benchmarking and comparative analysis to generate sponsorship revenues from 511 systems, freeway service patrol, and though third party leasing of LA Metro’s assets such as excess lands and right of way. In addition, KPMG in the U.S. also looked at various cost-saving measures such as outsourcing of Operations and Maintenance (O&M) and consolidation of O&M contracts. KPMG's work included providing recommendations for effective ways to capture those additional revenues and savings.
As part of the framework, KPMG looked at different screening criteria such as Acceptability, Operational/Interface, Implementation, Timing/Phasing and Financial. KPMG committed to delivering the proposed Asset Scan services within three months (or 13 weeks) and welcomed the opportunity to prioritize services to meet LA Metro’s timeline requirements. KPMG professionals committed to delivering the following services and deliverables as part of the Asset Scan scope of services:
— Identify and develop range of value estimates associated with potential revenues or cost offsets based on benchmarks, market comparable and Metro information.
— Deliver an assessment on LA Metro’s asset opportunities ranked using LA Metro defined criteria from highest to lowest based on: short term impacts and long term impacts.
— List LA Metro’s assets ranked from highest to lowest value opportunities using Metro developed criteria.
— Issue a Phase I – Draft final report for LA Metro’s review and comments and Deliver a Phase I – Final Report.
Benefits to client
Through highly experienced individuals delivering the asset scan methodology KPMG in the U.S. provided LA Metro with a list of cost-savings and revenue-generating opportunities that could advance to the next phase of the study.

30© 2017 KPMG International Cooperative (“KPMG International”). KPMG International provides no client services and is a Swiss entity with which the independent member firms of the KPMG network are affiliated. | Transport Tracker
Contact UsDr Steffen Wagner Global Chair, Transport Tel: + 49 (0)69 9587 [email protected]
Hartmut HeckertGlobal Head of ShippingTel: + 49 (0)40 32015 [email protected]
Malcolm RamsayGlobal Head of AviationTel: + +65 (0) 6508 [email protected]
Justin ZatouroffGlobal Head of Post and ExpressTel: + 44 (0)20 7311 [email protected]
Transport practice professionals would be pleased to discuss the results of our analysis with you.

The information contained herein is of a general nature and is not intended to address the circumstances of any particular individual or entity. Although we endeavour to provide accurate and timely information, there can be no guarantee that such information is accurate as of the date it is received or that it will continue to be accurate in the future. No one should act on such information without appropriate professional advice after a thorough examination of the particular situation.
© 2017 KPMG International Cooperative (“KPMG International”), a Swiss entity. Member firms of the KPMG network of independent firms are affiliated with KPMG International. KPMG International provides no client services. No member firm has any authority to obligate or bind KPMG International or any other member firm vis-à-vis third parties, nor does KPMG International have any such authority to obligate or bind any member firm. All rights reserved. Printed in the United Kingdom.
Produced by CREATE | CRT089809A | November 2017
The KPMG name and logo are registered trademarks or trademarks of KPMG International.
kpmg.com