transport sector technical inspection … 3. traffic density in different zones of nepal in 1995 and...
TRANSCRIPT

TRANSPORT SECTORTECHNICAL INSPECTION
POLICY IN NEPAL
P.K. Jha
Central Department of Botany
Tribhuvan University, Kathmandu

CONTENTS
§ Backgroung§ Transport System§ Vehicles§ Traffic System§ Air Pollution§ Environmental Policy§ Transport Policy§ Vehicular Pollution
Control Program
§ Fuel Consumption andProperty
§ Emission Standard andInspection System
§ Maintenance System
§ Necessary Policies andActions
§ Conclusion

TRAFFIC SYSTEM§ Traffic Concept Introduced in Kathmandu in
1944§ Transport Act in 1963§ Vehicle and Transport Management Act 1992§ Parking Fee System: 17 Sectors: April 1995§ Introduced One Way Traffic§ Vehicle Movement Finding in Some Area
Fixed

Table 2. Number of vehicles (by type) registered in Nepal upto July 15, 2001.
Type of Vehicles No. of Vehicles PercentageBus 10546 3.45Minibus 2961 0.97Truck/Tanker 21580 7.07Car/Jeep/Van 59115 19.35Tempo 6934 2.27Motorcycle 176476 57.78Tractor 23991 7.85Other 3792 1.24Total 305395 100

Table 3. Traffic density in different zones of Nepal in 1995 and 2001.Administrative Traffic density per len of road Change (%)zones 1995 2001MechiKoshiSagarmathaJanakpurBagmatiNarayaniGandakiLumbiniRaptiBheriSetiMahakaliNepal
2.009.312.863.7551.0419.159.077.201.213.532.371.7713.83
13.2513.643.663.7368.6026.1412.8012.901.436.115.912.2519.20
62.546.5027.97-0.5334.4036.5041.1279.1618.1873.08149.3627.1138.82
Increase in Road (%) during 1995-2001 = 48.31%.Increase in vehicles (%) during 1995-2001 = 105.85%.Increase in traffic density (%) during 1995-2001 = 38.82%.

Table 4. Level of air pollutants in Kathmandu.Pollutant Range ReferenceTSP/l 800 µg/m3
308-401 µg/m3
URBAIR 1997ENPHO 1999
PM10 100-190 ENPHO 1999CO 6-7 ppm (at heavy traffic) Upadhyay and Ghimire 1997NO2 14-126 µg/m3 (NOx)
16.0-25.3 µg/m3 (NO2)18-140 ppb (NO2)
KVVECP 1993ENPHO 1999Silwal et al. 2001
SO2 100-225 µg/m3
5.30 ppb7.8-104
KVVECP 1993Silwal 2001ENPHO 1999
Pb 0.31-0.69 Leaders Nepal 1999.

ENVIRONMENT PROTECTIONREGULATION1997
ENVIRONMENT PROTECTIONREGULATION(First amendment) 1999

VEHICULAR POLLUTIONCONTROL PROGRAM
§ 1993: Vehicular pollution emission testinitiated (Kathmandu Valley Vehicle EmisionProject).
§ 1994: Conversion of diesel operated threewheeler vehicles into electrical charge batterysystem (800 electric battery or LPG operatedvehicles).
§ 1996: Regular vehicle emission programintroduced (vehicles must have compliancecertificate).

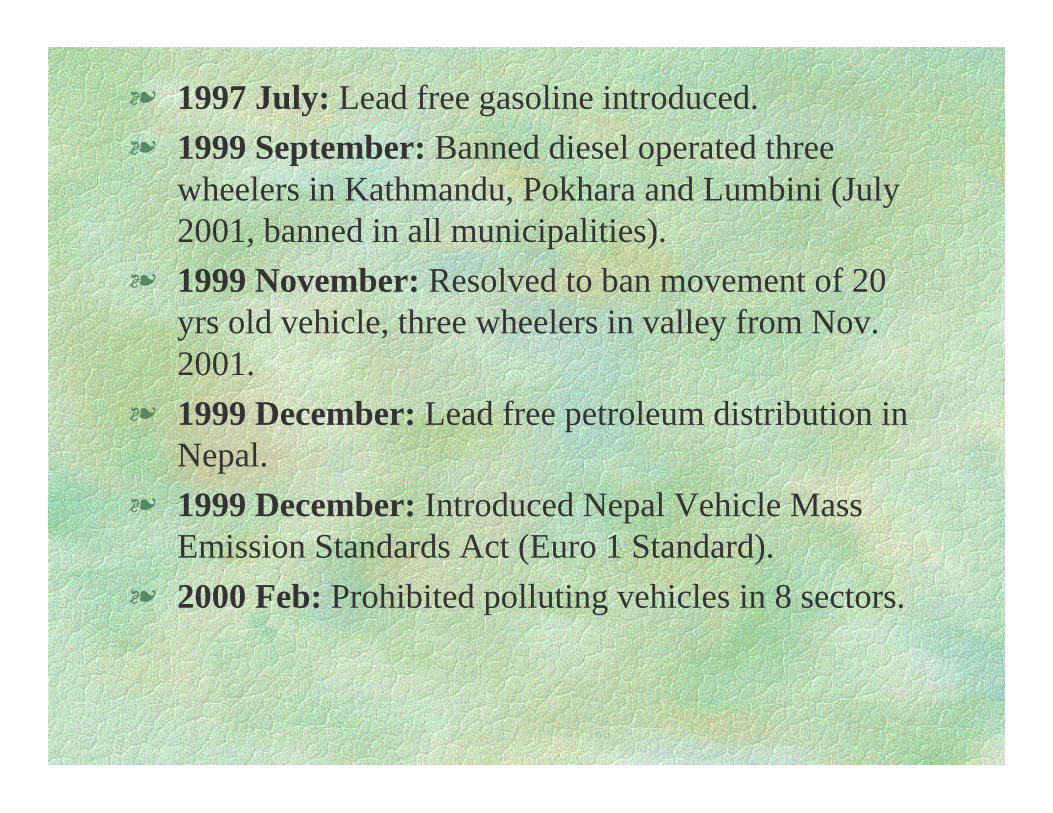
§ 1997 July: Lead free gasoline introduced.
§ 1999 September: Banned diesel operated threewheelers in Kathmandu, Pokhara and Lumbini (July2001, banned in all municipalities).
§ 1999 November: Resolved to ban movement of 20yrs old vehicle, three wheelers in valley from Nov.2001.
§ 1999 December: Lead free petroleum distribution inNepal.
§ 1999 December: Introduced Nepal Vehicle MassEmission Standards Act (Euro 1 Standard).
§ 2000 Feb: Prohibited polluting vehicles in 8 sectors.

VEHICULAR POLLUTIONCONTROL PROGRAM
§ 1993: Vehicular pollution emission testinitiated (Kathmandu Valley Vehicle EmisionProject).
§ 1994: Conversion of diesel operated threewheeler vehicles into electrical charge batterysystem (800 electric battery or LPG operatedvehicles).
§ 1996: Regular vehicle emission programintroduced (vehicles must have compliancecertificate).
§ 1997 July: Lead free gasoline introduced.
§ 1999 September: Banned diesel operated threewheelers in Kathmandu, Pokhara and Lumbini (July2001, banned in all municipalities).
§ 1999 November: Resolved to ban movement of 20yrs old vehicle, three wheelers in valley from Nov.2001.
§ 1999 December: Lead free petroleum distribution inNepal.
§ 1999 December: Introduced Nepal Vehicle MassEmission Standards Act (Euro 1 Standard).
§ 2000 Feb: Prohibited polluting vehicles in 8 sectors.

FUEL CONSUMPTION
§Fig. 4. Sales of fossil fuel (petroleum products) between 1990-91 and 1999-2000(Source: Nepal Oil Corporation)
7849
19
7507
12
7097
24
6135
72
5637
69
5158
26
4484
06
4004
24
3504
34
2953
89
0
100000
200000
300000
400000
500000
600000
700000
800000
900000
1990
-91
1991
-92
1992
-93
1993
-94
1994
-95
1995
-96
1996
-97
1997
-98
1998
-99
1999
-200
0
Kilo
litre
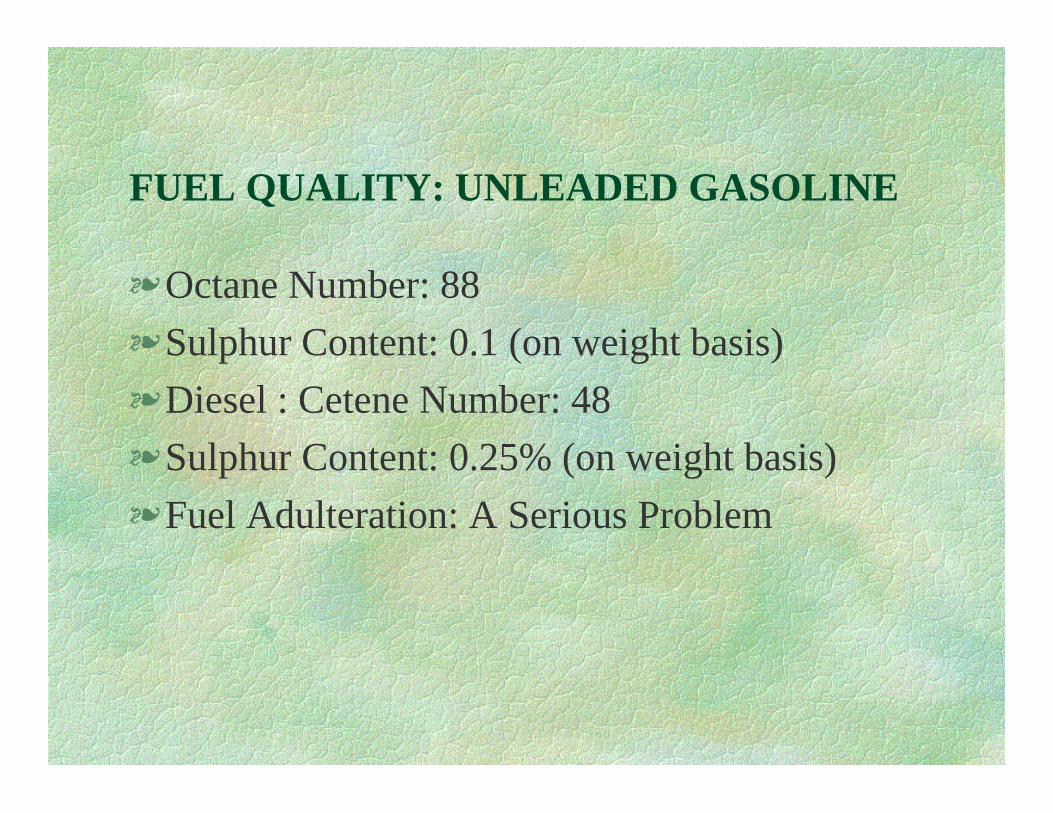
FUEL QUALITY: UNLEADED GASOLINE
§ Octane Number: 88
§ Sulphur Content: 0.1 (on weight basis)
§ Diesel : Cetene Number: 48
§ Sulphur Content: 0.25% (on weight basis)
§ Fuel Adulteration: A Serious Problem

Table 5. Emission Standards for vehicles in Nepal.Fuel Wheelers type Manufacturing date Emissions
Petrol and LPG 4 Wheelers4 Wheelers3 Wheelers3 Wheelers
upto 1980after 1981upto 1991after 1992
4.5% CO, 1000 ppm HC3.0% CO, 1000 ppm HC4.5% CO, 7800 ppm HC3.0% CO, 7800 ppm HC
Diesel — upto 1994after 1994
75 HSU65 HSU
CO = Carbon monoxide, HC = Hydrocarbon, HSU = Hertridge Smoke Unit.

Fig. 1. Number of vehicles in 1989-90 to 2000-2001.
3053
95
2644
00
2361
20
2119
81
1915
56
1724
46
1492
53
1318
37
1152
30
1023
67
8790
2
7637
8
0
50000
100000
150000
200000
250000
300000
350000
1989
-90
1990
-91
1991
-92
1992
-93
1993
-94
1994
-95
1995
-96
1996
-97
1997
-98
1998
-99
1999
-200
0
2000
-200
1
Num
ber
of v
ehic
les

Fig. 2. Annual growth rate of vehicles in Nepalbetween 1990-91 and 2000-2001.
15.5
11.9
7
11.3
8
10.6
6
11.0
8
15.5
4
13.214
.41
12.5
6
16.4
5
15.0
8
0
2
4
6
8
10
12
14
16
18
1990-91
1991-92
1992-93
1993-94
1994-95
1995-96
1996-97
1997-98
1998-99
1999-2000
2000-2001
Ch
ange
(%
)

Fig. 3. Number of vehicles registered in Nepal between 1990-91and 2000-2001 (Source of data of Figs. 1-3: Department of
Transport Management, HMGN)
4099
5
2828
0
2413
9
2042
5
1911
0
2319
3
1741
4
1660
9
1286
1
1446
7
1152
4
0
5000
10000
15000
20000
25000
30000
35000
40000
45000
1990
-91
1991
-92
1992
-93
1993
-94
1994
-95
1995
-96
1996
-97
1997
-98
1998
-99
1999
-200
0
2000
-200
1
Tot
al v
ehic
les
regi
ster
ed

Table 1. Number of vehicles in different zones in Nepal upto July 15, 2001.Zones Roads Vehicles
Length (Km) Percentage Numbers PercentageBagmatiNarayaniLumbiniKoshiGandakiJanakpurBheriMechiSagarmathaSetiMahakaliRaptiDhaulagiriTotal
2503202215261442109418181144115781170263596289
15905
15.7312.719.599.066.8711.437.197.275.094.413.996.050.56100
171678528561971619674139876782699737672971415414341379
-305395
56.2117.306.456.444.582.222.291.230.971.360.470.45
-100