transport prices and costs: the need to revisit donors...
TRANSCRIPT

Transport Prices and Costs:
The Need to Revisit Donors’ Policies in Transport in Africa
Gaël Raballand
Patricia Macchi
Abstract
This study is the first comprehensive and empirical effort in the last fifteen years to measure and
quantify the determinants of transport costs and prices in Africa. Based on trucking surveys for more than
400 companies in thirteen African countries, it demonstrates that contrary to what most literature has
presented, transport costs (cost to transport service providers) are not excessively high in the Sub-Saharan
region but transport prices (costs to shippers) are, especially in Central Africa. This is mainly a result of
official and unofficial market regulation and structure in trucking services, notably in West and Central
Africa.
In order to seriously tackle transport-related constraints on corridors in Africa, the donor
community should support as a first priority transport market liberalization but also collection of data in the
trucking industry and the use of country specific trucking data in the economic analysis and design of road
maintenance strategies because, in most cases, investments in roads will probably not lead to decrease of
transport costs for end-users of transport services.
Keywords: transport costs, Africa, landlocked, cartels.
Gael Raballand, Africa Transport Unit, The World Bank, J7-701, 701 18th Street, NW, Washington DC, 20433, Ph:1 202 458 0586, Fax: 1 202 473 8326, email: [email protected], Patricia Macchi, Africa Transport Unit, TheWorld Bank, email: [email protected]. The authors would like to thank Supee Teravaninthorn, Olivier Cadotfor comments and suggestions.

2
I. Introduction
In Africa, high transport prices are rightly seen as a major obstacle to economic growth of the
region. This has been documented in several studies. One of them (Amjadi and Yeats, 1995) even
concluded that, in Africa, transport costs are a higher trade barrier than import tariffs and trade restrictions.
In this paper1, it is analyzed, identified and quantified the factors behind Africa’s high prices of road
transport, with the purpose of helping policy-makers adopt appropriate actions to reduce transport prices to
domestic and international trade.
Before the presentation of the results, a distinction has to be made between logistics costs, transport
prices, transport costs and vehicle operating costs in order to avoid the usual confusion. This distinction is
useful because prices may or may not reflect transport costs2:
a) Transport prices are the rates charged by a transport company or a freight forwarder to the
shipper or importer. Transport prices usually are the result of negotiated rates between the
shipper and the transport service provider. Transport prices normally cover transport costs, the
operator’s overheads and profit margin.
b) Transport costs are the costs the transport operator incurs when transporting a cargo. In addition
to VOC, transport cost includes other indirect costs, such as license fee, roadblocks, etc.
c) Vehicle operating costs (VOC) include the various direct costs the transport provider must pay
to operate a given vehicle, notably labor, capital, fuel, tyres, maintenance and depreciation cost
of a vehicle.
A few empirical studies including trucking surveys carried out since the mid-1990s demonstrated
that transport prices were high in Africa compared to other regions. One study (Rizet and Hine, 1993)
estimated that prices of road transport in three Francophone African countries (Cameroon, Côte d'Ivoire and
Mali) were up to six times higher than in Pakistan, and about 40 percent higher than in France where labor
rates are much higher. Another study (Rizet and Gwet, 1998) comparing seven countries in three continents,
Africa (Ghana, Cameroon, Burkina, Côte d’Ivoire), South-East Asia (Indonesia, Vietnam) and Latin
America (Costa Rica), demonstrated that for distances up to 300 kilometers, the unit costs of road transport
were 40-100 percent higher in Africa than in South-East Asia. Transport prices for most African landlocked
countries range from 15 to 20 percent of imports costs (MacKellar et al., 2002), which is three to four times
higher than in most developed countries.
1 The paper is based on a World Bank report. See Teravaninthorn and Raballand (2008) for a detailed description ofthe methodology and Annex 5.2 Logistics costs can be added. However, there is no agreement on a precise definition of logistics costs. Logistics isthe process of planning, implementing, and controlling the efficient, cost effective flow and storage of raw materials,in-process inventory, finished goods and related information from point of origin to point of consumption for thepurpose of meeting customer requirements. Logistics costs then encompass a much wider definition than transport cotsincluding transaction costs (those related to transport and trade-processing of permits, customs, standards), financialcosts (inventory, storage, security), and non-financial costs (insurance).

3
However, a number of studies that looked at the determinants of the high transport costs in Africa
did not arrive at a wide consensus, but rather identified different factors as being the main contributors to
the high prices. The factors included: low productivity of the trucking industry in Africa, notably due to
infrastructure constraints (Pedersen, 2001), low levels of competition between service providers (Rizet and
Hine, 1993), or weak infrastructure (Limao and Venables, 2001). This latter study also indicated the poor
quality of infrastructure as accounting for most of Africa’s poor trade performance. From a cross-country
regression, the study concluded that trade was highly sensitive to transport costs – a 10 percent drop in
transport costs increases trade by 25 percent, and transport costs are sensitive to the quality of
infrastructure, as measured by such variables as the density of the road and rail network.
In the past, large investments in improving road infrastructure were predicated on the basis that
transport prices would be reduced. The World Bank since the 1970s have actively supported the transport
corridors in Africa and during many years such support focused almost exclusively on improving
infrastructure. While the improvements were essential to facilitate road transport and resulted in lower costs
for the trucks carrying cargo on the corridors, no clear impact on the transport prices was evident. Thus, the
end-users of road transport services did not seem to fully benefit from the lower transport costs and better
service quality that the improved infrastructure could possibly allow.
Since many research attempts in the past did not arrive at a conclusive result, the current study has
made a deliberate attempt to expand both the breadth and depth of the research and can claim to be original
in the following areas:
a) It is the first comprehensive and practical effort in the last fifteen years to measure and quantify
the high transport prices in Africa.
b) It is the first attempt of this kind in Africa and elsewhere in the world to disaggregate and
clearly define the various input factors into three tiers of cost and prices, i.e. vehicle operating
costs, transport costs (incurred to commercial transport providers) and transport prices
(incurred to end users), and try to understand how each of them effect the final transport prices.
c) It is also the first study that clearly recognizes the diversification in transportation market
across Africa continent with an attempt to measure with the same yard stick the costs, prices
and performances of the transportation industry across the four sub-regions of Africa.
Contrary to what most literature has presented, transport costs are not excessively high in Africa but
transport prices are, especially in Central Africa mainly due to official and unofficial market regulation and
structure in trucking services.
Following the introductory section, the report in Section 2 compares transport prices and costs and
trucking services productivity in Africa with other regions of the world and presents a typology of corridors
in Sub-Saharan Africa (SSA). Section 3 disentangles the main determinants of transport costs and
highlights the fact that road condition may not matter much on corridors, while Section 4 demonstrates the

4
impact of cartels on transport prices and service quality. Section 5 assesses econometrically the main
determinants of transport profitability and Section 6 concludes summarizing the main findings and the
policies recommendations for Africa.
II. Where does stand Africa in terms of transport prices, costs and quality?
Transport prices, costs and quality
As shown in Figure 1 transport prices (per ton-kilometer) in Africa are, on average3, higher than in
South Asia or Brazil; only the Durban-Lusaka Corridor in Southern Africa approaches the price level of
other regions of the world.
Figure 1: Average transport prices: a global comparison
2
3.5 45 5
67
8
11
0
2
4
6
8
10
12
Pakis
tanBraz
ilUSA
China
Western
Europe
–long dis
tance
(Franc
e)
Africa-
Durban-
Lusaka
Africa-
Lomé-Ouag
adoug
ou
Africa–Mom
basaKam
pala
Africa-
Douala
-Ndja
ména
Aver
aget
rans
port
price
s(in
USce
ntsp
ertk
m)
Source: Study team compilation of data from various sources.
However, tables 1 and 2 demonstrate that transport costs, on the main international corridors,
transport costs in Africa are not excessively higher than in Western Europe. Indeed, variable costs are
higher in Africa because of: (i) high costs of fuel; (ii) old age of truck fleets, which lead to a higher fuel
consumption; and (iii) probably worst roads condition. However, lower fixed costs in Africa offsets this.
3 Average transport prices are difficult to disaggregate because transport prices or freight rates are dependent onseveral factors including Return cargo: if backload is ensured, freight rates are lowered; Cargo types: tankers, oilproducts, machinery and containers are more expensive to transport than general cargo in bags; Commercialpractices/discounts: there are often large discrepancies between published tariff schedules and what customers actually pay;Seasonal demand: prices are seasonal and are highly sensitive to supply/demand, especially for certain export commoditiesand some imported finished goods.However, although there are some possible biases and problems concerning data reliability, transport prices are ratherhomogeneous along the studied routes in the trucking surveys. Along a corridor, prices obviously vary: for instance, in USDprices per tkm, from Mombasa, average prices are set at 4 USD cents for Kenya, 8.5 for Uganda, 9 for Rwanda, 11 forBurundi and 12 for DRC (Goma) (Oyer 2007).

5
Fixed costs are much lower in Africa than in Europe due to much lower wages and lower capital cost
associated with the use of aged truck fleets.
Table 1: Comparative transport costs between Africa and Europe (Eastern and Western) (in USD)
CentralAfrica
EastAfrica France Spain Germany Poland
Total transport costs(USD per veh-km) 1.87 1.33 1.59 1.52 1.71 2.18
Source: surveys for Africa, CNR for Europe.
Table 2: Transport costs comparison between Central, East Africa and France
Central Africa4 East Africa5 FranceVariable costs
(in USD per km) 1.31 0.98 0.72
Fixed costs(in USD per km) 0.57 0.35 0.876
Total transport costs(in USD per km) 1.88 1.02 1.59
Average fleet age(in years) 11 years 7 years 7 years
Fuel consumption(in liters per 100 kilometers) 65 liters 60 liters 34 liters
Yearly mileage(in kms) 65,000 100,0007 121,000
Average daily speed(in kms per hour)8 30 43 69
Payload utilization9
(in percentage) 75% 76% 87%
Immobilization timebefore loading10 13 hours 6 hours 1.6 hours
Articulated trucks(in USD) n/a 169,200 138,000
Note: East Africa truck price (in USD) corresponds to a heavy truck.Source: CNR for France. Trucking surveys for Central and East Africa.
The paradox lies in the fact that despite such low wages level, transport costs and prices qre not
much lower, while they are potentially the lowest in the world. Trucking industry is an activity intensive in
4 Corridor Douala-N’Djaména.5 Corridor Mombasa-Kampala.6 Data for 2006.7 Based on interviews.8 Data from HDM-4 (Highway Development Management) for African corridors.9 Ratio of the number of kilometers with payload over the total number of kilometers of a truck. Data are based onrather similar truck capacity; African companies usually importing trucks from Europe after several years of use.10 Calculations for immobilization time before loading for African routes comes from the trucking surveys whenloading at ports. It derives from the following question: what was the average amount of time you waited to pick upfreight once inside the port?

6
labor. As such, the lower wages in Africa help to maintain at a relatively low level transport costs (see
Table 3 for the wages comparison).
Table 3: Median monthly wages for truckers (in USD)
Country Median monthly wagesFrance 3,129
Germany 3,937Chad 189
Kenya 269Zambia 160
Source: CNR for France and Germany. Trucking surveys for Chad and Kenya. Monthly wages include bonus forFrance and Germany.
As shown in Figure 2, below, the four African sub-regions are on average below other regions in
the world with respect to transport quality, West Africa being the worst and Southern Africa being the best
within Africa. A yearly survey of international freight forwarders allows to determine the Logistics
Performance Index (LPI)11.
Figure 2: Transport quality in the world based on the Logistics Performance Index
2.19 2.272.49
2.733.01 3.14
3.91 3.99
2.0
2.5
3.0
3.5
4.0
4.5
WestAfrica
CentralAfrica
EastAfrica
SouthernAfrica
LatinAmerica
EasternEurope
USA WesternEurope
Tran
spor
tQua
lity
(LPI
)
Source: World Bank, LPI (2007).
Comparing transport prices and the quality of service as measured by the LPI with other countries
shows that transport service in Africa is both more expensive and lower quality than in developed countries
such as France and USA12. In the figure, the greater the LPI (i.e.,the better the transport quality), the lower
the average transport price. USA has an LPI of 3.84 while West Africa’s is 2.54. The LPI in Africa ranges
11 The LPI is a set of indicators that measure perceptions of the logistics environment of 140 countries on severallogistics dimensions (e.g. transport price, infrastructure, customs, etc.). The survey uses an anonymous, web-basedquestionnaire which asks respondents to evaluate their country of residence, as well as eight countries they are dealingwith, on several logistics dimensions: international transportation costs; domestic transportation costs; timeliness ofshipments; tracking of shipments; transport and IT infrastructure; customs and other border procedures; and logisticscompetence.12 Transport quality and predictability induce increase in non-logistics costs and then on development. See Arvis et al.(2007) on this question.

7
between 2.54 and 3.11, the Central African region being an extreme case of high prices associated with low
quality.
In order to assess transport quality in such environment, a proxy of transport quality was developed
based on trucking survey results13 (see results in Figure 3). Based on this index, transport quality seems to
be highest in Kenya and Uganda and lowest in Chad and Burkina Faso.
Figure 3: A transport quality index based on the trucking surveys results
0.320.38
0.33
0.25
0.60
0.450.42
0.0
0.1
0.2
0.3
0.4
0.5
0.6
0.7
Burkina Ghana Cameroon Chad Kenya Uganda Zambia
Tra
nsp
ort
qu
alit
yin
dex
Source: Trucking surveys and own calculations.
Prices differ between African sub-regions
Transport prices differ widely in Africa. On average, transport prices in Southern Africa are
between two and three times lower than in Central Africa. The findings signal that the transport industry has
distinctive features along different routes. Transport practices, prices and costs are mainly route-specific
(see Table 4).
13 It would have been obviously better to assess transport quality from end users but it is rather difficult to get reliabledata on transport quality from firm surveys, such as investment climate assessments.The index is calculated as a weighted average of indexes using the following weights :
Parameter Weighting coefficientEducation level of the head of the company 2Experience in the industry of the head of the company 1Perception of the importance of domestic competition 2Importance of freight load obtained through contracting 2Use of tracking system 1Fleet size 1Fleet age 3Number of employees 1

8
Table 4: International transport prices, costs and profit margins (from gateway to destination)14
Route Price15 Variable cost Fixed cost Profitmargin16
CorridorGateway - Destination (USD per
km)(USD per
km)(USD per
km) (percent)
3.5317 1.54 0.66Tema/Accra -Ouagadougou (Ghana) (2.01) (0.59) (0.64)
80%
3.93 1.67 0.62
West Africa(Burkina and
Ghana) Tema/Accra - Bamako(Mali) (1.53) (0.23) (0.36)
80%
3.19 1.31 0.57Douala - N’Djaména(Chad) (1.10) (0.32) (0.30)
73%
3.78 1.21 1.08Douala - Bangui (CAR)(1.30) (0.35) (0.81)
83%
5.37 1.83 0.73Ngaounderé - N’Djaména(Chad) (1.44) (0.25) (0.44)
118%
9.71 2.49 1.55
Central Africa(Cameroon and
Chad)
Ngaoundéré - Moundou(Chad) (2.58) (0.64) (0.43)
163%
2.22 0.9818 0.35Mombasa - Kampala(Uganda) (1.08) (0.47) (0.14)
86%East Africa(Kenya and
Uganda) Mombasa-Nairobi(Kenya)
2.26(1.36)
0.83(0.17)
0.53(0.19)
66%
Lusaka-Johannesburg(South Africa)
2.32(1.59)
1.54(0.41)
0.34(0.40)
18%Southern Africa(Zambia)
Lusaka-Dar-es-Salaam(Tanzania)
2.55(0.08)
1.34(0.52)
0.44(0.51)
62%
Notes:1. These values include trucking services (three or more trucks) and truckers (one or two trucks). We are reportingthe destination city and country in parenthesis2. Standard deviation in parenthesis.
Source: Trucking surveys data and own calculations. Exchange rates come from IMF-IFS.
14 Prices are in USD per kilometer because most companies have the same truck capacity and similar (over)loadingpractices on a corridor. Moreover, due to questions in reporting overloading, prices in USD per kilometer are probablymuch more reliable than prices in ton kilometer. Prices and costs obtained from reported truckload (approximately 30tons).15 Some indicative prices are set by some ministries of transportation in Africa but are not used. Prices set by freightallocation bureaus in Central Africa may be more respected.16 Data should be taken cautiously since some companies may omit some costs or, on the contrary, double count somecosts.17 Prices from the trucking surveys are similar to the ones given by the Conseil Burkinabe des Chargeurs. Dependingon the tonnage (official or real), prices in on per km may be more or less higher.
Official data from Burkina Faso shippers’ council SurveyUnitCFA USD USD
Ton 26,000-30,000 52-60 59
Container 1,300,000 -1,400,000 2,600-2,800 2,000
Note: Exchange rate USD/FCA = 0.002.18 Data are consistent with Oyer (2007), who found 1.1 USD per kilometer for Kenyan routes, without includingoverheads and management costs as well as no border-crossing and bribes costs.
9
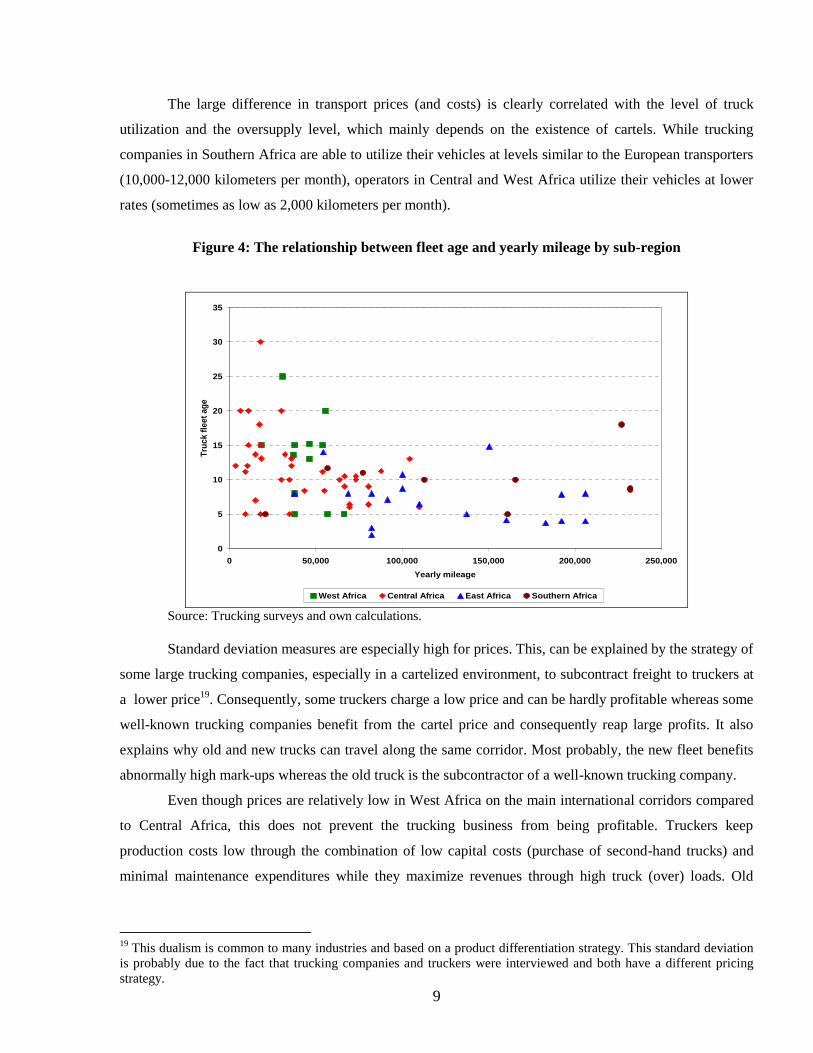
The large difference in transport prices (and costs) is clearly correlated with the level of truck
utilization and the oversupply level, which mainly depends on the existence of cartels. While trucking
companies in Southern Africa are able to utilize their vehicles at levels similar to the European transporters
(10,000-12,000 kilometers per month), operators in Central and West Africa utilize their vehicles at lower
rates (sometimes as low as 2,000 kilometers per month).
Figure 4: The relationship between fleet age and yearly mileage by sub-region
0
5
10
15
20
25
30
35
0 50,000 100,000 150,000 200,000 250,000
Yearly mileage
Truc
kfle
etag
e
West Africa Central Africa East Africa Southern Africa
Source: Trucking surveys and own calculations.
Standard deviation measures are especially high for prices. This, can be explained by the strategy of
some large trucking companies, especially in a cartelized environment, to subcontract freight to truckers at
a lower price19. Consequently, some truckers charge a low price and can be hardly profitable whereas some
well-known trucking companies benefit from the cartel price and consequently reap large profits. It also
explains why old and new trucks can travel along the same corridor. Most probably, the new fleet benefits
abnormally high mark-ups whereas the old truck is the subcontractor of a well-known trucking company.
Even though prices are relatively low in West Africa on the main international corridors compared
to Central Africa, this does not prevent the trucking business from being profitable. Truckers keep
production costs low through the combination of low capital costs (purchase of second-hand trucks) and
minimal maintenance expenditures while they maximize revenues through high truck (over) loads. Old
19 This dualism is common to many industries and based on a product differentiation strategy. This standard deviationis probably due to the fact that trucking companies and truckers were interviewed and both have a different pricingstrategy.

10
trucks then become the economic optimal when mileage is limited to 30-40,000 kilometers per year and
margins derives from cartel prices (see Figure 5).
Figure 5: Costs comparison between old and new trucks in Central Africa
0.501.001.502.002.503.003.504.004.50
20 30 40 50 60 70 80 90 100 110 120
Yearly mileage (in thousands of kms)
Tran
spor
tpri
ces
and
cost
s(in
US
Dpe
rkm
)
new with bank fin new without bank fin old
Source: trucking surveys.
A typology of corridors
Of special importance with regard to transport prices is the fact that each of the corridors in the four
Sub-Saharan corridors has its own market structure and regulation. Figure 6 defines a typology of corridors
with market access at the core of the distinction. The trucking environment and market structure in Central
and West Africa are characterized by cartels offering low transport quality (Cases 1 and 2, respectively),
while in East Africa the trucking environment is more competitive and more mature (Cases 3 and 4). Major
corridors in Southern Africa are the most advanced in terms of competitive and efficient services (Cases 4
and 5).

11
Figure 6: A typology of transport corridors in Africa based on market access
III. Main determinants of transport costs: road condition does not matter so much
Different typologies of transport companies coexist on the same corridors. However, in general, the
cost structure in SSA, even in the more modern and better organized companies, is different from developed
countries: in Africa, trucking companies’ costs are mostly variable cost while fixed costs are generally low.
Central and West Africa are the extreme cases with ratios of 70/30 and above between variable and fixed
costs, while in East Africa the ratio is 60/40. In all African corridors, the cost of fuel and lubricants is the
main variable cost accounting for at least 40 percent of total vehicle operating costs. Tyres cost is another
important cost factor, whereas bribes do not seem to play a major role as has been generally perceived on
most African corridors (see Annex 3).
NO YES
NOYES
NOYESStrong market
regulation(bilateral quotas
and queuingsystem)
Strong obstacles tomarket entry, stronginfluence of the freightbureaus/transportassociations= Low to mediumquality and hightransport price
CASE 1
Relatively relaxedobstacles to marketentry, weak influence ofthe freightbureaus/transportassociations= Very low quality andrelatively lowtransport price
CASE 2
= Low to mediumquality and lowtransport price
CASE 3
= Medium to highquality and low tomedium transportprice
CASE 4
Delays(cross-border
procedures androadblocks)
Roads in goodcondition
= High quality andlow to mediumtransport price
CASE 5
12
In SSA, poor roads are perceived as being the main cause of high variable operating costs. Results
from the study reveal that costs linked to road condition along the selected SSA international corridors do
not seem to be that detrimental to the operating cost of trucks.
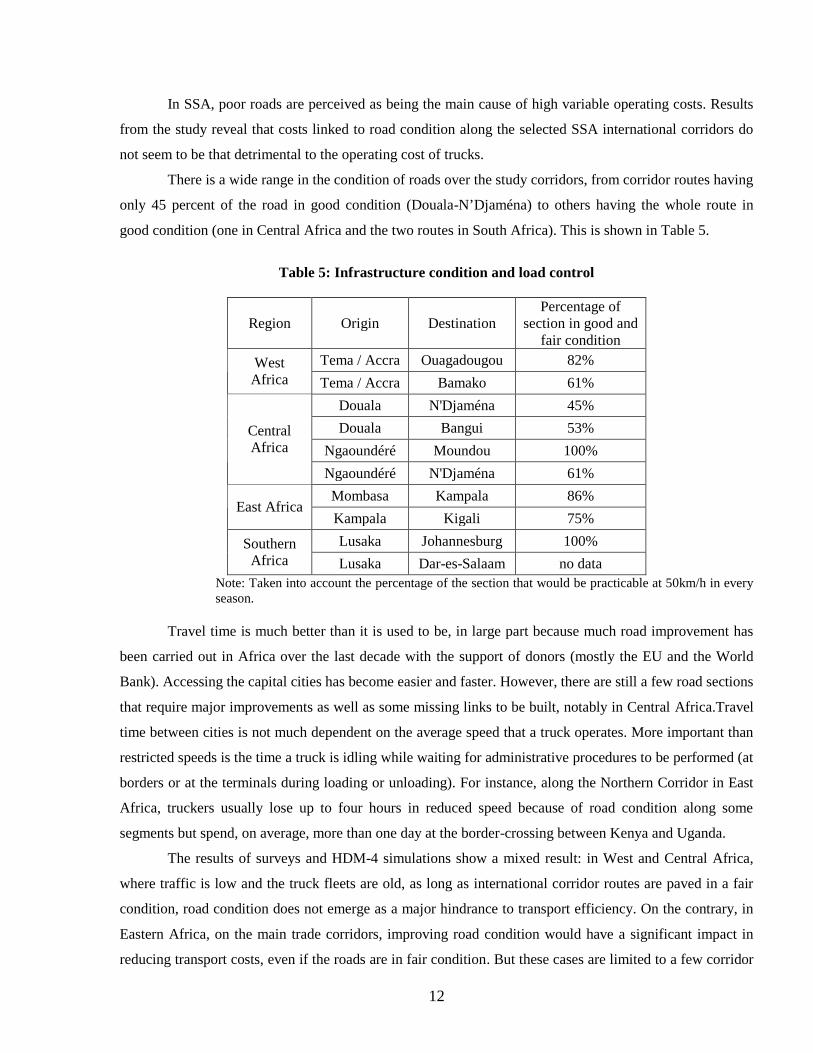
There is a wide range in the condition of roads over the study corridors, from corridor routes having
only 45 percent of the road in good condition (Douala-N’Djaména) to others having the whole route in
good condition (one in Central Africa and the two routes in South Africa). This is shown in Table 5.
Table 5: Infrastructure condition and load control
Region Origin DestinationPercentage of
section in good andfair condition
Tema / Accra Ouagadougou 82%WestAfrica Tema / Accra Bamako 61%
Douala N'Djaména 45%
Douala Bangui 53%
Ngaoundéré Moundou 100%CentralAfrica
Ngaoundéré N'Djaména 61%
Mombasa Kampala 86%East Africa
Kampala Kigali 75%
Lusaka Johannesburg 100%SouthernAfrica Lusaka Dar-es-Salaam no data
Note: Taken into account the percentage of the section that would be practicable at 50km/h in everyseason.
Travel time is much better than it is used to be, in large part because much road improvement has
been carried out in Africa over the last decade with the support of donors (mostly the EU and the World
Bank). Accessing the capital cities has become easier and faster. However, there are still a few road sections
that require major improvements as well as some missing links to be built, notably in Central Africa.Travel
time between cities is not much dependent on the average speed that a truck operates. More important than
restricted speeds is the time a truck is idling while waiting for administrative procedures to be performed (at
borders or at the terminals during loading or unloading). For instance, along the Northern Corridor in East
Africa, truckers usually lose up to four hours in reduced speed because of road condition along some
segments but spend, on average, more than one day at the border-crossing between Kenya and Uganda.
The results of surveys and HDM-4 simulations show a mixed result: in West and Central Africa,
where traffic is low and the truck fleets are old, as long as international corridor routes are paved in a fair
condition, road condition does not emerge as a major hindrance to transport efficiency. On the contrary, in
Eastern Africa, on the main trade corridors, improving road condition would have a significant impact in
reducing transport costs, even if the roads are in fair condition. But these cases are limited to a few corridor

13
routes. Table 6 presents indicative results of the cost/benefit analysis of partial road rehabilitation on a
given corridor of 1,000 kilometers, depending on changes in road condition.
Table 6: Indicative internal rate of return of infrastructure rehabilitationin three African sub-regions20
West Africa Central Africa East Africa
50 kmproject
100 kmproject
50 kmproject
100 kmproject
50 kmproject
100 kmproject
Min. traffic <0% <0% <0% <0% 7% 0%Fair toGood
Max. traffic <0% <0% <0% <0% 30% 15%
Min. traffic <0% <0% <0% <0% 38% 20%Poor toGood
Max. traffic 8% 1% 12% 3% 127% 65%
Source: Trucking surveys data and own calculations.
In West and Central Africa, due to low traffic, low truck utilization and old fleet, even if
rehabilitation is limited to 50 kilometers of a road section in poor condition, the internal rate of return of
the project is not positive (taking into account only the vehicle operating costs savings induced by road
rehabilitation). On the contrary, in East Africa, in almost all the cases, road rehabilitation is justified mainly
due to the fact that the minimal traffic along the Northern corridor (up to Kampala) is at least equal to 200
trucks per day. These tables therefore demonstrate that due the high cost of road improvement and the
relatively old fleets, roads rehabilitation on hundred of kilometers requires probably than 200 trucks per day
to be economically justified. Below such traffic, rehabilitation should probably take place when the road is
only in poor or very poor condition (and only if a large proportion of the reduction in VOCs is passed on to
the final user of transport services).
IV. Impact of cartels on transport prices and service quality
Much of the transport price burden in Africa has to do with the overall political economy of freight
logistics which exacerbates the problems in trade and transport facilitation found in the rest of the world21.
Competition in the trucking industry is a prerequisite for lower transport prices. For decades, trucking
operators from landlocked countries, especially in West and Central Africa, have benefited from strong
formal and informal protection (see Annex 1). The result was to be expected: high transport prices and low
20 Assumptions are the following: savings are constant for 20 years for a 1,000 kilometer corridor, yearly trafficgrowth of 3 percent, rehabilitation costs are estimated to 0.5 million USD per kilometer, road maintenance costs areexcluded and savings are discounted. We only take into account trucks traffic.21 In Africa, due to the thinness of some markets, the existence of cartels is easier than in Asia or Europe. However,market thinness does not necessarily induce the existence of cartels, like it is demonstrated in the case of Rwanda.

14
quality. The low level of truck utilization in some SSA sub-regions is due to oversupply of transport
capacity resulting from the freight allocation and queuing systems. The two main strategies that operators
undertake to mitigate the low truck utilization in the SSA regulated environment are the use of second-hand
trucks and overloading the trucks.
Trade logistics is a fertile ground for rent-seeking activities: corruption and protected inefficient
trucking services which in turn become a barrier to entry of modern operators. All these factors increase
fragmentation and inhibit the emergence of a seamless supply chains needed by importers and exporters.
Countries become trapped in vicious circles where inefficient regimes sustain low quality services (e.g.
transport, customs broking) and high transport prices.
Market entry through the licensing process is relatively easy. Indeed, trucking companies/truckers
do not identify the licensing process as one of the main constraints of the sector. Moreover, except in
Kenya/Uganda, licenses to operate internationally remain marginal expenses in total VOCs. The existence
of oversupply in many landlocked countries (see below) tends to demonstrate that market entry and credit
access to finance trucks are not a major constraint to market entry.
But the main regulatory issue concerns operational rules and market access restrictions mainly
through freight sharing schemes. The regulatory environment of inland countries in West and Central
Africa is centered on two main intertwined regulations/rules:
A transit bilateral treaty, which establishes quotas for the fleets of the coastal and inland countries.
A formal/informal practice of a queuing system (the “tour de rôle” 22 ) to allocate freight to
transporters, requiring the operator to be affiliated with a transporter association.
Even though the “tour de rôle” is perceived negative by most stakeholders in landlocked countries,
the bilateral quotas are backed in order to protect truckers from landlocked countries. In fact, in many
countries in West and Central Africa, authorities have tried to tackle the “tour de rôle” and to declare this
system unlawful. However, these attempts have never been really successful mainly due to the fact that the
legal basis for restrictive practices remains through the quotas (see Annex 2).
This system and rule lead to poor quality of service and to low productivity, with no incentives to improveefficiency23.
While bilateral freight allocation protects the trucking industry of landlocked countries, it “de
facto” creates cartels and slows down market and regional integration. Furthermore, the operators so
protected often do not meet regulatory requirements, such as having enough transport capacity. For
instance, Nigerien fleet is not appropriate to handle freight peaks and for various reasons, Nigerien fleet is
less competitive than coastal countries’ fleet.
22 Contrary to bilateral quotas, the “tour de rôle” has no legal basis whatsoever.23 A landlocked country limiting access to its freight market for foreign companies self imposes higher transport prices onits trade because transport cannot be optimized due to a lack of backloads and transport operators charge at a higher priceone way assuming no backload.

15
In practice, authorities and trucking companies acknowledge that bilateral quotas are not enforced
as in the case of Niger. Adoléhoumé (2007) gives the figure of 36 percent for the market share of the
Nigerien fleet on the Togolese corridor for the first six months in 2007 whereas it should be in theory 2/3
and the same figures are given for CAR and Cameroon. On the ground, landlocked countries’ fleets do not
carry more than 50 percent of total traffic because of inadequate and uncompetitive fleet. Adoléhoumé
estimated that the Nigerien fleet of articulated trucks is, on average, 29 years old and its operating costs per
vehicle-kilometer are some 30 percent higher than the Beninese and Togolese fleets. By forcing shippers to
use local fleet, they have to pay a surcharge (due to higher prices, lower quality or increased bribes if they
want to use their transporters), which is detrimental, rather than beneficial, to the interests of the landlocked
economy. The bilateral quota system is prone to strengthen bribes because the trucking association in
charge of enforcing quotas “sells” market shares/freight to truckers/trucking companies ready to pay the
highest bribe. This helps explain why bilateral quotas are not enforced. Further, in the case of Niger, the
trucking association frequently sells freight to non-Nigerien companies24. The trucking industry in SSA
faces various regulations such as market entry barriers, market access restrictions, technical regulations, and
customs regulations. However, market access restrictions through freight sharing schemes are probably the
most critical on the performance of the trucking industry. The current system favors the use of large fleets
with majority of aged trucks in poor condition. Further, it fosters corruption because the only way for a
transport operator to increase its volume of cargo is to bribe the freight bureaus (i.e., the government
entities charged with allocating freight among the various transport operators).
Direct contracting, that is, a medium or long-term contract between a shipper and a trucking
company, is one of the best signs of good logistics. However, direct contracting is almost inexistent in
Central Africa and limited in West Africa to some institutional shippers, which bypass the queuing system
(see Table 7). Stakeholders and representatives of transport associations usually agree that such contracts
are the only way to develop an efficient transport industry. That is why the importance of direct contracting
is an excellent proxy to assess the modernization, or the lack of it, of the trucking industry.
24 International own account transport is usually allocated to Beninese companies and due to the age of the fleet,shippers willing to overload prefer to use Beninese or Togolese fleet, which are younger.

16
Table 7: Main methods used by the trucking industry to get freight (percentage by sub-region)25
Throughindependent
freightagents
Throughpublic-privateinstitutions in
charge offreight
allocations
By phone/faxand through
contractsfrom
customers
By truckswaiting atlorry parksand findingtheir own
loads
Others
West Africa 42.7 21.0 16.2 1.9 18.2Central Africa 35.7 11.4 2.1 24.126 26.7
East Africa 12.7 20.7 27.3 5.1 34.2Southern Africa 12.5 1.1 16.4 0.8 69.2
Source: Trucking survey and own calculations. Data for Zambian fleet for Southern Africa.
Central and West Africa are clear examples of the negative effects of freight sharing schemes on
transport prices and quality. However, the freight allocation system is entrenched in these sub-regions and it
would not be easy to abolish it. In Niger, there has been a recent attempt to abolish the queuing system. A
recent government decree27 states that (i) the 2/3 and 1/3 rule to distribute traffic between local transport
companies and the maritime transport companies is still in effect, BUT (ii) all trucking operations within
the Nigerien 2/3 are open to total competition. Yet, a workshop organized by the government on the
Nigerien transport industry with all stakeholders to discuss the decree was boycotted by the trucking
association28.
Up to now, the decree is nothing more than a signal. Indeed, the “tour de rôle” never had any legal
ground and was designed by the Nigerien truckers to be imposed on themselves. Hence, its implementation
requires willingness from Nigerien trucker association representatives. But, the queuing system can
continue to be in place as long as transport associations have leverage thanks to the bilateral transit
agreement, which gives them the power to avoid direct contracting between the shipper and the transporter.
V- An econometric analysis
Table 8 presents the results of regressions in order to strive to explain the margins of transport
companies and truckers along the main international corridors in Africa. We selected several exogenous
variables and excluded to explain transport costs due because of endogenous problems between many
25 To note that it is difficult to capture in trucking surveys the exact role of freight bureaus, which appears frominterviews to be more important than from surveys due to the fact that truckers with old fleets benefit from the currentsystem.26 This figure as well as through independent agents can be added to the figure through freight allocation bureaus.Indeed, agents “negotiate” with freight bureaus and truckers waiting at lorry parks depend on paperwork issued by thefreight bureau.27 Ministerial decree number. 09/MT/DTT-MF of February 2007.28 Some companies attempt to enter the market without being part of a trucking association and of the queuing systembut usually on very limited niches.
17
variables such as fixed costs, variables costs and even mileage and the possible dependant variable. The
econometric is especially relevant to demonstrate how can be the impact of good road condition on the
profitability of the industry. Using previous tables (such as Table 4), trucking along international corridors
seems to be a rather profitable industry for most companies in Africa29.
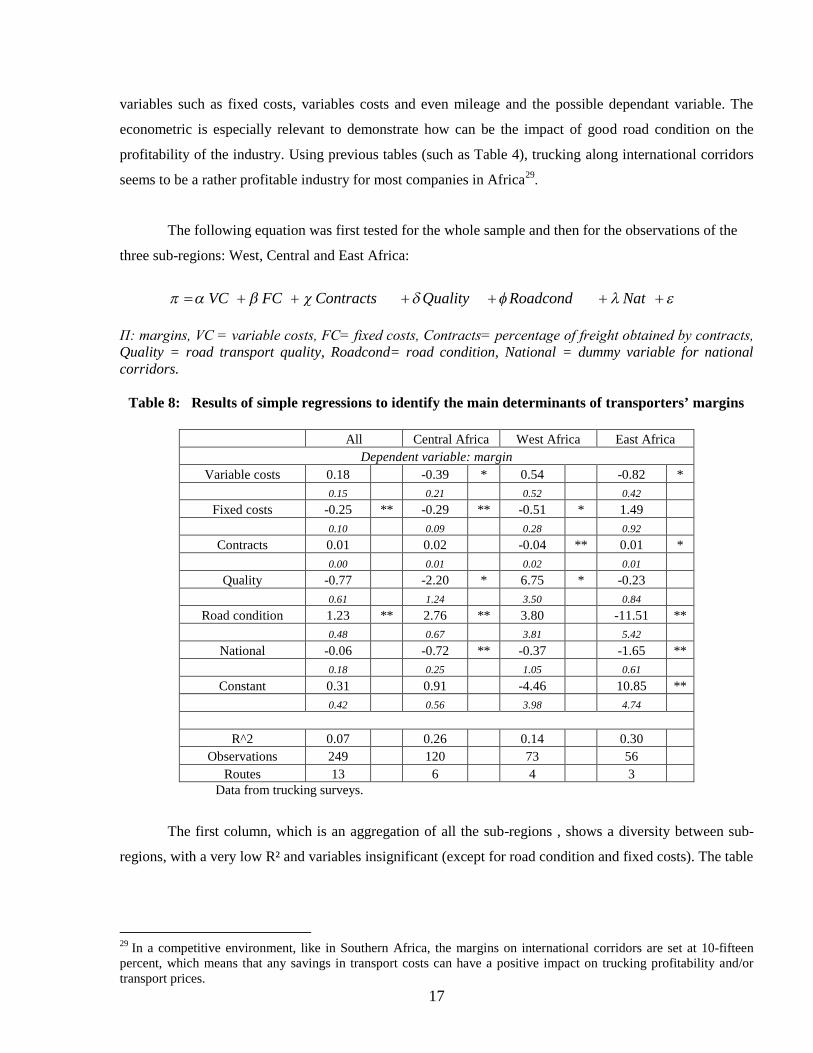
The following equation was first tested for the whole sample and then for the observations of the
three sub-regions: West, Central and East Africa:
NatRoadcondQualityContractsFCVC
Π: margins, VC = variable costs, FC= fixed costs, Contracts= percentage of freight obtained by contracts, Quality = road transport quality, Roadcond= road condition, National = dummy variable for nationalcorridors.
Table 8: Results of simple regressions to identify the main determinants of transporters’ margins
All Central Africa West Africa East AfricaDependent variable: margin
Variable costs 0.18 -0.39 * 0.54 -0.82 *0.15 0.21 0.52 0.42
Fixed costs -0.25 ** -0.29 ** -0.51 * 1.490.10 0.09 0.28 0.92
Contracts 0.01 0.02 -0.04 ** 0.01 *0.00 0.01 0.02 0.01
Quality -0.77 -2.20 * 6.75 * -0.230.61 1.24 3.50 0.84
Road condition 1.23 ** 2.76 ** 3.80 -11.51 **0.48 0.67 3.81 5.42
National -0.06 -0.72 ** -0.37 -1.65 **0.18 0.25 1.05 0.61
Constant 0.31 0.91 -4.46 10.85 **0.42 0.56 3.98 4.74
R^2 0.07 0.26 0.14 0.30Observations 249 120 73 56
Routes 13 6 4 3Data from trucking surveys.
The first column, which is an aggregation of all the sub-regions , shows a diversity between sub-
regions, with a very low R² and variables insignificant (except for road condition and fixed costs). The table
29 In a competitive environment, like in Southern Africa, the margins on international corridors are set at 10-fifteenpercent, which means that any savings in transport costs can have a positive impact on trucking profitability and/ortransport prices.

18
confirms that there is a disconnect between costs and prices30 since costs never explain margins, except
fixed costs for Central Africa. We can then demonstrate that since prices settings are more or less
exogenous, the most profitable companies in Africa are the ones able to operate on routes with abnormal
prices or the ones with a certain degree of costs efficiency. That is why, in East Africa, trucks operating on
roads in good condition are able to increase substantially their profits (probably due to the fact that
companies charge similar rates despite lower costs). It is even more pronounced for international corridors.
In Central Africa, higher fixed costs induce lower margins.
In Central Africa, higher profits are reported for roads in better condition. Once again, it is most
probably due to informal market sharing agreements. Central Africa seems to be the sub-region where
informal regulation is the strongest and where incentives to invest are the lowest. Indeed, higher transport
quality (which depends in investment in human resources, equipment) induces lower margins.
Results for West Africa demonstrate that strategies of companies seem probably to differ more than
in Central Africa because no variables seem really to explain margins, except the share of contracts
(marginally). It is worth noting that companies, which operate with direct contracting have lower margins.
East African companies demonstrate what donors expect when they support road rehabilitation.
Indeed, better road condition implies much lower transport margins, probably due to the fact that
competition operates in East Africa when road is rehabilitated and we also pointed out that bilateral transit
treaties with quotas do not exist in this sub-region. Even though the situation may not completely be
adequate since international routes remain more profitable than national routes31, nevertheless, it does
confirm that investment in roads is economically viable in East Africa.
VI. Conclusions
In general, the key findings are:
a) There are substantial disconnect between transport costs and prices in numerous African
countries, e.g. transport costs in Africa are not abnormally high, but transport prices are high
along some corridors, indicating a strong seller’s market.
b) Despite many poor efficiency factors (low yearly vehicle utilization rates, aging vehicle fleet,
unbalanced trade, etc.), trucking companies in Africa can still charge high price, and have
relatively large profit margin along some corridors.
30 Prices are inflated through the whole logistics chain. In a regulated environment, even though profits from freightforwarders may be lower, this activity remains largely profitable. Any overhead or abnormal payment is automaticallyincluded in the price for the final user. Moreover, integrated services, which includes shipping lines activities, portoperations, logistics platforms operations, freight forwarding and sometimes rail concession usually give a betterquality of services but considerably inflate prices on several segments of transport, such as port operations or logisticsplatforms and these global operators frequently prevent other operators to increase their market share and use theirmarket power to keep prices at very high level.31 It is explained by the importance of delays on the road on the Northern Corridor (see Teravaninthorn and Raballand2008).
19
c) Market regulation is an eminent price determinant hindering the efficiency improvement of the
trucking industry, lacking competitiveness and thus high transport price in Africa.
d) Poor condition of road infrastructure might not necessarily be the most critical factor for high
transport costs.
The formulation of policy recommendations needs to distinguish between regulated and more
mature market environment. In a competitive environment with high traffic volumes, measures to improve
road condition and limit fuel prices are likely to yield significant results. In such environment, measures
aimed at reducing delays at the border or at weighbridges would also be useful as they would help increase
truck utilization.
In a regulated environment, like in West and Central Africa, regulatory constraints (formal and
informal) must be dismantled because they are the root cause of limited competition, poor service and high
transport prices32.
32 See Annex 4 for the worldwide experience of trucking services liberalization.

20
References
Adoléhoumé, A. (2007), “Analyse des Facteurs de Coûts et Prix de Transport en Afrique de l’Ouest: Cas du
Niger”, mimeo.
Amjadi A., and Yeats A. J. (1995), “Have Transport Costs Contributed to the Relative Decline of Sub-
Saharan African Exports”, World Bank Policy Research Working Paper No. 1559, The World Bank,
Washington, DC.
Arvis, J.F., Raballand, G. and Marteau, J.F. (2007), “The Cost of Being Landlocked: Logistics Costs and
Supply Chain Reliability”, World Bank Policy Research Working Paper No. 4258, The World Bank,
Washington, DC.
Limao N. and Venables A.J. (2001), “Infrastructure, Geographical Disadvantage and Transport Costs”,
World Bank Economic Review Vol 15, No. 3, pp. 451-479, The World Bank, Washington, DC.
Mackellar L., Wörgötter A. and Wörz J. (2002), “Economic Growth of Landlocked Countries”, in
Chaloupek, G., Guger, A., Nowotny, E. and Schwödiauer, G., Ökonomie in Theorie und Praxis, Springer,
Berlin, pp. 213-226.
Oyer, S. (2007), “Freight Rates Determinants along the Northern Corridor Road”, M.Sc Thesis, Nairobi
UNES, mimeo.
Rizet, C. and Hine, J. (1993), “A Comparison of the Costs and Productivity of Road Freight Transport in
Africa and Pakistan”, Transport Reviews Vol 13, No. 2.
Rizet, C. and Gwet, H. (1998), “Transport de Marchandises: Une Comparaison Internationale des Prix du
Camionnage. Afrique, Asie du Sud Est, Amérique Centrale”.
Souley, H. (2001), “Dérèglementation du Transport Routier de Marchandises au Niger et Intégration Sous-
Régionale”, PhD Thesis, Paris : INRETS.
Teravaninthorn, S. and Raballand, G.(2008).Transport prices and cost in Africa: A review of the Main
International Corridors. World Bank: Washington D.C.

21
Annex 1: Main regulatory barriers in SSA
West Africa Central Africa East Africa Southern AfricaMarket entry
LicensesNot restrictive(especially fornationals)
Not restrictive(especially fornationals)
Not restrictive(especially fornationals)
Not restrictive
Market accessBilateralagreement Yes Yes No Yes
Quotas/freightallocation Yes Yes No No
Queuing system Yes Yes No NoThird countryrule33 Prohibited Prohibited Prohibited Allowed in some
countries34
Technicalregulation (roaduser charges, axle-load, vehiclestandard, importrestriction)
Problem ofharmonization ofaxle-loadregulation
Problem ofharmonization ofaxle-loadenforcement
Problem ofharmonization ofaxle-load regulation,delays atweighbridges
Prohibition ofsecond-handimports in SouthAfrica
Customsregulation
Cumbersometransitproceduresinducing border-crossing delays
Cumbersometransit proceduresinducing border-crossing delays
1. Prohibition fortrailers in transit topick-up backloads inKenya2. Cumbersometransit proceduresinducing border-crossing delays
Cumbersometransit proceduresinducing border-crossing delays
Source: Study team compilation of data from various sources.
33 The third country rule allows operation of trucks registered in a third party country to transport goods between twoother countries.34 South Africa, Zimbabwe (on a reciprocal basis) and Malawi (during a defined period of time).

22
Annex 2: The queuing system or “tour de rôle”35
The queuing system finds its origins in the inland water shipping in France. Established in 1936, it
was codified by the law of March 22, 1941. It became applied to the road transport sector after the
establishment of the regional freight bureaus (BRF) in 1961. Freight bureaus receive transportation requests
made by shippers. After having centralized them regionally, a list of vessels is assigned chronologically to
the various transportation demands mainly depending on the arrival time of availability registration in the
office of the freight bureau.
The queuing system was set up by a decree of July 28, 1965 to “ensure the proper functioning of
the freight transportation market and allow transport coordination”. The BRF replaced cafes, which had
been used to “coordinate” supply/demand of in transport. The role of BRF36 was to organize the adequacy
between supply and demand of the transport market. Each carrier had to be registered on arrival at the BRF.
He then received a priority order that will be used to decide if more carriers would claim the same freight.
When BRF received a demand for transportation, which had always to come from transport broker,
it was displayed on a blackboard with key information (tonnage, destination, type of goods, etc.). If a carrier
was interested in fulfilling this demand, an announcement was made in the office. If no one claimed the
same freight, the batch had to be assigned to the carrier that had expressed the willingness to carry the
goods. But, if claimed by another carrier, the first registered to the freight will get the load and two vehicles
from the same carrier could not be loaded without leaving a minimum delay. This was established in order
to avoid large companies to capture the BRF.
But, what was the impact of such system? The BRF became increasingly responsible for delays and
poor transport quality. Indeed, carriers tended to become complacent to look for freight demand and
competition became inexistent, which at the end undermined transportation service quality. It did not lead
to an optimal distribution of traffic, does not give an incentive to provide a better service and enable
oversupply of trucks in a context of freight shortage. Indeed, any truck was guaranteed to transport some
freight even though it was not competitive. If oversupply was locally very high, a trucker was obliged to
stop his truck for a month or even more. That is also why he did not have any incentive to invest in a new
truck, which would have increased fixed costs with a high risk for future revenues. This system then gave
more power to large fleet in poor condition and fostered corruption because the only way to increase
transported volumes was to bribe the freight bureau.
35 Based on Souley (2001).36 France was divided into 19 regions. A national center, CNBRF, coordinated the work of the regional BRF.

23
Annex 3: Truck operating costs - a comparison of the four corridors
Notes:1. These values include trucking services (three or more trucks) and truckers (one or two trucks). We are reportingthe destination city and country in parenthesis.2. Average yearly mileage (in thousands) is calculated distance time number of turnaround per year.3. Standard deviation in parenthesis.
Sources: Trucking surveys data and own calculations. Exchange rates come from IMF-IFS.
Corridor RouteGateway-Destination
Variablecost(USD /km)
Fixed cost(USD /day)
YearlyratioFC/VC
Averagetruck fleetage
Tema/Accra - Ouagadougou(Burkina Faso)
1.51(0.59)
30(16) 10% - 89% 13West Africa
(Burkinaand Ghana) Tema/Accra - Bamako (Mali) 1.67
(0.23)36
(23) 10% - 89% 9
Douala - N’Djaména (Chad) 1.31(0.34)
49(30) 17% - 82% 11
Douala - Bangui (CAR) 1.22(0.34)
73(43) 25% - 74% 9
Ngaounderé -N’Djaména(Chad)
1.83(0.27)
22(8) 7% - 92% 15
CentralAfrica(Cameroonand Chad)
Ngaoundéré - Moundou(Chad)
2.49(0.64)
21(6) 5% - 94% 19
Mombasa - Kampala(Uganda)
0.98(0.46)
61(30) 68% - 31% 7East Africa
(Uganda andKenya) Kampala - Kigali (Rwanda) 1.47
(0.84)40
(30) 56% - 43% 10
Lusaka - Johannesburg(South Africa)
1.54(0.41)
55(39) 61%-38% 9Southern
Africa(Zambia) Lusaka - Dar-es-Salaam
(Tanzania)1.34
(0.52)71
(54) 75%-24% 10

24
Annex 4: International experiences in transport services liberalization
Country Main achievements BackgroundCzech Republic,Hungary, Poland
- entry of many new operators- prices determined by market- innovative logistics services
Major reform in 1998-90. Road freighttransport was one of the first sectors tobe privatized and liberalized in Centraland Eastern European Countries
France - dramatic reduction in transport prices Major reform in 1986. Some 10 yearsafter deregulation, overall pricesincreased by ha 40 percent, transportprices fell by over 10 percent
Indonesia - entry of many new operators- prices set by the market- most trucking companies are small
Major reform in 1985. Vehicles requiredto obtain licenses to cross provincialboundaries, but no major impact
Mexico - entry of many new operators- trucking prices dropped by 23 percentin real terms within five years- trucking services improved infrequency, access and speed of delivery
Major reform happened in 1989. Thederegulation process was gradual over aperiod of two years
Morocco - transport prices dropped dramatically- abolition of government monopoly offreight allocation
Freight allocation abolished in 2003.Large initial large oversupply was notreduced and led to atomized and lowquality of service but prices werereduced
Rwanda - transport prices fell by 75% in realterms- rapid recovery of locally-owned fleet
Major reform in 1994, after the genocide,when the public trucking fleet hadpractically vanished
Source: Task team compilation.
25
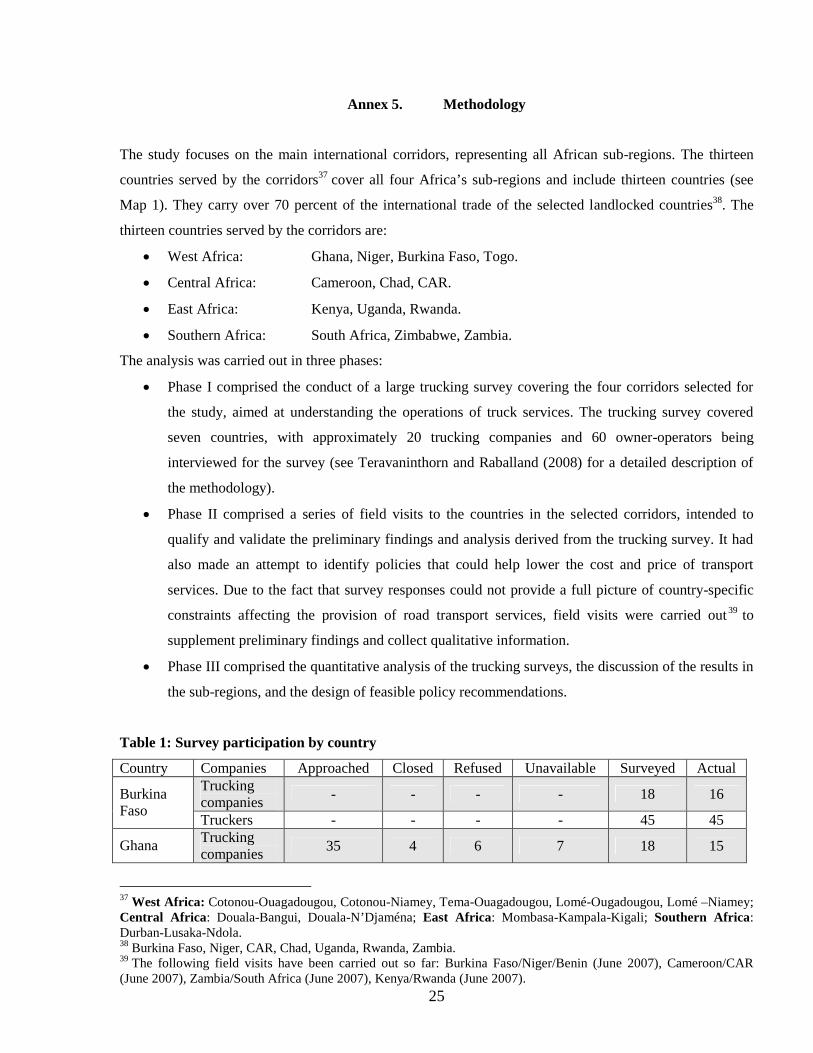
Annex 5. Methodology
The study focuses on the main international corridors, representing all African sub-regions. The thirteen
countries served by the corridors37 cover all four Africa’s sub-regions and include thirteen countries (see
Map 1). They carry over 70 percent of the international trade of the selected landlocked countries38. The
thirteen countries served by the corridors are:
West Africa: Ghana, Niger, Burkina Faso, Togo.
Central Africa: Cameroon, Chad, CAR.
East Africa: Kenya, Uganda, Rwanda.
Southern Africa: South Africa, Zimbabwe, Zambia.
The analysis was carried out in three phases:
Phase I comprised the conduct of a large trucking survey covering the four corridors selected for
the study, aimed at understanding the operations of truck services. The trucking survey covered
seven countries, with approximately 20 trucking companies and 60 owner-operators being
interviewed for the survey (see Teravaninthorn and Raballand (2008) for a detailed description of
the methodology).
Phase II comprised a series of field visits to the countries in the selected corridors, intended to
qualify and validate the preliminary findings and analysis derived from the trucking survey. It had
also made an attempt to identify policies that could help lower the cost and price of transport
services. Due to the fact that survey responses could not provide a full picture of country-specific
constraints affecting the provision of road transport services, field visits were carried out 39 to
supplement preliminary findings and collect qualitative information.
Phase III comprised the quantitative analysis of the trucking surveys, the discussion of the results in
the sub-regions, and the design of feasible policy recommendations.
Table 1: Survey participation by country
Country Companies Approached Closed Refused Unavailable Surveyed ActualTruckingcompanies - - - - 18 16Burkina
FasoTruckers - - - - 45 45
Ghana Truckingcompanies 35 4 6 7 18 15
37 West Africa: Cotonou-Ouagadougou, Cotonou-Niamey, Tema-Ouagadougou, Lomé-Ougadougou, Lomé –Niamey;Central Africa: Douala-Bangui, Douala-N’Djaména; East Africa: Mombasa-Kampala-Kigali; Southern Africa:Durban-Lusaka-Ndola.38 Burkina Faso, Niger, CAR, Chad, Uganda, Rwanda, Zambia.39 The following field visits have been carried out so far: Burkina Faso/Niger/Benin (June 2007), Cameroon/CAR(June 2007), Zambia/South Africa (June 2007), Kenya/Rwanda (June 2007).
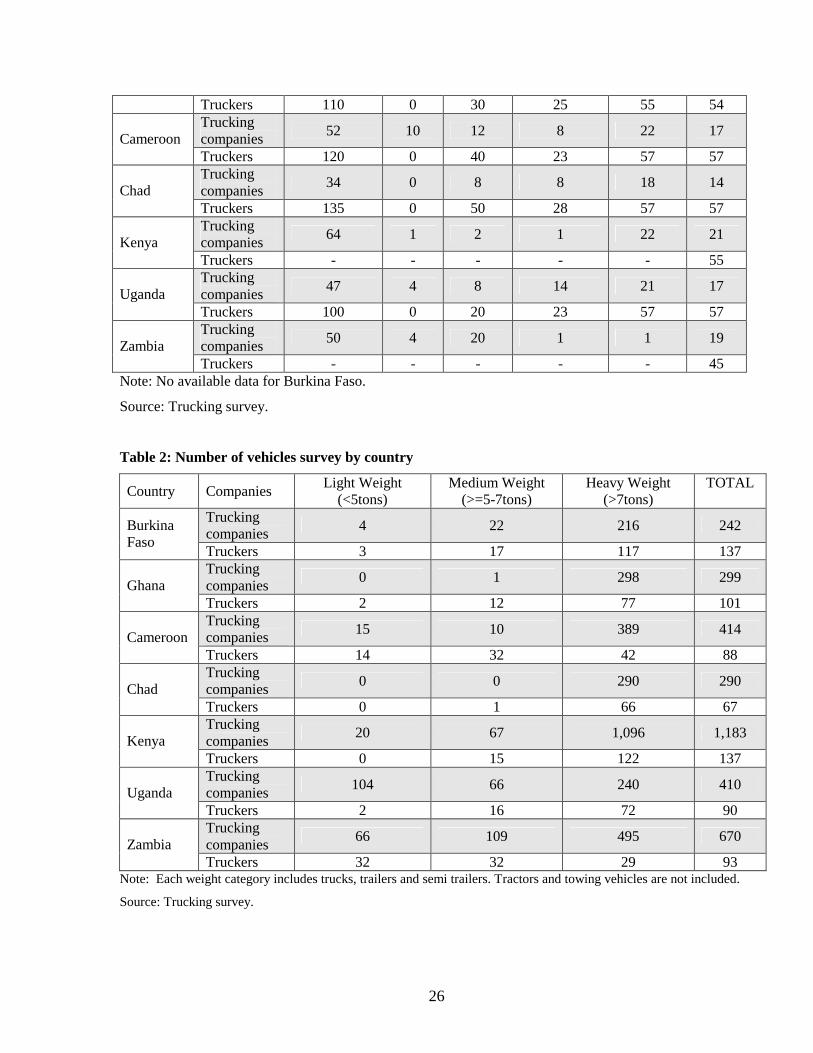
26
Truckers 110 0 30 25 55 54Truckingcompanies 52 10 12 8 22 17CameroonTruckers 120 0 40 23 57 57Truckingcompanies 34 0 8 8 18 14ChadTruckers 135 0 50 28 57 57Truckingcompanies 64 1 2 1 22 21KenyaTruckers - - - - - 55Truckingcompanies 47 4 8 14 21 17UgandaTruckers 100 0 20 23 57 57Truckingcompanies 50 4 20 1 1 19ZambiaTruckers - - - - - 45
Note: No available data for Burkina Faso.
Source: Trucking survey.
Table 2: Number of vehicles survey by country
Country Companies Light Weight(<5tons)
Medium Weight(>=5-7tons)
Heavy Weight(>7tons)
TOTAL
Truckingcompanies 4 22 216 242Burkina
FasoTruckers 3 17 117 137Truckingcompanies 0 1 298 299GhanaTruckers 2 12 77 101Truckingcompanies 15 10 389 414CameroonTruckers 14 32 42 88Truckingcompanies 0 0 290 290ChadTruckers 0 1 66 67Truckingcompanies 20 67 1,096 1,183KenyaTruckers 0 15 122 137Truckingcompanies 104 66 240 410UgandaTruckers 2 16 72 90Truckingcompanies 66 109 495 670ZambiaTruckers 32 32 29 93
Note: Each weight category includes trucks, trailers and semi trailers. Tractors and towing vehicles are not included.
Source: Trucking survey.