transport of snow by the wind: a comparison between observations in adélie land, antarctica, and...
TRANSCRIPT
Boundary-Layer Meteorol (2013) 146:133–147DOI 10.1007/s10546-012-9764-z
ARTICLE
Transport of Snow by the Wind: A Comparison BetweenObservations in Adélie Land, Antarctica, and SimulationsMade with the Regional Climate Model MAR
Hubert Gallée · Alexandre Trouvilliez · Cécile Agosta ·Christophe Genthon · Vincent Favier · Florence Naaim-Bouvet
Received: 17 June 2011 / Accepted: 7 August 2012 / Published online: 18 September 2012© Springer Science+Business Media B.V. 2012
Abstract For the first time a simulation of blowing snow events was validated in detailusing one-month long observations (January 2010) made in Adélie Land, Antarctica.A regional climate model featuring a coupled atmosphere/blowing snow/snowpack modelis forced laterally by meteorological re-analyses. The vertical grid spacing was 2 m from 2to 20 m above the surface and the horizontal grid spacing was 5 km. The simulation wasvalidated by comparing the occurrence of blowing snow events and other meteorologicalparameters at two automatic weather stations. The Nash test allowed us to compute effi-ciencies of the simulation. The regional climate model simulated the observed wind speedwith a positive efficiency (0.69). Wind speeds higher than 12 m s−1 were underestimated.Positive efficiency of the simulated wind speed was a prerequisite for validating the blowingsnow model. Temperatures were simulated with a slightly negative efficiency (−0.16) due tooverestimation of the amplitude of the diurnal cycle during one week, probably because thecloud cover was underestimated at that location during the period concerned. Snowfall eventswere correctly simulated by our model, as confirmed by field reports. Because observationssuggested that our instrument (an acoustic sounder) tends to overestimate the blowing snowflux, data were not sufficiently accurate to allow the complete validation of snow drift val-ues. However, the simulation of blowing snow occurrence was in good agreement with theobservations made during the first 20 days of January 2010, despite the fact that the blowingsnow flux may be underestimated by the regional climate model during pure blowing snowevents. We found that blowing snow occurs in Adélie Land only when the 30-min wind speedvalue at 2 m a.g.l. is >10 m s−1. The validation for the last 10 days of January 2010 was lesssatisfactory because of complications introduced by surface melting and refreezing.
H. Gallée (B) · A. Trouvilliez · C. Agosta · C. Genthon · V. FavierUJF–Grenoble 1 / CNRS, Laboratoire de Glaciologie et Géophysique de l’Environnement (LGGE) UMR5183, 38041 Grenoble, Francee-mail: [email protected]
A. Trouvilliez · F. Naaim-BouvetIRSTEA, UR ETGR Erosion Torrentielle Neige Avalanches, Domaine universitaire,2, rue de la Papeterie, 38402 Saint-Martin-d’Hères, France
123
134 H. Gallée et al.
Keywords Antarctica · Blowing snow · Regional climate model · Surface mass balance
1 Introduction
The surface mass balance (SMB) of the Antarctic ice sheet is probably the only importantnegative contribution to sea-level rise (Solomon et al. 2007). Its main components are snowprecipitation, snow net erosion/deposition by the wind, and surface sublimation of snow orice. Runoff is caused by snow/ice melting but, except for the Antarctic peninsula, its influenceon the Antarctic ice sheet can be considered as negligible. Net erosion of snow by the windmay contribute significantly to the SMB of the Antarctic coastal zone. Up to 35 % of snowprecipitation may be removed by the wind and deposited elsewhere or sublimated in coastalareas (Bromwich 1988), and to an even greater extent over blue ice. This may be due to thefact that the surface winds along the Antarctic coast are among the strongest observed at sealevel worldwide (Parish 1988).
Here we define the margin of the Antarctic ice sheet as that part of the ice sheet whosesurface elevations are lower than 1,000 m above sea level (a.s.l.). This area can contributeroughly 50 % of the SMB and as the winds there are strong, accurate assessment of snowerosion by the wind is needed. This can be achieved either by detailed observations or byusing specially designed climate models. Observations of blowing snow in Antarctica arerare for logistical reasons (Budd et al. 1965; Takahashi 1985; Mellor and Fellers 1986; Mannet al. 2000; Bintanja 2001; Scarchilli et al. 2010; König-Langlo and Loose 2007). A carefullyvalidated model plus available observations is thus a good candidate for such an exercise.The present work is motivated by the fact that previous modelling studies pointed to theneed for observations to validate parametrization of the blowing snow process in the extremeAntarctic environment (e.g., Gallée et al. 2001).
The combination of atmospheric dynamics, blowing snow physics and the surface of thesloping coastal area of the Antarctic ice sheet may be influenced by several physical feed-backs. Kodama et al. (1985) discussed three types of feedback (among others): (i) surfaceroughness, which reduces the wind speed and the resulting erosion of the snow by the wind,(ii) an increase in air density due to the presence of airborne snow particles, and (iii) anincrease in air density by cooling due to the sublimation of airborne snow particles.
First, it should be noted that the erosion of snow by the wind is responsible for changes insurface roughness through the formation of obstacles such as sastrugis, barcans, and megad-unes. In turn, surface roughness is responsible for a decrease in the kinetic energy availablefor snow erosion, and is a negative feedback. On the other hand, the ejection of snow parti-cles from the surface may be facilitated by the saltation process (Male 1980). It should alsobe noted that megadunes can generate gravity waves that modulate the surface wind speed(Frezzotti et al. 2002).
Second, the increase in air density is responsible for an increase in the along-slope pressuregradient force, and is a positive feedback in katabatic flows. A preliminary discussion of theimpact of this feedback in a limited area atmospheric model is given in Gallée (1998).Such an impact is only significant with very strong winds (wind speeds >28 m s−1, Gosink1989).
Wamser and Lykossov (1995) and Bintanja (1998) identified the influence of airbornesnow particles on the vertical stability of the lower atmosphere. Indeed an increase in theconcentration of airborne snow particles near the surface may decrease turbulence in thesurface boundary layer (SBL). This process contributes negatively to snow erosion.
123
A Comparison Between Observations in Adélie Land, Antarctica 135
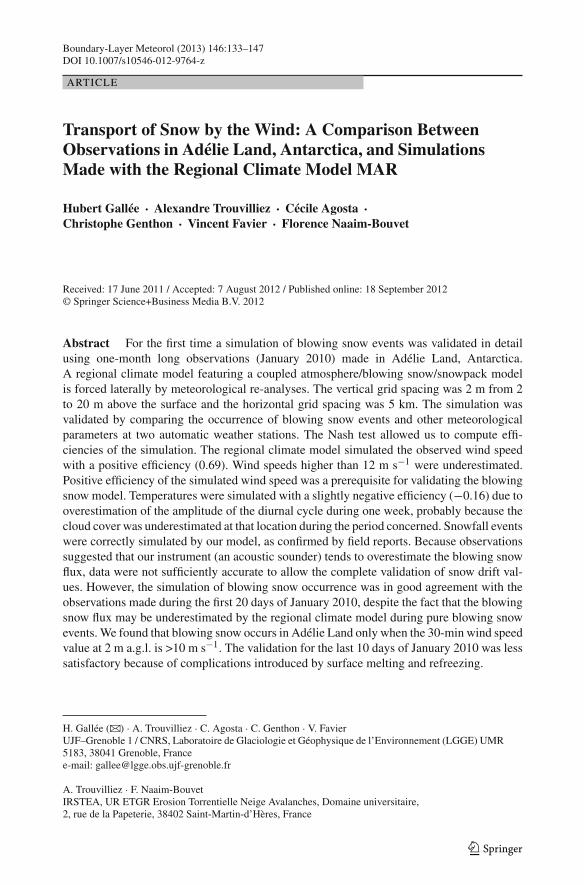
Fig. 1 MAR integration domain. Isocontours in the bottom panel are at 200-m intervals
Blowing snow may be very difficult to model because of its highly non-linear behaviour,and this is all the more true when case events are considered, in particular their timing andintensity. In turn, detailed modelling may provide physical insight into the relevant processesand possible changes in their respective importance. Such knowledge is crucial in the contextof climate changes.
The objective of the work reported herein is thus to increase our understanding of thecoupling of snow accumulation processes and atmospheric dynamics over the surface of ahuge ice sheet. This type of coupling is strongly influenced by the wind erosion of snow,at least over the margin of the ice sheet. Our work will enable the development of simplercoupling schemes in the future, and ultimately their use in SMB studies with regional climatemodels (RCMs) or general circulation models (GCMs).
The Modèle Atmosphérique Régional (MAR) is a coupled atmosphere—blowing snow—snowpack model. It has already been used to study blowing snow in the Antarctic by analyzingthe sensitivity of snow net erosion to the representation of snow properties (dendricity, sphe-ricity, size and density, Gallée et al. 2001). A long-term simulation of the SMB of WilkesLand has also been performed, and showed that results were improved when the net erosionof snow by the wind was taken into account (Gallée et al. 2005).
Adélie Land (Fig. 1) is probably an ideal location for observations of blowing snow, as theterrain is relatively homogeneous, allowing the development of the katabatic wind system andassociated turbulence at relatively large horizontal scales. Adélie Land is also strongly influ-enced by synoptic weather systems. Together, these represent an almost complete sample ofmeteorological situations typical of the Antarctic ice sheet margin. In addition, atmosphericsoundings are recorded daily at the French Dumont d’Urville station in Adélie Land, and areincluded in the meteorological analyses. As a result, good quality meteorological analysescan be generated, providing a good forcing for the RCMs used to validate parametrizations
123
136 H. Gallée et al.
of blowing snow from observations made in the area. Finally our RCM MAR has alreadybeen validated over Adélie Land (Gallée et al. 1996; Gallée and Pettré 1998).
The observations of blowing snow events in this study were made in Adélie Land in Jan-uary 2010. Our aim here is to validate the simulation of the atmospheric flow that drivesblowing snow events and then their timing. Blowing snow erosion by the wind is a highlynon-linear process, so it is important to simulate the timing of its occurrence for the rightreasons. This is why we use our RCM here with a high horizontal and vertical resolution.Nevertheless the issues raised concerning the accuracy of the Ingénierie Acoustique & Vi-bratoire (IAV) FlowCapt acoustic sensors (Chritin et al. 1999) used in the present study have,up to now, prevented a reliable quantitative comparison of the blowing snow flux (Ciercoet al. 2007; Naaim-Bouvet et al. 2010).
The paper is divided into five sections: Sect. 2 is a short description of the observationsmade, and a description of the coupled atmosphere—blowing snow—snowpack model isgiven in Sect. 3. The model is validated by comparing observations of wind speed, tempera-ture, and the occurrence of airborne snow particles in Sect. 4. Conclusions are given in Sect. 5.
2 Observations
The observational dataset was obtained from a monitoring system deployed in Adélie Land,one of the windiest areas in Antarctica. Blowing snow was evaluated in the field in early 2009using IAV FlowCapt acoustic sensors (Chritin et al. 1999). Although a longer record exists,we chose to concentrate on the data obtained in January 2010 when operators were present inthe field who could check that all instruments were functioning correctly and could visuallyconfirm the occurrence of meteorological events.
Issues have been raised about the accuracy and reliability of FlowCapt data in terms ofsnow fluxes. The calibration of FlowCapt results in overestimation of the blowing snow fluxthat is all the larger due to the high wind speed (Cierco et al. 2007; Naaim-Bouvet et al. 2010).As the winds responsible for the transport of blowing snow are very strong in Antarctica,considerable overestimation of the blowing snow flux can be expected. For this reason, wedecided to check the model in terms of general meteorology and the occurrence of blowingsnow events and to leave aside the evaluation of blowing snow fluxes. However, observedfluxes could provide qualitative information about the intensity of the events and new instru-ments are currently being tested to enable the evaluation of simulated blowing snow fluxesin the future.
2.1 Site Description
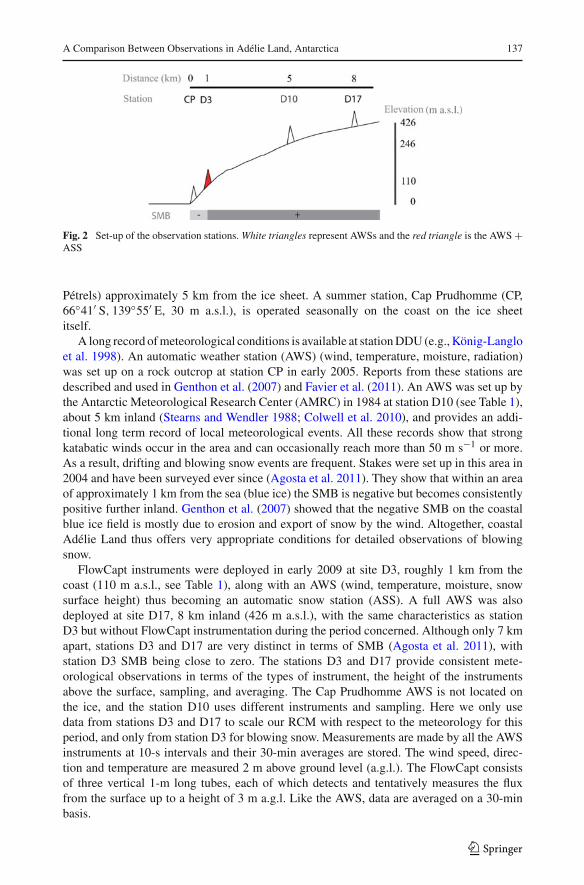
The experimental set-up is described in Table 1 and Fig. 2. The permanent Frenchcoastal Antarctic station named DDU (Dumont d’Urville) is located on an island (Ile des
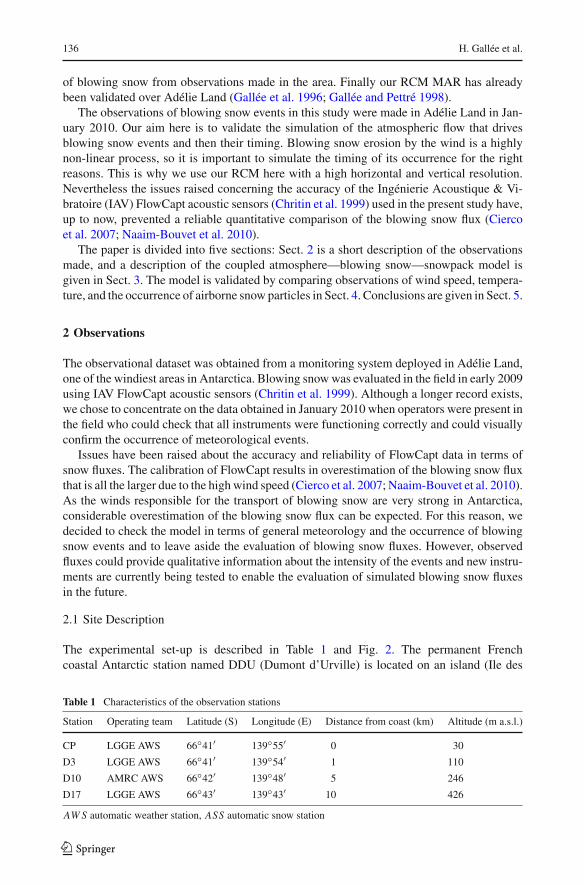
Table 1 Characteristics of the observation stations
Station Operating team Latitude (S) Longitude (E) Distance from coast (km) Altitude (m a.s.l.)
CP LGGE AWS 66◦41′ 139◦55′ 0 30
D3 LGGE AWS 66◦41′ 139◦54′ 1 110
D10 AMRC AWS 66◦42′ 139◦48′ 5 246
D17 LGGE AWS 66◦43′ 139◦43′ 10 426
AW S automatic weather station, ASS automatic snow station
123
A Comparison Between Observations in Adélie Land, Antarctica 137
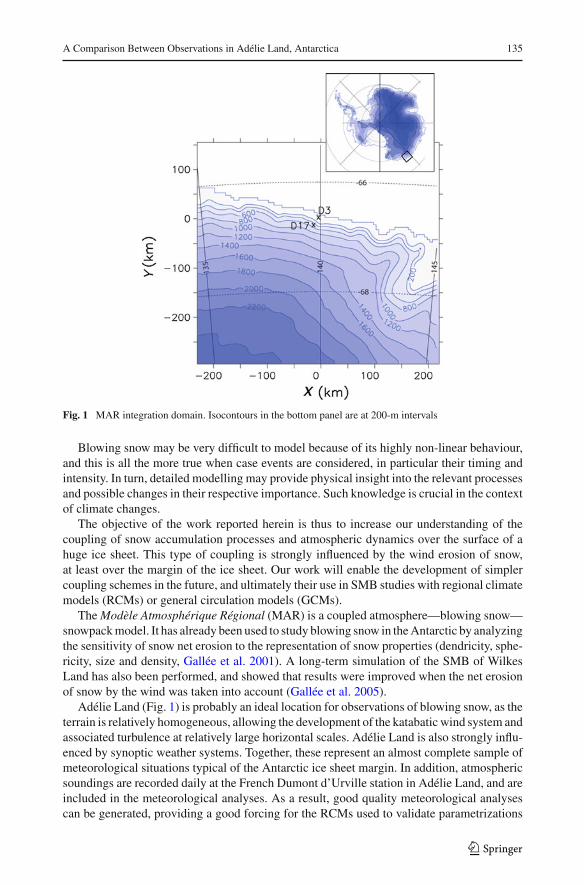
Fig. 2 Set-up of the observation stations. White triangles represent AWSs and the red triangle is the AWS +ASS
Pétrels) approximately 5 km from the ice sheet. A summer station, Cap Prudhomme (CP,66◦41′ S, 139◦55′ E, 30 m a.s.l.), is operated seasonally on the coast on the ice sheetitself.
A long record of meteorological conditions is available at station DDU (e.g., König-Langloet al. 1998). An automatic weather station (AWS) (wind, temperature, moisture, radiation)was set up on a rock outcrop at station CP in early 2005. Reports from these stations aredescribed and used in Genthon et al. (2007) and Favier et al. (2011). An AWS was set up bythe Antarctic Meteorological Research Center (AMRC) in 1984 at station D10 (see Table 1),about 5 km inland (Stearns and Wendler 1988; Colwell et al. 2010), and provides an addi-tional long term record of local meteorological events. All these records show that strongkatabatic winds occur in the area and can occasionally reach more than 50 m s−1 or more.As a result, drifting and blowing snow events are frequent. Stakes were set up in this area in2004 and have been surveyed ever since (Agosta et al. 2011). They show that within an areaof approximately 1 km from the sea (blue ice) the SMB is negative but becomes consistentlypositive further inland. Genthon et al. (2007) showed that the negative SMB on the coastalblue ice field is mostly due to erosion and export of snow by the wind. Altogether, coastalAdélie Land thus offers very appropriate conditions for detailed observations of blowingsnow.
FlowCapt instruments were deployed in early 2009 at site D3, roughly 1 km from thecoast (110 m a.s.l., see Table 1), along with an AWS (wind, temperature, moisture, snowsurface height) thus becoming an automatic snow station (ASS). A full AWS was alsodeployed at site D17, 8 km inland (426 m a.s.l.), with the same characteristics as stationD3 but without FlowCapt instrumentation during the period concerned. Although only 7 kmapart, stations D3 and D17 are very distinct in terms of SMB (Agosta et al. 2011), withstation D3 SMB being close to zero. The stations D3 and D17 provide consistent mete-orological observations in terms of the types of instrument, the height of the instrumentsabove the surface, sampling, and averaging. The Cap Prudhomme AWS is not located onthe ice, and the station D10 uses different instruments and sampling. Here we only usedata from stations D3 and D17 to scale our RCM with respect to the meteorology for thisperiod, and only from station D3 for blowing snow. Measurements are made by all the AWSinstruments at 10-s intervals and their 30-min averages are stored. The wind speed, direc-tion and temperature are measured 2 m above ground level (a.g.l.). The FlowCapt consistsof three vertical 1-m long tubes, each of which detects and tentatively measures the fluxfrom the surface up to a height of 3 m a.g.l. Like the AWS, data are averaged on a 30-minbasis.
123
138 H. Gallée et al.
3 Description of the Model
The coupled atmosphere/blowing snow/snow pack model is an improved version of the RCMMAR. An overview of MAR is given here, focused on the description of the blowing snowsubmodel and its coupling with the snowpack and atmospheric sub-models. A full descriptionof atmospheric dynamics is given in Gallée and Schayes (1994). The original version of thesnow and blowing snow sub-models is described in Gallée et al. (2001) and a preliminarylong-term validation based on a comparison with snow stake measurements is described inGallée et al. (2005).
MAR atmospheric dynamics are based on the hydrostatic approximation of the primitiveequations. This is acceptable when the vertical extent of the circulation (here the katabaticflow) is much smaller than the size of the grid (here 5 km). Nevertheless, it should be notedthat non-hydrostatic processes may be responsible for a weak deceleration of the katabaticflow (Cassano and Parish 2000). The vertical coordinate is the normalized pressure, withthe model top situated at the 1-Pa pressure level. Parametrization of turbulence in the SBLtakes into account the stabilization effect by the blowing snow flux, as in Gallée et al. (2001).Turbulence above the SBL is parametrized using the local E − ε model of Bintanja (2000).In particular, it contains a parametrization of the turbulent transport of snow particles that isconsistent with classical parametrizations of their sedimentation velocity. The influence ofchanges in the water phase on turbulence is included following Duynkerke and Driedonks(1987).
Prognostic equations are used to describe five water species, as in Gallée (1995): specifichumidity, cloud droplets and ice crystals, raindrops and snow particles. A sixth equation hasbeen added describing the number of ice crystals. Cloud microphysical parametrizations arebased on the studies of Kessler (1969), Lin et al. (1983), Meyers et al. (1992) and Levkov et al.(1992), and the influence of hydrometeors on air specific mass is included in the model as inGallée et al. (2001). This allows the influence of the weight of eroded particles on katabaticflow dynamics to be taken into account. Furthermore, sublimation of airborne snow particlesis a direct contribution to the heat and moisture budget of the atmospheric layer in whichthese particles are simulated. This is important because blowing snow particles may reacha significant height above the surface (Mahesh et al. 2003; Scarchilli et al. 2010). Latentheat losses due to the sublimation of blowing snow particles are taken into account in theenergy budget of the atmospheric layer in which the particles are found. Contrary to Lenaertset al. (2010, 2012a,b), they are not included in the surface budget, because they could beresponsible for the underestimation of surface temperature and subsequent underestimationof surface sublimation and spurious stabilization of the SBL.
The radiative transfer through the atmosphere is parametrized as in Morcrette (2002) andis the same as that used in ERA-40 re-analyses. As blowing snow particles are small (Waldenet al. 2003), they may have an impact on the radiative transfer. In MAR, the influence ofsnow particles on atmospheric optical depth is included (Gallée and Gorodetskaya 2010).
In MAR, surface processes are modelled using the “soil-ice-snow-vegetation-atmospheretransfer” scheme (SISVAT, De Ridder and Gallée 1998; Gallée et al. 2001). In particular, thesnow surface albedo depends on the snow properties (dendricity, sphericity and size of thesnow particles). The influence of snow erosion / deposition on surface roughness (z0) is takeninto account by allowing the aerodynamic roughness length to increase linearly as a functionof the wind speed 10 m a.g.l. (V10), when V10 > 6 m s−1. The time scale for sastrugiformation is assumed to be half a day, as suggested by Andreas (1995), and the asymptoticvalue of z0 may increase linearly as a function of the wind speed V (z0,lim = 10 mm forV = 20 m s−1; note that the friction velocity corresponding to V = 20 m s−1 is generally
123
A Comparison Between Observations in Adélie Land, Antarctica 139
slightly >1 m s−1). z0 is allowed to decrease when precipitation occurs with no erosion ofthe snow by the wind. Indeed the newly deposited snow progressively buries the sastrugi.Andreas et al. (2005, their Fig. 1) found values of z0 ranging between approximately 10−4
and 100 mm, for friction velocities no greater than 0.6 m s−1. The scatter is very high and isexplained by the high dependency of z0 on sastrugi history. Our parametrization includes thateffect in a simple way, and is calibrated to obtain the best simulation of wind speed. Sastrugiscontribute to surface roughness (sastrugi form drag) and hence to the loss of kinetic energyavailable for erosion. The contribution is represented by a decrease in the snow erosion fluxand is parametrized as in Marticorena and Bergametti (1995). The increase in roughnesslength through the building of sastrugis is a negative feedback, and is not included e.g. in thestudy of Lenaerts et al. (2010, 2012a,b).
Densification of snow by the wind is included in SISVAT as in Gallée et al. (2001) with aslight modification. Snow-pack densification is allowed for erodible snow layers even deepwithin the snow pack to account for the redistribution of snow inside a grid cell. This isbecause our RCM simulates snow-pack behaviour averaged over a whole grid cell. In turn,an increase in the density of the surface snow pack is responsible for an increase in the frictionvelocity threshold before erosion. This is a negative feedback.
Unlike in previous versions of our model, the density of deposited blown snow particlesis parametrized as a function of the wind speed, as in Kotlyakov (1961):
ρ = 104(V10 − 6)0.5 (1)
where ρ is the snow density in kg m−3 and V10 > 6 m s−1.
4 Results
Our RCM MAR was set up for Adélie Land with a horizontal resolution of 5 km (Fig. 1).This domain was chosen in order to include the katabatic wind system over the slopes ofAdélie Land, which extend from the coast roughly 250 km inland. MAR was tested for sev-eral domain configurations including larger ones but the sensitivity of the simulated windspeed over our area of interest (station DDU—station D17 transect) was very small. Conse-quently we chose a small domain in order to perform simulations at an affordable numericalcost. Lateral forcing of MAR and sea surface conditions (sea-surface temperature and sea-icefraction) are taken from ERA-Interim (Dee et al. 2011). The ratio of the ERA-Interim gridsize to the MAR grid size is >10, which could have been a source of distortions over our areaof interest. However this was not the case, as the simulated wind speed there is not sensitiveto the size of the domain. It will be recalled that one objective of our study is to accuratelysimulate the forcing of blowing snow, namely wind speed, over the area of interest, so as tosimulate the occurrence of blowing snow for the right reasons and consequently provide arealistic validation for the representation of such a process in our model.
There are 60 vertical levels in the atmospheric model with a high vertical resolution inthe low troposphere. The spacing between the first 12 levels is 2 m and the first level is 2 ma.g.l. We realized that this vertical resolution would not allow us to represent the much higherconcentration of blowing snow particles just above the saltation layer. In order to infer theconsequence of our choice for the detection of blowing snow by the model, a preliminary 2-Dsimulation was performed with a much finer vertical resolution near the surface and with thelowest levels located 0.1, 0.2, 0.4 and 0.8 m a.g.l. We found that the concentration of blownsnow particles 2 m a.g.l. was comparable to that in a simulation using the coarser verticalresolution of the present study. This made us confident in the validation of the occurrence of
123
140 H. Gallée et al.
blowing snow in the model. The influence of blowing snow just above the surface will thusbe included in the model in forthcoming studies.
The simulation was initialized once on 1 December 2009, with integration to two months.As snow surface temperatures depend on initialization at a longer time scale than is the scalefor air temperatures, the simulation was started one month before the period of interest (Jan-uary 2010). This allowed at least the snow layers near the surface to adjust to meteorologicalconditions. Note that, in our model, the snow pack near the surface is very rapidly renewedbecause snow precipitation and erosion are responsible for the formation of new layers andthe disappearance of older ones. Furthermore as shown below (Fig. 4, in the sub-section ontemperature analysis), the model does not have a temperature drift, because the adjustmentperiod is already sufficiently long and also probably because of (i) the small size of thedomain, and (ii) the good quality of the large-scale meteorological fields. The results areshown for the second month of the simulation run.
Model performances were assessed using the efficiency statistical test (E) proposed byNash and Sutcliffe (1970):
E = 1 − RMSE2/s2 (2)
where s and RMSE are respectively the standard deviation of the observations and the root-mean-square error of the simulated variable. Note that RMSE = 0 implies E = 1. Anefficiency index close to 1 means that comparing the simulated variable with the correspond-ing observation provides a lower RMSE than that obtained when comparing it with its timeaverage. A negative efficiency index means that the RMSE is higher than the standard devi-ation of the observations. This then suggests that a detailed model would not improve theresults compared to a simpler model providing an estimation of the variable averaged overthe time period concerned. It is important to perform this statistical test for wind speed sincea good simulation of it is a prerequisite for a good simulation of blowing snow.
In the remaining part of this section we analyze the wind speed, the temperature andthe occurrence or absence of blowing snow. The analysis of temperature is needed becausechanges in snow erosion may occur when the melting point is reached. Wind direction is notanalyzed since the validation of the simulated divergence of blowing snow fluxes is not thepurpose of our study.
4.1 Wind Speed
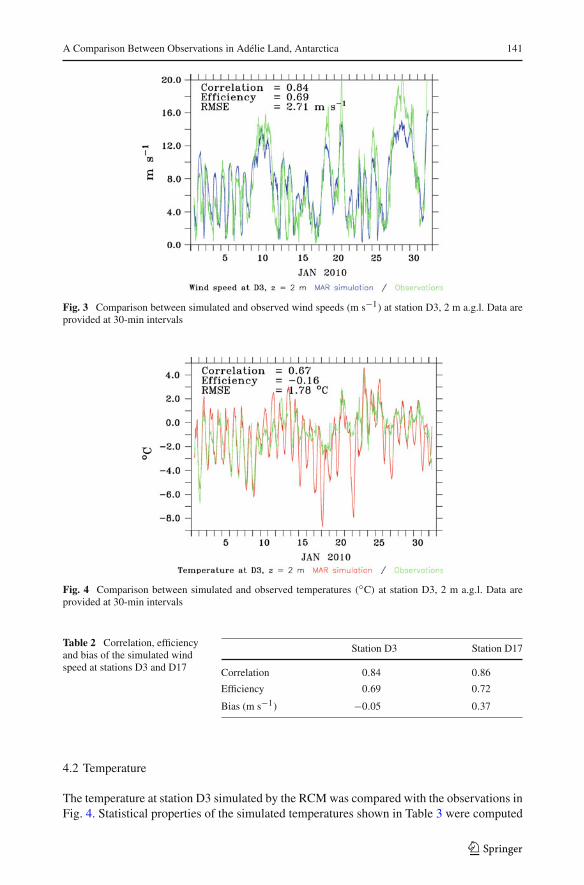
The wind speed simulated at station D3 by the model is in good agreement with the observa-tions reported in Fig. 3 and Table 2, as suggested by the high positive value of the efficiency.The timing of maximum winds is generally well simulated but their intensity during strongwind events is underestimated. The agreement is also good at station D17 (see Table 2). Asexpected, the good results obtained with the model can be at least partly explained by the factthat the area of interest (Adélie Land) is strongly influenced by synoptic weather systemsand relatively large-scale topographic winds (both katabatic and anabatic—see, e.g., Galléeand Pettré 1998).
Note that the underestimation of the wind speed is not related to the choice of the sizeof the domain since no sensitivity was found to this choice. The underestimation is thusprobably due to the turbulence scheme, which does not do a very good job in the case of highwind speed. In the real world, turbulent eddies have a large vertical extent during strong windevents and provide efficient downwards transfer of momentum. This is not the case with theE − ε turbulence model. Possibly the use of a non-local turbulence scheme would improvethis aspect of the simulation.
123
A Comparison Between Observations in Adélie Land, Antarctica 141
Fig. 3 Comparison between simulated and observed wind speeds (m s−1) at station D3, 2 m a.g.l. Data areprovided at 30-min intervals
Fig. 4 Comparison between simulated and observed temperatures (◦C) at station D3, 2 m a.g.l. Data areprovided at 30-min intervals
Table 2 Correlation, efficiencyand bias of the simulated windspeed at stations D3 and D17
Station D3 Station D17
Correlation 0.84 0.86
Efficiency 0.69 0.72
Bias (m s−1) −0.05 0.37
4.2 Temperature
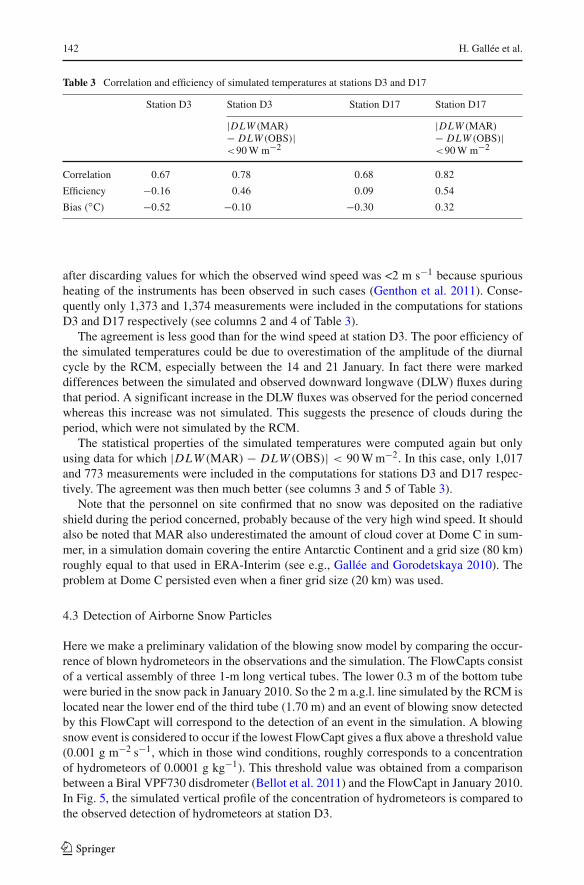
The temperature at station D3 simulated by the RCM was compared with the observations inFig. 4. Statistical properties of the simulated temperatures shown in Table 3 were computed
123
142 H. Gallée et al.
Table 3 Correlation and efficiency of simulated temperatures at stations D3 and D17
Station D3 Station D3 Station D17 Station D17
|DLW (MAR)
− DLW (OBS)|<90 W m−2
|DLW (MAR)
− DLW (OBS)|<90 W m−2
Correlation 0.67 0.78 0.68 0.82
Efficiency −0.16 0.46 0.09 0.54
Bias (◦C) −0.52 −0.10 −0.30 0.32
after discarding values for which the observed wind speed was <2 m s−1 because spuriousheating of the instruments has been observed in such cases (Genthon et al. 2011). Conse-quently only 1,373 and 1,374 measurements were included in the computations for stationsD3 and D17 respectively (see columns 2 and 4 of Table 3).
The agreement is less good than for the wind speed at station D3. The poor efficiency ofthe simulated temperatures could be due to overestimation of the amplitude of the diurnalcycle by the RCM, especially between the 14 and 21 January. In fact there were markeddifferences between the simulated and observed downward longwave (DLW) fluxes duringthat period. A significant increase in the DLW fluxes was observed for the period concernedwhereas this increase was not simulated. This suggests the presence of clouds during theperiod, which were not simulated by the RCM.
The statistical properties of the simulated temperatures were computed again but onlyusing data for which |DLW (MAR) − DLW (OBS)| < 90 W m−2. In this case, only 1,017and 773 measurements were included in the computations for stations D3 and D17 respec-tively. The agreement was then much better (see columns 3 and 5 of Table 3).
Note that the personnel on site confirmed that no snow was deposited on the radiativeshield during the period concerned, probably because of the very high wind speed. It shouldalso be noted that MAR also underestimated the amount of cloud cover at Dome C in sum-mer, in a simulation domain covering the entire Antarctic Continent and a grid size (80 km)roughly equal to that used in ERA-Interim (see e.g., Gallée and Gorodetskaya 2010). Theproblem at Dome C persisted even when a finer grid size (20 km) was used.
4.3 Detection of Airborne Snow Particles
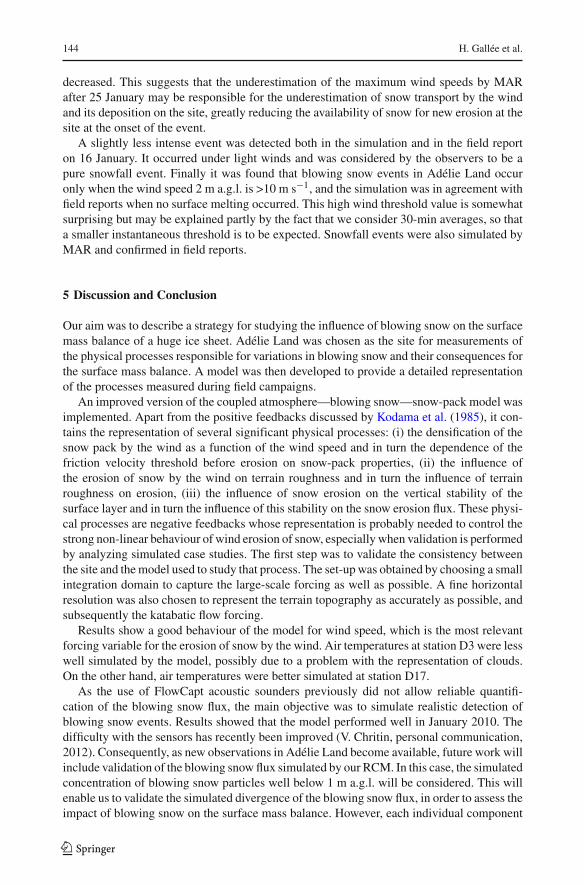
Here we make a preliminary validation of the blowing snow model by comparing the occur-rence of blown hydrometeors in the observations and the simulation. The FlowCapts consistof a vertical assembly of three 1-m long vertical tubes. The lower 0.3 m of the bottom tubewere buried in the snow pack in January 2010. So the 2 m a.g.l. line simulated by the RCM islocated near the lower end of the third tube (1.70 m) and an event of blowing snow detectedby this FlowCapt will correspond to the detection of an event in the simulation. A blowingsnow event is considered to occur if the lowest FlowCapt gives a flux above a threshold value(0.001 g m−2 s−1, which in those wind conditions, roughly corresponds to a concentrationof hydrometeors of 0.0001 g kg−1). This threshold value was obtained from a comparisonbetween a Biral VPF730 disdrometer (Bellot et al. 2011) and the FlowCapt in January 2010.In Fig. 5, the simulated vertical profile of the concentration of hydrometeors is compared tothe observed detection of hydrometeors at station D3.
123
A Comparison Between Observations in Adélie Land, Antarctica 143
Fig. 5 Comparison of observed and simulated wind speed 2 m a.g.l. (green and blue line), the simulated con-centration of atmospheric snow particles (colour code), and the observed detection of blown snow particlesat station D3, with green bars indicating time periods when blown snow particles were detected by the twobottom tubes of the FlowCapt (detection threshold assumed to be 0.0001 g m−2s−1). The normalized valueof the blowing snow flux measured by the bottom tube of the FlowCapt (blue line in the top panel) is alsoshown in order to provide a qualitative overview of the intensity of blowing snow events. Data are providedat 30-min intervals
Significant events (concentration of snow particles above 0.2 g kg−1) are simulated forJanuary 10, 18–21 and 28 respectively, events that correspond to strong winds and to a largeobserved blowing snow flux. Snow was also observed to fall during the first three events. TheJanuary 10 event was barely detected, and the field report states that a light snowfall occurred.The January 18, 19 event started with snowfall under light winds but the wind strengthenedand snow drift started at 1,600 LT on 18 January. The model shows similar behaviour, assuggested by the larger simulated concentrations in the lowest part of the profile. The eventon the 20, 21 of January, 2010 was a strong blowing snow event.
Two other observed events characterized by a large blowing snow flux were observed on 23and 25 January but were not simulated by the model. The observed event which occurred on27–30 January appears to be underestimated by the model compared to those which occurredon 18–21 January.
It was stated in the field report that no snowfall occurred after 21 January. Both observedand simulated temperatures rose above melting point from 21 to 25 January, after which theysignificantly decreased. Observations of the snow surface during the last 10 days of Januaryreported the formation of a freezing crust on 22 January. The snow surface was then reportedto be smooth before being progressively covered with sastrugis as blown snow particles weretransported by the wind from the Antarctic interior towards the observation site.
This meteorological situation may explain why our RCM (MAR) did not simulate snowbeing transported by the wind on the 23 and 25 of January. Indeed MAR does not allow ero-sion of melt snow, even after it has frozen again, and this is a highly non-linear process thatis difficult to simulate accurately. Furthermore the simulated concentration of blown snowincreased with time during the event on 27 to 30 January whereas the observed concentration
123
144 H. Gallée et al.
decreased. This suggests that the underestimation of the maximum wind speeds by MARafter 25 January may be responsible for the underestimation of snow transport by the windand its deposition on the site, greatly reducing the availability of snow for new erosion at thesite at the onset of the event.
A slightly less intense event was detected both in the simulation and in the field reporton 16 January. It occurred under light winds and was considered by the observers to be apure snowfall event. Finally it was found that blowing snow events in Adélie Land occuronly when the wind speed 2 m a.g.l. is >10 m s−1, and the simulation was in agreement withfield reports when no surface melting occurred. This high wind threshold value is somewhatsurprising but may be explained partly by the fact that we consider 30-min averages, so thata smaller instantaneous threshold is to be expected. Snowfall events were also simulated byMAR and confirmed in field reports.
5 Discussion and Conclusion
Our aim was to describe a strategy for studying the influence of blowing snow on the surfacemass balance of a huge ice sheet. Adélie Land was chosen as the site for measurements ofthe physical processes responsible for variations in blowing snow and their consequences forthe surface mass balance. A model was then developed to provide a detailed representationof the processes measured during field campaigns.
An improved version of the coupled atmosphere—blowing snow—snow-pack model wasimplemented. Apart from the positive feedbacks discussed by Kodama et al. (1985), it con-tains the representation of several significant physical processes: (i) the densification of thesnow pack by the wind as a function of the wind speed and in turn the dependence of thefriction velocity threshold before erosion on snow-pack properties, (ii) the influence ofthe erosion of snow by the wind on terrain roughness and in turn the influence of terrainroughness on erosion, (iii) the influence of snow erosion on the vertical stability of thesurface layer and in turn the influence of this stability on the snow erosion flux. These physi-cal processes are negative feedbacks whose representation is probably needed to control thestrong non-linear behaviour of wind erosion of snow, especially when validation is performedby analyzing simulated case studies. The first step was to validate the consistency betweenthe site and the model used to study that process. The set-up was obtained by choosing a smallintegration domain to capture the large-scale forcing as well as possible. A fine horizontalresolution was also chosen to represent the terrain topography as accurately as possible, andsubsequently the katabatic flow forcing.
Results show a good behaviour of the model for wind speed, which is the most relevantforcing variable for the erosion of snow by the wind. Air temperatures at station D3 were lesswell simulated by the model, possibly due to a problem with the representation of clouds.On the other hand, air temperatures were better simulated at station D17.
As the use of FlowCapt acoustic sounders previously did not allow reliable quantifi-cation of the blowing snow flux, the main objective was to simulate realistic detection ofblowing snow events. Results showed that the model performed well in January 2010. Thedifficulty with the sensors has recently been improved (V. Chritin, personal communication,2012). Consequently, as new observations in Adélie Land become available, future work willinclude validation of the blowing snow flux simulated by our RCM. In this case, the simulatedconcentration of blowing snow particles well below 1 m a.g.l. will be considered. This willenable us to validate the simulated divergence of the blowing snow flux, in order to assess theimpact of blowing snow on the surface mass balance. However, each individual component
123
A Comparison Between Observations in Adélie Land, Antarctica 145
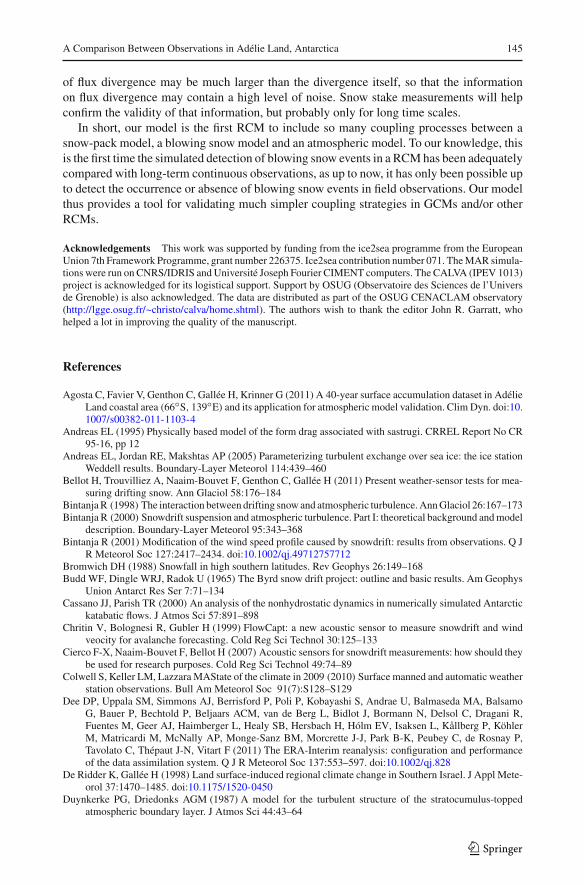
of flux divergence may be much larger than the divergence itself, so that the informationon flux divergence may contain a high level of noise. Snow stake measurements will helpconfirm the validity of that information, but probably only for long time scales.
In short, our model is the first RCM to include so many coupling processes between asnow-pack model, a blowing snow model and an atmospheric model. To our knowledge, thisis the first time the simulated detection of blowing snow events in a RCM has been adequatelycompared with long-term continuous observations, as up to now, it has only been possible upto detect the occurrence or absence of blowing snow events in field observations. Our modelthus provides a tool for validating much simpler coupling strategies in GCMs and/or otherRCMs.
Acknowledgements This work was supported by funding from the ice2sea programme from the EuropeanUnion 7th Framework Programme, grant number 226375. Ice2sea contribution number 071. The MAR simula-tions were run on CNRS/IDRIS and Université Joseph Fourier CIMENT computers. The CALVA (IPEV 1013)project is acknowledged for its logistical support. Support by OSUG (Observatoire des Sciences de l’Universde Grenoble) is also acknowledged. The data are distributed as part of the OSUG CENACLAM observatory(http://lgge.osug.fr/~christo/calva/home.shtml). The authors wish to thank the editor John R. Garratt, whohelped a lot in improving the quality of the manuscript.
References
Agosta C, Favier V, Genthon C, Gallée H, Krinner G (2011) A 40-year surface accumulation dataset in AdélieLand coastal area (66◦S, 139◦E) and its application for atmospheric model validation. Clim Dyn. doi:10.1007/s00382-011-1103-4
Andreas EL (1995) Physically based model of the form drag associated with sastrugi. CRREL Report No CR95-16, pp 12
Andreas EL, Jordan RE, Makshtas AP (2005) Parameterizing turbulent exchange over sea ice: the ice stationWeddell results. Boundary-Layer Meteorol 114:439–460
Bellot H, Trouvilliez A, Naaim-Bouvet F, Genthon C, Gallée H (2011) Present weather-sensor tests for mea-suring drifting snow. Ann Glaciol 58:176–184
Bintanja R (1998) The interaction between drifting snow and atmospheric turbulence. Ann Glaciol 26:167–173Bintanja R (2000) Snowdrift suspension and atmospheric turbulence. Part I: theoretical background and model
description. Boundary-Layer Meteorol 95:343–368Bintanja R (2001) Modification of the wind speed profile caused by snowdrift: results from observations. Q J
R Meteorol Soc 127:2417–2434. doi:10.1002/qj.49712757712Bromwich DH (1988) Snowfall in high southern latitudes. Rev Geophys 26:149–168Budd WF, Dingle WRJ, Radok U (1965) The Byrd snow drift project: outline and basic results. Am Geophys
Union Antarct Res Ser 7:71–134Cassano JJ, Parish TR (2000) An analysis of the nonhydrostatic dynamics in numerically simulated Antarctic
katabatic flows. J Atmos Sci 57:891–898Chritin V, Bolognesi R, Gubler H (1999) FlowCapt: a new acoustic sensor to measure snowdrift and wind
veocity for avalanche forecasting. Cold Reg Sci Technol 30:125–133Cierco F-X, Naaim-Bouvet F, Bellot H (2007) Acoustic sensors for snowdrift measurements: how should they
be used for research purposes. Cold Reg Sci Technol 49:74–89Colwell S, Keller LM, Lazzara MAState of the climate in 2009 (2010) Surface manned and automatic weather
station observations. Bull Am Meteorol Soc 91(7):S128–S129Dee DP, Uppala SM, Simmons AJ, Berrisford P, Poli P, Kobayashi S, Andrae U, Balmaseda MA, Balsamo
G, Bauer P, Bechtold P, Beljaars ACM, van de Berg L, Bidlot J, Bormann N, Delsol C, Dragani R,Fuentes M, Geer AJ, Haimberger L, Healy SB, Hersbach H, Hólm EV, Isaksen L, Kållberg P, KöhlerM, Matricardi M, McNally AP, Monge-Sanz BM, Morcrette J-J, Park B-K, Peubey C, de Rosnay P,Tavolato C, Thépaut J-N, Vitart F (2011) The ERA-Interim reanalysis: configuration and performanceof the data assimilation system. Q J R Meteorol Soc 137:553–597. doi:10.1002/qj.828
De Ridder K, Gallée H (1998) Land surface-induced regional climate change in Southern Israel. J Appl Mete-orol 37:1470–1485. doi:10.1175/1520-0450
Duynkerke PG, Driedonks AGM (1987) A model for the turbulent structure of the stratocumulus-toppedatmospheric boundary layer. J Atmos Sci 44:43–64
123
146 H. Gallée et al.
Favier V, Agosta C, Genthon C, Arnaud L, Trouvillez A, Gallée H (2011) Modeling the mass and surface heatbudgets in a coastal blue ice area of Adelie Land, Antarctica. J Geophys Res 116:F03017. doi:10.1029/2010JF001939
Frezzotti M, Gandolfi S, La Marca F, Urbini S (2002) Snow dunes and glazed surfaces in Antarctica: newfield and remote-sensing data. An Glaciol 34(1):81–88
Gallée H (1995) Simulation of the mesocyclonic activity in the Ross Sea, Antarctica. Mon Weather Rev123:2051–2069
Gallée H (1998) A simulation of blowing snow over the Antarctic ice sheet. Ann Glaciol 26:203–205Gallée H, Gorodetskaya I (2010) Validation of a limited area model over Dome C, Antarctic Plateau, during
winter. Clim Dyn 23(1):61–72. doi:10.1007/s00382-008-0499-yGallée H, Pettré P (1998) Dynamical constraints on katabatic wind cessation in Adélie Land, Antarctica.
J Atmos Sci 55:1755–1770Gallée H, Schayes G (1994) Development of a three-dimensional meso-gamma primitive equations model,
katabatic winds simulation in the area of Terra Nova Bay, Antarctica. Mon Weather Rev 122:671–685Gallée H, Guyomarc’h G, Brun E (2001) Impact of snow drift on the ntarctic ice sheet surface mass balance.
Possible sensitivity to snow surface properties. Boundary-Layer Meterorol 99:1–19Gallée H, Pettré P, Schayes G (1996) Sudden cessation of katabatic winds in Adélie Land, Antarctica. J Appl
Meteorol 35:1142–1152Gallée H, Peyaud V, Goodwin I (2005) Simulation of the net snow accumulation along the Wilkes land tran-
sect, Antarctica, with a regional climate model. Ann Glaciol 41:17–22Genthon C, Lardeux P, Krinner G (2007) The surface accumulation and ablation of a blue ice area near Cap
Prudhomme, Adélie Land, Antarctica. J Glaciol 183(53):635–645Genthon C, Six D, Favier V, Lazzara M, Keller L (2011) Atmospheric temperature measurement biases on
the Antarctic Plateau. J Atmos Ocean Technol (28):1598–1605Gosink JP (1989) The extension of a density current model of katabatic winds to include the effects of blowing
snow and sublimation. Boundary-Layer Meterorol 49(4):367–394. doi:10.1007/BF00123650Kessler E (1969) On the distribution and continuity of water substance in atmospheric circulations. Met.
Monograph 10, No. 32. American Meteorological Society, Boston, pp 84Kodama Y, Wendler G, Gosink J (1985) The effect of blowing snow on katabatic winds in Antarctica. Ann
Glaciol 6:59–62Kotlyakov VM (1961) Results of a study of the processes of formation and structure of the upper layer of the
ice sheet in Eastern Antarctica. Antarctic glaciology 55. IAHS Press, Wallingford 88–99König-Langlo G, King JC, Pettré P (1998) Climatology of the three coastal Antarctic stations Dumont
d’Urville, Neumayer, and Halley. J Geophys Res 103(D9):10935–10946. doi:10.1029/97JD00527König-Langlo GC, Loose B (2007) The meteorological observatory at Neumayer stations (GvN and NM-II),
Antarctica. Polarforschung 76:25–38Lenaerts JTM, van den Broeke MR, Déry SJ, König-Langlo G, Ettema J, Kuipers Munneke P (2010) Mod-
elling snowdrift sublimation on an Antarctic ice shelf. Cryosphere Discuss 4:121–152. doi:10.5194/tcd-4-121-2010
Lenaerts JTM, van den Broeke MR, van de Berg WJ, van Meijgaard E, Kuipers Munneke P (2012) A new, highresolution surface mass balance map of Antarctica (1979–2010) based on regional climate modeling.Geophys Res Lett 39:L04501. doi:10.1029/2011GL050713
Lenaerts JTM, van den Broeke MR, Déry SJ, van Meijgaard E, van de Berg WJ, Palm SP, Sanz RodrigoJ (2012) Modeling drifting snow in Antarctica with a regional climate model, Part I: methods and modelevaluation. J Geophys Res 117:D05108. doi:10.1029/2011JD016145
Levkov L, Rockel B, Kapitza H, Raschke E (1992) 3D meso-scale numerical studies of cirrus and stratusclouds by their time and space evolution. Contrib Atmos Phys 65:35–58
Lin YJ, Farley RD, Orville HD (1983) Bulk parameterization of the snow-field in a cloud model. J Clim ApplMeteorol 22:1065–1092
Mahesh A, Eager R, Campbell JR, Spinhirne JD (2003) Observations of blowing snow at the South Pole.J Geophys Res 108(D22):4707. doi:10.1029/2002JD003327
Male DH (1980) The seasonal snow cover. In: Colbeck SA (ed) Dynamics of snow and ice masses. AcademicPress Inc., New York, pp 305–395
Mann GW, Anderson PS, Mobbs SD (2000) Profile measurements of blowing snow at Halley, Antarctica.J Geophys Res 105:24491–24508
Marticorena B, Bergametti G (1995) Modeling the atmospheric dust cycle: 1. Design of a soil-derived dustemission scheme. J Geophys Res 100:16415–16430
Mellor M, Fellers G (1986) Concentration and flux of wind-blown snow, US Army Corps of Engineers, SpecialReport 86-11
123
A Comparison Between Observations in Adélie Land, Antarctica 147
Meyers MP, DeMott PJ, Cotton WR (1992) New primary ice nucleation parameterizations in an explicit cloudmodel. J Appl Meteorol 31:708–721
Morcrette J-J (2002) Assessment of the ECMWF model cloudiness and surface radiation fields at the ARM-SGP site. Mon Weather Rev 130:257–277
Naaim-Bouvet F, Bellot H, Naaim M (2010) Back analysis of drifting snow measurements over an instrumentedmountainous site. Ann Glaciol 51(54):207–217
Nash JE, Sutcliffe JV (1970) River flow forecasting through conceptual models part I. A discussion of prin-ciples. J Hydrol 10(3):282–290. doi:10.1016/0022-1694(70)90255-6
Parish TR (1988) Surface winds over the Antarctic continent: a review. Rev Geophys 26(1):169–180. doi:10.1029/RG026i001p00169
Scarchilli C, Frezzotti M, Grigioni P, Silvestri L, Agnoletto L, Dolci S (2010) Extraordinary blowing snowtransport events in East Antarctica. Clim Dyn 34(7–8):1195–2306
Solomon S, Qin D, Manning M, Chen Z, Marquis M, Averyt KB, Tignor M, Miller HL (eds.) (2007) Con-tribution of working group I to the fourth assessment report of the intergovernmental panel on climatechange. Cambridge University Press, Cambridge, p 996
Stearns CR, Wendler G (1988) Research results from Antarctic automatic weather stations. Rev Geophys26(1):45–61
Takahashi S (1985) Characteristics of drifting snow at Mizuho Station, Antarctica. Ann Glaciol 6:71–75Walden Von P, Warren SG, Tuttle E (2003) Atmospheric ice crystals over the Antarctic Plateau in Winter.
J Appl Meteor 42:1391–1405Wamser C, Lykossov VN (1995) On the friction velocity during blowing snow. Contrib Atmos Phys 68:85–94
123