transpiration from an amazonian rainforest calculated from
TRANSCRIPT

4grt~ultural and Forest Meteorology, 65 (1993) 175 196 175 0168-1923/93/$06 00 ,(, 1993 Elsevier Science Publishers B V All r ights reserved
Transpiration from an Amazonian rainforest calculated from stomatal conductance measurements
John Roberts* ~, Osvaldo M R Cabral b, G FIsch ~, L C B Mohon d, C J Moore "l, W J S h u t t l e w o r t h d
'Institute o/H~droh~g~ Walhnglord 0¥10 8BB L'tk bEMBRAPA Manaua 4mazonas Brazil
~Centro Te~hni~o Aeroespa~tal Sao Jo~e do~ Campo~ Sao Paulo Brazil dln~tituto Nauonal Pesqutsas Espa~tats Sao Jose do~ Campos Sao Paulo Brazil
(Received 8 September 1992 revision accepted ~ March 1993)
Abstract
A multi-layer combination equation has been used to calculate transpiration from a tropical ramtorest m the central Amazon, Brazil The five-layer formulation used through-canopy measurements of tempera- ture and humidity deficit with leaf stomatal and boundary layer conductances scaled up to canopy layer values used a profile of canopy leaf area index derived from the literature Net radiation input to each layer was estimated from an above canopy measurement using an extinction function and leaf area index
Transpiration calculated [or hourly and daily periods m a range of seasonal conditions agreed well with those measured directly with an eddy correlation device Four simplified forms of the transpiration calcula- tion were also compared with the direct measurement These simplified forms used the above-canopy or the average of the through-canopy values of weather ~ anables and used either the average of leaf conductances multiplied by total leaf area index or the average of the layer conductances These simphfied torms of the transpiration calculation gave poorer agreement with measured transpiration
Introduction
Complete or partial clearance of tropical ramforest affects large-scale sur- face energy balance and carbon dioxide content of the atmosphere, as well as local streamflow and soil stability The consequences of changes m the extent of tropical forests have been difficult to assess because of a shortage of information and understanding of the water, carbon and nutrient cycles of &fferent forest types (Mooney et al , 1980)
In the last decade, however, there has been a substantial increase in the number of physiological studies of ralnforest species, some of which have included detailed stu&es of leaf gas exchange and associated weather van-
*Corresponding a u t h o r

176 J Robert~ et al : dgruultural and Forest Meteorolog~ 65 (1993) 175 196
ables throughout the height profile of the forest canopy (e g Oberbauer et a l , 1987, Roberts et a l , 1990) The data derived m such studies have at least a two-fold value Firstly, direct studies of stomatal behavlour, leaf gas exchange and their interaction with weather variables and soil water status can aid interpretation and modelling of water and COe fluxes determined mlcrome- teorologlcally, and in this way aid the reahsm of hydrological and Global Climate modelling exercises (e g Shuttleworth, 1988, Sellers et a l , 1989) Secondly, the physiological data on stomatal and boundary-layer conduc- tances and leaf area index can be used to provide a direct estimate of tran- spiration from ralnforest canopies
As mlcrometeorologlcal measurement of transpiration fluxes from vegeta- tion can be expensive and time-consuming for tall forest canopies, there is merit In evaluating the scope for exploiting existing physiological data for tropical ralnforests to estimate transpiration using combination formulae m which these physiological data can be used m association with measured weather variables Although such combination formulae (e g Montelth, 1965) are now widely used for crops and other simple vegetation covers, their apphcablhty to complex tropical ralnforest canopies remains untested
The objectives of the studies presented here are three-fold, namely (1) to evaluate a multi-layer version of the Montelth Penman formula which incor- porates physiological and mlcrometeorologlcal data taken at a primary ram- forest site in the central Amazon against dHect measurements of transpiration made at the same site, (11) to determine the relative importance of different input variables for such an equatmn, (111) to assess the vahdlty of simplifying this multllayer approach towards combination formulae of increasing simpli- city
Materials and methods
Stte
The experimental site was in terra firme forest m the Reserva Florestal Ducke, 25 km from Manaus, Amazonas, Brazil (2°57'S, 59°57'W) The tallest emergent trees were about 40 m high, with the average height of the main tree canopy about 30 m No distinct layering exists in the forest canopy
A 44 m high sectional alumInlum tower was installed in the forest on which mlcrometeorologlcal equipment were mounted through and above the forest canopy (Shuttleworth et a l , 1984a, b) Plant physiological measurements were made on foliage accessible from the tower, and on shorter vegetation at ground level within 100 m of the tower (Roberts et a l , 1990)
Mtcrochmate
The mlcrochmate measurements used in the present study were above-
J Roberts et al ,' Agrtcultural and Forest Meteorologl 65 (1993) 175 196 177
canopy solar and net radiation, and the dry and wet bulb temperatures of the air measured with fully ventilated and shielded quartz-crystal psychrometers of the type described by Gash and Stewart (1975) The data used comes from a psychrometer mounted above the canopy at 44 m, and others at 35 7, 30 5, 23 2, 13 5 and 1 4 m above the forest floor within the forest Hourly average values were used in all the following analyses
Multi-layer t~ anspzratlon model
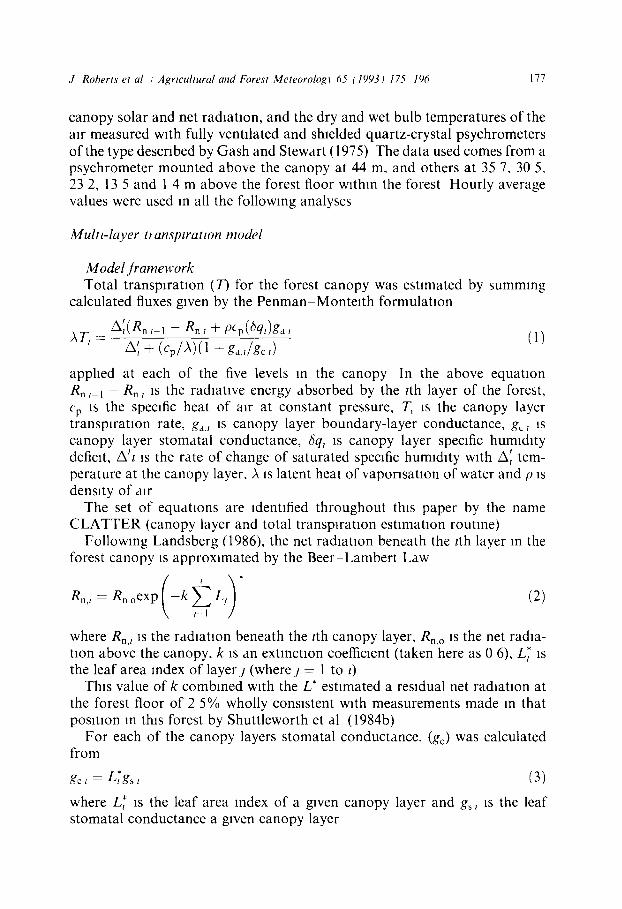
Model jramework Total transpiration (7) for the forest canopy was estimated by summing
calculated fluxes given by the Penman Montelth formulation
A'z(Rn, , - Rn, + p%(bq,)ga, AT, -- (1)
A' + (Cp/A)(l +ga,,/gc,)
applied at each of the five levels in the canopy In the above equation Rn ,_l - Rn, is the radiative energy absorbed by the tth layer of the forest, Cp is the specific heat of air at constant pressure, T~ is the canopy layer transpiration rate, gd,, is canopy layer boundary-layer conductance, g~, is canopy layer stomatal conductance, ~Sq, is canopy layer specific humi&ty deficit, A't ~s the rate of change of saturated specific humidity with A', tem- perature at the canopy layer, A IS latent heat of vaporisatlon of water and p is density of air
The set of equations are identified throughout this paper by the name CLATTER (canopy layer and total transpiration estimation routine)
Following Landsberg (1986), the net radiation beneath the tth layer m the forest canopy is approximated by the Beer Lambert Law
Rn,, = R n o e x p - k L~ (2) /=1
where Rn, ~ is the radiation beneath the tth canopy layer, Rn, o is the net radia- tion above the canopy, k IS an extinction coefficient (taken here as 0 6), L~ is the leaf area index of layer j (where j = 1 to t)
This value of k combined with the L* estimated a residual net radiation at the forest floor of 2 5% wholly consistent with measurements made in that posmon in this forest by Shuttleworth et al (1984b)
For each of the canopy layers stomatal conductance, (gc) was calculated from
go,= L;gs, (3)
where L~ is the leaf area index of a given canopy layer and gs, is the leaf stomatal conductance a given canopy layer

178 J Roberts et al /Agrtcultural and Forest Meteorology 65 (1993) 175-196
Leaf boundary-layer conductances made in individual canopy layers were scaled up in exactly the same way to give a canopy layer conductance
Stomatal conductance
Roberts et al (1990) describe results from a detailed Investigation of sto- matal conductance (g~) for rainforest canopy at the Reserva Ducke s~te used m th~s study These results encompassed the diurnal variation encountered throughout the forest canopy, and were collected in three measurement per- Iods coinciding with different seasons in 1983, 1984 and 1985 D~fferences in g~ between seasons were observed to be small, but there was a substantial varia- tion associated with position in the canopy, and large diurnal trends which are correlated with diurnal changes In solar radiation and atmospheric huml&ty deficit
Roberts et al (1990) report regression equations (Table 1) which relate gs to
Table 1
Linear regression statistics for stomatal conductance (mmol rn 2 s ~ ) with specific humidity deficit (g kg- I )
m five radiation classes for five canopy levels
Solar radiation class Canopy Level Offset Slope ( W m -2)
700-1000 1 459 - 2 3 2 2 259 - 1 2 0
3 244 - 1 0 8
4 204 - 1 0 8
5 244 - 10 8
600-700 1 327 - 12 4
2 208 - 8 8
3 244 - 1 0 8 4 204 10 8
5 244 - 1 0 8
500-600 1 310 - 13 2
2 226 - 1 1 6
3 254 - 1 4 0 4 214 140
5 254 - 14 0
400-500 1 313 12 8
2 194 12 8 3 175 7 6
4 135 - 7 6 5 175 7 6
0 400 1 233 7 6
2 137 - 8 0 3 133 6 0
4 133 - 6 0 5 133 - 6 0

J Roberts et al ,' Agrtcultural and Forest Meteorology 65 (1993) 175 196 179
speofic humldxty deficit at all five canopy heights for a range of above-canopy radiation classes When calculating transpiration from the forest canopy, the appropriate values of stomatal conductance were calculated for each canopy level from these equations using values of above-canopy solar radiation and specific humidity deficit
Boundary-layer conductance
Boundary-layer conductance ( g a ) w a s also determined throughout the for- est canopy by Roberts et al (1990), using measurements of weight losses from wetted paper leaf replicas ga increased sharply from the forest floor to the top of the canopy, a change expected as ga increases with hxgher wind speeds However at any particular canopy level there were lnsufficfent data to allow a defimtlon of any subsidiary relationship between ga and wind speed For the purposes of calculatmg transpiration in this study a fixed ga value has there- fore been selected for the appropriate level from the profile given by Roberts et al (1990), and this value IS gwen in Table 2 These values retain the discontinuity m g a noted by Roberts et al (1990), with ga greater at 20 m than higher in the canopy at 30 m The value o fg a is multlphed by the value of L* appropriate to each level to give ga used in Eq (1)
Leaf area index
Derzvatton from hterature Estimates of leaf area index (L*) and its vertical distribution for forest sites
near Manaus were derived from data previously pubhshed by Khnge (1973) and Khnge et al (1975), as shown in Table 3 Khnge et al (1975) provide information on the &strlbutlon of leaf fresh weight in six canopy strata The assumption is here made that the dry weight of the fohage constitutes 50% of fresh weight The leaf dry weight in each stratum is then converted to L* using values for specific leaf area gwen by Medina and Khnge (1983)
The vertical canopy distribution denved from data given by Khnge (1973)
Table 2 Boundary-layer conductances go, (mmol m 2 s 1) at five canopy posmons for the forest at Reserva Ducke
Canopy level Height (m) ga
1 35 7 1320 (242) 2 30 5 960 (223) 3 23 2 1040 (175) 4 13 4 8O0 (93) 5 1 5 240 (28)
Values m brackets represent one standard dewatlon
180 J Robert3 et al / A¢rtcultural and Forest Meteorolog~ 65 (1993) 175 196
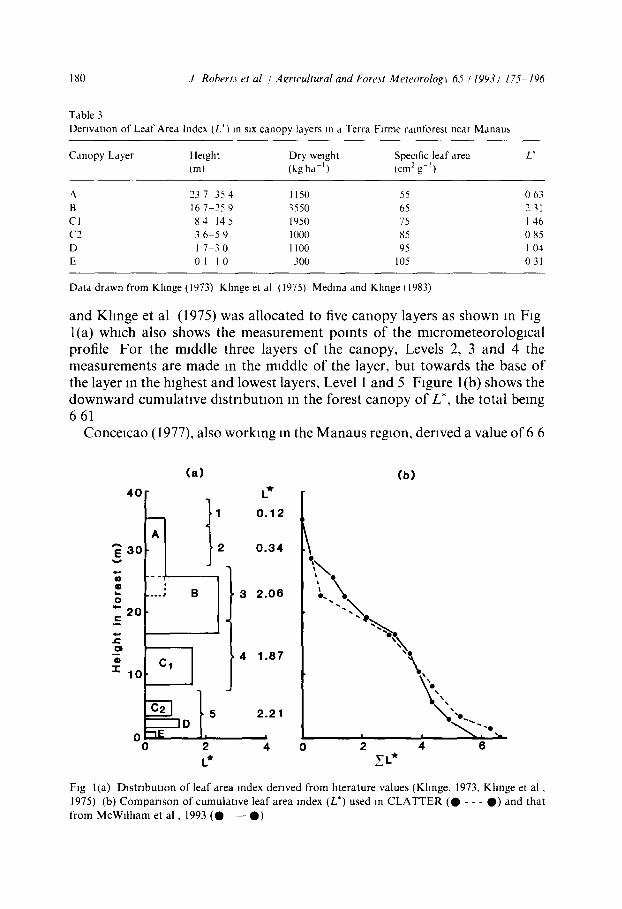
Table 3 Derivation of Leaf Area Index (L*) m six canopy layers m a Terra Flrme ralnforest near Manaus
Canopy Layer Height Dry weight Specific leaf area L* (m) (kgha ') (cm2g i)
237 354 1150 55 063 B 16 7 25 9 "~550 65 2 ~1 Cl 84 145 1950 75 146 C2 36 59 1000 85 085 D 1 7 30 1100 95 1 04 E 0 1 - 1 0 300 105 031
Data drawn from Khnge (1973) Khnge et al (1975) Medina and Khnge (1983)
and Khnge et al (1975) was allocated to five canopy layers as shown in Fig l(a) which also shows the measurement points of the mlcrometeorologlcal profile For the middle three layers of the canopy, Levels 2, 3 and 4 the measurements are made in the middle of the layer, but towards the base of the layer in the highest and lowest layers, Level 1 and 5 Figure 1 (b) shows the downward cumulative d~stribution m the forest canopy of L*, the total being 661
Conce~cao (1977), also working in the Manaus region, derived a value of 6 6
(a)
@ ,
.- 1 B o " 2 0 t -
7= ®
"!-10
0 0 2
L*
L* 0 . 1 2
0 . 3 4
3 2 . 0 6
4 1 .87
2 .21
I
4
(b)
0 2 4. 6 ~L*
Fig l ia) Dis t r ibu t ion o f leaf area Index derived f rom htera ture values (Kllnge, 1973, K h n g e et a l , 1975) (b) C o m p a r i s o n o f cumula t ive leaf area index (L*) used in C L A T T E R ( O - - - 0 ) and that f rom McWll l lam et a l , 1993 ( 0 - - 0 )

J Robert~ et a l / Agrtcultural and Forest Meteorolog) 65 (1993) 175 196 181
for L* from measurements of radiation interception by the forest canopy assuming a value of 0 65 for the extinction coetficlent, k Recently McWllham et al (1993) made direct determinations of L* for a height profile through a forest 60 km from the Reserva Ducke which had been selected to be on the same part of the toposequence as this experimental s~te in the Reserva Ducke The total L* they report IS 5 7 i 0 5, and shows a similar cumulative vertical d~strlbutlon to that derived here from earlier literature (Fig l(b)) The lower value of total L* reported by McWflham et al (1993) may well reflect the fact that their determination was made at the end of the dry season when leaf fall is at a maximum in the central Amazon The values of specific leaf area deter- mined by McWflllam et al (1993) also compare well with those used here, see Table 3
Determmatlon of L* from htter fall
The magnitude of L* was also determined from measurements made of areas of fallen leaves collected in 20 litter trays (0 1 i m 2) at approximately every 2 weeks between July 1984 and July 1986 After collection in the forest and surface drying, the area of litter leaves was determined with a LI-3100 (Llcor, Lincoln, NE) leaf area machine Figure 2 shows that the cumulative litter L* collected over this 2 year period was 12 2 suggesting that L* is on average 6 1
Clearly there is a good deal of consistency in these values However, the underlying philosophy of the present modelling studies is to explore the extent to which published data on physiological behavlour, canopy quantities and
12
X UJ 11 a
z_ lo
W 9 Ilg
8
W 7 - I
~ 6 W I.,- ~ 5 . J
W 4 >_ I-.- 3
0 0
7 8 9 10 11 12 1 2 3 4 5 6 7 8 9 10 11 12 1 2 3 4 5 6 7
1984 1985 1986
Fig 2 Cumula t ive htter leaf area index for the Reserva Ducke site, 1984-1986

182 J Roberts et al / Agrwultural and Forest Meteorology 65 (1993) 175 196
forest mlcrocllmate can be used to estimate transpiration Consequently the L* values used here in CLATTER are those derived from the studies reported by Khnge (1973) and Khnge et al (1975) In view of the peak ofhtterfall in the dry season L* for inputting into CLATTER for September 1983 was reduced by 20% in all canopy layers
Model sensmvlty
Investigations were made of the sensltiwty of the calculated transpiration from the CLATTER model to changes in the input variables net radiation (Rn), specific humidity deficit (~Sq), air temperature (Ta), surface conductance (gc) and boundary-layer conductance (ga) Values were changed indepen- dently in steps of 5% from 25% below to 25% above the original values
Direct measurements of tt ansplratton
D~rect measurements of transpiration were provided by the 'Hydra', a battery-powered eddy correlation flux measurement device mounted above the forest at a height of 48 4 m The 'Hydra' system consisted of a ventilated sonic anemometer, a single beam infrared absorption hygrometer, a thermo- couple thermometer and two Gill propeller anemometers Further details of this measurement system, and procedures used in data processing are given by Shuttleworth et al (1984a) For the purposes of this study the hourly average of latent heat flux measured by the 'Hydra' in dry conditions, viz the tran- spiration, were used for comparison with calculated values given by CLAT- TER, and slmphfied versions of that model
Model stmphficatlon
The same 'Hydra' data were used both to evaluate the performance of CLATTER and a series of simpler models to assess the level of simplification able to calculate transpiration to an acceptable level
Four alternative models were evaluated in each of which the canopy is represented as a single layer from which transpiration is calculated using the Monte l th-Penman formula The entire canopy, absorbing 97 5% of net radiation is treated as a single layer with L* equal to 6 6
Four separate models were evaluated, as follows
Model 1 In this model gs and ga of each canopy layer are multlphed by the value of
L*, for each canopy layer and the resulting conductances summed for use in a single-layer form of Eq (1) Air temperature (Ta) and humidity deficit (6q) required for the equation are mean values derived from five measurement levels in the forest

J Roberts et a l / Agrtcultural and Forest Meteorolog) 65 (1993) 175-196 183
1 . 0
0 .8
0 6
0 4
,.,-.
I " 0 .2 ,=.
E E
v 0 r.-
o w
t., - 1 0 O. SO f..
w t . . k. 0 . 8
0 6
0 . 4
0 .2
0
S e p t e m b e r 1 9 8 3
/--%
I ~ I I I I
J u l y / A u g u s t 1 9 8 4
i I I I f ~ |
A p r i l / M a y 1 9 8 5
i I I I I
9 12 1'5 18
J u l y / A u g u s t 1 9 8 5
A.
! *
6 9 12 15 18
L o c a l t i m e
Fig 3 Comparisons of hourly transpiration measured by an eddy correlation devzce "Hydra' (O - - O) and estimated from CLATTER (O - - - O) for four measurement periods at the Reserva Ducke, Manaus, Brazil Where the standard errors of values differ this is m&cated by an arrow Net radiation averaged for the same hours, expressed as a transplratmn eqmvalent, ~s also shown (11)
Model 2
This model is ~dentlcal to Model 1 except that the average through-canopy values for Ta and 6q are replaced by the measured above-canopy values
Model 3 For this model gs and ga for all five canopy levels are first averaged and then

184 J Roberts et a l / dgrlcultural and Forest Meteorology 65 (1993) 175 196
Table 4 Mean dally transpiration rates (mm da) i ) measured with an eddy correlation device ( 'Hydra ~ compared with means of dally estimates from a transpiration model (CLATTER) tor the same periods
Period Hydra Model
September 1983 2 27 2 64 July,August 1984 4 55 4 54 April,May 1985 4 16 4 65 July,'August 1985 3 71 3 77
multlphed by the total value of L* The resulting canopy conductances are used in Eq (1), with T a and ~q specified as the average values from five canopy levels as in Model 1
Model 4 This model IS identical to Model 3 except that the measured above-canopy
values of T a and ~q are used instead of the average through-canopy values
Results
Model Performance
Calculations were made of hourly transpiration using CLATTER for four periods, namely September 1983, July/August 1984, April/May 1985 and July/August 1985 Figure 3 shows a comparison between hourly transpira- tion averaged for several days compared with the measured transpiration given by the 'Hydra' eddy correlation device for the same periods
There is good agreement between measured transpiration and that esti- mated by CLATTER, although there is a tendency for CLATTER to over- estimate transpiration at the ends of the day One explanation for this overestimation is that CLATTER makes no allowance for the fraction of net ra&atmn lost as heat storage in the forest blomass, or in the air within the trunk space Moore and Flsch (1986) estimated that the hourly energy flux Into and out of storage is frequently above 50 W m -z, but sometimes reaches 80 W m -2 in the early morning and late afternoon, and may constitute over 50% of the net radiation at these times The hourly differences in transpiration measured by the 'H~,dra' and that estimated by CLATTER on some occasions exceeds 0 1 mm h- ' , which is equivalent to 70 W m 2
Table 4 shows the mean dally transpiration totals estimated from the CLATTER and that measured by the 'Hydra' for the four 16 periods and, apart from the 1983 values, the correspondence is excellent The numbers of

J Robert~ et al / 4grlcultural and Forest Meteorology 65 (1993) 175-196
Overall dai ly average contrlbuhon to
canopy / t ransp l rahon
185
September 1983
July/August 1984
Aprd / May 1985
July/August 1985
Canopy level 1
t I 1 1 I J 0 10 20 3 0 4 0 5 0 6 0
"I, o f c a n o p y t r a n s p i r a t i o n
Fig 4 Estimates of the distribution of total forest transplrauon to the five canopy layers m four measurement periods
hours data available for analysis in each period was September 1983, 15, July and August 1984, 118, April and May 1985, 97, July and August 1985, 49
Dtstrtbutton of wtthm-canopy transptratton
Estimates are available of the dlstnbutton of transplraUon flux from each of
186
t - O
0
Q. t -
O L-
>,, t,,
0 C O u
O
0 I-
Q.
6 0
5 5
5 0
45
40
3 5
30
25
20
15
10
J Roberts et al / Agrwultural and Forest Meteorology 65 (1993) 175-196
July /August 1984
~ o I ° ' ~ ~ L
/
O •"
,o" 1 • ~ " O - - - - - O - - - - O / p---o---o"
/ /
/ /
. . O /
©
~" ~ O~ ~ • ~ .~ , . . .
~ 0 . . . ~ 0 -- ~ . ~ 0 ~ 0 ~
• ~ ' o . ~ . o....~. • ~ / D ~ • •
0 ,~,1 I I I I I I 6 8 10 12 14 16 18
T i m e ( h r s )
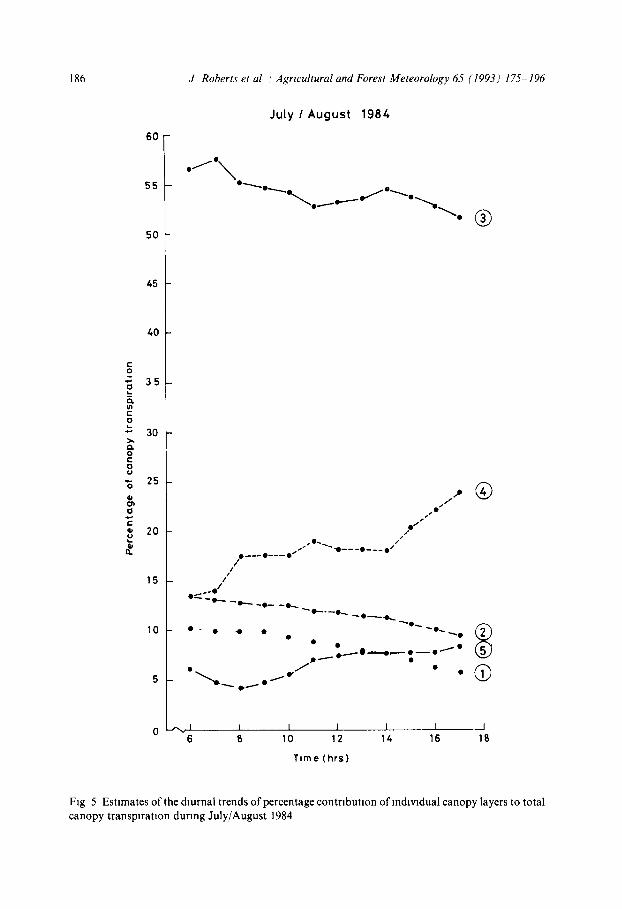
Fig 5 Estnmates of the dmrnal trends of percentage contribution of m&vldual canopy layers to total canopy transpiration during July/August 1984

J Roberts et al /Agrtcultural and Forest Meteorology 65 (1993) 175-196 187
the five forest canopy layers for each of the four study periods The &strxbu- tlon of L* and the absorption of available energy through the canopy do not change m CLATTER from one period to the next so httle varmt~on in the relative contributions of each canopy layer is expected (Fig 4) The middle layer of the canopy, which has the largest fraction of L* and has the greatest absorption of available energy, is calculated to contribute over 50% to the total canopy transpiration
F~gure 5 shows hour by hour estimates for each of the canopy layers for one of the study periods, and ln&cates a small percentage fall in the contribution of the three upper canopy layers during the day, while the contribution from the lowest two layers rises These changes in contribution are a consequence of
E
I,..-
ILl n- O LI.
Z
I-- "t- O ILl "r"
4 0
35
30
25
20
15
10
0 20 4 0 60 80 100
% O F T O T A L
Fig 6 A compar i son of the vert ical d o w n w a r d d l s t nbu t l on of cumula t ive leaf area index
(C) - - C)), t r ansp i ra t ion ( O - - Q ) and absorbed r a&a t lon (A - - - A ) for the forest at the
Reserva Ducke, Manaus , Brazil
188 J Rohert~ et al / 4grwultural and Forest Meteorolog~ 65 (1993)175 196
the fall in gs in response to atmospheric humidity deficit which is known to occur most markedly in the upper canopy (see Table 1), and is most obvious in the mid-afternoon when humidity deficits are greatest
The calculation of the net radiation allocated to each canopy layer is a function only of the L* and its vertical distribution and the light extinction coefficient Figure 6 shows that there is close similarity between the calculated pattern of cumulative canopy transpiration and that of absorbed radiation, though less similarity with cumulative L*
There is scope for improving the calculation of net radiation absorption since it is an important control on canopy transpiration, but C L A T T E R is conceived to be as simple as possible because it is unlikely that data from other tropical forest studies would have the detailed information required Studies of the sensitivity of radiation absorption of different canopy properties are rare, but a recent study by Wang and Jarvls (1990) showed that, for a con- iferous forest canopy, L* and its distribution are important but that crown shape and leaf inclination angle are less so
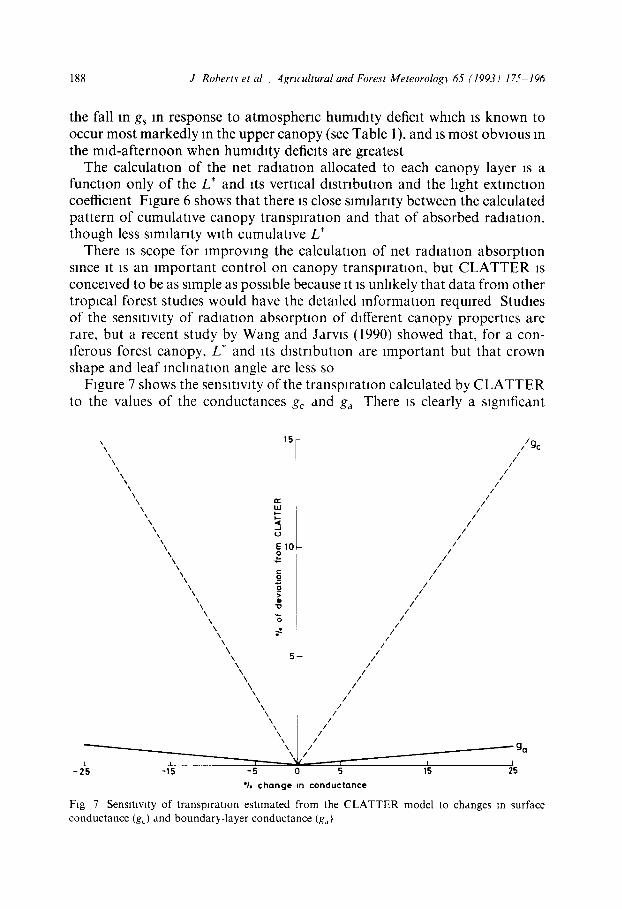
Figure 7 shows the sensitivity of the transpiration calculated by C L A T T E R to the values of the conductances gc and ga There is clearly a significant
,,\ 151 ,," gc \ \ / I
\ / / /
", I , \ / /
\ w / \ / \ N /
\ - J / \ u /
\\ E ° 10 / / X /
\\ ~ ii
\ \ x ~ / I / \ "o /
\ "S / \ ~. /
\ / \ \ / /
\ 5 / x / \ /
\ / \ /
\ / \ /
X / \ / /
\\\ i I \ I \ / ~ ga
-2 '5 -115 - 5 0 5 1L5 25
"/, change m conductance
F~g 7 Sensitivity of transpiration estimated from the CLATTER model to changes m surface conductance (g~) and boundar~,-layer conductance (gd)

J Robert~ et a l / Agrwultural and Forest Meteorology 65 (1993) 175 196 189
sensitivity to the value of the surface conductance (g~), and hence to the value of leaf area index, L*, or the stomatal conductance, gs In contrast the calcu- lated transpiration is insensitive to the value of the boundary-layer conduc- tance, ga Examination of the sensitivity of the estimated transpiration to the meteorological variables (Fig 8) shows that uncertainties In the value of net radiation are more important than are those in specific humidity deficit or temperature
Figure 9 shows comparisons between transpiration measured using the 'Hydra' and that estimated from five different transpiration models, Includ- ing CLATTER While the agreement between measured transpiration and that estimated by CLATTER is good, progressive slmphficataon of the calcu- lation procedure clearly leads to larger discrepancies with respect to measured transpiration The simplest model, Model 4, in which gs is averaged through the canopy, then multiplied by the total L*, and transpiration calculated using weather variables measured above the canopy, produces estimates of tran- spiration considerably larger than those measured Less simple models, parti- cularly those using an average of the measured mlcrochmate through the canopy, give agreement with measurements, but do not match the compar- ison given by the full canopy transpiration model The regression statistics for the relationships between measurements of transpiration made with 'Hydra" and those estimated by CLATTER and the four simplified models are given m Table 5
10 / R n
-25 -15 -5 0 S 15 25 % chonge in Rn,~)Clor To
F~g 8 Sens]tlvlty of transpiration estimated from the CLATTER model to changes m net radMtlon (Rn) specific hum]d]ty deficit (bq) and a]r temperature (T.)

190 J Roberts et al / Agrwultural and Forest Meteorology 65 (1993) 175-196
8
6
E E
~, 5 I£1 I"
4 / V- /
m / ..a / / / / / tu 3 /
0 /
2 / /
2 4 / 3 1 /
/ / / / /
/ / / / / /
/ / / / / "
/ / / / # / /
/ ,, /
/
/ / / /////
11 CLATTER
0 1 2 3 4 5 6 7 8
HYDRA (ram)
Fig 9 Comparison of transplrat~on measured with an eddy correlation device, Hydra' with that estimated by CLATTER and four simple derivatives of CLATTER, Models l 4 (see text for detads)
Discussion
The studies reported here clearly show the ablhty successfully to combine physiological data taken in a complex forest canopy with within and above- canopy measurements of the forest mlcrocllmate to provide valid estimates of forest transpiration The estimates from a multllayer calculation, such as CLATTER, for periods as short as an hour show systematic error Longer term estimates, such as over a day or week, are more accurately predicted, and this suggests such calculation procedures may well have considerable value A major constraint in using the multIlayer model for other tropical rain forests is the high demand within the model for detailed physiological and mlcroch- matlc data
Slmphfylng the model by hmlting the amount of required information on L* distribution through the canopy, and using single point values for weather variables, proved unsuccessful in this case In less complex forest canopies the

J Rohert~ et al ~' 4grl¢ultural and Forest Meteorolog~ 65 f 1993) 175 196 191
Table 5 Regression statistics for transpiration (~) estimated from a canop~ transpiration model and s~mphfied derivatives m comparison ~lth measured values ( ~ from an eddy correlation dewce Hydra
Model Equation r 2
CLATTER ~ - 0 456 + 0 896t 0 9~ (0 140) (0 044)
1 ~ - 0 6 1 1 + 1 0 4 9 x 092 10 169) (0 052)
2 ~ - 0 5 8 1 + 1 110"~ 09~ (0 164) 10 052)
~ - 0 7 3 1 + 1 258\ 091 (0 220) (0 069)
4 ~ = 0 7 7 3 + 1 311x 092 (0 214) l0 0671
Numbers in brackets are standard errors lor intercept and slope Both ~ and , are m mllhmetres per day
data reqmrements are much less stringent Roberts and Rosier (1993) for example, using data from Eucalyptus plantations m South India, found httle difference in calculated transpiration between the multllayer calculation of CLATTER and the simpler calculation procedures used here The simpler model was justified in that case because there were only small &fferences m gs through the Eucalyptus canopy Th~s meant that the gs from any of the canopy layers could be multiplied by the total L* to give the canopy conduc- tance, gc Moreover, the canopy was open and well-ventilate& and only small gradients of temperature and humidity deficit exist, thus justifying the use of single, above-canopy values of these variables
In the present study the very detailed information on within-canopy con- ductances and mlcrochmate arise from a comprehensive, multldlSclphnary experimental programme, and such sets of data are rare This ~mphes that a multi-layer calculation such as CLATTER will have only a limited role in predicting the transpiration of tropical forest using pre-existing pubhshed data This is not necessarily the case since, in the decade since the rewew by Doley (1981), a substantial number of reports have appeared giving informa- tion on aspects of the physiological behavlour of tropical forest species Detailed examination of th~s reformation ~s now warranted, particularly with regard to the magnitude of stomatal conductance and its functional relationships to weather variables such as solar radiation and vapour pres- sure deficit In contrast, much less new data has emerged on L* and on its vertical distribution in tropical forests~ and on the behavlour of mlcrochmate through forests It is the shortage of this type of information which most seriously limits the usefulness of through canopy calculation models such as CLATTER However, it may well be possible to determine the form of the within-canopy normahsed profiles of parameters such as temperature and

192 J Roberts et al I Agrt~ultural and Forest Meteorology 65 (1993) 175 196
humidity deficit as empirical functions of the parameter measured over the forest or in a nearby clearing, an approach which seems likely to be a worth- while research area for the future
In recent years, measurements of temperature and humidity deficit gradi- ents through vegetation canopies have recorded the existence of upward fluxes of latent heat which are counter to the measured gradients inside the canopy (e g Denmead and Bradley, 1985), Implying that concentration gradient, diffusion theory (K theory) IS not appropriate to describe exchange processes within canopies (e g Raupach and Flnnlgan, 1988, Raupach, 1989) This is not a problem in the present case for C L A T T E R (in which the t radmonal gradient diffusion mechanism is assumed), because measured values of tem- perature and humidity deficit are used to calculate transpiration at each level There is, therefore, no need to separately model to predict these variables, see, for example Raupach (1989) Such predictions of within-canopy mlcrochmate would be preferable, and may be necessary, m situations where data are not as complete as in this study This remains to be evaluated
Because there is good agreement between the values of transpiration esti- mated by C L A T T E R and those measured, it is not surprising that an estimate of the proport ion of net radiation used in transpiration process using CLAT- TER compares well with measured ratios reported by Shuttleworth et al (1984a) and Shuttleworth (1988), who report between 75 and 80% for non- rainy days When calculated over the daylight periods for the 37 days for which C L A T T E R calculations were made m this study an average of 74 5% of the net radiation was required for transpiration This IS a relatively high value, but not unique to tropical forests Rauner (1976), for instance, gave data for temperate broadleaf stands, some of which equalled ralnforest in terms of the percentage of net radiation used In transpiration In contrast rates for coniferous forests may reach this high value only in the first part of the day, but never reach the same proport ion on a daffy basis (Jarvls et a l , 1976) and Stewart and Thorn (1973) show the ratio to be as low as 40% for Scots Pine In Thetford Forest, U K In this latter case the low value was simply owing to an inherently low surface conductance, and not necessarily asso- ciated with a high soil water deficit However, in other studies depletion of soil water reserves is associated with lowered use of net radiation for forest tran- spiration Roberts and Rosier (1993) also estimated transpiration for Euca- lyptus stands in South India and, when these were well supplied with soil water, 78% of the net radiation was used for transplratlon, even though L* was only one third that of the present ralnforest However, this ratio fell to only 17% when the soils were dry
Shuttleworth et al (1984a), commenting on their mlcrometeorologlcal measurements of transpiration, stated that the proport ion of net radiation used for transpiration by a ralnforest which is almost always well supplied with water is rarely if ever more than 75% While Jarvls et al (1976) note that

J Roberts et al /Agrtcultural and Forest Meteorology 65 (1993) 175 196 193
for irrigated farm crops the Bowen ratio ~s usually close to zero, implying that almost all the net radiation is used for transpiration The conclusion then, is that even moist ramforest stdl exerts substantial stomatal control on tran- spiration, a conclusion which the direct observations of g~ Roberts et al (1990) confirm These last authors drew attention to the fact that typically values of gs for tropical trees are not particularly high, except for the large- leaved species Gmehna and Tectona studied by Whitehead et al (1981) and Grace et al (1982) Studies of leaf water and osmotic potentials m upper canopy trees at the current Reserva Ducke study site have shown that leaf water potentml can almost reach - 4 0 MPa in the emergent species Plptadema suaveolens and up to - 3 6 MPa in Bocoa vlrldllTora an upper canopy species (J Roberts and O M R Cabral. unpublished data, 1984) These values, which are taken m mid-afternoon, are close to the turgor loss point for leaves, hence plants lowering the value of gs to restrict transpiration and prevent leaf desslcatlon clearly has an important role, even though soil water supply is apparently not hmltlng
The upper canopy layer of this forest had an L* of 0 12 and is treated as an horizontally homogenous entity in C L A T T E R This is a slmphficat~on as this canopy layer comprises the crowns of emergent trees which are spatially separated This wdl mean that the absorption of net radiation by trees in this layer and consequently the radmtlon levels reaching the layer below will be a function of the dimensions of the emergent trees' canopies, the spacing between emergent trees and sun angles Because of the rather low level of L* In the upper canopy layer no attempts have been made to account for the spatial heterogeneity in the 24 upper canopy level within C L A T T E R However, the configuration of emergent tree canopies can vary widely between ram forests and it is planned that derived versions of C L A T T E R wdl take account of discontinuous upper canopy layers Physiological and mlcrometeorologlcal data are becoming available for this development from a study m a rain forest near Maraba, Para, Brazil This is one of the rain forest sites of the ODA-suppor ted A B R A C O S (Anglo Brazlhan Amazonian Climate Observa- tion Study) project operated by the Insmute of Hydrology and collaborating Brazilian institutes A particular feature of th~s forest are Brazil nut trees (Bertholletla excelsa) which largely compose a distinct emergent layer The horizontal spatml separation between individual emergent trees is much greater than observed at the Reserva Ducke, Manaus The Brazil nut trees can have crowns up to 70 m m diameter and are roughl ' /spherical m shape Prehmlnary observations show that above-canopy radmtlon is s,~bstantlally attenuated by these densely follated crowns leading to a large variation in the radmtlon reaching the sub-emergent tree layer In this case it will be necessary to use a more sophisticated treatment of radmt~on absorption by the upper canopy layer in C L A T T E R
In summary, the main points arising from this study are that through

194 J Robertv et a l / Agrt~ultural and Forest Meteorolog~ 65 (1993) 175 196
canopy calculations of transpiration from basic plant physiological and microchmatic information closely matches measured whole canopy transpira- tion, but that calculations made with simpler models are less good
Conclusions
The multi-layer canopy transpiration model (CLATTER) gives good pre- diction of transpiration from tropical rain forest when compared with the eddy correlation device 'Hydra' on an hourly basis There is however diver- gence early and late in the daylight period probably because CLATTER makes no allowance for changes m heat storage in the forest Averaging over daily periods improves the prediction of transpiration such that esti- mates from CLATTER and 'Hydra' measurements differ by only a few per- cent
The rlgour of the model supports the assumptions made in it namely the values of fresh to dry weight ratios and specific leaf areas used to derive a canopy profile of L* from hterature values and the extinction coefficient of net radiation extinction (0 6) which was used Studies of the sensitivity of CLAT- TER to likely errors of inputted variables revealed the greater importance of g~, L* and Rn with 6q and T d less ~mportant CLATTER is msensttlve to large errors in ga
The data requirements for CLATTER could not be reduced without gen- erating overestimates in transpiration The most simple model which uses canopy averages of stomatal and boundary-layer conductances multiphed by total L* and above-canopy values only of bq and Td overestimated tran- spiration by up to 50%
Acknowledgements
This study was supported financially by the Natural Environment Research Council, British Council and CNPq, Brazil The work reported here was part of a multldIsciphnary experiment hosted by the Instltuto Nacaonal de Pesqul- sis da Amazonia (INPA) We thank the Director and Vice-Director for their hospitality and support, the Director, EMBRAPA for providing invaluable help, particularly with transport
References
Da Concelcao, P N , 1977 Alguns aspectos ecofislologlcos de floresta tropical umlda de terra hrme Acta Amazomca, 7 157- 178
Denmead, O T and Bradley, E F , 1985 Flux-gradient relationships m a forest canopy In B A Hutchinson and B B Hicks (Ednors), The Forest Atmosphere Interacuon Reldel Dordrecht pp 421 442

J Roberts et al , Agricultural and Forest Meteorologi 65 (1993) 175-196 195
Doley, D , 1981 Tropical and subtropical forests and woodlands In T T Koslowskl (Editor), Water Deficits and Plant Growth, Vol 7 Academic Press, New York, pp 1 47
Gash, J H C and Stewart, J B, 1975 The average surface resistance of a pine forest derived from Bowen ratio measurements Boundary-Layer Meteorol 8 453- 464
Grace J , Okah D U U and Fasehun, F E , 1982 Stomatal conductance of two tropical trees during the wet season in Nigeria J Appl Ecol, 19 659 -670
JarvJs, P G James, G B and Landsberg, J J , 1976 Coniferous Forest In J L Montelth (Editor), Vegetation and the Atmosphere Vol 2 Academic Press, London, pp 171-240
Khnge, H 1973 Struktur und artenrelchtum des zentralamazomschen Regenwaldes Amazonlana, 4 283 292
Khnge, H , Rodrlques, W A , Brunlg E and Flttkau, E J , 1975 Blomass and structure m a central Amazonian Rain Forest In F B Golley and E Medina (Editors) Tropical Ecological Systems Trends m Terrestrial and Aquatic Research Springer, Berhn, pp 115 122
Landsberg J J 1986 Physiological Ecology of Forest Production Academic Press, London McWllllam, A L C Roberts J Cabral, O M R LeltaO, M V B R Da-Costa, A C L, Maltelh,
G T and Zamparonl, C A G P , 1993 Leaf area index and above-ground blomass of terra firme ralnforest and adjacent clearings in Amazoma Functional Ecol 7 (in press)
Medina, E and Khnge, H 1983 Productivity of tropical forests and tropical woodlands In O L Lange, P S Nobel, C B Osmond and H Zlegler (Editors), Encyclopaedia of Plant Physiology, Volume 12D Physiological Plant Ecolog~ IV Ecosystem Processes Mineral Cvchng Productiv- ity, and Man s Influence Springer, Berlin pp 281 303
Montelth, J L , 1965 Evaporation and environment In The State and Movement of Water in Llwng Orgamsms Proc 19th Syrup Soc Exp Blol Swansea 1964 Cambridge Umverslty Press, Cam- bridge, pp 205 234
Mooney H A , Bjorkman, O , Hall, A E , Medina, E and Tomhnson, P B, 1980 The study of the physiological ecolog~ of tropical plants current status and needs Blosclence, 30 22-26
Moore C J and Flsch, G F , 1986 Estimating heat storage m Amazonian tropical forest Agrlc For Meteorol ,38 147 169
Oberbauer, S F , Strata B R and Relchers G H , 1987 Field water relations of a wet tropical tree species Penta~lethra ma~roloba Oecologla, 71 369 374
Rauner, J L , 1976 Deciduous forest In J L Montelth (Editor) Vegetation and the Atmosphere Vol 2 Academic Press London, pp 241 264
Raupach M R 1989 Stand overstorey processes Philosophical Transactions of the Royal Society London, Series B, 324 175 190
Raupach M R and Flnmgan, J J , 1988 Single-layer models of evaporation from plant canopies are incorrect but useful, whereas multllayer models are correct but useless discuss Aust J Plant Physlol 15 705 716
Roberts, J and Ros~er, P T W 1993 Physiological studies m young Eucalyptus stands in southern India and derived estimates of forest transpiration Agrlc Water Manage, (m press)
Roberts, J , Cabral, O M R and Agular, L de F 1990 Stomatal and boundary-layer conductances m an Amazonian terra firme ramforest J Appl Ecol, 27 336-353
Sellers, P J , Shuttleworth, W J Dorman, J L , Dalcher, A and Roberts, J M , 1989 Cahbratlng the simple biosphere model for Amazonian tropical forest using field and remote sensing data J Appl Meteorol, 28 727 759
Shuttleworth, W J , 1988 Evaporation from Amazonian ramforest Proceedings of the Royal So- ciety London Series B 233 321 346
Shuttleworth, W J . Gash, J H C , Lloyd, C R , Moore, C J , Roberts, J M Marques, A O Flsch, G F de Paula Silva, V Rlbelro, M N G Mohon, L C B, Abreu Sa, L D , Nobre, J C , Cabral, O M R , Patel, S R and de Moraes, J C 1984a Eddy correlation measurements of energy partition for Amazonian forest Q J R Meteorol Soc 110 1143 1162
Shuttleworth W J Gash J H C Lloyd C R Moore C J Roberts, J M , Marques, A O Flsch,

196 J Roberts et al , Agrz~ultural and Forest Meteorologl 65 (1993) 175 196
G F , de Paula Silva, V , Rlbelro, M N G , Mohon, L C B Abreu Sa, L D , Nobre J C , Cabral, O M R , Patel, S R and de Moraes, J C , 1984b Observations of radiation exchange above and below Amazoman forest Q J R Meteorol Soc, 110 1143 1162
Stewart, J B and Thorn, A S, 1973 Energy budgets m pine forest Q J R Meteorol Soc, 99 154 170
Wang, Y P and Jarvls P G , 1990 Influence of crown structural properties on PAR absorption photosynthesis, and transpiration m Sitka spruce apphcatlon of a model (MAESTRO) Tree Physlol 7 297-316
Whitehead, D , Okah D U U and Fasehun F E , 1981 Stomatal response to environmental vari- ables in two tropical forest species during the dry season m Nigeria J Appl Ecol, 18 571 587