transnational reproduction and its discontents - journal of global
TRANSCRIPT
Flexible Design Analysis of Automated GPS Certification & Accreditation Tools
Dietrich Falkenthal, [email protected]
ABSTRACT
This paper explores a two-stage flexible certification and accreditation (C&A) design approach for the Global Positioning System’s information systems. For these systems, labor intensive processes contribute significantly to overall cost. Uncertainty about the level of effort required by C&A for a specific system makes overall cost prediction difficult. For example, a sensitive system may require twice the level of effort as an unclassified open system. Over time, the unclassified system may transition to a more sensitive system status, thereby increasing future C&A costs. Transition to automated C&A approaches greatly reduces the associated labor costs and provides opportunities for flexibly reacting to uncertainty. Specifically, if automated software tools are implemented in a phased approach, the impact of future uncertainty can be reduced. The results of this analysis indicate that automated tools will reduce cost and, furthermore, a flexible approach for developing a new tool or for adapting an existing tool both show savings over a manual approach. A binomial lattice analysis further shows that the level of effort uncertainty may be considerable over successive periods, mostly because the systems vary greatly.
Note: This paper analyzes a current real issue using partially fabricated data and skewed processes. Real data was not necessarily releasable by the GPS JPO. However, the methods proposed by this ap-proach are the same when applied to the real data. The GPS JPO is currently transitioning from the manual DITSCAP process to the automated tool DIACAP process and may decide to use the methods proposed in this analysis.
Flexible Design Analysis of Automated GPS C&A Tools
TABLE OF CONTENTS
ABSTRACT .............................................................................................................. 1 1. CERTIFICATION & ACCREDITATION OF GPS INFORMATION SYSTEMS ............... 3
1.1 INTRODUCTION................................................................................................... 3 1.2 APPROACH ........................................................................................................ 3 1.3 REGULATORY MOTIVATION ..................................................................................... 3 1.4 TOOL REQUIREMENTS ........................................................................................... 4
2. DEFINING THE SALIENT UNCERTAINTIES .......................................................... 5 2.1 C&A LEVEL OF EFFORT UNCERTAINTY......................................................................... 6
3. DEFINING SYSTEM DESIGNS TO BE ANALYZED .................................................. 7 3.1 NEW TOOL ........................................................................................................ 7 3.2 ADAPT EMASS................................................................................................... 8 3.3 MANUAL C&A COMPLETION .................................................................................... 8
4. TWO STAGE DECISION ANALYSIS OF ALTERNATIVE DESIGNS ........................... 9 4.1 COST ANALYSIS................................................................................................ 10 4.2 DECISION TREE ANALYSIS (MANUAL C&A PROCESS)..................................................... 11 4.3 DECISION TREE ANALYSIS (NEW C&A SOFTWARE TOOL)................................................ 13 4.4 ADAPT EMASS DESIGN ALTERNATIVE ...................................................................... 15
5. LATTICE ANALYSIS OF C&A LEVEL OF EFFORT UNCERTAINTY EVOLUTION....... 18 5.1 BACKGROUND ON BINOMIAL LATTICE ANALYSIS ........................................................... 18 5.2 APPLICATION TO GPS C&A .................................................................................. 18
6. RECOMMENDATIONS ........................................................................................ 21 APPENDIX A: LIST OF ACRONYMS ....................................................................... 22 APPENDIX B: DEFINITIONS................................................................................. 23
Page 2 of 23
Flexible Design Analysis of Automated GPS C&A Tools
Page 3 of 23
1. CERTIFICATION & ACCREDITATION OF GPS INFORMATION SYSTEMS
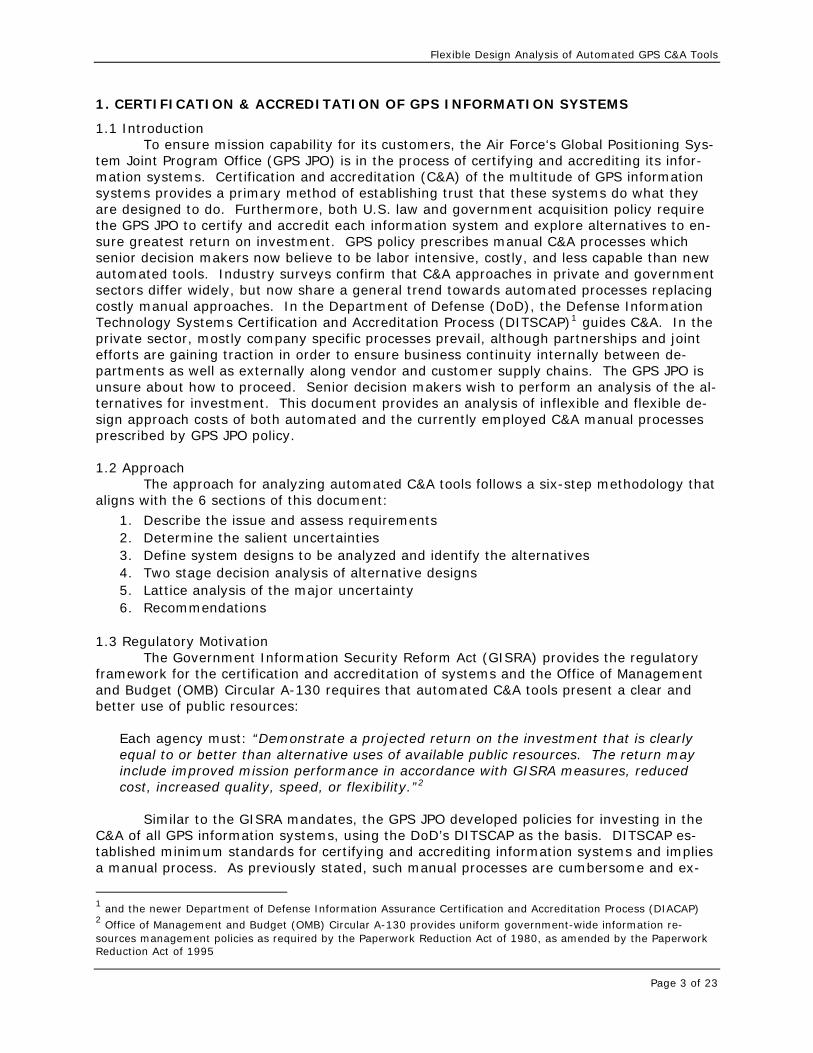
1.1 Introduction To ensure mission capability for its customers, the Air Force‘s Global Positioning Sys-
tem Joint Program Office (GPS JPO) is in the process of certifying and accrediting its infor-mation systems. Certification and accreditation (C&A) of the multitude of GPS information systems provides a primary method of establishing trust that these systems do what they are designed to do. Furthermore, both U.S. law and government acquisition policy require the GPS JPO to certify and accredit each information system and explore alternatives to en-sure greatest return on investment. GPS policy prescribes manual C&A processes which senior decision makers now believe to be labor intensive, costly, and less capable than new automated tools. Industry surveys confirm that C&A approaches in private and government sectors differ widely, but now share a general trend towards automated processes replacing costly manual approaches. In the Department of Defense (DoD), the Defense Information Technology Systems Certification and Accreditation Process (DITSCAP)1 guides C&A. In the private sector, mostly company specific processes prevail, although partnerships and joint efforts are gaining traction in order to ensure business continuity internally between de-partments as well as externally along vendor and customer supply chains. The GPS JPO is unsure about how to proceed. Senior decision makers wish to perform an analysis of the al-ternatives for investment. This document provides an analysis of inflexible and flexible de-sign approach costs of both automated and the currently employed C&A manual processes prescribed by GPS JPO policy. 1.2 Approach
The approach for analyzing automated C&A tools follows a six-step methodology that aligns with the 6 sections of this document:
1. Describe the issue and assess requirements 2. Determine the salient uncertainties 3. Define system designs to be analyzed and identify the alternatives 4. Two stage decision analysis of alternative designs 5. Lattice analysis of the major uncertainty 6. Recommendations
1.3 Regulatory Motivation
The Government Information Security Reform Act (GISRA) provides the regulatory framework for the certification and accreditation of systems and the Office of Management and Budget (OMB) Circular A-130 requires that automated C&A tools present a clear and better use of public resources:
Each agency must: “Demonstrate a projected return on the investment that is clearly equal to or better than alternative uses of available public resources. The return may include improved mission performance in accordance with GISRA measures, reduced cost, increased quality, speed, or flexibility.”2
Similar to the GISRA mandates, the GPS JPO developed policies for investing in the
C&A of all GPS information systems, using the DoD’s DITSCAP as the basis. DITSCAP es-tablished minimum standards for certifying and accrediting information systems and implies a manual process. As previously stated, such manual processes are cumbersome and ex-
1 and the newer Department of Defense Information Assurance Certification and Accreditation Process (DIACAP) 2 Office of Management and Budget (OMB) Circular A-130 provides uniform government-wide information re-sources management policies as required by the Paperwork Reduction Act of 1980, as amended by the Paperwork Reduction Act of 1995
Flexible Design Analysis of Automated GPS C&A Tools
pensive compared to the new generation of automated C&A tools now offered in the private sector. Therefore, the GPS JPO is examining alternatives that will streamline and shorten the time required to complete the C&A of their systems. Acquisition of automated certifica-tion and accreditation tools may significantly decrease the costs and reduce the time needed to certify and accredit a system.
An automated certification and accreditation tool will help the GPS JPO meet its IT
security obligations by:
• providing cost savings
• improving efficiency in certifying and accrediting GPS systems
• reducing technical errors in the C&A of GPS systems
• establishing GPS expertise in C&A of systems
• standardizing GPS C&A processes and products across the JPO
1.4 Tool Requirements
Based on discussions with GPS staff, specific C&A tool requirements are key to a suc-cessful cost-benefits analysis:
• The selected tool should lower the total costs associated with current C&A processes.
• The tool should support automated C&A processes and lower the total labor costs.
• The tool should be implementable in an incremental fashion or time-phased schedule without loss of core functionality.
• The tool should be interoperable with current tools during a transition period.
• The tool should be sustainable through the use of widely adopted data standards, hardware independence, and other such interoperability measures.
Page 4 of 23
Flexible Design Analysis of Automated GPS C&A Tools
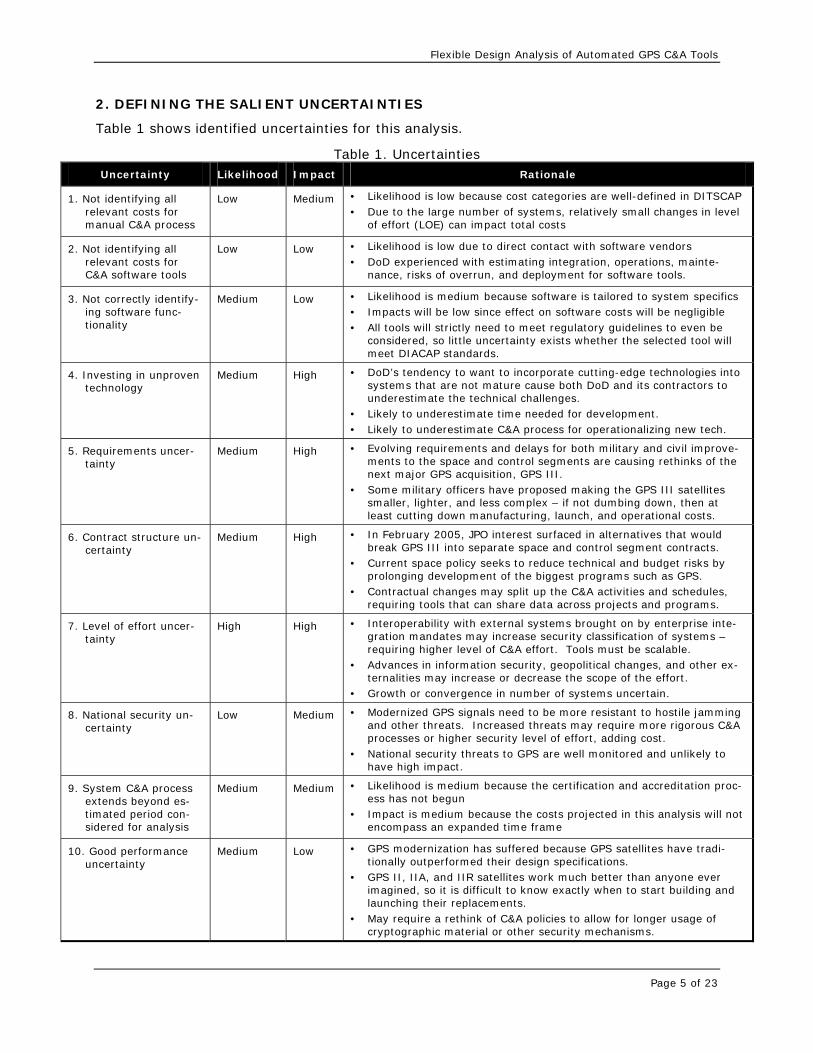
2. DEFINING THE SALIENT UNCERTAINTIES
Table 1 shows identified uncertainties for this analysis.
Table 1. Uncertainties Uncertainty Likelihood Impact Rationale
1. Not identifying all relevant costs for manual C&A process
Low Medium • Likelihood is low because cost categories are well-defined in DITSCAP • Due to the large number of systems, relatively small changes in level
of effort (LOE) can impact total costs
2. Not identifying all relevant costs for C&A software tools
Low Low • Likelihood is low due to direct contact with software vendors • DoD experienced with estimating integration, operations, mainte-
nance, risks of overrun, and deployment for software tools.
3. Not correctly identify-ing software func-tionality
Medium Low • Likelihood is medium because software is tailored to system specifics • Impacts will be low since effect on software costs will be negligible • All tools will strictly need to meet regulatory guidelines to even be
considered, so little uncertainty exists whether the selected tool will meet DIACAP standards.
4. Investing in unproven technology
Medium High • DoD’s tendency to want to incorporate cutting-edge technologies into systems that are not mature cause both DoD and its contractors to underestimate the technical challenges.
• Likely to underestimate time needed for development. • Likely to underestimate C&A process for operationalizing new tech.
5. Requirements uncer-tainty
Medium High • Evolving requirements and delays for both military and civil improve-ments to the space and control segments are causing rethinks of the next major GPS acquisition, GPS III.
• Some military officers have proposed making the GPS III satellites smaller, lighter, and less complex – if not dumbing down, then at least cutting down manufacturing, launch, and operational costs.
6. Contract structure un-certainty
Medium High • In February 2005, JPO interest surfaced in alternatives that would break GPS III into separate space and control segment contracts.
• Current space policy seeks to reduce technical and budget risks by prolonging development of the biggest programs such as GPS.
• Contractual changes may split up the C&A activities and schedules, requiring tools that can share data across projects and programs.
7. Level of effort uncer-tainty
High High • Interoperability with external systems brought on by enterprise inte-gration mandates may increase security classification of systems – requiring higher level of C&A effort. Tools must be scalable.
• Advances in information security, geopolitical changes, and other ex-ternalities may increase or decrease the scope of the effort.
• Growth or convergence in number of systems uncertain.
8. National security un-certainty
Low Medium • Modernized GPS signals need to be more resistant to hostile jamming and other threats. Increased threats may require more rigorous C&A processes or higher security level of effort, adding cost.
• National security threats to GPS are well monitored and unlikely to have high impact.
9. System C&A process extends beyond es-timated period con-sidered for analysis
Medium Medium • Likelihood is medium because the certification and accreditation proc-ess has not begun
• Impact is medium because the costs projected in this analysis will not encompass an expanded time frame
10. Good performance uncertainty
Medium Low • GPS modernization has suffered because GPS satellites have tradi-tionally outperformed their design specifications.
• GPS II, IIA, and IIR satellites work much better than anyone ever imagined, so it is difficult to know exactly when to start building and launching their replacements.
• May require a rethink of C&A policies to allow for longer usage of cryptographic material or other security mechanisms.
Page 5 of 23
Flexible Design Analysis of Automated GPS C&A Tools
Page 6 of 23
Classifications of low, medium, and high likelihood and impact for each uncertainty in Table 1 were generated from data gathered from interaction with experts, including GPS personnel familiar with GPS information systems, MITRE and DoD staff familiar with auto-mated C&A tools, commercial software vendors, and other federal agencies experience, where appropriate. 2.1 C&A Level of Effort Uncertainty
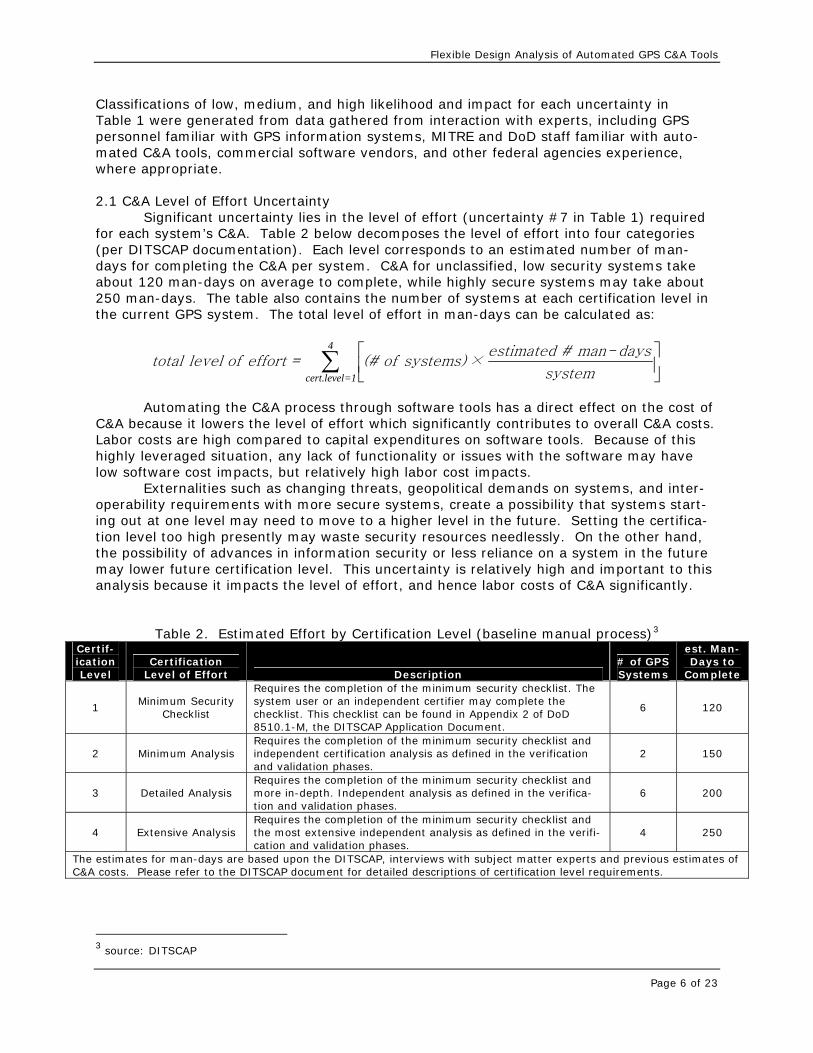
Significant uncertainty lies in the level of effort (uncertainty #7 in Table 1) required for each system’s C&A. Table 2 below decomposes the level of effort into four categories (per DITSCAP documentation). Each level corresponds to an estimated number of man-days for completing the C&A per system. C&A for unclassified, low security systems take about 120 man-days on average to complete, while highly secure systems may take about 250 man-days. The table also contains the number of systems at each certification level in the current GPS system. The total level of effort in man-days can be calculated as:
4
cert.level=1
⎡ ⎤⎢ ⎥⎣ ⎦
∑ estimated # man-daystotal level of effort = (# of systems) ×
system
Automating the C&A process through software tools has a direct effect on the cost of
C&A because it lowers the level of effort which significantly contributes to overall C&A costs. Labor costs are high compared to capital expenditures on software tools. Because of this highly leveraged situation, any lack of functionality or issues with the software may have low software cost impacts, but relatively high labor cost impacts.
Externalities such as changing threats, geopolitical demands on systems, and inter-operability requirements with more secure systems, create a possibility that systems start-ing out at one level may need to move to a higher level in the future. Setting the certifica-tion level too high presently may waste security resources needlessly. On the other hand, the possibility of advances in information security or less reliance on a system in the future may lower future certification level. This uncertainty is relatively high and important to this analysis because it impacts the level of effort, and hence labor costs of C&A significantly.
Table 2. Estimated Effort by Certification Level (baseline manual process)3 Certif-ication Level
Certification Level of Effort Description
# of GPS Systems
est. Man-Days to
Complete
1 Minimum Security
Checklist
Requires the completion of the minimum security checklist. The system user or an independent certifier may complete the checklist. This checklist can be found in Appendix 2 of DoD 8510.1-M, the DITSCAP Application Document.
6 120
2 Minimum Analysis Requires the completion of the minimum security checklist and independent certification analysis as defined in the verification and validation phases.
2 150
3 Detailed Analysis Requires the completion of the minimum security checklist and more in-depth. Independent analysis as defined in the verifica-tion and validation phases.
6 200
4 Extensive Analysis Requires the completion of the minimum security checklist and the most extensive independent analysis as defined in the verifi-cation and validation phases.
4 250
The estimates for man-days are based upon the DITSCAP, interviews with subject matter experts and previous estimates of C&A costs. Please refer to the DITSCAP document for detailed descriptions of certification level requirements.
3 source: DITSCAP
Flexible Design Analysis of Automated GPS C&A Tools
Page 7 of 23
3. DEFINING SYSTEM DESIGNS TO BE ANALYZED
With knowledge of the salient uncertainties for this C&A analysis, possible alternative designs may now be analyzed. Customers generally know their systems well and provide a great starting place for gaining insight into possible alternatives. Taking this advice, we turn to an email correspondence from the deputy director Air Force CIO to his lead Gener-als:4
We identified two options: 1) build a C&A management tool, similar to that available with eMASS, or 2) invest in the required infra-structure to stand up the Air Force version of eMASS. While both op-tions are costly, they provide a standardized approach to C&A manage-ment coupled with an enterprise C&A workflow tool. Our intent is to find the best way ahead, considering cost and functionality. Until the conclusion of our cost/benefit analysis, request you place a moratorium on the purchase of commercial-off-the-shelf C&A prod-ucts. In addition, if you already procured/developed a C&A support tool, those products must be adjudicated for inclusion to the Infostructure.
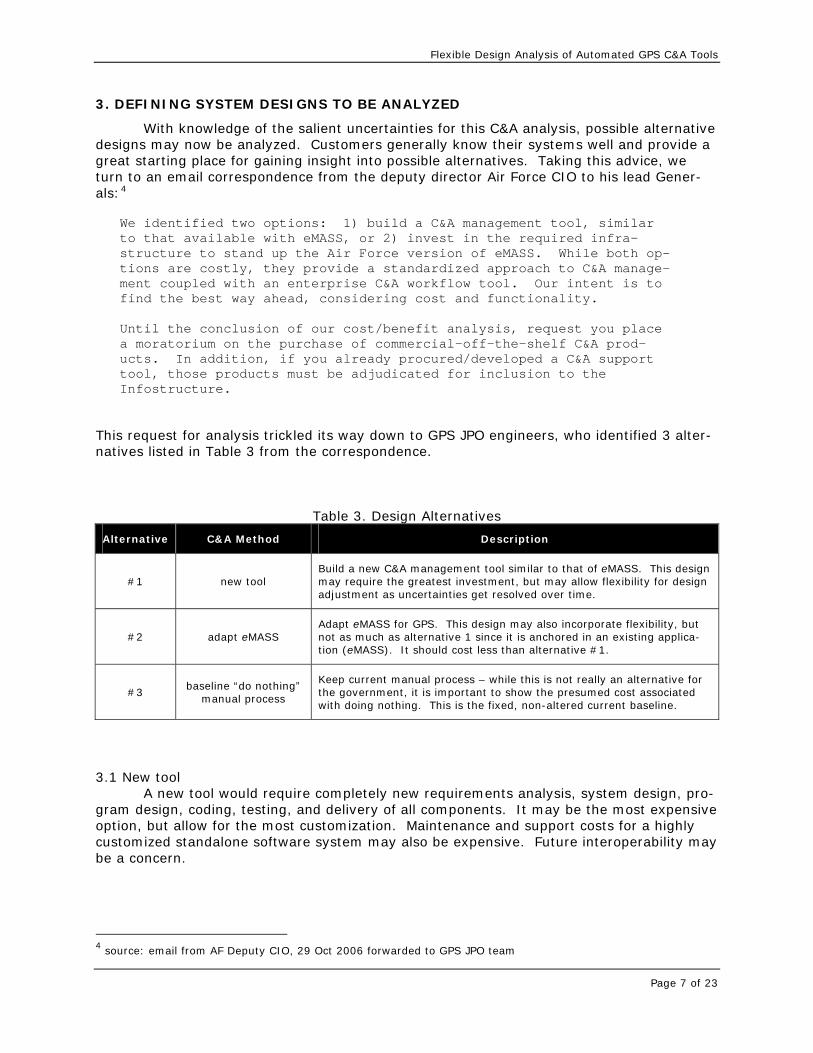
This request for analysis trickled its way down to GPS JPO engineers, who identified 3 alter-natives listed in Table 3 from the correspondence.
Table 3. Design Alternatives
Alternative C&A Method Description
#1 new tool Build a new C&A management tool similar to that of eMASS. This design may require the greatest investment, but may allow flexibility for design adjustment as uncertainties get resolved over time.
#2 adapt eMASS Adapt eMASS for GPS. This design may also incorporate flexibility, but not as much as alternative 1 since it is anchored in an existing applica-tion (eMASS). It should cost less than alternative #1.
#3 baseline “do nothing”
manual process
Keep current manual process – while this is not really an alternative for the government, it is important to show the presumed cost associated with doing nothing. This is the fixed, non-altered current baseline.
3.1 New tool A new tool would require completely new requirements analysis, system design, pro-gram design, coding, testing, and delivery of all components. It may be the most expensive option, but allow for the most customization. Maintenance and support costs for a highly customized standalone software system may also be expensive. Future interoperability may be a concern.
4 source: email from AF Deputy CIO, 29 Oct 2006 forwarded to GPS JPO team
Flexible Design Analysis of Automated GPS C&A Tools
3.2 Adapt eMASS
The Enterprise Mission Assurance Support System, or eMASS, is an existing Air Force wide C&A tool that is operational for other programs. It is a government-owned, Commer-cial-off-the-Shelf (COTS) software based C&A solution that could be adapted for GPS. It has the benefit of already being interoperable with other tools. Also, it is purposefully designed to be flexible for future upgrades and changes. The following are brief descriptions of the eMASS automated C&A tool:
• eMASS Web Certification and Accreditation is a government developed package that facilitates and automates the security certification and accreditation process. The product leads the user through a step-by-step process that identifies risk and as-sesses network and system configuration compliance with the DITSCAP and other applicable regulations.
• eMASS provides a mechanism to approach the C&A process with a greater degree of
flexibility. eMASS’ functionality includes the ability to explain and distribute security directives, handbooks, and detailed technical security configuration guidelines and security best practices to system administrators across the GPS program. eMASS also provides a flexible platform for future growth within the Office of Cyber Security.
3.3 Manual C&A Completion
Manual C&A completion is defined by current GPS policy guidance. Table 2 on page 6 lists the estimated man-days required to certify and accredit an information system at the levels defined in the DITSCAP using a manual process. This alternative is the least costly initially, but as stated above, is not an option for the government because it does not meet minimum capability needs.
Page 8 of 23
Flexible Design Analysis of Automated GPS C&A Tools
Page 9 of 23
4. TWO STAGE DECISION ANALYSIS OF ALTERNATIVE DESIGNS
Many Chief Information Officers cautiously plan out information system investments for the near term and rarely commit beyond 1½ to 2 years out.5 Uncertainty about business and technology conditions beyond this time frame make such investments risky. Risk may be lowered through time phased strategies which delay investment decisions until uncertainties are resolved and the quality of decisions are improved. For this analysis, a single stage and two stage decision analysis will show if it is fiscally worthwhile to pay for design flexibility. The method for accomplishing this is by:
• Conducting a cost analysis of building a new tool, adapting eMASS, or maintaining manual procedures that takes into account the fixed software costs and the variable labor hours associated with use of each tool during the C&A process.
• Analyze cost impact for immediate decision (first stage) and for second stage decision at 2 year mark.
• Analyze probabilities of cost going up or down due to uncertainty.
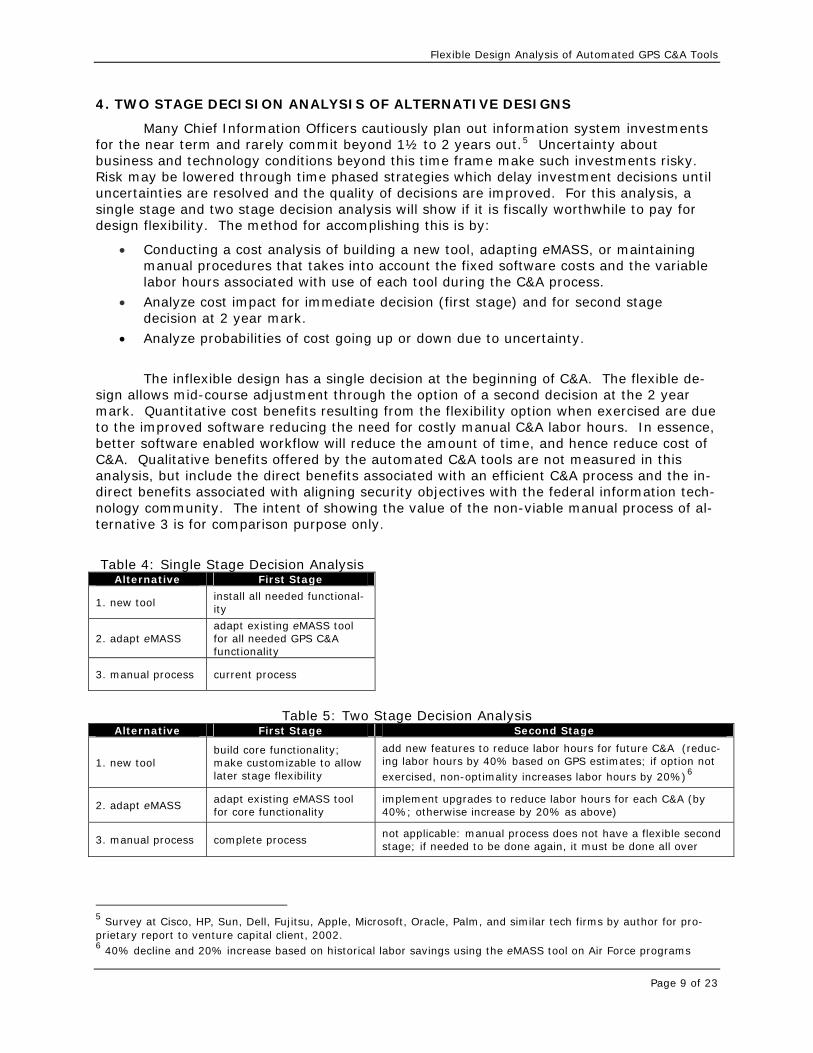
The inflexible design has a single decision at the beginning of C&A. The flexible de-sign allows mid-course adjustment through the option of a second decision at the 2 year mark. Quantitative cost benefits resulting from the flexibility option when exercised are due to the improved software reducing the need for costly manual C&A labor hours. In essence, better software enabled workflow will reduce the amount of time, and hence reduce cost of C&A. Qualitative benefits offered by the automated C&A tools are not measured in this analysis, but include the direct benefits associated with an efficient C&A process and the in-direct benefits associated with aligning security objectives with the federal information tech-nology community. The intent of showing the value of the non-viable manual process of al-ternative 3 is for comparison purpose only.
Table 4: Single Stage Decision Analysis Alternative First Stage
1. new tool install all needed functional-ity
2. adapt eMASS adapt existing eMASS tool for all needed GPS C&A functionality
3. manual process current process
Table 5: Two Stage Decision Analysis
Alternative First Stage Second Stage
1. new tool build core functionality; make customizable to allow later stage flexibility
add new features to reduce labor hours for future C&A (reduc-ing labor hours by 40% based on GPS estimates; if option not exercised, non-optimality increases labor hours by 20%)6
2. adapt eMASS adapt existing eMASS tool for core functionality
implement upgrades to reduce labor hours for each C&A (by 40%; otherwise increase by 20% as above)
3. manual process complete process not applicable: manual process does not have a flexible second stage; if needed to be done again, it must be done all over
5 Survey at Cisco, HP, Sun, Dell, Fujitsu, Apple, Microsoft, Oracle, Palm, and similar tech firms by author for pro-prietary report to venture capital client, 2002. 6 40% decline and 20% increase based on historical labor savings using the eMASS tool on Air Force programs
Flexible Design Analysis of Automated GPS C&A Tools
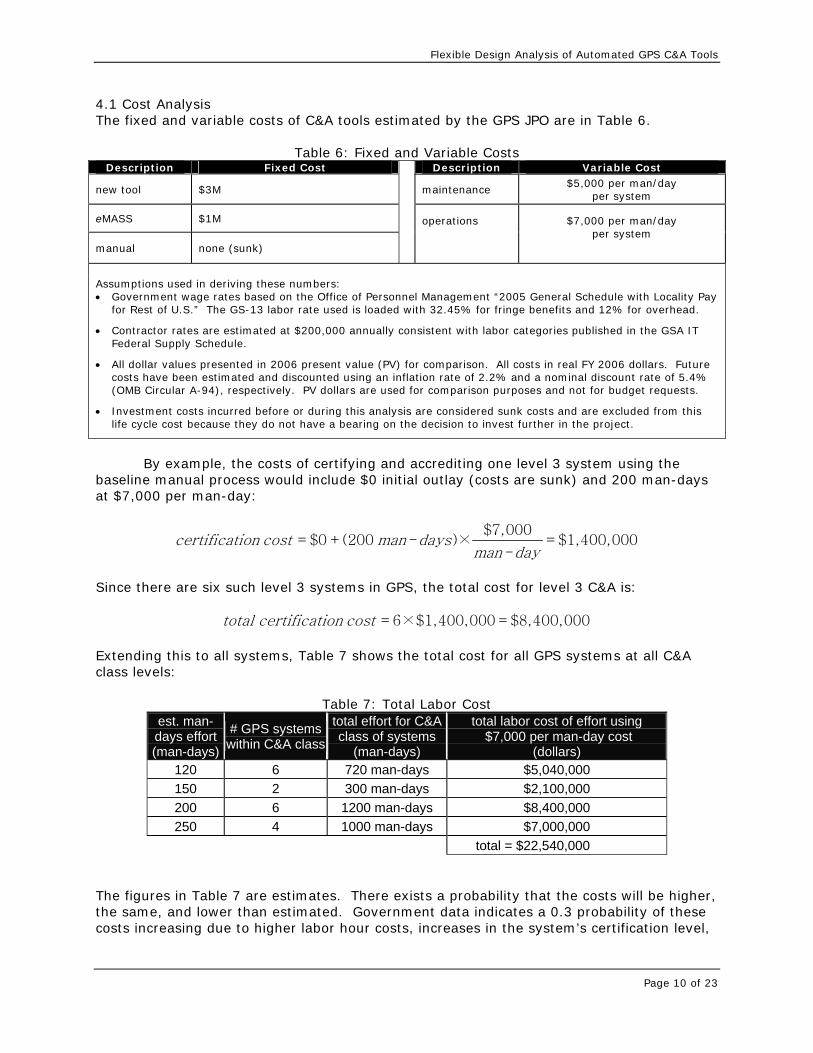
4.1 Cost Analysis The fixed and variable costs of C&A tools estimated by the GPS JPO are in Table 6.
Table 6: Fixed and Variable Costs
Description Fixed Cost Description Variable Cost
new tool $3M maintenance $5,000 per man/day
per system
eMASS $1M
manual none (sunk)
operations
$7,000 per man/day per system
Assumptions used in deriving these numbers: • Government wage rates based on the Office of Personnel Management “2005 General Schedule with Locality Pay
for Rest of U.S.” The GS-13 labor rate used is loaded with 32.45% for fringe benefits and 12% for overhead.
• Contractor rates are estimated at $200,000 annually consistent with labor categories published in the GSA IT Federal Supply Schedule.
• All dollar values presented in 2006 present value (PV) for comparison. All costs in real FY 2006 dollars. Future costs have been estimated and discounted using an inflation rate of 2.2% and a nominal discount rate of 5.4% (OMB Circular A-94), respectively. PV dollars are used for comparison purposes and not for budget requests.
• Investment costs incurred before or during this analysis are considered sunk costs and are excluded from this life cycle cost because they do not have a bearing on the decision to invest further in the project.
By example, the costs of certifying and accrediting one level 3 system using the
baseline manual process would include $0 initial outlay (costs are sunk) and 200 man-days at $7,000 per man-day:
certification cost man-daysman-day
$7,000 = $0 + (200 )× =$1,400,000
Since there are six such level 3 systems in GPS, the total cost for level 3 C&A is:
total certification cost = 6×$1,400,000=$8,400,000 Extending this to all systems, Table 7 shows the total cost for all GPS systems at all C&A class levels:
Table 7: Total Labor Cost est. man-days effort (man-days)
# GPS systems within C&A class
total effort for C&A class of systems
(man-days)
total labor cost of effort using $7,000 per man-day cost
(dollars) 120 6 720 man-days $5,040,000 150 2 300 man-days $2,100,000 200 6 1200 man-days $8,400,000 250 4 1000 man-days $7,000,000
total = $22,540,000 _ The figures in Table 7 are estimates. There exists a probability that the costs will be higher, the same, and lower than estimated. Government data indicates a 0.3 probability of these costs increasing due to higher labor hour costs, increases in the system’s certification level,
Page 10 of 23
Flexible Design Analysis of Automated GPS C&A Tools
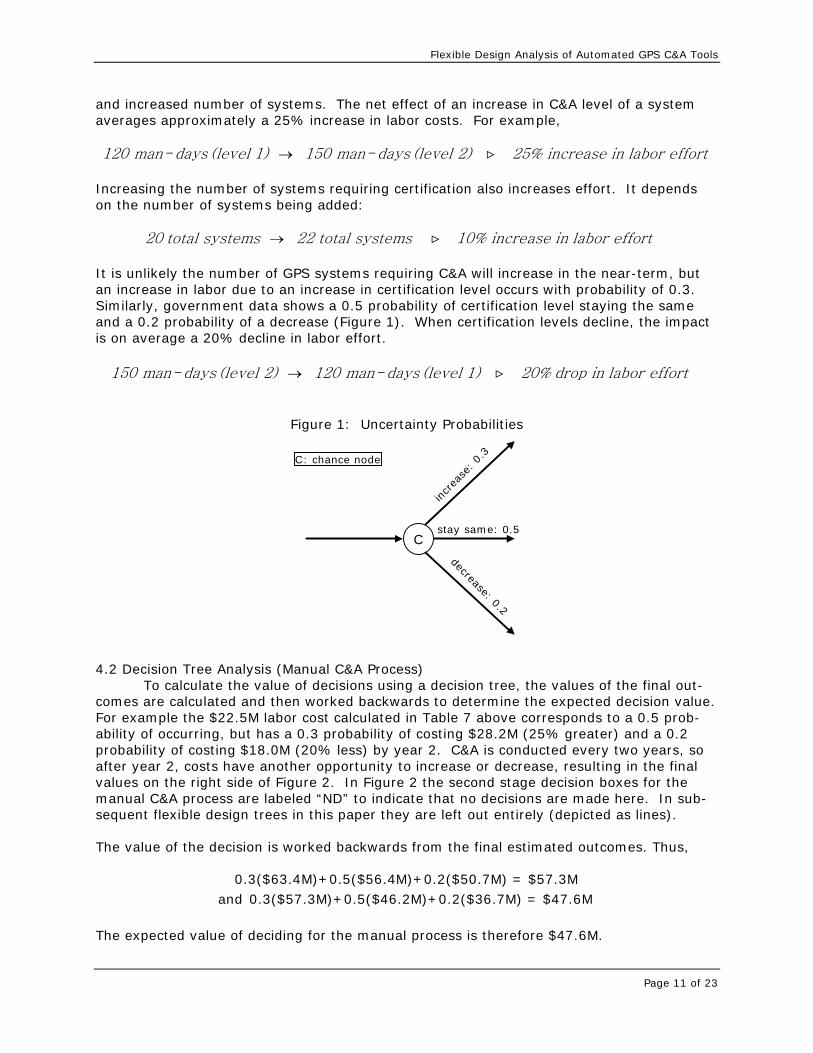
and increased number of systems. The net effect of an increase in C&A level of a system averages approximately a 25% increase in labor costs. For example,
→120 man-days (level 1) 150 man-days (level 2) 25% increase in labor effort
Increasing the number of systems requiring certification also increases effort. It depends on the number of systems being added:
→20 total systems 22 total systems 10% increase in labor effort
It is unlikely the number of GPS systems requiring C&A will increase in the near-term, but an increase in labor due to an increase in certification level occurs with probability of 0.3. Similarly, government data shows a 0.5 probability of certification level staying the same and a 0.2 probability of a decrease (Figure 1). When certification levels decline, the impact is on average a 20% decline in labor effort.
→150 man-days (level 2) 120 man-days (level 1) 20% drop in labor effort
Figure 1: Uncertainty Probabilities
C
increa
se: 0
.3
decrease: 0.2
stay same: 0.5
C: chance node
4.2 Decision Tree Analysis (Manual C&A Process)
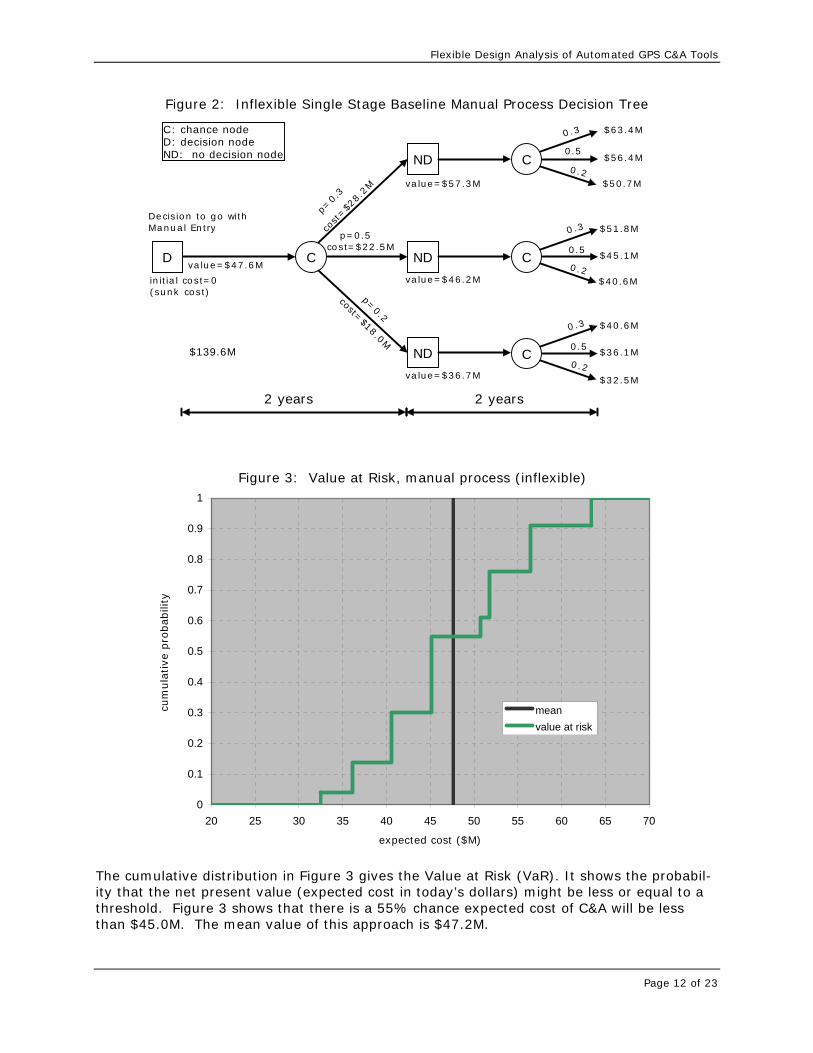
To calculate the value of decisions using a decision tree, the values of the final out-comes are calculated and then worked backwards to determine the expected decision value. For example the $22.5M labor cost calculated in Table 7 above corresponds to a 0.5 prob-ability of occurring, but has a 0.3 probability of costing $28.2M (25% greater) and a 0.2 probability of costing $18.0M (20% less) by year 2. C&A is conducted every two years, so after year 2, costs have another opportunity to increase or decrease, resulting in the final values on the right side of Figure 2. In Figure 2 the second stage decision boxes for the manual C&A process are labeled “ND” to indicate that no decisions are made here. In sub-sequent flexible design trees in this paper they are left out entirely (depicted as lines). The value of the decision is worked backwards from the final estimated outcomes. Thus,
0.3($63.4M)+0.5($56.4M)+0.2($50.7M) = $57.3M and 0. 3($57.3M)+0.5($46.2M)+0.2($36.7M) = $47.6M
The expected value of deciding for the manual process is therefore $47.6M.
Page 11 of 23
Flexible Design Analysis of Automated GPS C&A Tools
Page 12 of 23
Figure 2: Inflexible Single Stage Baseline Manual Process Decision Tree
D C ND
ND
ND
C
C
C
Decision to go withManual Entry
p=0.
3
$56.4M
$63.4M
$36.1M
p=0.2
p=0.5
$139.6M
2 years 2 years
C: chance nodeD: decision nodeND: no decision node
0.3
0.5
0.2
0.2
0.5
0.5
0.2
0.3
0.3
$50.7M
$51.8M
$45.1M
$40.6M
$40.6M
$32.5M
value=$57.3M
value=$46.2M
value=$36.7M
value=$47.6M
cost=$22.5M
cost=$2
8.2M
cost=$18.0M
initia l cost=0(sunk cost)
Figure 3: Value at Risk, manual process (inflexible)
0
0.1
0.2
0.3
0.4
0.5
0.6
0.7
0.8
0.9
1
20 25 30 35 40 45 50 55 60 65 70
expected cost ($M)
cum
ula
tive
pro
bab
ility
meanvalue at risk
The cumulative distribution in Figure 3 gives the Value at Risk (VaR). It shows the probabil-ity that the net present value (expected cost in today’s dollars) might be less or equal to threshold. Figure 3 shows that there is a 55% chance expe
a cted cost of C&A will be less
than $45.0M. The mean value of this approach is $47.2M.
Flexible Design Analysis of Automated GPS C&A Tools
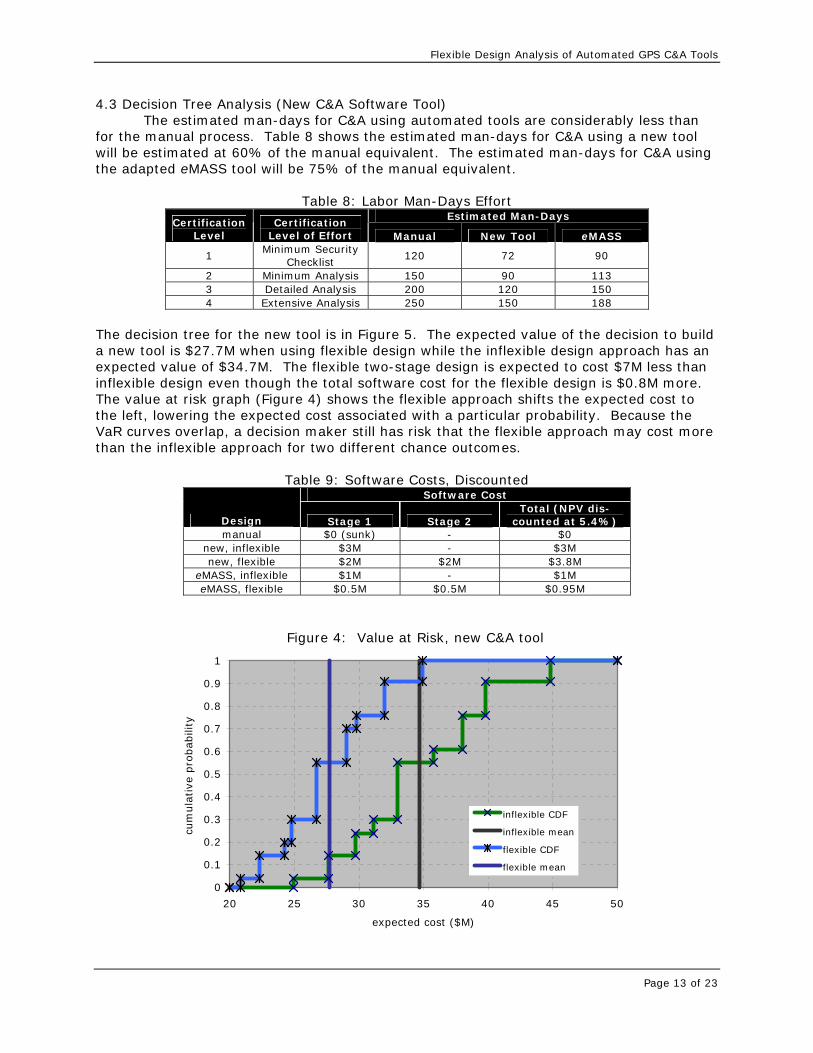
4.3 Decision Tree Analysis (New C&A Software Tool) The estimated man-days for C&A using automated tools are considerably less than
for the manual process. Table 8 shows the estimated man-days for C&A using a new tool will be estimated at 60% of the manual equivalent. The estimated man-days for C&A using the adapted eMASS tool will be 75% of the manual equivalent.
Table 8: Labor Man-Days Effort Estimated Man-Days
Certification Level
Certification Level of Effort Manual New Tool eMASS
1 Minimum Security
Checklist 120 72 90
2 Minimum Analysis 150 90 113 3 Detailed Analysis 200 120 150 4 Extensive Analysis 250 150 188
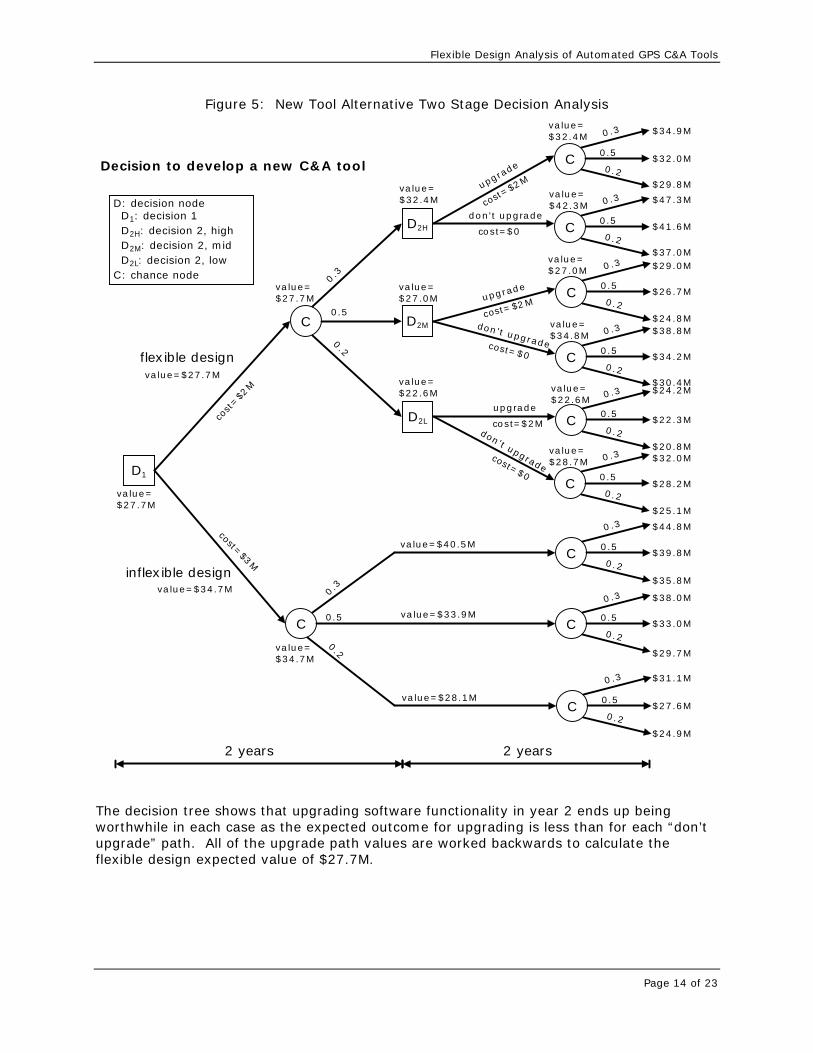
The decision tree for the new tool is in Figure 5. The expected value of the decision to build a new tool is $27.7M when using flexible design while the inflexible design approach has an expected value of $34.7M. The flexible two-stage design is expected to cost $7M less than inflexible design even though the total software cost for the flexible design is $0.8M more. The value at risk graph (Figure 4) shows the flexible approach shifts the expected cost to the left, lowering the expected cost associated with a particular probability. Because the VaR curves overlap, a decision maker still has risk that the flexible approach may cost more than the inflexible approach for two different chance outcomes.
Table 9: Software Costs, Discounted Software Cost
Design Stage 1 Stage 2 Total (NPV dis-
counted at 5.4%) manual $0 (sunk) - $0
new, inflexible $3M - $3M new, flexible $2M $2M $3.8M
eMASS, inflexible $1M - $1M eMASS, flexible $0.5M $0.5M $0.95M
Figure 4: Value at Risk, new C&A tool
0
0.1
0.2
0.3
0.4
0.5
0.6
0.7
0.8
0.9
1
20 25 30 35 40 45 50
expected cost ($M)
cum
ula
tive
pro
bab
ility
inflexible CDF
inflexible mean
flexible CDF
flexible mean
Page 13 of 23
Flexible Design Analysis of Automated GPS C&A Tools
Figure 5: New Tool Alternative Two Stage Decision Analysis
D1
C D2M
D2H
D2L
flexible design
C
inflexible design
0.5
0.2
0.3
$44.8M
value=$27.7M
value=$40.5M
value=$33.9M
value=$28.1M
value=$34.7M
C0.5
0.3
0.2
C0.5
0.3
0.2
C0.5
0.3
0.2
0.3
0.5
0.2
upgrade
don't upgrade
upgrade
upgrade
don't upgrade
don't upgrade
2 years 2 years
D: decision nodeD1: decision 1D2H: decision 2, highD2M: decision 2, midD2L: decision 2, low
C: chance node
C 0.5
0.3
0.2
C0.5
0.3
0.2
C0.5
0.3
0.2
C0.5
0.3
0.2
C0.5
0.3
0.2
C0.5
0.3
0.2
$39.8M
$35.8M
$38.0M
$33.0M
$29.7M
$31.1M
$27.6M
$24.9M
$34.9M
$32.0M
$29.8M
$41.6M
$47.3M
$37.0M$29.0M
$26.7M
$24.8M$38.8M
$34.2M
$30.4M
$22.3M
$20.8M$32.0M
$24.2M
$28.2M
$25.1M
value=$32.4M
value=$27.7M
cost=$3M
cost
=$2
M
cost=$2M
cost=$0
cost=$0
cost=$0
cost=
$2M
cost=$2M
value=$32.4M
value=$27.0M
value=$22.6M
value=$28.7M
value=$34.8M
value=$42.3M
value=$22.6M
value=$27.0M
value=$27.7M
Decision to develop a new C&A tool
value=$34.7M
The decision tree shows that upgrading software functionality in year 2 ends up being worthwhile in each case as the expected outcome for upgrading is less than for each “don’t upgrade” path. All of the upgrade path values are worked backwards to calculate the flexible design expected value of $27.7M.
Page 14 of 23
Flexible Design Analysis of Automated GPS C&A Tools
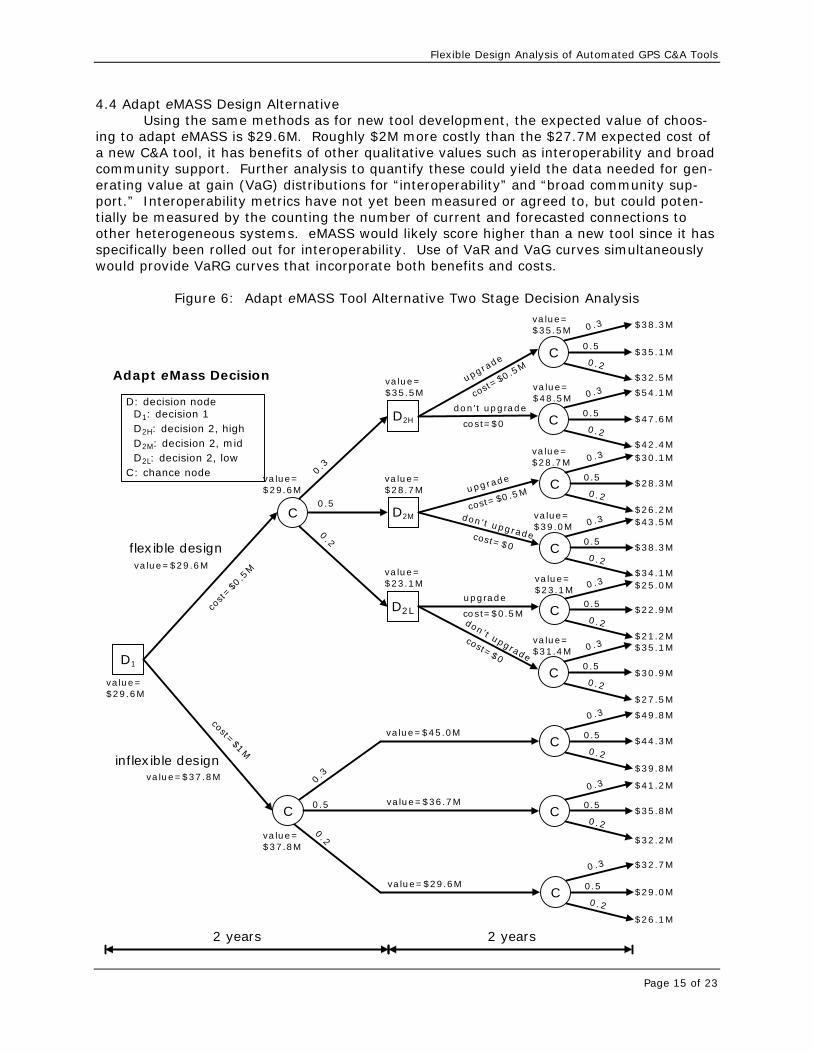
4.4 Adapt eMASS Design Alternative Using the same methods as for new tool development, the expected value of choos-ing to adapt eMASS is $29.6M. Roughly $2M more costly than the $27.7M expected cost of a new C&A tool, it has benefits of other qualitative values such as interoperability and broad community support. Further analysis to quantify these could yield the data needed for gen-erating value at gain (VaG) distributions for “interoperability” and “broad community sup-port.” Interoperability metrics have not yet been measured or agreed to, but could poten-tially be measured by the counting the number of current and forecasted connections to other heterogeneous systems. eMASS would likely score higher than a new tool since it has specifically been rolled out for interoperability. Use of VaR and VaG curves simultaneously would provide VaRG curves that incorporate both benefits and costs.
Figure 6: Adapt eMASS Tool Alternative Two Stage Decision Analysis
D1
C D2M
D2H
D2L
flexible design
C
inflexible design
0.5
0.2
0.3
$49.8M
value=$29.6M
value=$45.0M
value=$36.7M
value=$29.6M
value=$37.8M
C0.5
0.3
0.2
C0.5
0.3
0.2
C0.5
0.3
0.2
0.3
0.5
0.2
upgrade
don't upgrade
upgrade
upgrade
don't upgrade
don't upgrade
2 years 2 years
C0.5
0.3
0.2
C0.5
0.3
0.2
C0.5
0.3
0.2
C0.5
0.3
0.2
C0.5
0.3
0.2
C0.5
0.3
0.2
$44.3M
$39.8M
$41.2M
$35.8M
$32.2M
$32.7M
$29.0M
$26.1M
$38.3M
$35.1M
$32.5M
$47.6M
$54.1M
$42.4M$30.1M
$28.3M
$26.2M$43.5M
$38.3M
$34.1M
$22.9M
$21.2M$35.1M
$25.0M
$30.9M
$27.5M
value=$35.5M
value=$29.6M
cost=$1M
cost
=$0
.5M
cost=$0.5M
cost=$0
cost=$0
cost=$0
cost=
$0.5M
cost=$0.5M
value=$35.5M
value=$28.7M
value=$23.1M
value=$31.4M
value=$39.0M
value=$48.5M
value=$23.1M
value=$28.7M
value=$29.6M
Adapt eMass Decision
value=$37.8M
D: decision nodeD1: decision 1D2H: decision 2, highD2M: decision 2, midD2L: decision 2, low
C: chance node
Page 15 of 23
Flexible Design Analysis of Automated GPS C&A Tools
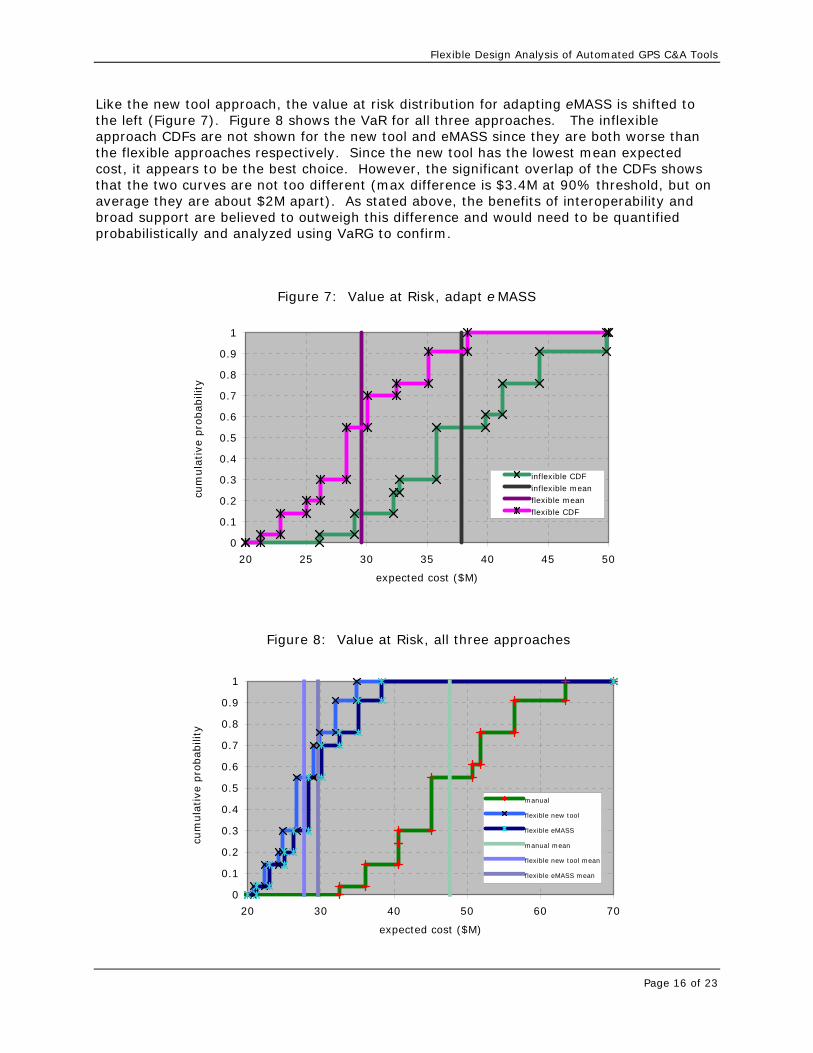
Like the new tool approach, the value at risk distribution for adapting eMASS is shifted to the left (Figure 7). Figure 8 shows the VaR for all three approaches. The inflexible approach CDFs are not shown for the new tool and eMASS since they are both worse than the flexible approaches respectively. Since the new tool has the lowest mean expected cost, it appears to be the best choice. However, the significant overlap of the CDFs shows that the two curves are not too different (max difference is $3.4M at 90% threshold, but on average they are about $2M apart). As stated above, the benefits of interoperability and broad support are believed to outweigh this difference and would need to be quantified probabilistically and analyzed using VaRG to confirm.
Figure 7: Value at Risk, adapt e MASS
0
0.1
0.2
0.3
0.4
0.5
0.6
0.7
0.8
0.9
1
20 25 30 35 40 45 50
expected cost ($M)
cum
ula
tive
pro
babili
ty
inflexible CDFinflexible meanflexible meanflexible CDF
Figure 8: Value at Risk, all three approaches
0
0.1
0.2
0.3
0.4
0.5
0.6
0.7
0.8
0.9
1
20 30 40 50 60 70
expected cost ($M)
cum
ula
tive
pro
babili
ty
manual
flexible new tool
flexible eMASS
manual mean
flexible new tool mean
flexible eMASS mean
Page 16 of 23
Flexible Design Analysis of Automated GPS C&A Tools
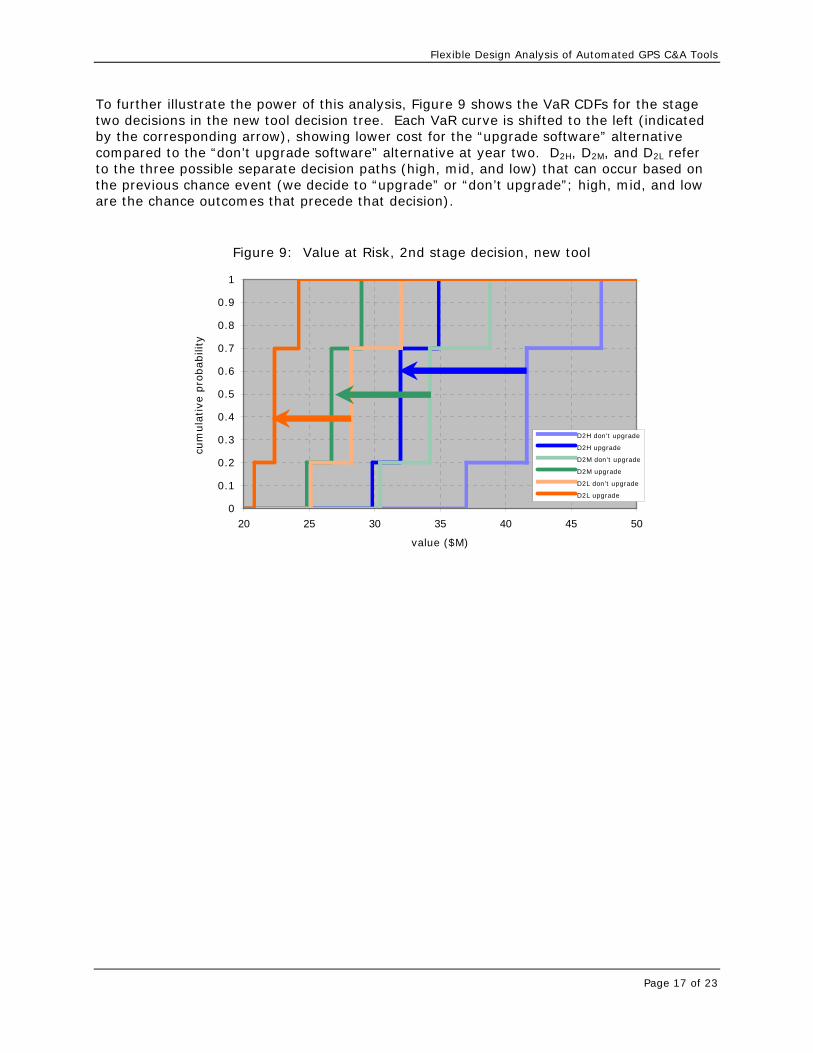
To further illustrate the power of this analysis, Figure 9 shows the VaR CDFs for the stage two decisions in the new tool decision tree. Each VaR curve is shifted to the left (indicated by the corresponding arrow), showing lower cost for the “upgrade software” alternative compared to the “don’t upgrade software” alternative at year two. D2H, D2M, and D2L refer to the three possible separate decision paths (high, mid, and low) that can occur based on the previous chance event (we decide to “upgrade” or “don’t upgrade”; high, mid, and low are the chance outcomes that precede that decision).
Figure 9: Value at Risk, 2nd stage decision, new tool
0
0.1
0.2
0.3
0.4
0.5
0.6
0.7
0.8
0.9
1
20 25 30 35 40 45 50
value ($M)
cum
ula
tive
pro
babili
ty
D2H don't upgrade
D2H upgrade
D2M don't upgrade
D2M upgrade
D2L don't upgrade
D2L upgrade
Page 17 of 23
Flexible Design Analysis of Automated GPS C&A Tools
Page 18 of 23
5. LATTICE ANALYSIS OF C&A LEVEL OF EFFORT UNCERTAINTY EVOLUTION
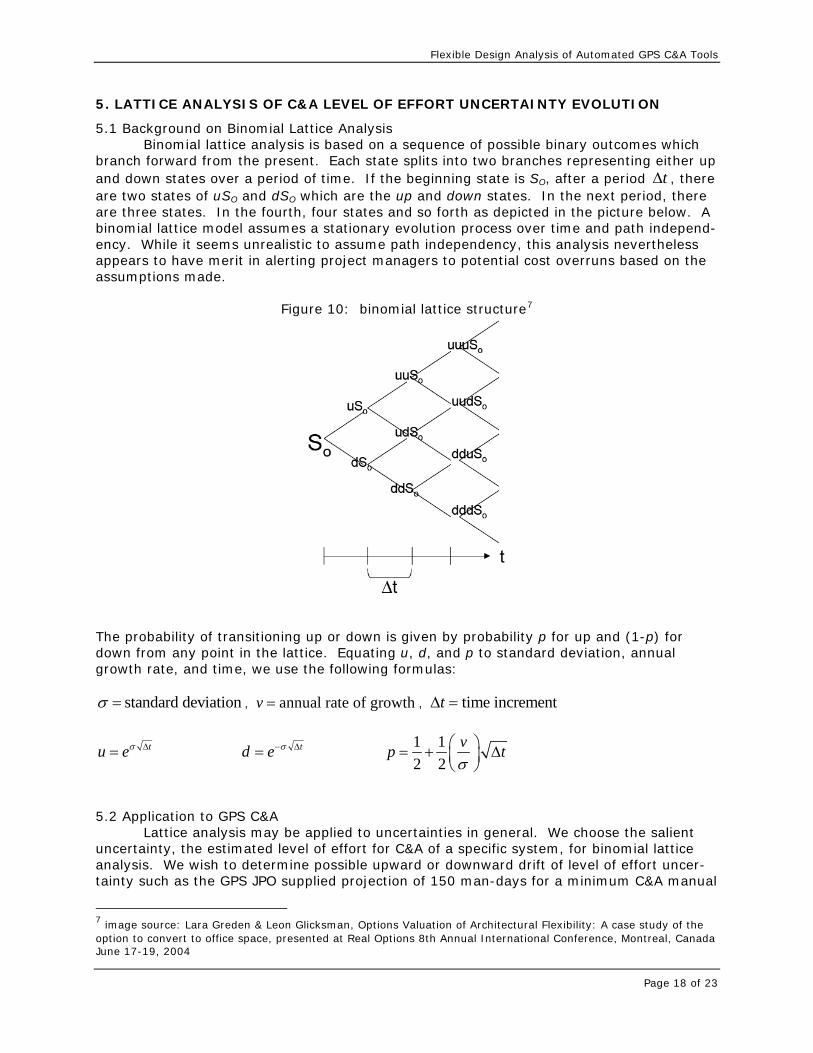
5.1 Background on Binomial Lattice Analysis Binomial lattice analysis is based on a sequence of possible binary outcomes which
branch forward from the present. Each state splits into two branches representing either up and down states over a period of time. If the beginning state is SO, after a period , there are two states of uSO and dSO which are the up and down states. In the next period, there are three states. In the fourth, four states and so forth as depicted in the picture below. A binomial lattice model assumes a stationary evolution process over time and path independ-ency. While it seems unrealistic to assume path independency, this analysis nevertheless appears to have merit in alerting project managers to potential cost overruns based on the assumptions made.
tΔ
Figure 10: binomial lattice structure7
The probability of transitioning up or down is given by probability p for up and (1-p) for down from any point in the lattice. Equating u, d, and p to standard deviation, annual growth rate, and time, we use the following formulas:
standard deviationσ = , , annual rate of growthv = time incrementtΔ =
tu eσ Δ= td e σ− Δ= 1 12 2
vp tσ⎛ ⎞= + Δ⎜ ⎟⎝ ⎠
5.2 Application to GPS C&A
Lattice analysis may be applied to uncertainties in general. We choose the salient uncertainty, the estimated level of effort for C&A of a specific system, for binomial lattice analysis. We wish to determine possible upward or downward drift of level of effort uncer-tainty such as the GPS JPO supplied projection of 150 man-days for a minimum C&A manual
7 image source: Lara Greden & Leon Glicksman, Options Valuation of Architectural Flexibility: A case study of the option to convert to office space, presented at Real Options 8th Annual International Conference, Montreal, Canada June 17-19, 2004
Flexible Design Analysis of Automated GPS C&A Tools
analysis. Is it possible that the manual approach will catch up with the automated ap-proaches by declining in cost after several iterations? The 150 man-days is after all not a hard-fast number for C&A completion – it is an average based on historical C&A process du-rations across many programs. Furthermore, the historical data indicates the standard de-viation for this number is high at 20% and the growth rate has been declining at about 2% per two year period, mainly due to improvements in efficiencies. tΔ =2 because C&A is done every 2 years. While the level of effort has been declining due to efficiency improve-ments, it has been strongly been countered by increases in system complexity and would otherwise be declining at a faster rate. The 20% standard deviation may seem high, but given that the systems being certified vary greatly in size and scope, it is plausible. Using the values for v, σ , and , we calculate the values for u, d, and p: tΔ
Table 10: Binomial Lattice Values variable value
v = -0.02 σ = 0.2 tΔ = 2
u = 1.33 d = 0.75 p = 0.43
p start = 1 value start = 150 man-days
The u and d values correspond to the rate of growth per period depending on whether an increase or decrease takes place. Using these values, we calculate the following tables us-ing an excel spreadsheet:
Table 11: Outcome Lattice OUTCOME LATTICE
150.00 199.03 264.10 350.43 464.99 616.99 818.68 113.05 150.00 199.03 264.10 350.43 464.99 85.20 113.05 150.00 199.03 264.10 64.21 85.20 113.05 150.00 48.39 64.21 85.20 36.47 48.39 27.48
Table 12: Probability Lattice PROBABILITY LATTICE
1.00 0.43 0.18 0.08 0.03 0.01 0.01 0.57 0.49 0.32 0.18 0.10 0.05 0.33 0.42 0.36 0.26 0.17 0.19 0.32 0.34 0.29 0.11 0.23 0.29 0.06 0.16 0.03
Page 19 of 23
Flexible Design Analysis of Automated GPS C&A Tools
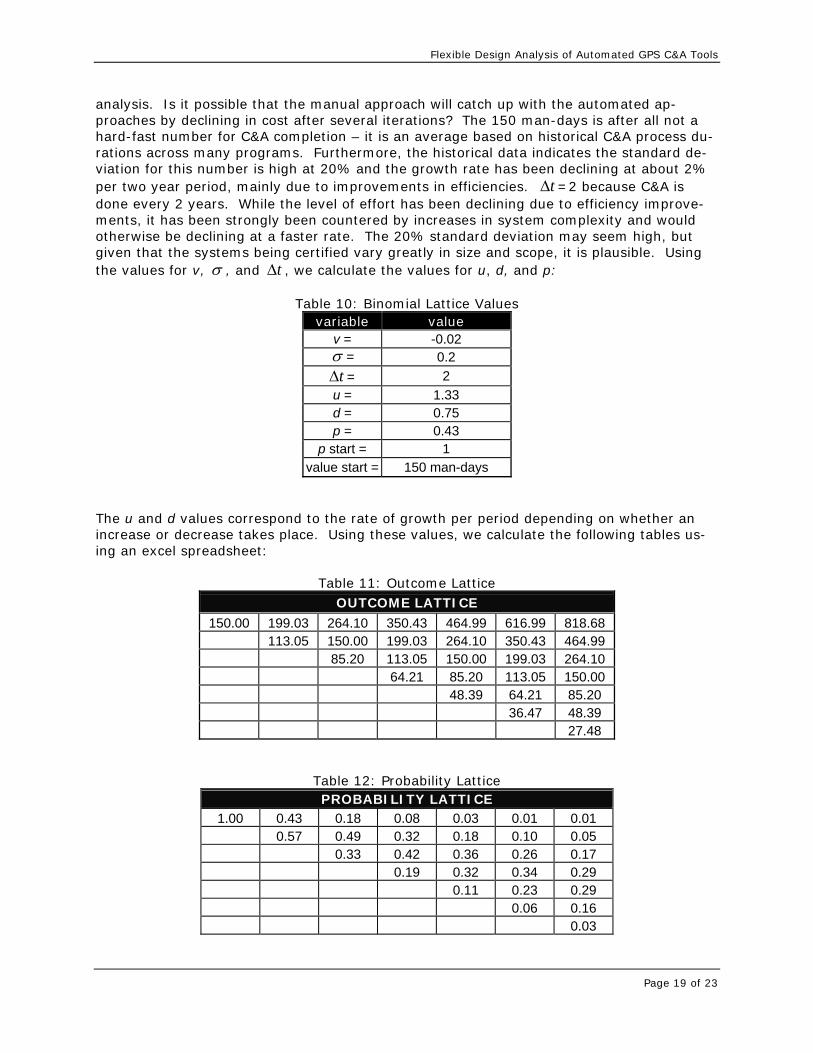
The evolution of the C&A level of effort uncertainty begins at 150 man-days and after 6 pe-riods (12 years) is projected to range from 820 man-days with 1% probability to 27 man-days with 3% probability and a most likely range of about 85 to 150 with 58% probability (29%+29%=58%). The probability density function in Figure 11 illustrates the distribution.
Figure 11: Probability Density Function for Lattice
PDF for Lattice
0.00
0.05
0.10
0.15
0.20
0.25
0.30
0.35
0 50 100 150 200 250 300 350 400 450 500
Outcome
Prob
abili
ty
Figure 11 shows the most likely level of effort for C&A will be roughly 100 to 125 man-days. The distribution is quite wide with estimates such as 50 or 300 days being more than 14% probable. Table 13 shows the average of the outcome probabilities is 149.8. These figures are useful for future planning, as they indicate that it will be improbable for the manual process to decrease to the level of effort achieved using automated tools (Table 8).
Table 13: Outcome Probabilities Outcome Prob
819 0.01 465 0.05 264 0.17 150 0.29 85 0.29 48 0.16 27 0.03
Average = 149.8
Page 20 of 23
Flexible Design Analysis of Automated GPS C&A Tools
Page 21 of 23
6. RECOMMENDATIONS
The use of automated C&A solutions will benefit the GPS JPO by reducing labor hours and hence, reducing overall cost. The application of flexible design approaches such as a decision tree with a second stage option also benefits decision makers by reducing uncer-tainty. Flexible methods appear especially useful in this type of software development or in-formation systems purchasing where uncertainty only 1 or 2 years out may be considerable. For the GPS JPO, the best choice from a quantitative cost-reduction standpoint appears to be the “develop new C&A tool” alternative using a flexible two-stage design option with up-grade at year 2. Such analysis may miss accounting for qualitative costs and benefits, how-ever. Taking into account the widespread usage, interoperability, and support eMASS fea-tures, it may be best to choose eMASS, especially since the analysis showed its expected cost is not too much different than the new tool ($29.6M vs. the $27.7M). A sensitivity analysis of the factors used in obtaining the expected values would indicate the statistical proximity of the two choices. The binomial lattice analysis reveals to decision makers that the labor hours for each C&A level are averages and not representative of a fair value for each system. Some systems may be more complex and likely will require more labor effort while others require less. The drift of the labor hours over time adds uncertainty, but we can predict the probability density function of this uncertainty. Initially I had proposed use this paper to analyze the lack of economic and organiza-tional clarity for transformation to netcentricity for the GPS JPO.8 Stated another way, the program managers were calling out for bottom-line guidance to plainly spell out “how much is transformation to netcentric principles going to cost me?” and “how to I organize my staff to achieve netcentricity?” They also wanted to know when it will cost them. Hypotheti-cally, if system A (which is not netcentric) costs x dollars, then how much will system Anetcen-
tric cost at what time? After exhaustive literature search and days of reformulating the prob-lem statement, I was not able to decompose the problem into the framework for this appli-cation portfolio. There were too many dependencies between a multitude of uncertainties that did not lend themselves to decision tree analysis or binomial lattice development. De-composition of the overall problem simplified the issues into discrete problems that should not be separated from other problems. I would like to further explore the application of flexibility in design and real options to systems of systems architecture, but it seemed too ambitious for this paper. Although this initial attempt was misdirected, it helped point out the where the use of flexible design helps and where it becomes difficult. The application to the automated C&A tools cost-benefit analysis worked well.
8 Netcentricity is a transformation enabler that empowers all users with the ability to easily discover, access, inte-grate, correlate and fuse data/information that support their mission objectives. Net-centric supports non-linear relationships and increased tempo of operations. Note that net-readiness is different from netcentricity and implies infrastructure readiness.
Flexible Design Analysis of Automated GPS C&A Tools
APPENDIX A: LIST OF ACRONYMS
C&A – certification & accreditation CDF – cumulative density function DIACAP – Defense Information Assurance Certification and Accreditation Process DITSCAP – Defense Information Technology Systems Certification and Accreditation Process DoD – Department of Defense eMASS – Enterprise Mission Assurance Support Services tool GISRA – Government Information Security Reform Act GPS – Global Positioning System JPO – Joint Program Office NIST – National Institute of Standards and Technology OMB – Office of Management and Budget VaG – value at gain VaR – value at risk VaRG – value at risk and gain
Page 22 of 23
Flexible Design Analysis of Automated GPS C&A Tools
APPENDIX B: DEFINITIONS
Accreditation (Per NIST SP 800-37): Security accreditation is the official management deci-sion given by a senior agency official to authorize operation of an information system and to explicitly accept the risk to agency operations, agency assets, or individuals based on the implementation of an agreed-upon set of security controls. Required by OMB Circular A-130, Appendix III, security accreditation provides a form of quality control and challenges man-agers and technical staff at all levels to implement the most effective security controls pos-sible in an information system, given mission requirements, technical constraints, opera-tional constraints, and cost/schedule constraints. Certification (Per NIST SP 800-37): A comprehensive assessment of the management, op-erational, and technical security controls in an information systems, made in support of se-curity accreditation, to determine the extent to which the controls are implemented cor-rectly, operating as intended, and producing the desired outcome with respect to meeting the security requirements of the system. Security certification can include a variety of as-sessment methods (e.g., interviewing, inspecting, studying, testing, demonstrating, and analyzing) and associated procedures depending on the depth and breadth of assessment required by the agency. DITSCAP: The Department of Defense Information Technology Security Certification and Accreditation Process (DITSCAP) is the standardized approach designed to guide DoD agen-cies through the certification and accreditation process for a single information technology (IT) entity. The aim is to (1) provide guidance to organizations, (2) standardize the C&A ap-proach for all services, (3) define the scope of effort, and (4) tailor documentation for all system architectures. There are four phases to the DITSCAP process. The phases are defi-nition, verification, validation, and post-accreditation. During the definition phase, all sys-tem requirements and capabilities are documented to include mission, function, and inter-faces. eMASS – Enterprise Mission Assurance Support System is a government-owned, Commer-cial-off-the-Shelf (COTS) software based C&A solution. At its core are a flexible relational database management system and a clear, easy-to-use web interface driven by decision wizards to perform complex functions and data analysis. eMASS provides a secure web-based system for automating all aspects of enterprise-wide C&A planning and operations in-cluding decisions, workflow, configurations, and relationships. GPS JPO: The Navstar Global Positioning System (GPS) Joint Program Office (JPO) is the acquisition and sustainment organization responsible for acquiring, sustainment, and opera-tion of survivable, effective, and affordable global positioning services for its customers. JPO is so named because the organization is comprised jointly of about 700 Army, Air Force, Navy, Coast Guard, and foreign military personnel. Three segments, or divisions, make up the GPS Joint Program Office. The three segments include (1) the space segment, (2) the control segment, and (3) the user equipment segment. The GPS space segment consists of the personnel that design, acquire, and build the satellites that make up the GPS constella-tion. The control segment is mostly responsible for command and control of the satellites and daily system functionality. The user segment is responsible for user equipment such as receivers on aircraft, vehicles, ships, and individual soldiers.
Page 23 of 23