transmitter pre-compensation for 320 mb/sec scsi · transmitter pre-compensation for 320 mb/sec...
TRANSCRIPT

SCSI T10 Meeting Monterey Bay ajb - Slide 111/01/99
Transmitter Pre-CompensationTransmitter Pre-Compensationfor 320 MB/sec SCSIfor 320 MB/sec SCSI
Andrew BishopQuantum Corporation

SCSI T10 Meeting Monterey Bay ajb - Slide 211/01/99
ObjectivesObjectives
! Look at two forms of transmitter pre-compensation thatmight be used for 320 MB/sec SCSI! Mathematically model timing pre-compensation
! How does timing pre-compensation help:– Isolated pulses– High frequency patterns (0, 1, 0, 1, etc.)
! Use experimental data to examine amplitude pre-compensation using realcables with real loads.! How much does amplitude pre-comp improve signal integrity?! How much amplitude pre-comp is required for:
– short cables?– long cables?
! Determine the optimum value for amplitude pre-comp
SCSI T10 Meeting Monterey Bay ajb - Slide 311/01/99
Transmitter Pre-CompensationTransmitter Pre-Compensationfor 320 MB/sec SCSIfor 320 MB/sec SCSI
Part ITiming Pre-Compensation Study
SCSI T10 Meeting Monterey Bay ajb - Slide 411/01/99
DisclaimerDisclaimer
! All data collected in this section of the presentation is basedon a simple optimistic model for SCSI signals.
! Real factors such as DC attenuation, reflections, offsets,frequency dependent skew, differential skew, etc. willdegrade performance even more than suggested.
! This simple model is used to facilitate the analysis and togain some insight into what can be expected in actualpractice.
SCSI T10 Meeting Monterey Bay ajb - Slide 511/01/99
Timing Pre-Compensation BasicsTiming Pre-Compensation Basics
! Adjust the timing of pulse edges to improve receiveramplitude noise margin and set-up time.
! If the pulse is sent earlier, then response will rise furtherpast the threshold.
! If the pulse is earlier, there is more set-up time, and lesshold time for the previous bit.
! Timing pre-comp has largest effect for an isolated pulse.! Timing pre-comp has no effect for high-frequency
patterns ( 0, 1, 0, 1, etc.).
SCSI T10 Meeting Monterey Bay ajb - Slide 611/01/99
Effect on Received AmplitudeEffect on Received Amplitude
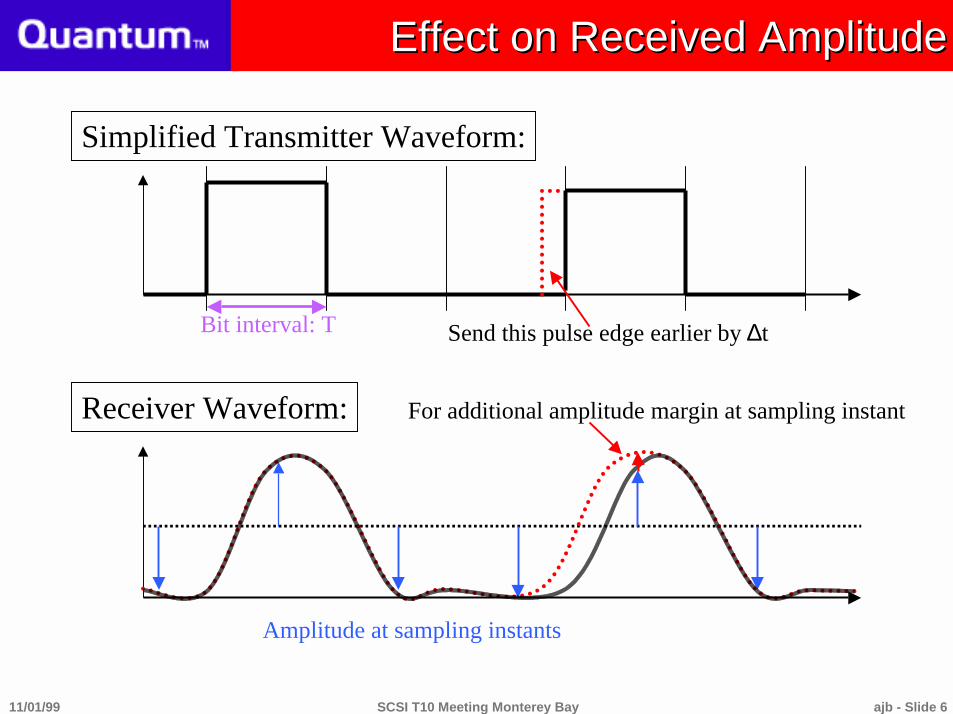
Receiver Waveform:
Simplified Transmitter Waveform:
Send this pulse edge earlier by ∆t
For additional amplitude margin at sampling instant
Amplitude at sampling instants
Bit interval: T
SCSI T10 Meeting Monterey Bay ajb - Slide 711/01/99
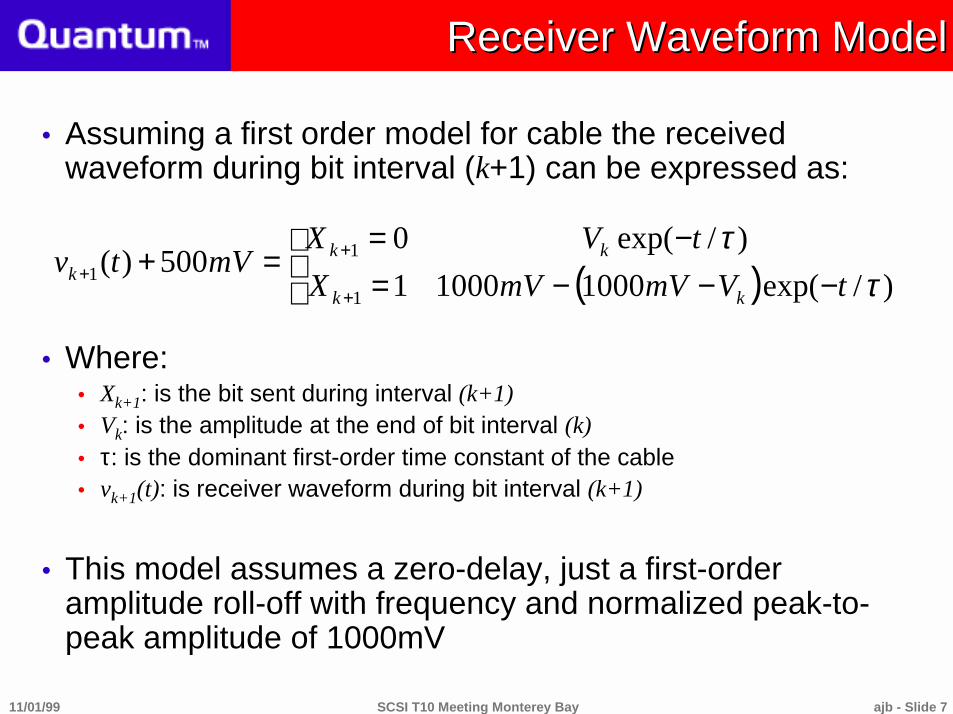
! Assuming a first order model for cable the receivedwaveform during bit interval (k+1) can be expressed as:
! Where:! Xk+1: is the bit sent during interval (k+1)! Vk: is the amplitude at the end of bit interval (k)! τ: is the dominant first-order time constant of the cable! vk+1(t): is receiver waveform during bit interval (k+1)
! This model assumes a zero-delay, just a first-orderamplitude roll-off with frequency and normalized peak-to-peak amplitude of 1000mV
( )
−−−=−=
=++
++ )/exp(100010001
)/exp(0500)(
1
11 τ
τtVmVmVX
tVXmVtv
kk
kkk
Receiver Waveform ModelReceiver Waveform Model

SCSI T10 Meeting Monterey Bay ajb - Slide 811/01/99
( )
−−−=−=
=++
++ )/exp(100010001
)/exp(0500)(
1
11 τ
τtVmVmVX
tVXmVtv
kk
kkk
tvk+1(t)
500m
-500m
(k)T (k+2)T (k+3)T(k+1)T
Xk=0 Xk+1=1 Xk+2=1 Xk+3=1
Vk
Receiver Waveform ModelReceiver Waveform Model
! This assumes several optimistic scenarios:! input is an ideal square wave! no frequency dependent time skew in cable! Output has a voltage swing of 1V (no attenuation in the cable)
SCSI T10 Meeting Monterey Bay ajb - Slide 911/01/99
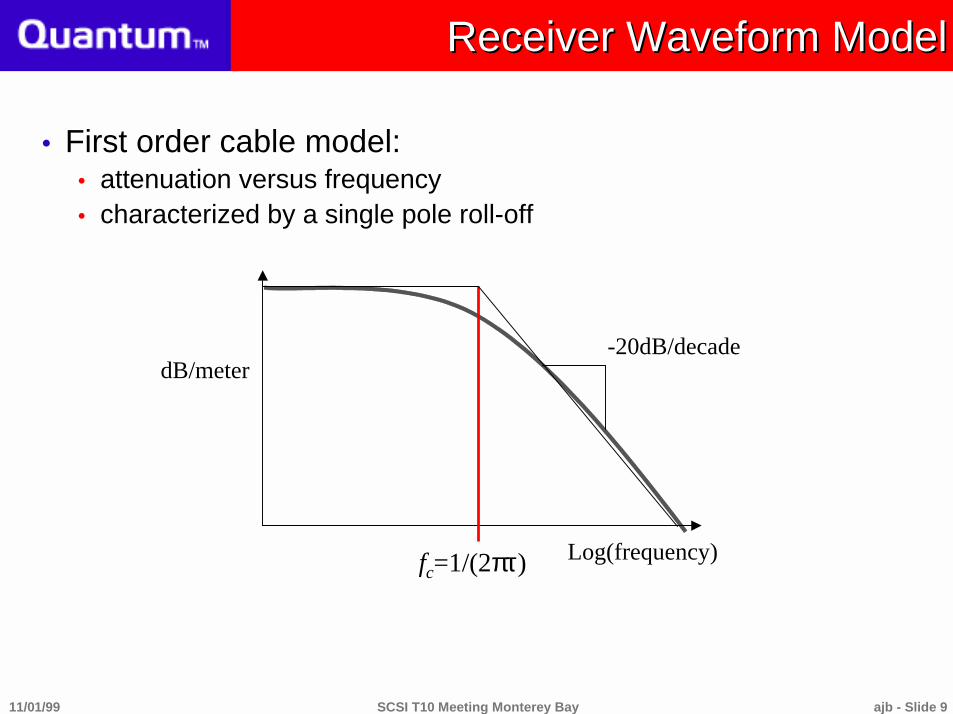
fc=1/(2πτ) Log(frequency)
dB/meter-20dB/decade
Receiver Waveform ModelReceiver Waveform Model
! First order cable model:! attenuation versus frequency! characterized by a single pole roll-off

SCSI T10 Meeting Monterey Bay ajb - Slide 1011/01/99
Pre-comp Amplitude MarginPre-comp Amplitude Margin
! Receiver input is sample of waveform at the sampling instant (Tsample)! Sampling instant defined by position of zero crossings for high frequency
pattern (de-skew).
! For worst case (isolated bit) we have:Xk-N, .. Xk = 0, Xk+1 = 1, Xk+2 = 0 ∴ Vk = 0.
! Without pre-compensation the amplitude is:
! With timing pre-comp shift (∆t) the amplitude is:
−−−=−=
=++
++ )2/exp()1000(10001
)2/exp(0500)(
1
11 τ
τ
samplekk
samplekksamplek TVmVmVX
TVXmVTv
( ) mVTmVmVTv samplesamplek 500)2/exp(10001000)(1 −−−=+ τ
( ) mVtTmVmVTv samplesamplek 500)/)(exp(10001000)(1 −∆+−−=+ τ

SCSI T10 Meeting Monterey Bay ajb - Slide 1111/01/99
Amplitude Margin is levelabove 100mV at sampling instant
Receiver AmplitudeReceiver Amplitude
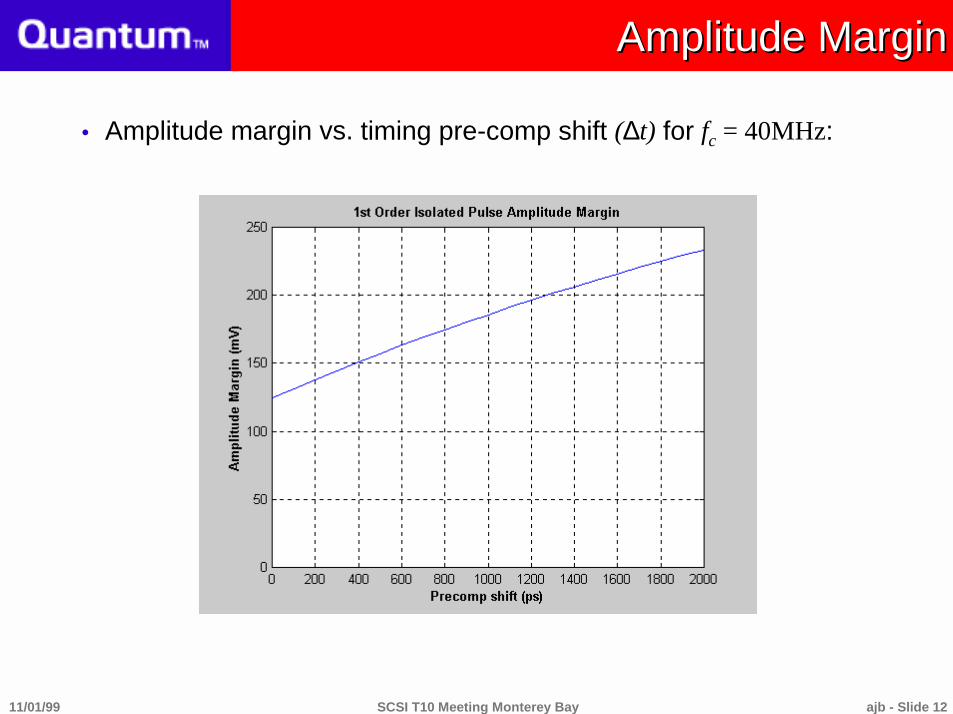
! Numerical calculations for isolated pulse:! τ ≈ 1/ (2 π 40 MHz), ∆ t = 0ps → 2ns by 500ps
SCSI T10 Meeting Monterey Bay ajb - Slide 1211/01/99
Amplitude MarginAmplitude Margin
! Amplitude margin vs. timing pre-comp shift (∆t) for fc = 40MHz:

SCSI T10 Meeting Monterey Bay ajb - Slide 1311/01/99
Amplitude Margin Improvement with Pre-CompAmplitude Margin Improvement with Pre-Comp
! Improvement in amplitude margin with timing pre-compshift ∆t for fc = 40 MHz:

SCSI T10 Meeting Monterey Bay ajb - Slide 1411/01/99
Timing Pre-comp and Set-up/Hold TimeTiming Pre-comp and Set-up/Hold Time
Receiver Waveform:
Transmitter Waveform:
Send this pulse edge earlier by ∆t
additional set-up time
Set-up/hold from sampling instant
Bit period: T
Positive threshold
Negative threshold
reduced hold time
Vth=100mV
0
-500m
500m

SCSI T10 Meeting Monterey Bay ajb - Slide 1511/01/99
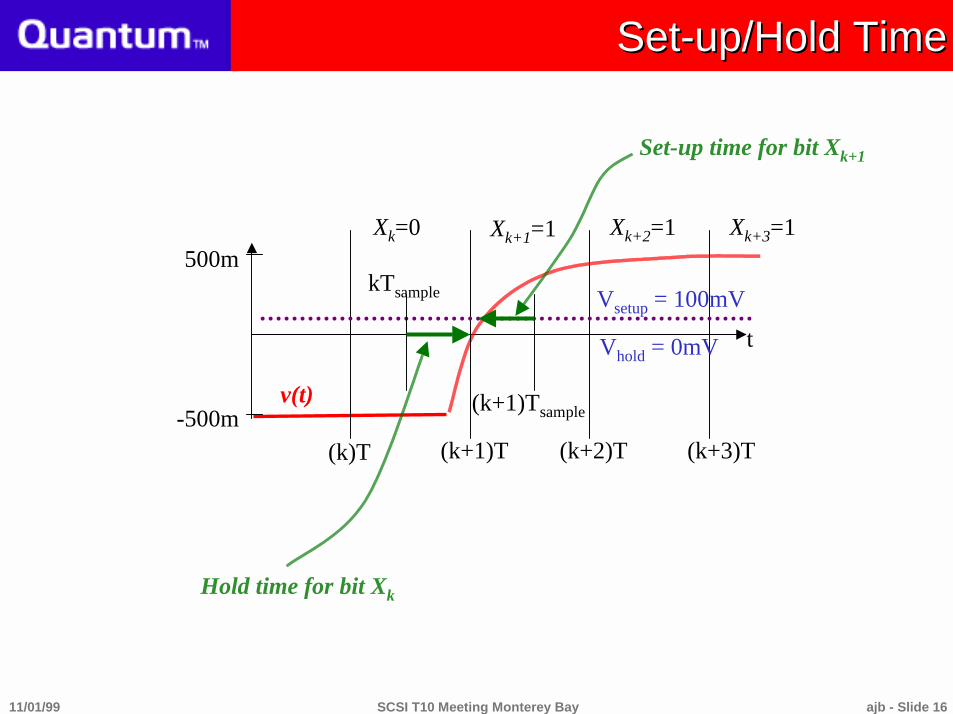
! Time before sampling instant (Tsample) that waveformpasses positive threshold (Vsetup)
! Set-up time for current bit linearly increases with pre-compshift (∆t)
! Hold time for previous bit linearly decreases with pre-comp shift (∆t)
! Isolated bit set-up/hold times calculated assuming that thestarting voltage Vk = 0 (ISI voltage)
Set-up/Hold TimeSet-up/Hold Time
)1000
500ln()(
mV
VmVtTVt setup
samplesetupsu
−+∆+= τ
)1000
500ln()(
mV
VmVtTVt hold
sampleholdh
−−∆−= τ
SCSI T10 Meeting Monterey Bay ajb - Slide 1611/01/99
Set-up/Hold TimeSet-up/Hold Time
t
v(t)
500m
-500m(k)T (k+2)T (k+3)T(k+1)T
Xk=0 Xk+1=1 Xk+2=1 Xk+3=1
(k+1)Tsample
kTsample Vsetup = 100mV
Hold time for bit Xk
Set-up time for bit Xk+1
Vhold = 0mV
SCSI T10 Meeting Monterey Bay ajb - Slide 1711/01/99
Receiver Set-up/Hold TimeReceiver Set-up/Hold Time
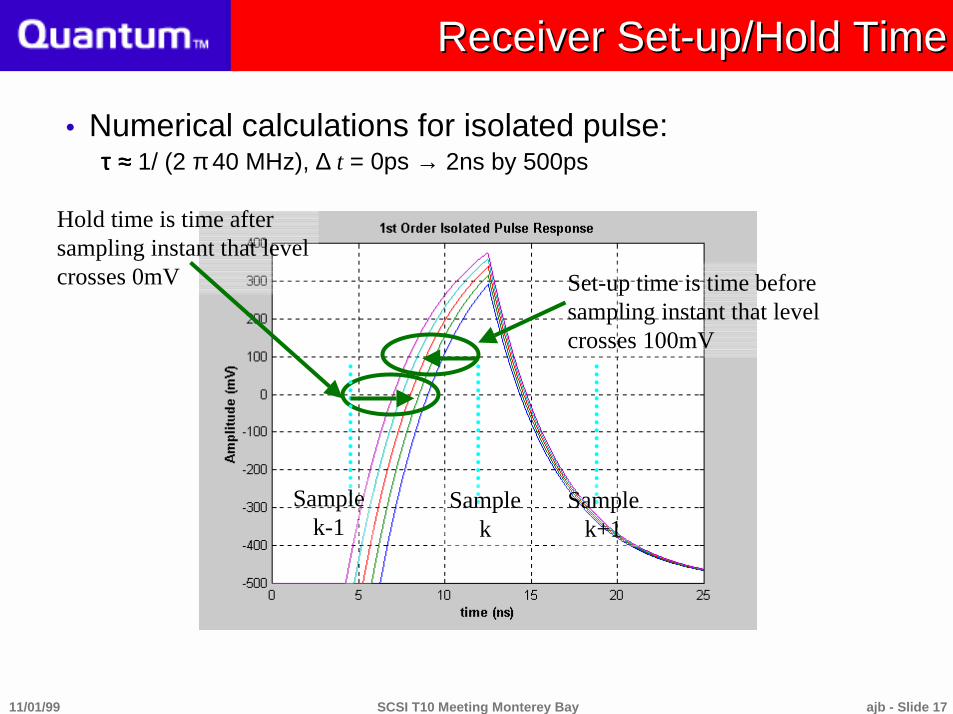
! Numerical calculations for isolated pulse:ττττ ≈≈≈≈ 1/ (2 π 40 MHz), ∆ t = 0ps → 2ns by 500ps
Set-up time is time beforesampling instant that levelcrosses 100mV
Hold time is time aftersampling instant that levelcrosses 0mV
Samplek
Samplek-1
Samplek+1

SCSI T10 Meeting Monterey Bay ajb - Slide 1811/01/99
Fast and Slow Case Set-up/Hold TimesFast and Slow Case Set-up/Hold Times
! Numerical calculations for isolated pulse:! slow case cable: ττττ ≈≈≈≈ 1/ (2 ππππ 40 MHz), ∆t = 0ps → 2ns by 100ps (dashed)! fast case cable: ττττ ≈≈≈≈ 1/ (2 ππππ 120 MHz), ∆t = 0ps → 2ns by 100ps (solid)
0 500 1000 1500 20001
1.5
2
2.5
3
3.5
4
4.5
5
S S /Precom p Sh ift vs Setup /Ho ld
P recom p S hift (ps)
Se
tup
/Ho
ld (
ns
)
S low C ase Fast Case
SCSI T10 Meeting Monterey Bay ajb - Slide 1911/01/99
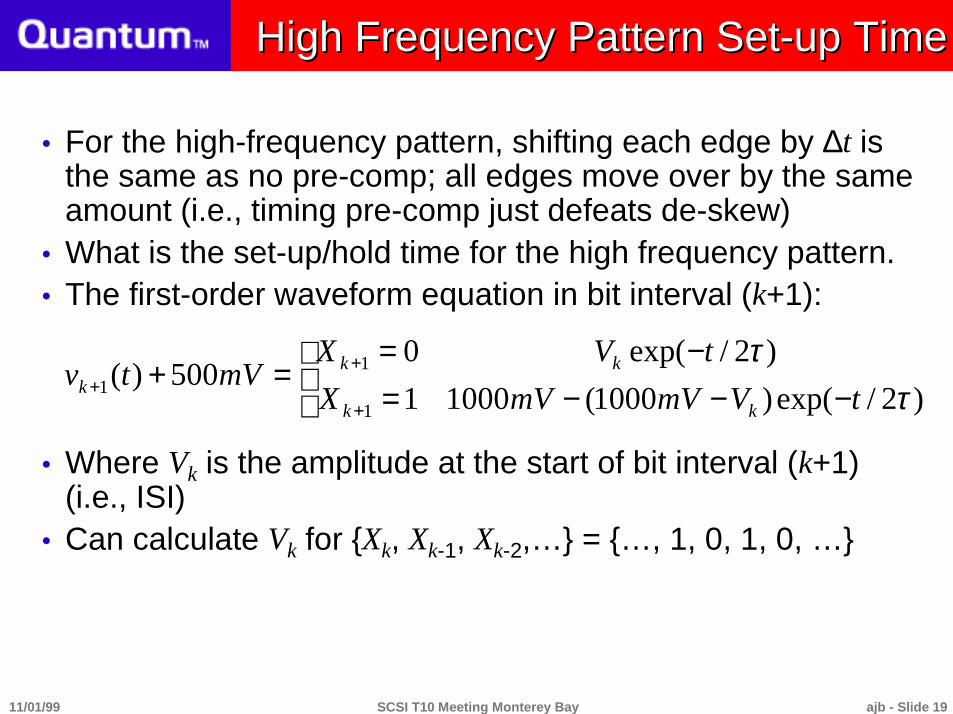
! For the high-frequency pattern, shifting each edge by ∆t isthe same as no pre-comp; all edges move over by the sameamount (i.e., timing pre-comp just defeats de-skew)
! What is the set-up/hold time for the high frequency pattern.! The first-order waveform equation in bit interval (k+1):
! Where Vk is the amplitude at the start of bit interval (k+1)(i.e., ISI)
! Can calculate Vk for {Xk, Xk-1, Xk-2,…} = {…, 1, 0, 1, 0, …}
−−−=−=
=++
++ )2/exp()1000(10001
)2/exp(0500)(
1
11 τ
τtVmVmVX
tVXmVtv
kk
kkk
High Frequency Pattern Set-up TimeHigh Frequency Pattern Set-up Time

SCSI T10 Meeting Monterey Bay ajb - Slide 2011/01/99
tvk+1(t)
500m
-500m(k)T (k+2)T (k+3)T(k+1)T
Xk=0 Xk+1=1 Xk+2=0 Xk+3=1
(k+1)TsamplekTsample
Vk
Tsu = 525ps
Assuming you have skew compensated perfectly!
High Frequency Pattern ISI VoltageHigh Frequency Pattern ISI Voltage
! The residual ISI voltage (Vk) for a high frequency pattern isthe peak voltage of the high frequency waveform.
SCSI T10 Meeting Monterey Bay ajb - Slide 2111/01/99
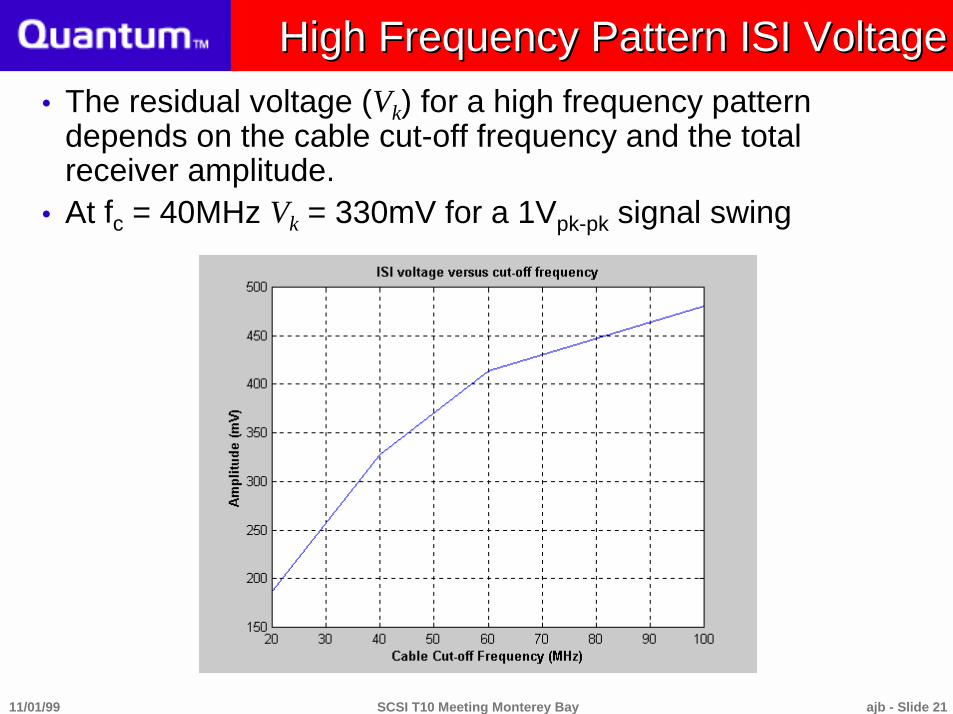
High Frequency Pattern ISI VoltageHigh Frequency Pattern ISI Voltage! The residual voltage (Vk) for a high frequency pattern
depends on the cable cut-off frequency and the totalreceiver amplitude.
! At fc = 40MHz Vk = 330mV for a 1Vpk-pk signal swing
SCSI T10 Meeting Monterey Bay ajb - Slide 2211/01/99
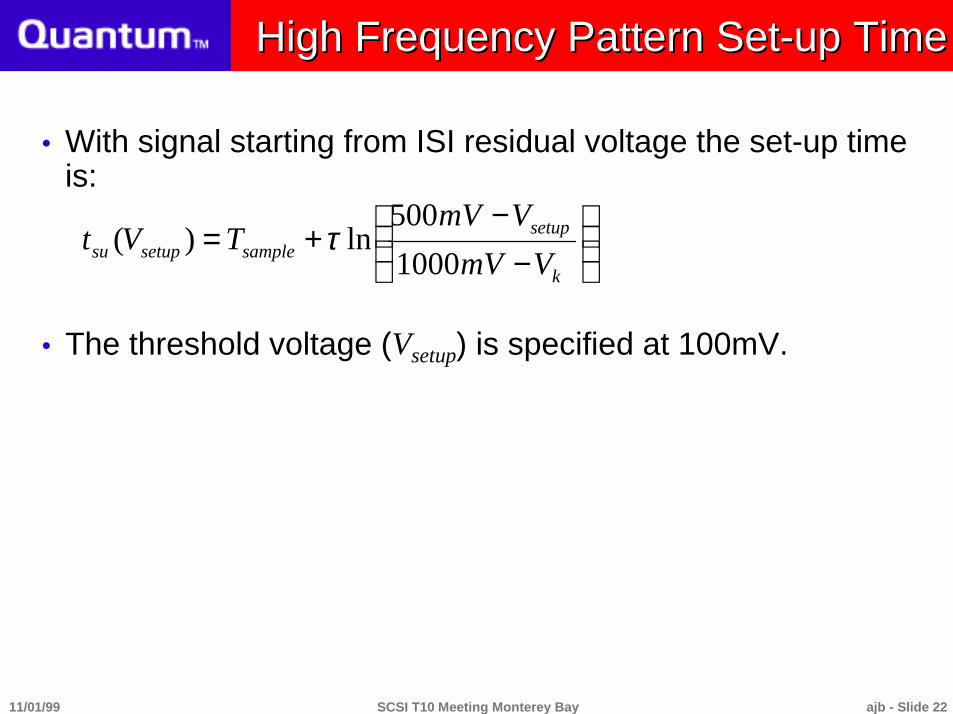
! With signal starting from ISI residual voltage the set-up timeis:
! The threshold voltage (Vsetup) is specified at 100mV.
−
−+=
k
setupsamplesetupsu VmV
VmVTVt
1000
500ln)( τ
High Frequency Pattern Set-up TimeHigh Frequency Pattern Set-up Time

SCSI T10 Meeting Monterey Bay ajb - Slide 2311/01/99
High Frequency Pattern Set-up TimeHigh Frequency Pattern Set-up Time
! Set-up time versus cable cut-off frequency.! For fc = 60Mhz (=1/2ππππ ττττ), set-up time = 1.75ns! For fc = 40Mhz (=1/2ππππ ττττ), set-up time = 525ps
SCSI T10 Meeting Monterey Bay ajb - Slide 2411/01/99
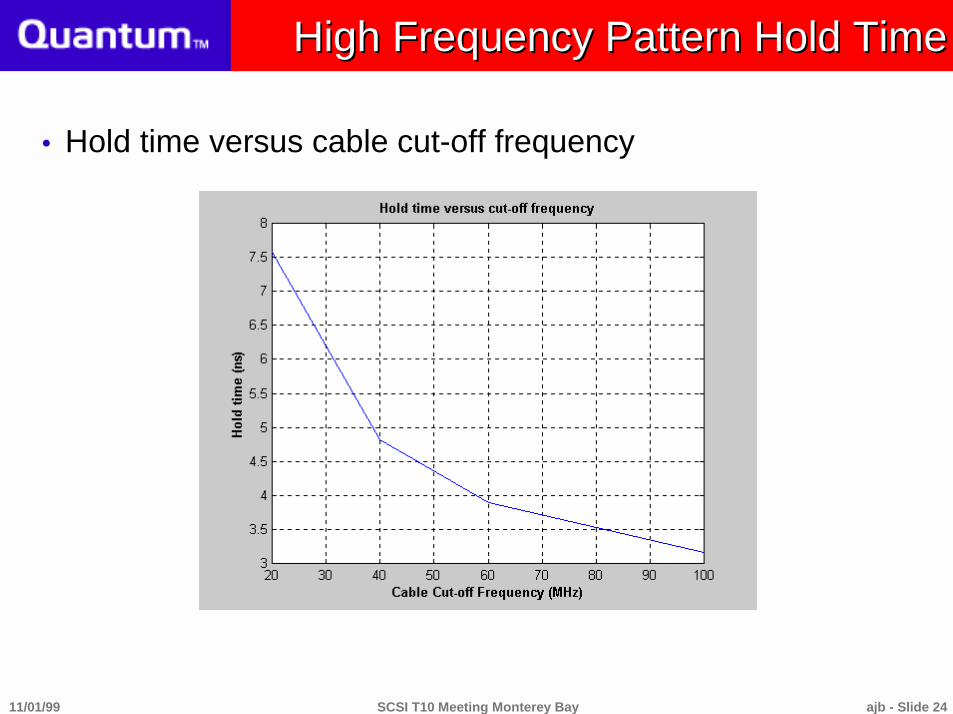
High Frequency Pattern Hold TimeHigh Frequency Pattern Hold Time
! Hold time versus cable cut-off frequency
SCSI T10 Meeting Monterey Bay ajb - Slide 2511/01/99
Conclusions on Timing Pre-CompConclusions on Timing Pre-Comp
! Quantum believes that timing pre-compensation alone isinsufficient to compensate for ISI at 320 MB/sec SCSItransfer rates

SCSI T10 Meeting Monterey Bay ajb - Slide 2611/01/99
Transmitter Pre-CompensationTransmitter Pre-Compensationfor 320 MB/sec SCSIfor 320 MB/sec SCSI
Part IIAmplitude Pre-Compensation Study

SCSI T10 Meeting Monterey Bay ajb - Slide 2711/01/99
∆A
A=1
Amplitude Pre-Compensation BasicsAmplitude Pre-Compensation Basics
! Increase the amplitude of transmitted signal on signaltransitions
! If there is no transition, return amplitude to nominal level(normalized to 1)
! ∆A - amplitude increase is design parameter

SCSI T10 Meeting Monterey Bay ajb - Slide 2811/01/99
bd1bd1
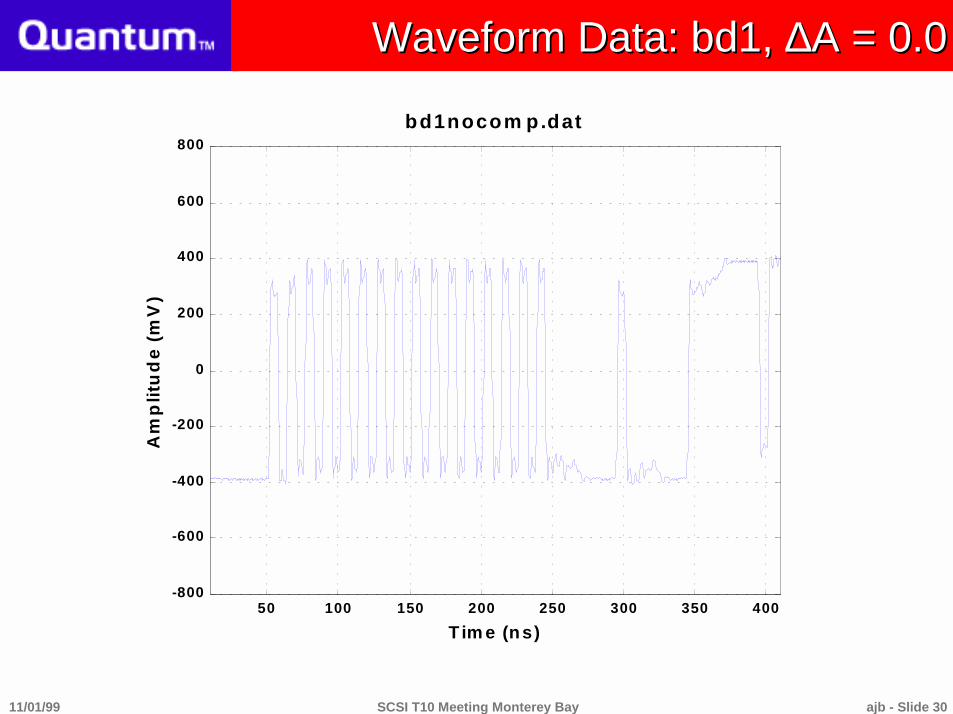
Experimental Setup #1 - Short CableExperimental Setup #1 - Short Cable
! Hitachi 0.625 meter, 32AWG twisted-flat ribbon cable,12.5cm load spacing, plus 6-slot back-plane.
! Waveforms captured @ 4Gs/s! no pre-comp: ∆A = 0.0! amplitude pre-comp: ∆A = 0.2, 0.5, 0.8
0.625mSMQT 32AWG Cable, 12.5cm spacing0.625mSMQT 32AWG Cable, 12.5cm spacing bd0
Transmitter, position zeroTransmitter, position zero
Boards 1-4, receivers on cableBoards 1-4, receivers on cable
bd2bd2 bd3bd3 bd4bd4 bp5bp5
bp6bp6
bp7bp7
bp8bp8
bp9bp9
bp10bp10
Back-planeBack-plane
TerminationTermination
Boards 5-10, receivers on back-planeBoards 5-10, receivers on back-plane
0.625m

SCSI T10 Meeting Monterey Bay ajb - Slide 2911/01/99
Electrical Setup #1 - Short Cable Electrical Setup #1 - Short Cable
Termination110ohms,
locatedat end of
backplane
V+ 50ohm source
V- 50ohm source
Receivers are boards 1 through 10,boards 1 to 4 are on connectors along
ribbon cable, boards 5 to 10 are on the backplane
12.5cm...
SCSI T10 Meeting Monterey Bay ajb - Slide 3011/01/99
Waveform Data: bd1, Waveform Data: bd1, ∆∆A = 0.0A = 0.0
50 100 150 200 250 300 350 400-800
-600
-400
-200
0
200
400
600
800A
mp
litu
de
(m
V)
T im e (ns)
bd1nocom p.dat
SCSI T10 Meeting Monterey Bay ajb - Slide 3111/01/99
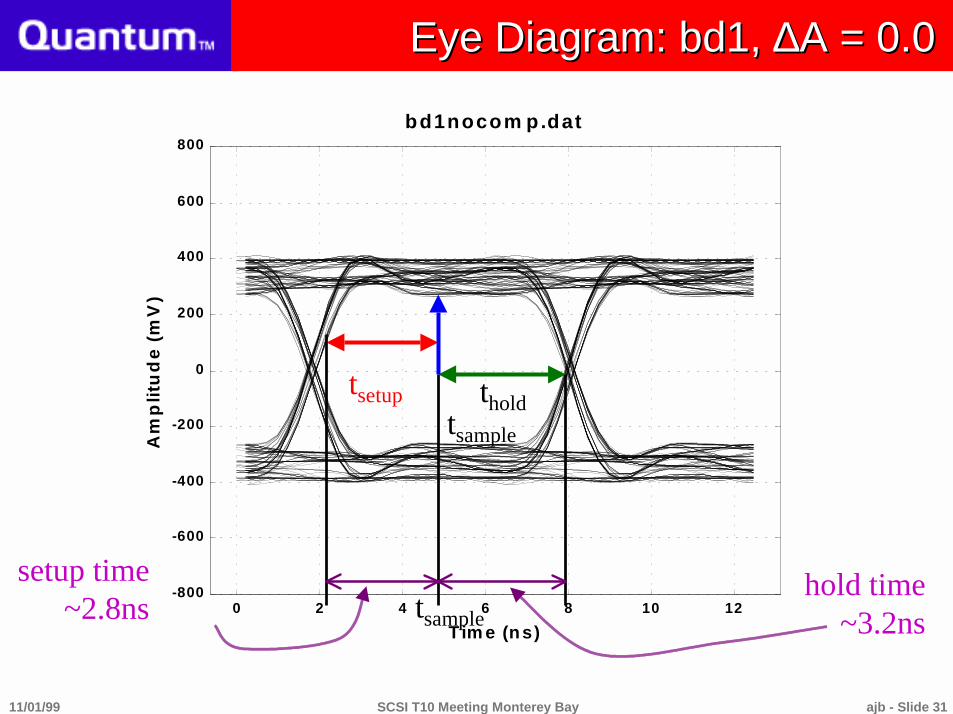
Eye Diagram: bd1, Eye Diagram: bd1, ∆∆A = 0.0 A = 0.0
0 2 4 6 8 10 12-800
-600
-400
-200
0
200
400
600
800bd1nocom p.dat
Am
plit
ud
e (
mV
)
T im e (ns)
tholdtsetup
tsample
tsample
hold time~3.2ns
setup time~2.8ns

SCSI T10 Meeting Monterey Bay ajb - Slide 3211/01/99
Waveform Data: bd1, Waveform Data: bd1, ∆∆A = 0.2A = 0.2
50 100 150 200 250 300 350 400-800
-600
-400
-200
0
200
400
600
800A
mp
litu
de
(m
V)
T im e (ns)
bd1com p1p2.dat
SCSI T10 Meeting Monterey Bay ajb - Slide 3311/01/99
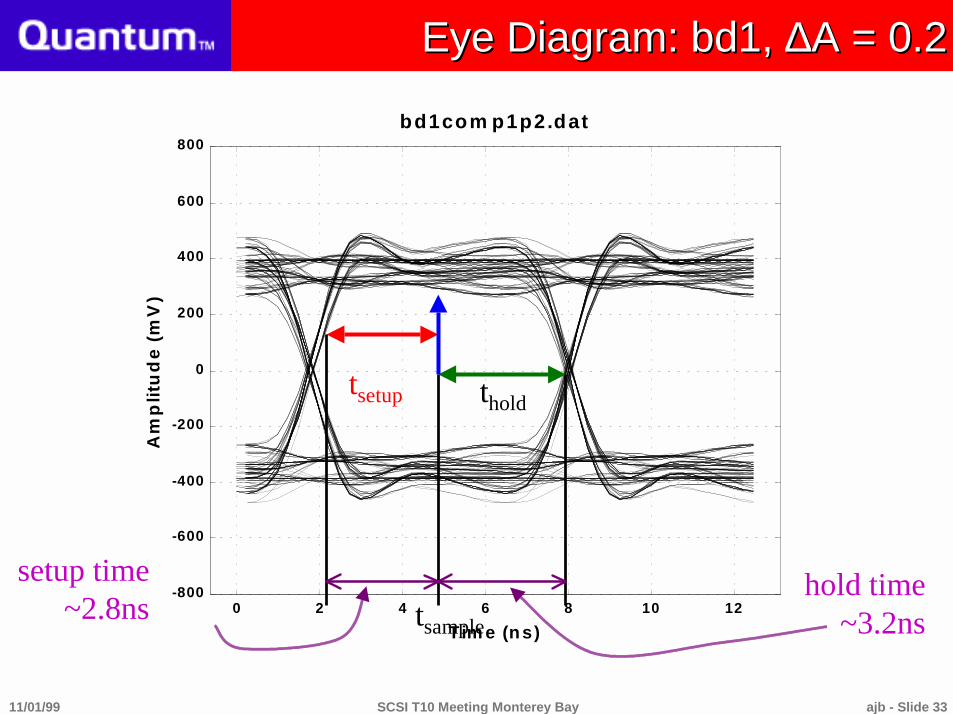
Eye Diagram: bd1, Eye Diagram: bd1, ∆∆A = 0.2A = 0.2
0 2 4 6 8 10 12-800
-600
-400
-200
0
200
400
600
800bd1com p1p2.dat
Am
plit
ud
e (
mV
)
T im e (ns)
tholdtsetup
tsample
hold time~3.2ns
setup time~2.8ns
SCSI T10 Meeting Monterey Bay ajb - Slide 3411/01/99
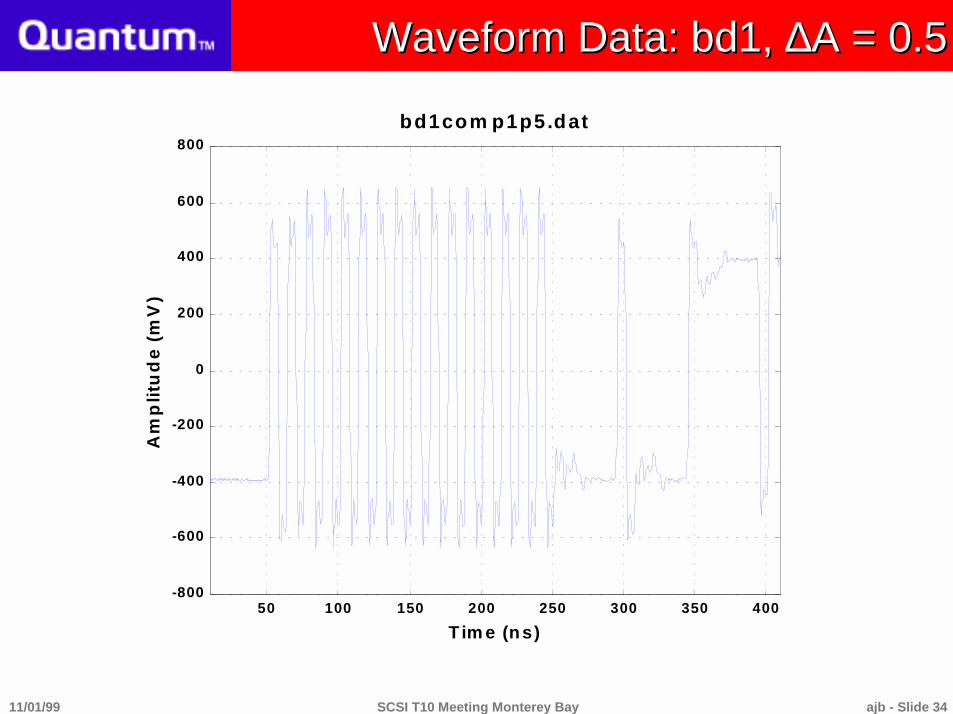
Waveform Data: bd1, Waveform Data: bd1, ∆∆A = 0.5A = 0.5
50 100 150 200 250 300 350 400-800
-600
-400
-200
0
200
400
600
800A
mp
litu
de
(m
V)
T im e (ns)
bd1com p1p5.dat

SCSI T10 Meeting Monterey Bay ajb - Slide 3511/01/99
0 2 4 6 8 10 12-800
-600
-400
-200
0
200
400
600
800bd1com p1p5.dat
Am
plit
ud
e (
mV
)
T im e (ns)
Eye Diagram: bd1, Eye Diagram: bd1, ∆∆A = 0.5A = 0.5
tholdtsetup
tsample
hold time~3.2ns
setup time~2.8ns
SCSI T10 Meeting Monterey Bay ajb - Slide 3611/01/99
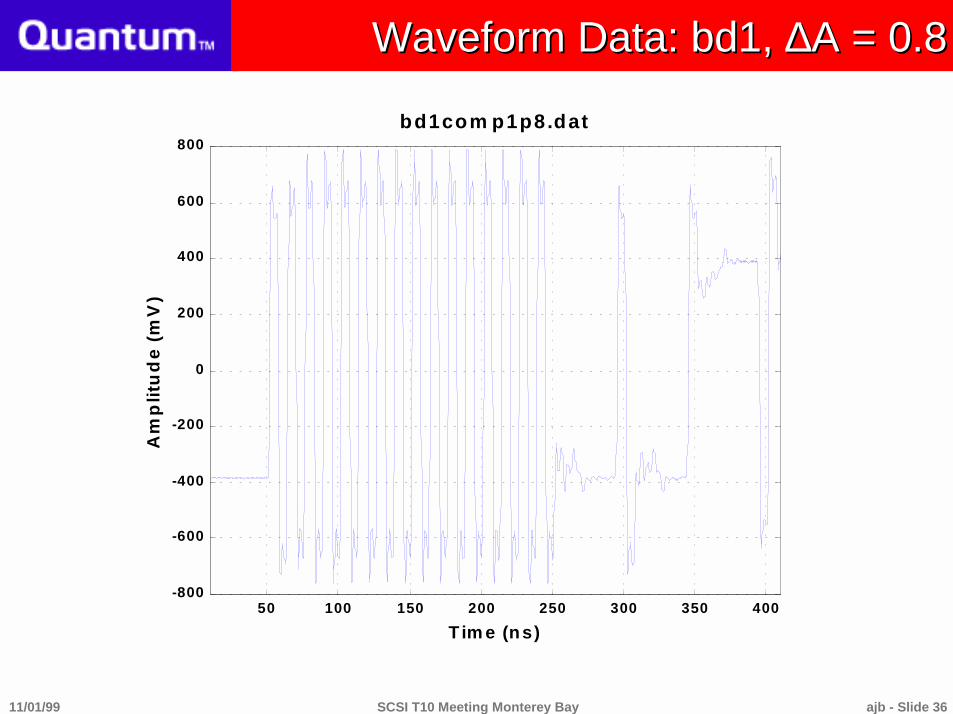
Waveform Data: bd1, Waveform Data: bd1, ∆∆A = 0.8A = 0.8
50 100 150 200 250 300 350 400-800
-600
-400
-200
0
200
400
600
800A
mp
litu
de
(m
V)
T im e (ns)
bd1com p1p8.dat

SCSI T10 Meeting Monterey Bay ajb - Slide 3711/01/99
Eye Diagram: bd1, Eye Diagram: bd1, ∆∆A = 0.8A = 0.8
0 2 4 6 8 10 12-800
-600
-400
-200
0
200
400
600
800bd1com p1p8.dat
Am
plit
ud
e (
mV
)
T im e (ns)
tholdtsetup
tsample hold time~3.0ns
setup time~2.8ns
SCSI T10 Meeting Monterey Bay ajb - Slide 3811/01/99
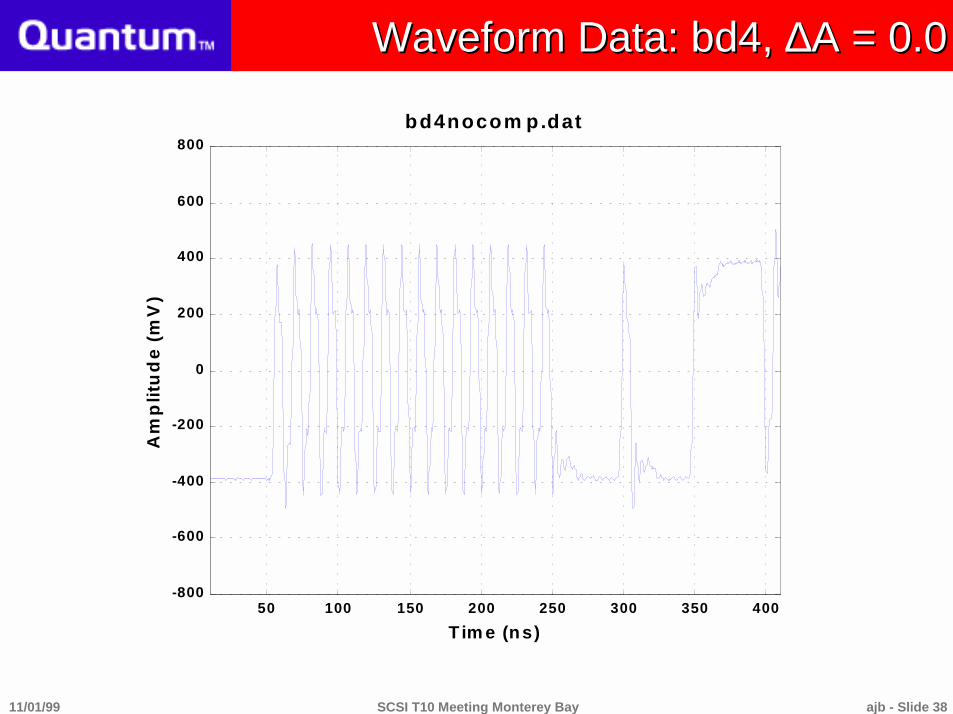
Waveform Data: bd4, Waveform Data: bd4, ∆∆A = 0.0A = 0.0
50 100 150 200 250 300 350 400-800
-600
-400
-200
0
200
400
600
800A
mp
litu
de
(m
V)
T im e (ns)
bd4nocom p.dat
SCSI T10 Meeting Monterey Bay ajb - Slide 3911/01/99
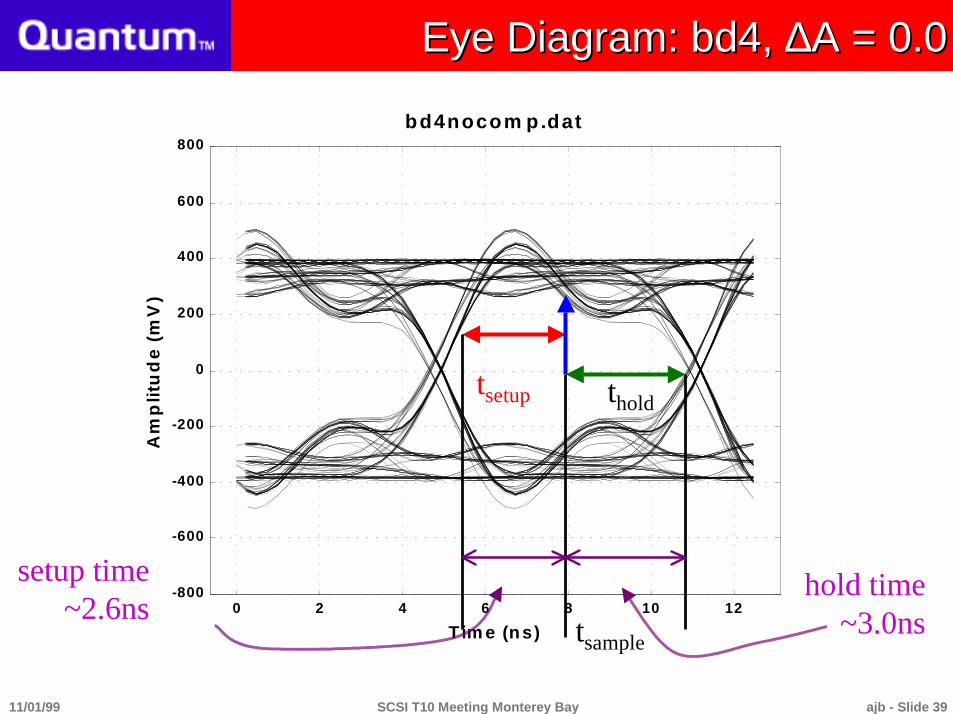
Eye Diagram: bd4, Eye Diagram: bd4, ∆∆A = 0.0A = 0.0
0 2 4 6 8 10 12-800
-600
-400
-200
0
200
400
600
800bd4nocom p.dat
Am
plit
ud
e (
mV
)
T im e (ns)
tholdtsetup
tsample
hold time~3.0ns
setup time~2.6ns

SCSI T10 Meeting Monterey Bay ajb - Slide 4011/01/99
Waveform Data: bd4, Waveform Data: bd4, ∆∆A = 0.2A = 0.2
50 100 150 200 250 300 350 400-800
-600
-400
-200
0
200
400
600
800A
mp
litu
de
(m
V)
T im e (ns)
bd4com p1p2.dat

SCSI T10 Meeting Monterey Bay ajb - Slide 4111/01/99
Eye Diagram: bd4, Eye Diagram: bd4, ∆∆A = 0.2A = 0.2
0 2 4 6 8 10 12-800
-600
-400
-200
0
200
400
600
800bd4com p1p2.dat
Am
plit
ud
e (
mV
)
T im e (ns)
tholdtsetup
tsample
hold time~3.0ns
setup time~2.8ns

SCSI T10 Meeting Monterey Bay ajb - Slide 4211/01/99
Waveform Data: bd4, Waveform Data: bd4, ∆∆A = 0.5A = 0.5
50 100 150 200 250 300 350 400-800
-600
-400
-200
0
200
400
600
800A
mp
litu
de
(m
V)
T im e (ns)
bd4com p1p5.dat
SCSI T10 Meeting Monterey Bay ajb - Slide 4311/01/99
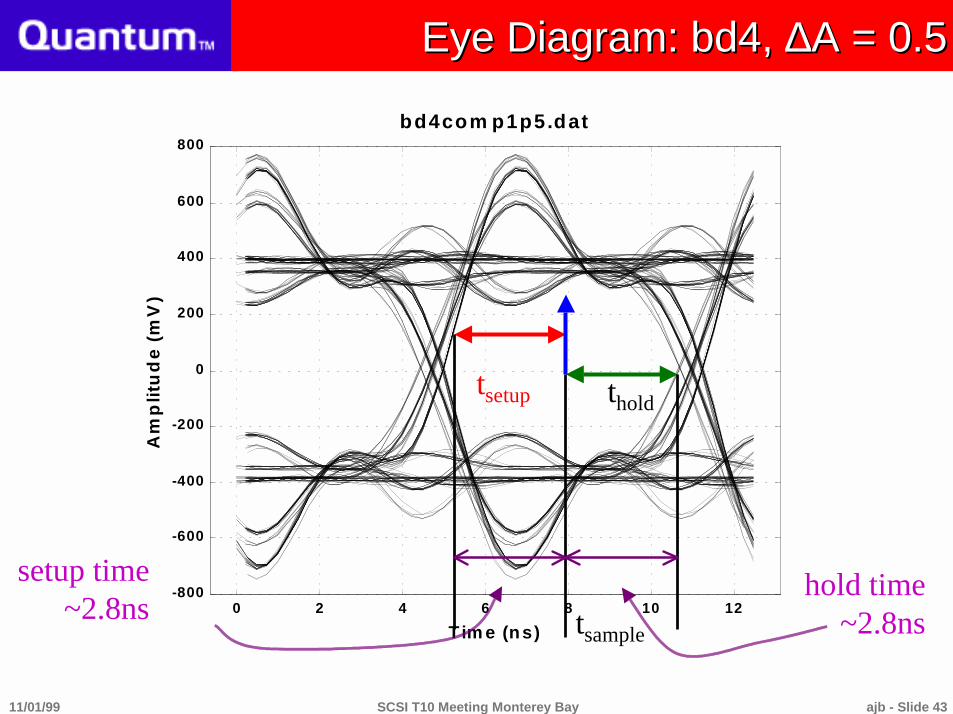
Eye Diagram: bd4, Eye Diagram: bd4, ∆∆A = 0.5A = 0.5
0 2 4 6 8 10 12-800
-600
-400
-200
0
200
400
600
800bd4com p1p5.dat
Am
plit
ud
e (
mV
)
T im e (ns)
tholdtsetup
tsample
hold time~2.8ns
setup time~2.8ns
SCSI T10 Meeting Monterey Bay ajb - Slide 4411/01/99
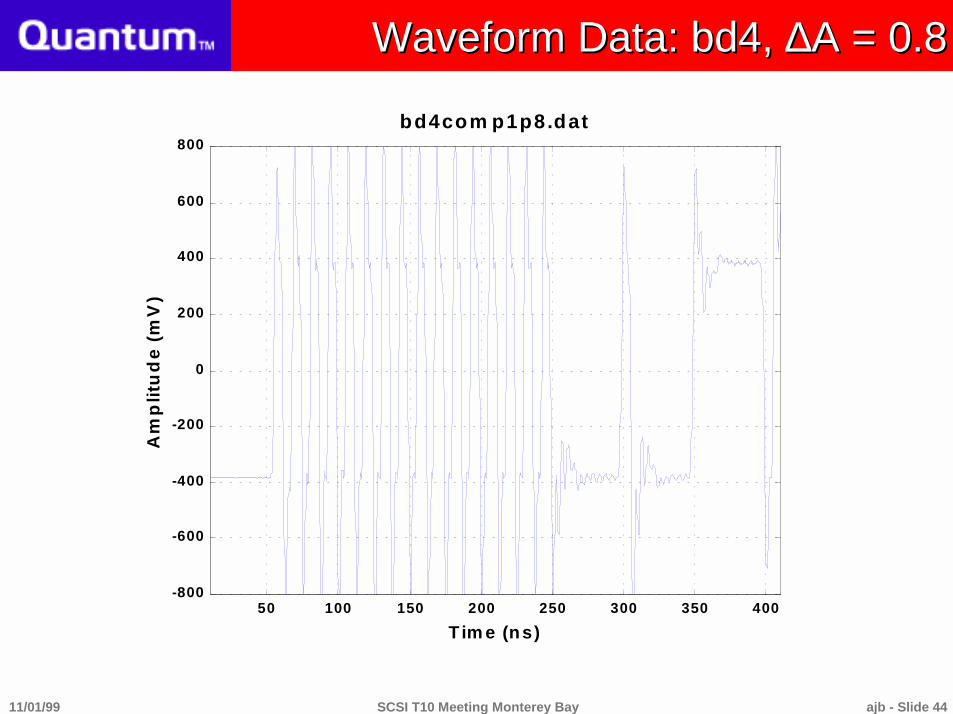
Waveform Data: bd4, Waveform Data: bd4, ∆∆A = 0.8A = 0.8
50 100 150 200 250 300 350 400-800
-600
-400
-200
0
200
400
600
800A
mp
litu
de
(m
V)
T im e (ns)
bd4com p1p8.dat
SCSI T10 Meeting Monterey Bay ajb - Slide 4511/01/99
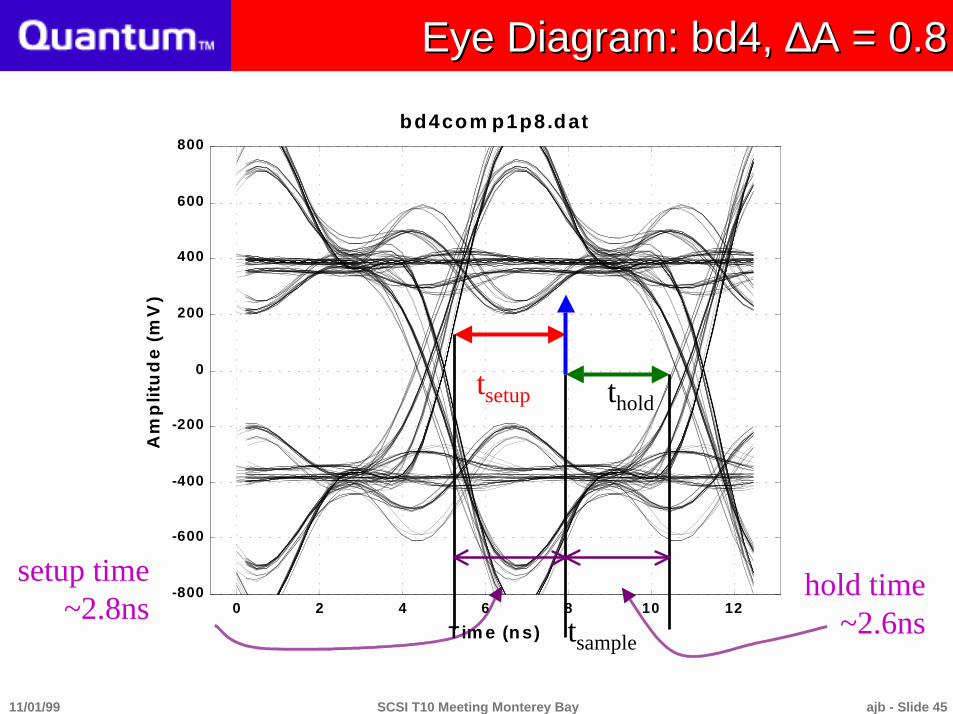
Eye Diagram: bd4, Eye Diagram: bd4, ∆∆A = 0.8A = 0.8
0 2 4 6 8 10 12-800
-600
-400
-200
0
200
400
600
800bd4com p1p8.dat
Am
plit
ud
e (
mV
)
T im e (ns)
tholdtsetup
tsample
hold time~2.6ns
setup time~2.8ns

SCSI T10 Meeting Monterey Bay ajb - Slide 4611/01/99
Waveform Data: bp5, Waveform Data: bp5, ∆∆A = 0.0A = 0.0
50 100 150 200 250 300 350 400-800
-600
-400
-200
0
200
400
600
800A
mp
litu
de
(m
V)
T im e (ns)
bp5nocom p.dat

SCSI T10 Meeting Monterey Bay ajb - Slide 4711/01/99
Eye Diagram: bp5, Eye Diagram: bp5, ∆∆A = 0.0A = 0.0
0 2 4 6 8 10 12-800
-600
-400
-200
0
200
400
600
800bp5nocom p.dat
Am
plit
ud
e (
mV
)
T im e (ns)
tholdtsetup
tsample
hold time~3.0ns
setup time~2.4ns

SCSI T10 Meeting Monterey Bay ajb - Slide 4811/01/99
Waveform Data: bp5, Waveform Data: bp5, ∆∆A = 0.2A = 0.2
50 100 150 200 250 300 350 400-800
-600
-400
-200
0
200
400
600
800A
mp
litu
de
(m
V)
T im e (ns)
bp5com p1p2.dat

SCSI T10 Meeting Monterey Bay ajb - Slide 4911/01/99
Eye Diagram: bp5, Eye Diagram: bp5, ∆∆A = 0.2A = 0.2
0 2 4 6 8 10 12-800
-600
-400
-200
0
200
400
600
800bp5com p1p2.dat
Am
plit
ud
e (
mV
)
T im e (ns)
tholdtsetup
tsample
hold time~3.0ns
setup time~2.8ns
SCSI T10 Meeting Monterey Bay ajb - Slide 5011/01/99
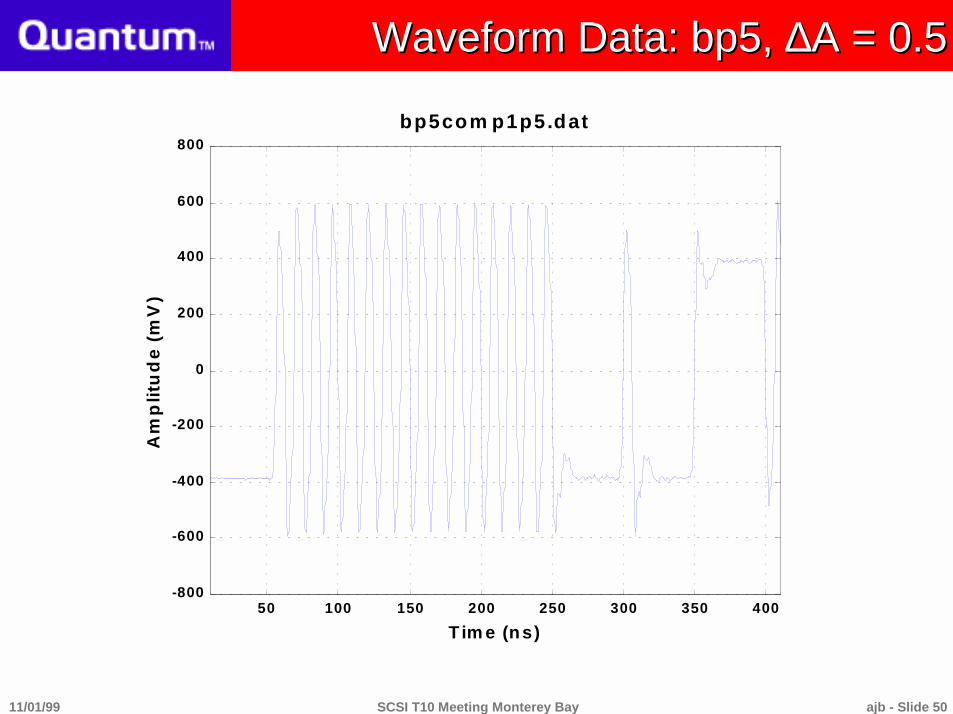
Waveform Data: bp5, Waveform Data: bp5, ∆∆A = 0.5A = 0.5
50 100 150 200 250 300 350 400-800
-600
-400
-200
0
200
400
600
800A
mp
litu
de
(m
V)
T im e (ns)
bp5com p1p5.dat
SCSI T10 Meeting Monterey Bay ajb - Slide 5111/01/99
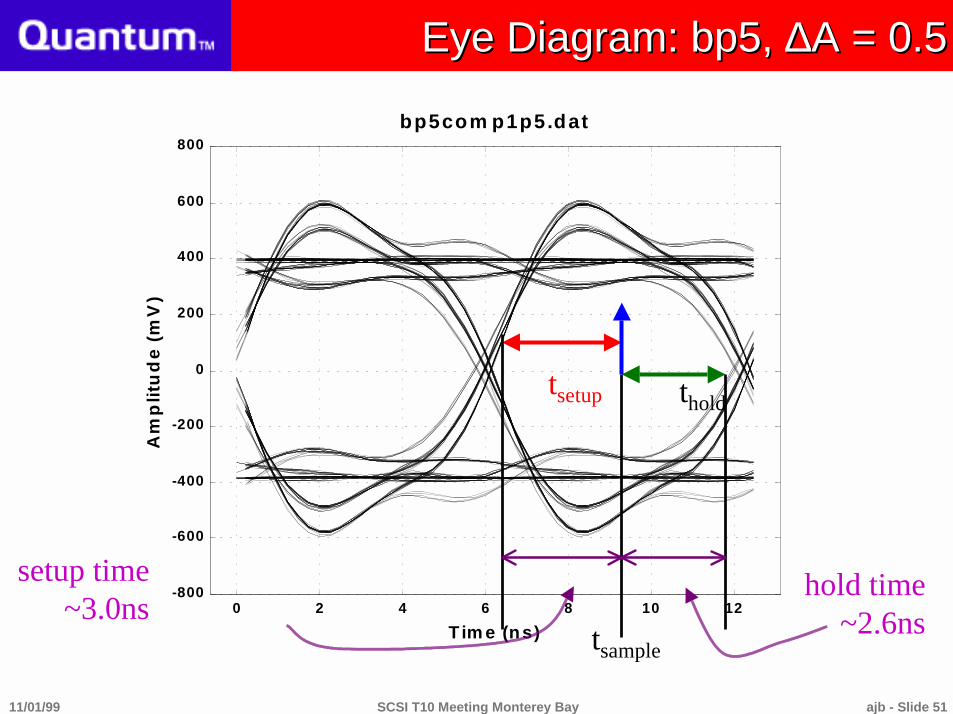
Eye Diagram: bp5, Eye Diagram: bp5, ∆∆A = 0.5A = 0.5
0 2 4 6 8 10 12-800
-600
-400
-200
0
200
400
600
800bp5com p1p5.dat
Am
plit
ud
e (
mV
)
T im e (ns)
tholdtsetup
tsample
hold time~2.6ns
setup time~3.0ns

SCSI T10 Meeting Monterey Bay ajb - Slide 5211/01/99
Waveform Data: bp5, Waveform Data: bp5, ∆∆A = 0.8A = 0.8
50 100 150 200 250 300 350 400-800
-600
-400
-200
0
200
400
600
800A
mp
litu
de
(m
V)
T im e (ns)
bp5com p1p8.dat

SCSI T10 Meeting Monterey Bay ajb - Slide 5311/01/99
Eye Diagram: bp5, Eye Diagram: bp5, ∆∆A = 0.8A = 0.8
0 2 4 6 8 10 12-800
-600
-400
-200
0
200
400
600
800bp5com p1p8.dat
Am
plit
ud
e (
mV
)
T im e (ns)
tholdtsetup
tsample
hold time~2.6ns
setup time~3.0ns
SCSI T10 Meeting Monterey Bay ajb - Slide 5411/01/99
bd9bd9bd8bd8bd1bd1
bp15bp15
bp14bp14
bp13bp13
bp12bp12
bp11bp11
10mSMQT 32AWG twisted-flat cable (25cm spacing)10mSMQT 32AWG twisted-flat cable (25cm spacing) bd0
Transmitter, position zeroTransmitter, position zero
bp10bp10
Back-planeBack-plane
TerminationTermination
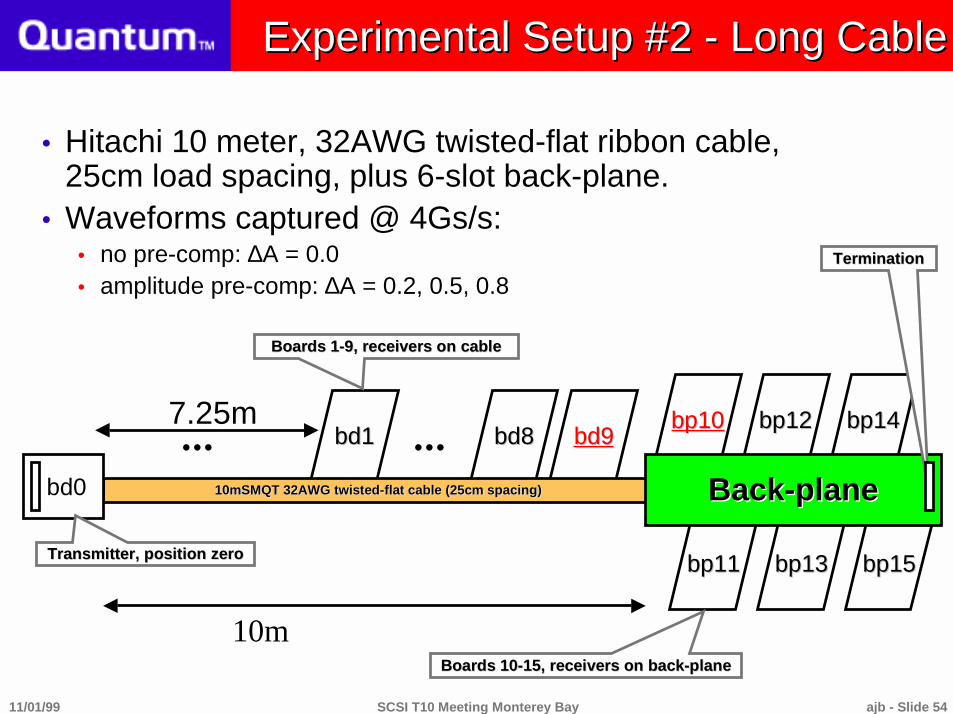
Boards 10-15, receivers on back-planeBoards 10-15, receivers on back-plane
•••7.25m
•••
Boards 1-9, receivers on cableBoards 1-9, receivers on cable
Experimental Setup #2 - Long CableExperimental Setup #2 - Long Cable
! Hitachi 10 meter, 32AWG twisted-flat ribbon cable,25cm load spacing, plus 6-slot back-plane.
! Waveforms captured @ 4Gs/s:! no pre-comp: ∆A = 0.0! amplitude pre-comp: ∆A = 0.2, 0.5, 0.8
10m

SCSI T10 Meeting Monterey Bay ajb - Slide 5511/01/99
Electrical Setup #2 - Long CableElectrical Setup #2 - Long Cable
Termination110ohms,
locatedat end of
backplane
V+ 50ohm source
V- 50ohm source
receive at boards 1 through 15,boards 1 to 9 are on connectors along
ribbon cable, boards 10 to 15 are on the backplane
...7.25m

SCSI T10 Meeting Monterey Bay ajb - Slide 5611/01/99
Waveform data: bd9, Waveform data: bd9, ∆∆A = 0.0A = 0.0

SCSI T10 Meeting Monterey Bay ajb - Slide 5711/01/99
Eye Diagram: bd9, Eye Diagram: bd9, ∆∆A = 0.0A = 0.0
tholdtsetup
tsample
Nominalhold time
~2.4ns
Nominalsetup time
~1.6ns
SCSI T10 Meeting Monterey Bay ajb - Slide 5811/01/99
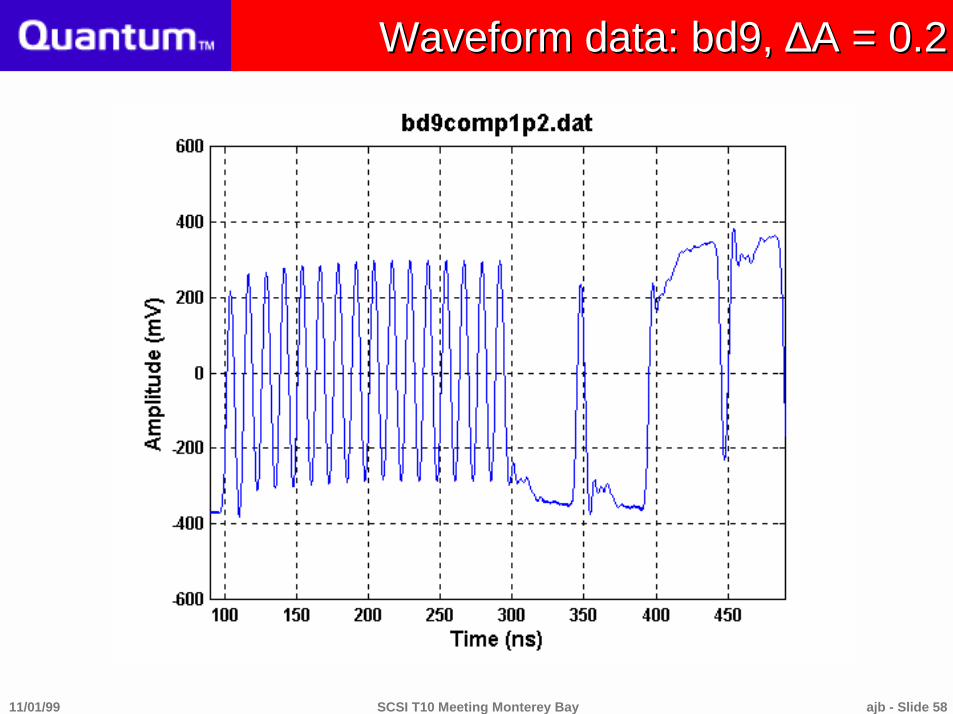
Waveform data: bd9, Waveform data: bd9, ∆∆A = 0.2A = 0.2
SCSI T10 Meeting Monterey Bay ajb - Slide 5911/01/99
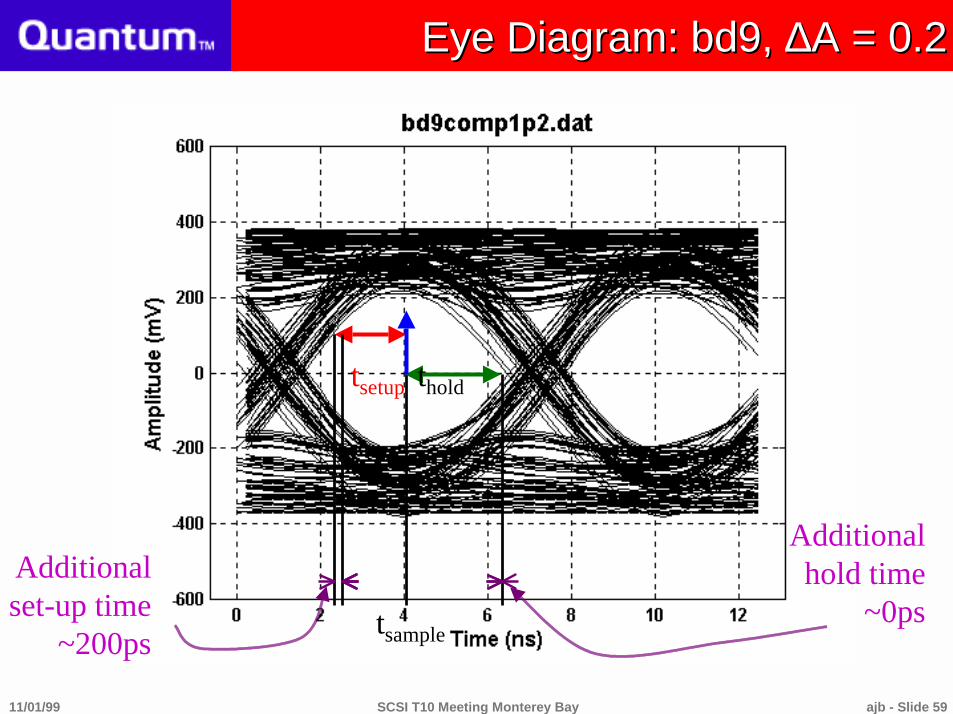
Eye Diagram: bd9, Eye Diagram: bd9, ∆∆A = 0.2A = 0.2
Additionalset-up time
~200ps
tholdtsetup
tsample
Additionalhold time
~0ps

SCSI T10 Meeting Monterey Bay ajb - Slide 6011/01/99
Waveform data: bd9, Waveform data: bd9, ∆∆A = 0.5A = 0.5

SCSI T10 Meeting Monterey Bay ajb - Slide 6111/01/99
Eye Diagram: bd9, Eye Diagram: bd9, ∆∆A = 0.5A = 0.5
Additionalset-up time
~600ps
tholdtsetup
tsample
Additionalhold time
~200ps
SCSI T10 Meeting Monterey Bay ajb - Slide 6211/01/99
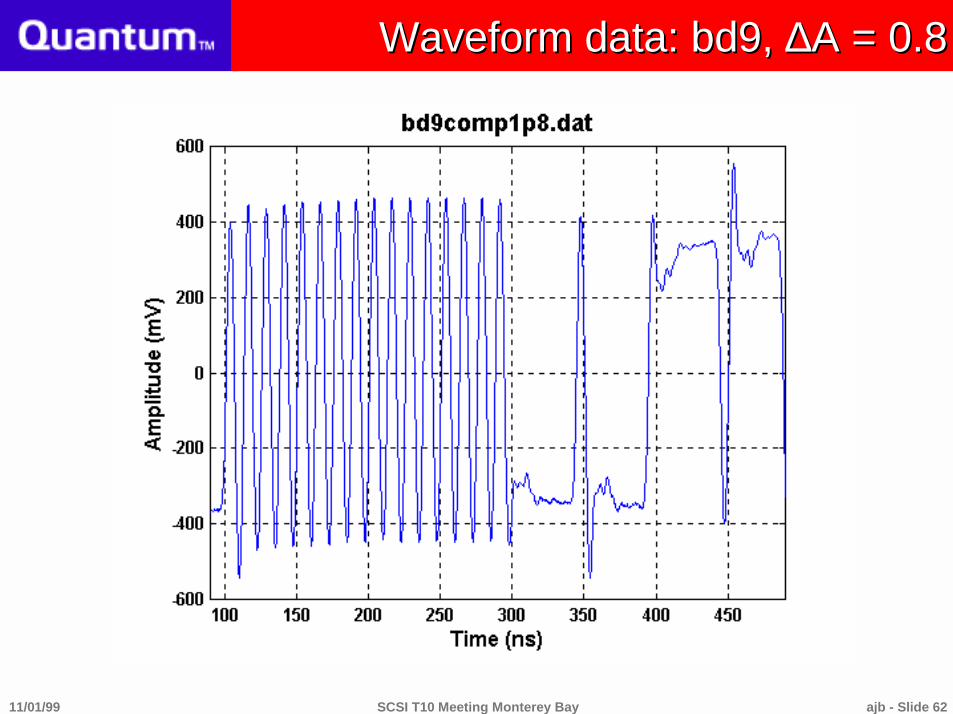
Waveform data: bd9, Waveform data: bd9, ∆∆A = 0.8A = 0.8

SCSI T10 Meeting Monterey Bay ajb - Slide 6311/01/99
Eye Diagram: bd9, Eye Diagram: bd9, ∆∆A = 0.8A = 0.8
Additionalset-up time
~1.0ns
tholdtsetup
tsample
Additionalhold time
~400ps

SCSI T10 Meeting Monterey Bay ajb - Slide 6411/01/99
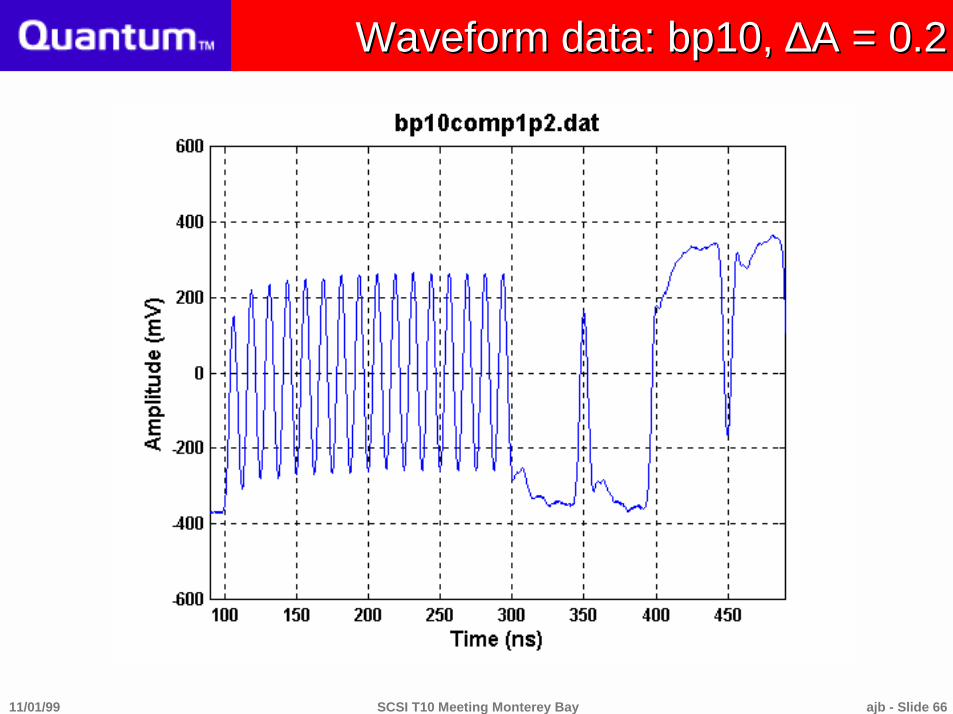
Waveform data: bp10, Waveform data: bp10, ∆∆A = 0.0A = 0.0

SCSI T10 Meeting Monterey Bay ajb - Slide 6511/01/99
Eye Diagram: bp10, Eye Diagram: bp10, ∆∆A = 0.0A = 0.0
tholdtsetup
tsampleNominal
set-up time~400ps
Nominalhold time
~1.6s
SCSI T10 Meeting Monterey Bay ajb - Slide 6611/01/99
Waveform data: bp10, Waveform data: bp10, ∆∆A = 0.2A = 0.2

SCSI T10 Meeting Monterey Bay ajb - Slide 6711/01/99
Eye Diagram: bp10, Eye Diagram: bp10, ∆∆A = 0.2A = 0.2
tholdtsetup
tsample
Additionalset-up time
~800ps
Additionalhold time
~400ps
SCSI T10 Meeting Monterey Bay ajb - Slide 6811/01/99
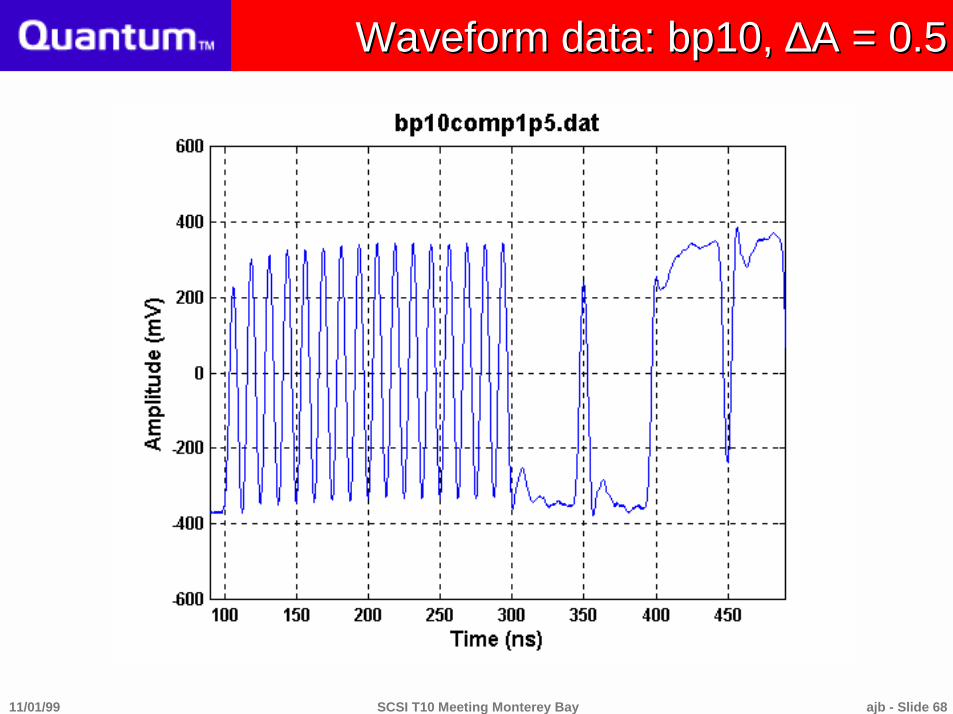
Waveform data: bp10, Waveform data: bp10, ∆∆A = 0.5A = 0.5

SCSI T10 Meeting Monterey Bay ajb - Slide 6911/01/99
Eye Diagram: bp10, Eye Diagram: bp10, ∆∆A = 0.5A = 0.5
tholdtsetup
tsample
Additionalset-up time
~1.6ns
Additionalhold time
~600ps

SCSI T10 Meeting Monterey Bay ajb - Slide 7011/01/99
Waveform data: bp10, Waveform data: bp10, ∆∆A = 0.8A = 0.8

SCSI T10 Meeting Monterey Bay ajb - Slide 7111/01/99
Eye Diagram: bp10, Eye Diagram: bp10, ∆∆A = 0.8A = 0.8
Additionalset-up time
~2ns
tholdtsetup
tsample
Additionalhold time
~600ps
SCSI T10 Meeting Monterey Bay ajb - Slide 7211/01/99
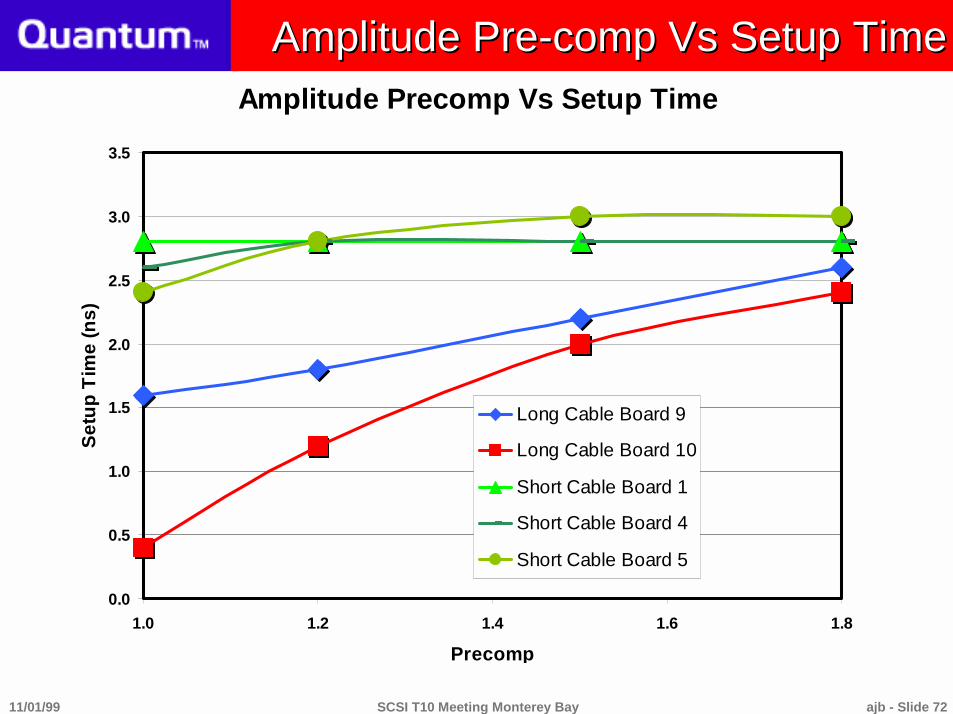
Amplitude Pre-comp Vs Setup TimeAmplitude Pre-comp Vs Setup TimeAmplitude Precomp Vs Setup Time
0.0
0.5
1.0
1.5
2.0
2.5
3.0
3.5
1.0 1.2 1.4 1.6 1.8
Precomp
Set
up
Tim
e (n
s)
Long Cable Board 9
Long Cable Board 10
Short Cable Board 1
Short Cable Board 4
Short Cable Board 5

SCSI T10 Meeting Monterey Bay ajb - Slide 7311/01/99
Amplitude Pre-comp Vs Hold TimeAmplitude Pre-comp Vs Hold TimeAmplitude Precomp vs Hold Time
1.0
1.5
2.0
2.5
3.0
3.5
1.0 1.1 1.2 1.3 1.4 1.5 1.6 1.7 1.8
Precomp
Ho
ld T
ime
(n
s)
Long Cable Board 9Long Cable Board 10Short Cable Board 1Short Cable Board 4Short Cable Board 5

SCSI T10 Meeting Monterey Bay ajb - Slide 7411/01/99
LSI SPI-4 Timing Budget: 99-261r1LSI SPI-4 Timing Budget: 99-261r1
Timing Budget (ns) .Basic Period 12.50DT-Period 6.250Period Tolerance 0.700
Deterministic Errors .Silicon TX Driver Skew 1.000Package Skew (Initiator) 0.065PCB Layout Skew (Initiator) 0.200Cable Skew (@25ps/ft) 2.500PCB Layout Skew (Target) 0.200Package Skew (Target) 0.065Silicon Rx Routing Skew 1.000HL vs LH Matching 0.500
Non-Deterministic Errors .Low Vt vs Substrate Noise 0.200PLL Jitter 0.250Cross Talk Induced Jitter 0.500Cable Period Distortion ISICable Period Distortion ISI 2.0002.000Input Slew Rate Dependent Skew 0.200Receiver Amplitude Dependant Skew 0.200Self Cal Accuracy (±±±± 100ps) 0.200
Data Valid Window 1.850Data Setup/Hold 0.925
SCSI T10 Meeting Monterey Bay ajb - Slide 7511/01/99
Conclusions on Amplitude Pre-CompConclusions on Amplitude Pre-Comp
! Amplitude pre-comp appears to work for long cables and forclosely-spaced loads (i.e., set-up time improves, amplitudemargin improves).! Without it (or something else) certain configurations will fail: zero set-up time,
no amplitude margin.! Optimum value for pre-comp amplitude is between 1.5 and 1.8.! This value depends on the configuration.
! Amplitude pre-comp does not improve signal integrity forshort cables:! Extra signal amplitude contributes to ringing and overshoot;! Amplitude pre-comp can even slightly decrease available hold time.
! Unsolved issues with EMI, Power, cross-talk, andcapacitance.
SCSI T10 Meeting Monterey Bay ajb - Slide 7611/01/99
Comments on Amplitude Pre-CompComments on Amplitude Pre-Comp
! Data presented is for various pre-comp boost values over a‘low frequency’ drive level of 400mV peak differential
! Driver and terminators are ideal! Other errors due to driver/terminator mismatch and interconnect resistance,
requires an addition of approximately 70mV in the receiver margin above the100mV in Figs 47,48 of SPI-3
! Only 1 line is driven, no cross-talk components are included! Setup & hold measurements must include a timing error for
residual skew.! Transmit pre-comp appears able to meet the present
interconnect configuration range, but:! fixed value of pre-comp is non-optimum at many drops! meeting the 12m / 15 drop configuration stresses available driver output
signal capabilities! little or no range left to accommodate speed increase to 640
SCSI T10 Meeting Monterey Bay ajb - Slide 7711/01/99
Comments on Amplitude Pre-CompComments on Amplitude Pre-Comp
! Driver Issues for Amplitude Pre-comp! Data shows that a Pre-comp boost of 1.5 to 1.8 is required to handle 12m
cable / 15 load case! Expect bus DC errors similar to U160! Expect cross-talk and reflection problems with pre-comp boost to be worse
than with U160! There is no reason to expect that a minimum (un-boosted) transmit
signal lower than the 360mV min in SPI-3 is workable.
! Taking the SPI-3 360mV minimum, and +/-20% driver tolerance → 400mVnominal un-boosted level
! 1.8x boost → 720mV nominal boosted level! + 20% driver tolerance → 864mV peak differential boosted signal
! These signal ranges exceed the present SPI-3 min/max limits andwill present driver design difficulties and increased powerdissipation.
SCSI T10 Meeting Monterey Bay ajb - Slide 7811/01/99
Next StepsNext Steps
! We will collect more data on different configurations:! heavily and lightly loaded busses! typical and atypical! point-to-point
! We will investigate:! can lower amplitudes be used to address large chip power requirements?! how bad will common-mode degrade for large amplitudes?! would receiver compensation work?! how much capacitance will be added by larger drivers?! how much capacitance is acceptable?! could we use a different terminator scheme?