transmission signal quality metrics for fm iboc signals
TRANSCRIPT

Transmission Signal Quality Metrics for FM
IBOC Signals
Rev. 02.06 February 12, 2010
iBiquity Digital Corporation does not make any warranty or representation whatsoever as to the sufficiency or accuracy of information contained in this document. It is further acknowledged that there can be no assurance that this document will not change, perhaps substantially, in the future. Accordingly, iBiquity Digital Corporation assumes no responsibility arising from any present use or misuse of this document.
SY_TN_2646s

Copyright © 2009 – 2010 iBiquity Digital Corporation All rights reserved. The contents of this publication may not be reproduced in any media without the express written permission of iBiquity Digital Corporation.
TRADEMARKS The iBiquity Digital logo, “iBiquity Digital”, "iBiquity", the HD Radio logo and the HD logo are registered trademarks of iBiquity Digital Corporation. “HD Radio” is a trademark of iBiquity Digital Corporation. All other trademarks, whether claimed or registered, are the exclusive property of their respective owners. iBiquity Digital Corporation 6711 Columbia Gateway Drive, Suite 500 Columbia, MD 21046 Voice: 443-539-4290 Fax: 443-539-4291 E-mail address: [email protected]
Doc. No.: SY_TN_2646s

Transmission Signal Quality Metrics for FM IBOC Signals
Table of Contents
Contents 1 ABSTRACT.......................................................................................................................................................1 2 ACKNOWLEDGEMENTS................................................................................................................................2 3 REFERENCES..................................................................................................................................................3 4 ABBREVIATIONS, SYMBOLS, AND ACRONYMS.......................................................................................4
4.1 Abbreviations, Symbols, Acronyms ..........................................................................................................4 5 MEASUREMENT CONDITIONS......................................................................................................................5 6 PHASE ADJUSTMENT FOR EACH REFERENCE SUBCARRIER.............................................................6 7 SIGNAL MAGNITUDES AND GAIN DEVIATION ..........................................................................................7 8 GROUP DELAY................................................................................................................................................8 9 REFERENCE SUBCARRIER MER.................................................................................................................9 10 PAPR REDUCTION NOISE ON DATA SUBCARRIERS ............................................................................10 11 EQUALIZATION OF DATA SUBCARRIERS ...............................................................................................11 12 PAPR REDUCTION ALGORITHM INCREASES SUBCARRIER POWER................................................12 13 DATA SUBCARRIER PARTITION MER.......................................................................................................13 14 PROPOSED CHANGES TO NRSC-5 TRANSMISSION SPEC, SUBSECTION 4.8 .................................14 APPENDIX A FREQUENCY AND SYMBOL TIMING ACQUISITION FROM FM IBOC MER
MEASUREMENT............................................................................................................................................16 OFDM Demodulation of the Block of N Symbols ............................................................................................17 MathCad Example .............................................................................................................................................18
APPENDIX B COMPUTED MER VALUES AND MEASURED RECEIVER PERFORMANCE USING
IBIQUITY REFERENCE TEST DATA ...........................................................................................................21 Discussion..........................................................................................................................................................23 Constellation Plots.............................................................................................................................................25 PAPR-Reduction-Enabled Constellation Plots ..................................................................................................25 PAPR-Reduction-Disabled Constellation Plots.................................................................................................30 Plots of MER versus Partition Index/Subcarrier Index......................................................................................35 Data MER versus Partition Index ......................................................................................................................35 Reference MER versus Reference Subcarrier Index..........................................................................................40
Doc. No.: SY_TN_2646s i Rev.: 02.06

Transmission Signal Quality Metrics for FM IBOC Signals
List of Figures Figure A-1: Symbol Synchronization and Frequency Acquisition ..............................................................................18 Figure A-2: OFDM Time Domain Signal....................................................................................................................19 Figure A-3: OFDM Frequency Domain Waveform ....................................................................................................19 Figure A-4: Match-Filtered Autocorrelation ...............................................................................................................19 Figure A-5: Demodulated OFDM Symbol Constellation ............................................................................................20 Figure B-1: P1 Bit Error Ratio and PIDS Block Error Ratio vs. Cd/No......................................................................22 Figure B-2: IBOC Constellation with PAPR Reduction Enabled – No Added Noise .................................................25 Figure B-3: IBOC Constellation with PAPR Reduction Enabled – Cd/No = 68 dB-Hz .............................................26 Figure B-4: IBOC Constellation with PAPR Reduction Enabled – Cd/No = 64 dB-Hz .............................................27 Figure B-5: IBOC Constellation with PAPR Reduction Enabled – Cd/No = 56 dB-Hz .............................................28 Figure B-6: IBOC Constellation with PAPR Reduction Enabled – Cd/No = 52 dB-Hz .............................................29 Figure B-7: IBOC Constellation with PAPR Reduction Disabled – No Added Noise................................................30 Figure B-8: IBOC Constellation with PAPR Reduction Disabled – Cd/No = 68 dB-Hz ............................................31 Figure B-9: IBOC Constellation with PAPR Reduction Disabled – Cd/No = 64 dB-Hz ............................................32 Figure B-10: IBOC Constellation with PAPR Reduction Disabled – Cd/No = 56 dB-Hz ..........................................33 Figure B-11: IBOC Constellation with PAPR Reduction Disabled – Cd/No = 52 dB-Hz ..........................................34 Figure B-12: Data MER with PAPR Reduction Enabled – no noise...........................................................................35 Figure B-13: Data MER with PAPR Reduction Disabled – Cd/No = 68 dB-Hz.........................................................36 Figure B-14: Data MER with PAPR Reduction Disabled – Cd/No = 64 dB-Hz.........................................................37 Figure B-15: Data MER with PAPR Reduction Disabled – Cd/No = 56 dB-Hz.........................................................38 Figure B-16: Data MER with PAPR Reduction Disabled – Cd/No = 52 dB-Hz.........................................................39 Figure B-17: Reference MER with PAPR Reduction Enabled – no noise ..................................................................40 Figure B-18: Reference MER with PAPR Reduction Disabled – Cd/No = 68 dB-Hz ................................................41 Figure B-19: Reference MER with PAPR Reduction Disabled – Cd/No = 64 dB-Hz ................................................42 Figure B-20: Reference MER with PAPR Reduction Disabled – Cd/No = 56 dB-Hz ................................................43 Figure B-21: Reference MER with PAPR Reduction Disabled – Cd/No = 52 dB-Hz ................................................44
List of Tables Table 5-1: Active Subcarriers per Service Mode...........................................................................................................5 Table B-1: Computed MER Values and Measured Receiver Performance .................................................................21
Doc. No.: SY_TN_2646s ii Rev.: 02.06

Transmission Signal Quality Metrics for FM IBOC Signals
1 Abstract
This technical report describes the measurement of several transmission signal quality metrics specified in reference [1] for FM In-Band-On-Channel (IBOC) signals defined in reference [2]. In particular, the metrics are intended to assess signal distortion due to both nonlinear high-power amplifier (HPA) characteristics as well as linear filtering. The effects of the Peak-to-Average Power Ratio (PAPR) reduction algorithm on the reference subcarriers and the data (non-reference) subcarriers are measured with different metrics, as appropriate. Group delay and gain variation across subcarriers may also be measured with the techniques described.
Doc. No.: SY_TN_2646s 1 Rev.: 02.06

Transmission Signal Quality Metrics for FM IBOC Signals
2 Acknowledgements
The selection of Modulation Error Ratio (MER) as the HD Radio transmission signal quality metric for the FM IBOC signal and the method of measuring MER on the FM IBOC signal was developed by a working group of technologists representing iBiquity Digital, Broadcast Electronics, Continental Electronics, Harris Broadcast, Nautel Ltd., and other interested participants from the US radio broadcast industry. This group of technologists reached full consensus on the standardized method for FM IBOC signal MER measurement described in this document. The list of regular participants included: Geoffrey Mendenhall, Working Group Chairman - Harris Broadcast Kevin Berndsen – Harris Broadcast Harvey Chalmers – iBiquity Digital Jeff Detweiler – iBiquity Digital David Gates – Cesium Communications Tim Hardy – Nautel Ltd. Dave Hershberger – Continental Electronics John Kean – NPR Laboratories Brian Kroeger – iBiquity Digital Dave Kroeger – Broadcast Electronics David Layer – NAB Science & Technology David Maxson – Broadcast Signal Lab Phillip Schmid – Nautel Ltd. Burt Weiner – Burt I. Weiner Associates A special acknowledgement is extended to Kevin Berndsen, Harvey Chalmers, Dave Hershberger, Brian Kroeger, and Phillip Schmid for doing the majority of the work to develop, test, and verify the HD Radio MER measurement method described in this document.
Doc. No.: SY_TN_2646s 2 Rev.: 02.06
Transmission Signal Quality Metrics for FM IBOC Signals
3 References
[1] NRSC-5-B, “HD Radio™ FM Transmission System Specifications.” Document Number: SY_SSS_1026s.
[2] NRSC-5-B, “HD Radio™ HD Radio™ Air Interface Design Description Layer 1 FM.” Document Number: SY_SSS_1011s.
[3] NRSC-G201, “NRSC-5 RF Mask Compliance: Measurement Methods and Practice.”
Doc. No.: SY_TN_2646s 3 Rev.: 02.06

Transmission Signal Quality Metrics for FM IBOC Signals
4 Abbreviations, Symbols, and Acronyms
4.1 Abbreviations, Symbols, Acronyms
BPSK Binary Phase Shift Keying
dB decibel
EVM Error Vector Magnitude
FFT Fast Fourier Transform
FM Frequency Modulation
HPA High Power Amplifier
Hz Hertz
I In-Phase
IBOC In-Band-On-Channel
L1 Layer One
MER Modulation Error Ratio
NRSC National Radio Systems Committee
OFDM Orthogonal Frequency Division Multiplexing
PAPR Peak-to-Average Power Ratio
PLL Phase-Locked Loop
PPM parts per million
Q Quadrature
QPSK Quadrature Phase Shift Keying
RF Radio Frequency
rms Root Mean Square
Doc. No.: SY_TN_2646s 4 Rev.: 02.06

Transmission Signal Quality Metrics for FM IBOC Signals
5 Measurement Conditions
Prior to OFDM demodulation, it is first necessary to perform frequency and symbol synchronization commonly across all subcarriers. A suggested method to accomplish this is described in Appendix A.
The sample rate (nominally 744187.5 complex samples per second) should be locked to 2160 times the symbol rate (nominally 344.53125 Hz). It is important that the symbol synchronization is accurate, since any symbol timing error will cause a linear phase shift across the subcarriers. However, group delay variations across the subcarriers will prevent perfect timing for every subcarrier. Further timing correction for individual subcarriers should not be implemented since this is an error we want to measure. Of course, both frequency and symbol synchronization algorithms already exist for receivers. For the purposes of these static measurements in non-real-time, a block of at least 128 OFDM symbols can be used to estimate the frequency and symbol timing parameters as a block (instead of PLLs, etc.), simplifying the synchronization process.
The first step is to capture N contiguous symbols of 2160 complex baseband samples each, where N is the block size. For good results, N should be 128 or greater. A value of 512 symbols corresponds to a total time span of one L1 Frame period (1.486 seconds).
A cyclic folding with root-Nyquist pulse shape weighting operation should be applied to each OFDM symbol, converting the 2160 samples into 2048. Next, a 2048-point FFT should be computed for each of the N symbols. The bins of the FFT correspond to the OFDM subcarriers.
Some of the transmission signal quality measurements specified in reference [1] may be conveniently computed using the reference subcarriers. These measurements include gain variation, group delay variation and error vector magnitude (EVM). However, in place of EVM, a slight variant called modulation error ratio (MER) is proposed in order to be in better alignment with standard practices within the broadcast industry.
The subcarrier index m corresponds to the active reference subcarriers, where m ∈ {−546, −527, −508, −489, −470. −451, −432, −413, −394, −375, −356, −337, −318, −299, −280, 280, 299, 318, 337, 356, 375, 394, 413, 432, 451, 470, 489, 508, 527, 546}. The active subcarriers per service mode are given in Table 5-1. Refer to [2] for further details.
Table 5-1: Active Subcarriers per Service Mode
Active Reference Subcarriers Service Mode
Lower Sideband Upper Sideband
MP1 −546, −527, −508, −489, −470. −451, −432, −413, −394, −375, −356
356, 375, 394, 413, 432, 451, 470, 489, 508, 527, 546
MP2 −546, −527, −508, −489, −470. −451, −432, −413, −394, −375, −356, −337
337, 356, 375, 394, 413, 432, 451, 470, 489, 508, 527, 546
MP3 −546, −527, −508, −489, −470. −451, −432, −413, −394, −375, −356, −337, −318
318, 337, 356, 375, 394, 413, 432, 451, 470, 489, 508, 527, 546
MP5, MP6, MP11
−546, −527, −508, −489, −470. −451, −432, −413, −394, −375, −356, −337, −318, −299, −280
280, 299, 318, 337, 356, 375, 394, 413, 432, 451, 470, 489, 508, 527, 546
Doc. No.: SY_TN_2646s 5 Rev.: 02.06

Transmission Signal Quality Metrics for FM IBOC Signals
6 Phase Adjustment for each Reference Subcarrier
The average phase φ in radians (with ambiguity of π radians) of each reference subcarrier is computed as the argument (-π to π) of the sum of the squared reference symbol samples (where the reference symbol samples are denoted by r), divided by 2. The division by 2 is necessary because the squaring of the samples doubles the phase. This phase represents the phase of the BPSK symbol constellation point.
.2π
2π ; rarg
21
m
1N
0n
2mn,m <ϕ≤−⎪⎭
⎪⎬⎫
⎪⎩
⎪⎨⎧
=ϕ ∑−
=
A sample rate (frequency) error between the exciter clock and the measurement equipment will result in a linear phase ramp over the time span for any one subcarrier. The span of this ramp is proportional to the sample error drift over the signal duration. The slope of the ramp is computed for each subcarrier index m.
( )2πslope
2π ; rrarg
21
dnd
slope m
1N
1n
2*m1,nmn,
mn,m <≤−
⎪⎭
⎪⎬⎫
⎪⎩
⎪⎨⎧
⋅⋅=ϕ
= ∑−
=−
The phase can now be estimated for each OFDM symbol, and for each reference subcarrier.
⎟⎠⎞
⎜⎝⎛ −
−⋅+ϕ=ϕ2
1Nnslopemmmn,
For subsequent magnitude and noise computations, the BPSK symbols of each reference subcarrier are phase-adjusted to place the nominal BPSK constellation points on the real axis.
mn,jmn,mn, eru ϕ⋅−⋅=
For these cases it is assumed that the reference subcarriers are not processed by the PAPR reduction algorithm, and the distortion of I and Q is small at the exciter output. However, some versions of the PAPR reduction algorithm allow some amplitude variation of the reference subcarriers, although well within acceptable noise-level limits. This is primarily a measure of the signal distortion caused by the path (e.g., HPA and filters) between the exciter output and the antenna.
The above algorithms should work well for a sample clock frequency error of approximately ±2.5 PPM for a block size of N=512. The tolerance is inversely proportional to the block size so that if N=128, a tolerance of ±10 PPM is acceptable.
Doc. No.: SY_TN_2646s 6 Rev.: 02.06

Transmission Signal Quality Metrics for FM IBOC Signals
7 Signal Magnitudes and Gain Deviation
The mean of the magnitude of each BPSK reference subcarrier can now be conveniently computed as the mean of the absolute value of the real part of the phase-adjusted symbols.
{ }∑−
=
⋅=1
0,Re1 N
nmnm u
Nsmag ;
where N = the total number of OFDM symbols.
The gain variation across the subcarriers is determined by
( )( ) ⎟⎟⎠
⎞⎜⎜⎝
⎛⋅=Δ
smagsmagGdB
minmaxlog20
The above computation is a convenient way to verify the NRSC-5-B gain flatness specification [1], Subsection 4.9.
Doc. No.: SY_TN_2646s 7 Rev.: 02.06

Transmission Signal Quality Metrics for FM IBOC Signals
8 Group Delay
The local group delay can be approximated over a finite frequency difference between any two adjacent reference subcarriers indexed m and m+19 (19 subcarrier spacing). The average phase φm for each reference subcarrier is used for this computation.
( ) snanosecond 23052τly,equivalent or
s, second135/128344.5312519π2
τ
m19m19mm,
m19m19mm,
ϕ−ϕ⋅=
⋅⋅⋅⋅ϕ−ϕ
=
++
++
The maximum group delay variation is estimated by
( ) )min(maxmax τττ −=Δ
The above computation is a convenient way to verify the NRSC-5-B group delay flatness specification [1], Subsection 4.10.
Any additional group delay caused by symbol synchronization timing error will not affect this difference. Note that the specification is equivalent to 0.75 degrees over a frequency span between the two reference subcarriers with the minimum and maximum group delay.
Doc. No.: SY_TN_2646s 8 Rev.: 02.06

Transmission Signal Quality Metrics for FM IBOC Signals
9 Reference Subcarrier MER
The rms noise may be computed for each (phase-adjusted) reference subcarrier. This noise is normalized to the subcarrier nominal magnitude.
{ }( ) { }[ ]∑−
=
+−⋅⋅=1
0
2,
2, ImRe11)(
N
nmnmmn
mm usmagu
NsmagrefN
The normalized rms noise is then converted to MER:
{ }mm refNrefMER )(log20)( ⋅−= , or equivalently
Equation 1: MER per Reference Subcarrier
{ }( ) { }[ ]⎟⎟⎠
⎞⎜⎜⎝
⎛+−⋅
⋅⋅−= ∑
−
=
1
0
2,
2,210 ImRe1log10)(
N
nmnmmn
mm usmagu
smagNrefMER
Equation 1 computes the MER for each individual reference subcarrier. To get a single signal quality metric for all reference subcarriers, the MER values can be averaged according to Equation 2.
Equation 2: Composite MER Measurement for all Reference Subcarriers
∑⋅=m
refMERAvg
m
MrefMER 10/)(
10 101log10)(
In Equation 2, the sum is computed for active reference subcarriers and M equals the total number of active reference subcarriers.
It should be noted that the composite MER measurement computed by Equation 2 excludes any group delay or amplitude variations across the channel bandwidth. This is because each reference subcarrier has been separately adjusted for amplitude and phase variations as described in Sections 6 and 7. This is appropriate since the receiver will also process each reference subcarrier separately. Amplitude and group delay distortions are specified separately in [2] and do not need to be included in the MER.
In addition, the reference subcarriers do not have the PAPR reduction algorithm applied. So the reference subcarrier MER is a good measure of the signal constellation spread caused by noise and distortion introduced solely by the transmission signal path after the digital to analog conversion in the exgine/exciter.
Doc. No.: SY_TN_2646s 9 Rev.: 02.06

Transmission Signal Quality Metrics for FM IBOC Signals
10 PAPR Reduction Noise on Data Subcarriers
The PAPR reduction algorithm introduces noise onto the data-bearing, non-reference subcarriers. Since these noise samples are intentionally biased in a way that mitigates errors, a simple rms or MER computation is not appropriate here. The measurement strategy is to first adjust the symbol constellations of the data subcarriers such that the constellation points are centered in the quadrants, and the in-phase (I) and quadrature (Q) components of each point is nominally ±1. The metric in this case would penalize values that are closer to the decision region axes.
Doc. No.: SY_TN_2646s 10 Rev.: 02.06

Transmission Signal Quality Metrics for FM IBOC Signals
11 Equalization of Data Subcarriers
The data subcarriers within each partition of 18 carriers bounded by reference subcarriers on either side must be equalized to perform subsequent measurements. A linear interpolation of the outer reference subcarriers is used to equalize each data subcarrier across each OFDM symbol. The reference phases are first adjusted to avoid complications due to modulo π wrapping.
If 2π
19mn,mn, >ϕ−ϕ + , then let π19mn,19mn, +ϕ=ϕ ++ ;
where n is the OFDM symbol index, m is the index of the Active Reference Subcarrier to the left (lower index number) of the partition, φn,m and φn,m+19 are the phases of the corresponding reference subcarriers that bound the partition, and φn,m+19 may be adjusted for the modulo π wrap case.
Notice that there is no partition corresponding to the largest value of m for each sideband. Next, compute a set of 18 equalizer coefficients to be applied to each of the 18 data subcarriers (k=1,2,…18). A phase shift of π/4 (equivalently a factor of 1+j) is also applied to center the QPSK constellations in the quadrants. The equalizer coefficients are computed as
( )( ) ( )
1,2...18k;esmagkesmagk19
j119C19mn,mn, j
19mj
mkn, =
⋅⋅+⋅⋅−
+⋅=
+ϕ⋅+
ϕ⋅
Then apply the equalizer coefficients to the data subcarrier symbols within each partition.
18,...2,1;,,, =⋅= ++ kCsv knkmnkmn
Doc. No.: SY_TN_2646s 11 Rev.: 02.06

Transmission Signal Quality Metrics for FM IBOC Signals
12 PAPR Reduction Algorithm Increases Subcarrier Power
The PAPR reduction (noise) causes a modest increase in digital signal power (e.g., 0.5 dB), which must be adjusted back to the target power level. This post-PAPR reduction adjustment should simply scale all subcarriers equally with a single gain factor. Also, the power increase of the reference subcarriers is generally less than the power increase of the data subcarriers. Although we know that the present PAPR reduction algorithm requires only a small gain adjustment (e.g., 0.5 dB), the change in ratio between the reference and data subcarriers power level should be limited. The average reference subcarrier power and the average overall power are computed. The average subcarrier power over all subcarriers is computed as
{ }( ) { }( )[ ] ImRe1 546
546
1
0
2,
2,∑ ∑
−=
−
=
+⋅
=sc
N
nscnscnavg vv
SCNP ;
where SC is the number of active subcarriers, and the outer summation is computed only for subcarrier indices pertaining to active subcarriers.
Note that -546 and 546 represent the minimum and maximum possible subcarrier indices.
The average power of the reference subcarriers is
{ }( ) {( )}[ ]∑∑−
=
+=m
N
nmnmnref vv
MP
1
0
2,
2, ImRe1
;
where M is the number of active reference subcarriers, and m are the active reference subcarrier indices.
Since there is generally one reference subcarrier for every 18 data subcarriers, the voltage ratio R of the average data subcarrier to the reference subcarrier may be very closely approximated by:
ref
refavg
PPP
R⋅
−⋅≈
1819
Equation 3: Computation of Data Subcarrier to Reference Subcarrier Power in dB
( )RRdB 10log20 ⋅=
This ratio is related to the expected loss due to the PAPR reduction power increase, and subsequent power-level adjustment. The computed value of R is used in the data subcarrier MER measurements.
Note: In the Data MER expressions (below), R restores the proper level of reference subcarriers for the computation and prevents the possibility of artificially lowering the reference subcarriers to improve MER results.
Doc. No.: SY_TN_2646s 12 Rev.: 02.06

Transmission Signal Quality Metrics for FM IBOC Signals
13 Data Subcarrier Partition MER
In this subsection, the noise metric computation for partition m is described, where m is the index of the active Reference Subcarrier to the left (lower index number) of the partition. Note that in this calculation, the reference subcarrier is not included.
{ }{ }( ) { }{ }( )[ ]∑∑=
−
=++ −+−⋅
⋅=
18
1
1
0
2,
2, Im,0maxRe,0max
181)(
k
N
nkmnkmnm vRvR
NdatN
{ }mm datNdatMER )(log20)( 10⋅−= , or equivalently
Equation 4: MER per 18-Data-Subcarrier Partition
{ }{ }( ) { }{ }( )[ ]⎟⎟⎟⎟
⎠
⎞
⎜⎜⎜⎜
⎝
⎛
−+−
⋅⋅=
∑∑=
−
=++
18
1
1
0
2,
2,
10
Im,0maxRe,0max
18log10)(
k
N
nkmnkmn
m
vRvR
NdatMER
Equation 4 computes the MER for a single partition. To get a single signal quality metric for all data subcarriers, the MER values can be averaged according to Equation 5.
Equation 5: Composite MER Measurement for all Data Subcarriers
∑⋅=m
datMERAvg
m
MdatMER 10/)(
10 101log10)(
where the sum is computed for active partitions and M equals the total number of partitions
The above equations may be used to assess whether or not the digital transmission system is in compliance with the requirements stated in Subsection 4.8 of reference [1]. Refer to the next section of this document for proposed changes to these requirements. The MER is inclusive of any distortions caused by the PAPR reduction algorithm as well as any local variations in amplitude and group delay not removed by the equalizer described in Section 11. Thus it should be very indicative of actual receiver performance.
The intent of the specifications proposed in the next section of this document is to utilize MER to evaluate the performance of the transmission system equipment as measured at the RF output connection point to the antenna system. However, it must be noted that the same MER computations could be accomplished by a monitor receiver located at the broadcaster installation in order to evaluate the effects of the antenna system as well as any interference to the digital subcarriers caused by an overmodulated or otherwise distorted analog FM host signal. iBiquity will not impose specific requirements on this. But they may offer voluntary recommendations in the future, once the MER specifications have been fully characterized. For example, the broadcaster could utilize an MER monitor receiver to signal an alarm indicating a fault condition that may be compromising receiver performance in the field.
Doc. No.: SY_TN_2646s 13 Rev.: 02.06

Transmission Signal Quality Metrics for FM IBOC Signals
14 Proposed Changes to NRSC-5 Transmission Spec, Subsection 4.8
Reference [1], Subsection 4.8, specifies the EVM requirements for the HD Radio system. Both an average requirement as well as a worst-case requirement for a single subcarrier is listed:
Average EVM not to exceed 10% → Equivalent MER = 20 dB
Worst-Case individual subcarrier EVM not to exceed 20% → Equivalent MER = 14 dB
These figures included a reasonable amount of margin. However, the current HD Radio system has never been verified in this manner due to the lack of a unified test procedure. Given the proposed MER measurement techniques proposed in this paper, the following changes to NRSC-5, Subsection 4.8 are offered. Information within this section that is enclosed in brace brackets {} is subject to change.
4.8 Modulation Error Ratio
The following specifications shall be met, using the test configuration described in Subsection 4.2 of Reference [3].
4.8.1 Reference Subcarriers
1. The MER for each and every Binary Phase Shift Keying (BPSK) reference subcarrier, measured at the RF output of the transmission system at the connection point to the antenna system (including any RF filters), shall be greater than or equal to {11} dB, as computed by Equation 1. The parameter N in Equation 1, the total number of contiguous symbols used in the average, shall be set to {128}.
2. The average MER of the Binary Phase Shift Keying (BPSK) reference subcarriers, measured at the RF output of the transmission system at the connection point to the antenna system (including any RF filters), shall be greater than or equal to {14} dB, averaged across all reference subcarriers, as computed by Equation 2. This computation shall be based on a block of N = {128} contiguous symbols.
4.8.2 Data Subcarriers
1. The MER for each and every Quadrature Phase Shift Keying (QPSK) data subcarrier partition, measured at the RF output of the transmission system at the connection point to the antenna system (including any RF filters), shall be greater than or equal to {11} dB, as computed by Equation 4. The parameter N in Equation 4, the total number of contiguous symbols used in the average, shall be set to {128}.
2. The average MER of the Quadrature Phase Shift Keying (QPSK) data subcarriers, measured at the RF output of the transmission system at the connection point to the antenna system (including any RF filters), shall be greater than or equal to {14} dB, averaged across all data subcarrier partitions, as computed by Equation 5. This computation shall be based on a block of N = {128} contiguous symbols.
Doc. No.: SY_TN_2646s 14 Rev.: 02.06

Transmission Signal Quality Metrics for FM IBOC Signals
4.8.3 Data Subcarrier to Reference Subcarrier Power Ratio
In addition to the gain flatness specifications stated in Subsection 4.9, the ratio of the average data subcarrier power to the average reference subcarrier power, as computed by Equation 3, shall comply with the following limits:
0.15.0 ≤≤− dBR dB
Comments
The language from the original NRSC-5 specifications regarding the measurement point has been retained.
Note that the proposed data MER specifications are equivalent to the original EVM values. The reference subcarrier MER has been relaxed several dB, removing much of the original margin. This will still provide acceptable performance. The data subcarrier specifications are tighter primarily to account for the different measurement techniques.
All of the specifications listed above need to be confirmed via actual system-level testing.
For individual equipment specifications, such as for an exciter/exgine, all of the language above is still valid, except that the measurement point will be different, and it may be desirable to tighten the specifications somewhat.
Doc. No.: SY_TN_2646s 15 Rev.: 02.06

Transmission Signal Quality Metrics for FM IBOC Signals
Appendix A Frequency and Symbol Timing Acquisition from FM IBOC MER Measurement
This section provides a suggestion for performing synchronization of the carrier frequency and symbol timing.
The sample rate, fs=744,187.5 Hz. Symbol timing is less sensitive to sample rate frequency errors than is the carrier phase. So the sample rate frequency tolerances discussed in Section 6 apply here as well.
If the analog FM signal is present, it must first be removed in order for the techniques described here to work properly.
In order to process N “complete” symbols, each consisting of K=2160 complex signal samples, an additional symbol is buffered to accommodate the possibility of partial symbols at the boundaries (the minimum number of required additional samples is actually one sample less than a whole symbol). The total number of input complex signal samples is then (N+1)·K.
The sequence of signal samples xn , n=0,…, [(N+1)·K]-1, is complex-conjugate multiplied by the sequence delayed by 2048 samples (i.e., xn+2048). The products are stored in a single-symbol, K-sample complex buffer by folding modulo K. Notice that only N symbols are processed (not N+1) to allow for the delay.
( ) ( )*
2048,mod,mod +⋅+= nnKnKn xxyy ; for n=0,…,N·K-1
where * indicates complex conjugate, and y is previously initialized to zero because of the recursive operation. Next the vector y is match-filtered, using cyclic convolution, for the expected cyclic prefix autocorrelation pulse shape h, to produce vector v.
(∑=
+⋅=111
1,mod
mKmkmk yhv ) ; k=0,…,K-1
where ⎟⎠⎞
⎜⎝⎛ ⋅
=112
sin πmhm ; m=0,…111
The sample offset error is simply computed as the index of the peak magnitude sample of the vector v. This corresponds to the starting (zero index) sample of the first complete symbol. Symbol synchronization to the nearest whole sample is sufficient, since the subsequent equalization process will remove the linear phase distortion resulting from residual symbol timing error.
samperr= index k ; corresponding to kvk
max
The estimated frequency error computed in Hz is
{ }{ }⎟⎟⎠
⎞⎜⎜⎝
⎛⋅
⋅⋅−
=samperr
samperr
vvfsfreqerr
ReIm
arctan20482 π
The sample and frequency error estimates are then used to adjust the original sequence, and output exactly N synchronized symbols.
( ) { }fsnfreqerrjxxadj samperrnn /2exp ⋅⋅⋅⋅−⋅= + π ; for n=0,…,K·N-1
Doc. No.: SY_TN_2646s 16 Rev.: 02.06

Transmission Signal Quality Metrics for FM IBOC Signals
OFDM Demodulation of the Block of N Symbols
Demodulation of the block of N OFDM symbols is next. Define the root-raised cosine Nyquist pulse shape window function for k=0,…,K-1, and K=2160.
( )
⎪⎪⎪
⎩
⎪⎪⎪
⎨
⎧
>⎟⎠⎞
⎜⎝⎛ π⋅−
<⎟⎠⎞
⎜⎝⎛ π⋅
=
otherwise ;
if ;
if ;
1
2048224
sin
112224
sin
kkK
kk
wink
The demodulation of a signal vector consisting of a block of N synchronized symbols can be computed as follows. First initialize the matrix sig for the appropriate size (2048 rows by N columns), and zero-fill to accommodate the initial condition of the recursive computation.
01,2047 =−Nsig
Arrange the signal column vector into a matrix of N symbol column vectors. Then window and fold the ending cyclic suffix onto the prefix.
[ ]
symbols) (i.e., 1,...,0
; ,mod,2048,mod,2048,mod
NNKn
winxadjsigsig KnnKn
floorKKn
floornKn
floorKKn
floorn
−⋅=
⋅+=⎟⎠⎞
⎜⎝⎛
⎥⎦
⎤⎢⎣
⎡⋅⎟⎠⎞
⎜⎝⎛−⎟
⎠⎞
⎜⎝⎛
⎥⎦
⎤⎢⎣
⎡⋅⎟⎠⎞
⎜⎝⎛−
Demodulate each column (OFDM symbol) of sig using complex FFT, and appropriate scaling such that constellation points are nominally (±1, ±1), with possible phase rotation.
( ) ( ) 135
1912256)column (column _ ⋅⋅⋅= msigCFFTmVECTOROFDM ; m=0,… N-1
A symbol timing error (samperr) results in a phase rotation of the constellation across subcarriers (k). There is no phase rotation over time (not affected by m). The phase rotation is resolved by the equalizer.
A frequency error (freqerr) results in a phase rotation of the constellation for any one subcarrier over time (m). Even one Hz error causes more than one full rotation over 512 symbols. However, all subcarriers are in phase sync. This frequency estimate algorithm is very accurate, and should result in no significant phase rotation. The fixed phase offset is arbitrary, and is resolved by the equalizer (phase just happens to be zero in this simulation).
Doc. No.: SY_TN_2646s 17 Rev.: 02.06

Transmission Signal Quality Metrics for FM IBOC Signals
MathCad Example
Figure A-1: Symbol Synchronization and Frequency Acquisition
Doc. No.: SY_TN_2646s 18 Rev.: 02.06

Transmission Signal Quality Metrics for FM IBOC Signals
Figure A-2: OFDM Time Domain Signal
Figure A-3: OFDM Frequency Domain Waveform
Figure A-4: Match-Filtered Autocorrelation
Doc. No.: SY_TN_2646s 19 Rev.: 02.06

Transmission Signal Quality Metrics for FM IBOC Signals
Doc. No.: SY_TN_2646s 20 Rev.: 02.06
Figure A-5: Demodulated OFDM Symbol Constellation
Transmission Signal Quality Metrics for FM IBOC Signals
Appendix B Computed MER Values and Measured Receiver Performance Using iBiquity Reference Test Data
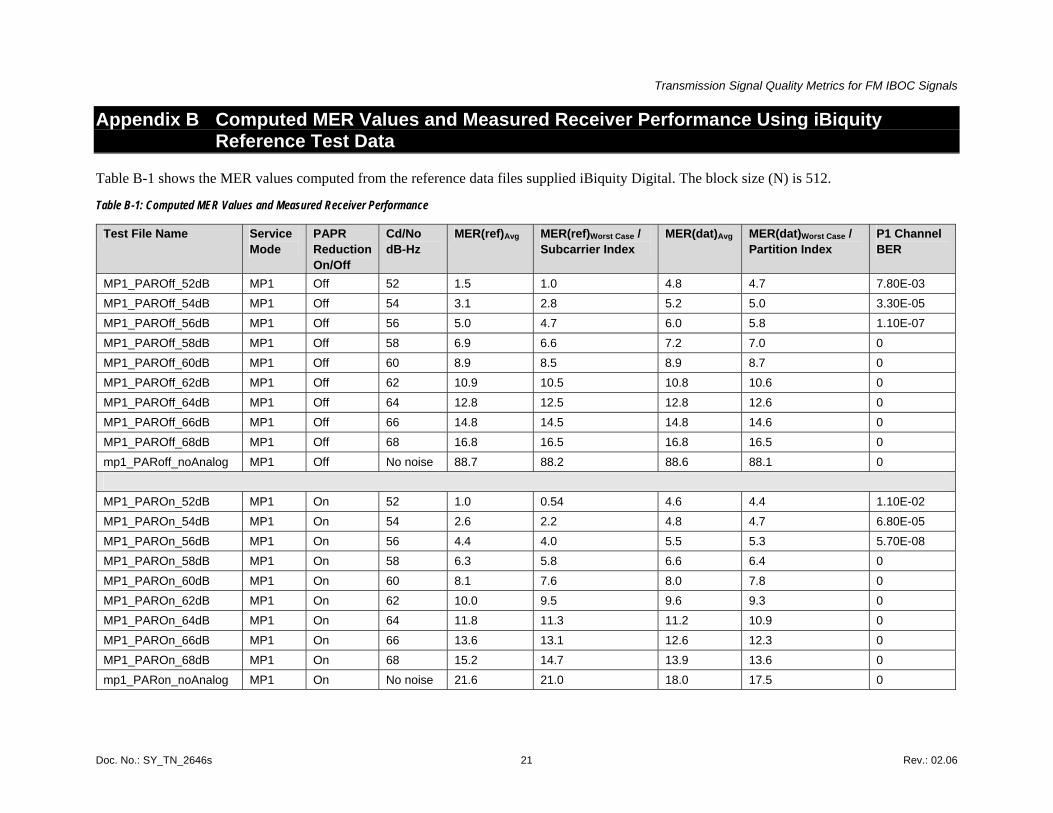
Table B-1 shows the MER values computed from the reference data files supplied iBiquity Digital. The block size (N) is 512.
Table B-1: Computed MER Values and Measured Receiver Performance
Test File Name Service Mode
PAPR Reduction On/Off
Cd/No dB-Hz
MER(ref)Avg MER(ref)Worst Case / Subcarrier Index
MER(dat)Avg MER(dat)Worst Case / Partition Index
P1 Channel BER
MP1_PAROff_52dB MP1 Off 52 1.5 1.0 4.8 4.7 7.80E-03 MP1_PAROff_54dB MP1 Off 54 3.1 2.8 5.2 5.0 3.30E-05 MP1_PAROff_56dB MP1 Off 56 5.0 4.7 6.0 5.8 1.10E-07 MP1_PAROff_58dB MP1 Off 58 6.9 6.6 7.2 7.0 0 MP1_PAROff_60dB MP1 Off 60 8.9 8.5 8.9 8.7 0 MP1_PAROff_62dB MP1 Off 62 10.9 10.5 10.8 10.6 0 MP1_PAROff_64dB MP1 Off 64 12.8 12.5 12.8 12.6 0 MP1_PAROff_66dB MP1 Off 66 14.8 14.5 14.8 14.6 0 MP1_PAROff_68dB MP1 Off 68 16.8 16.5 16.8 16.5 0 mp1_PARoff_noAnalog MP1 Off No noise 88.7 88.2 88.6 88.1 0
MP1_PAROn_52dB MP1 On 52 1.0 0.54 4.6 4.4 1.10E-02 MP1_PAROn_54dB MP1 On 54 2.6 2.2 4.8 4.7 6.80E-05 MP1_PAROn_56dB MP1 On 56 4.4 4.0 5.5 5.3 5.70E-08 MP1_PAROn_58dB MP1 On 58 6.3 5.8 6.6 6.4 0 MP1_PAROn_60dB MP1 On 60 8.1 7.6 8.0 7.8 0 MP1_PAROn_62dB MP1 On 62 10.0 9.5 9.6 9.3 0 MP1_PAROn_64dB MP1 On 64 11.8 11.3 11.2 10.9 0 MP1_PAROn_66dB MP1 On 66 13.6 13.1 12.6 12.3 0 MP1_PAROn_68dB MP1 On 68 15.2 14.7 13.9 13.6 0 mp1_PARon_noAnalog MP1 On No noise 21.6 21.0 18.0 17.5 0
Doc. No.: SY_TN_2646s 21 Rev.: 02.06

Transmission Signal Quality Metrics for FM IBOC Signals
P1 Bit Error Ratio, PIDS Block Error Ratio vs. Cd/No
1.00E-08
1.00E-07
1.00E-06
1.00E-05
1.00E-04
1.00E-03
1.00E-02
1.00E-01
1.00E+00
52 53 54 55 56 57 58
Cd/No, dB-Hz
BER
/ B
LKER
PAPR Reduction OFF - P1 BERPAPR Reduction OFF - PIDS BLKERPAPR Reduction ON - P1 BERPAPR Reduction ON - PIDS BLKER
Figure B-1: P1 Bit Error Ratio and PIDS Block Error Ratio vs. Cd/No
Doc. No.: SY_TN_2646s 22 Rev.: 02.06

Transmission Signal Quality Metrics for FM IBOC Signals
Discussion
From the noise vectors analyzed here, it is apparent that as white Gaussian noise is added to the signal, the noise quickly dominates over the PAPR-reduction-induced constellation noise before bit errors become apparent. This statement is supported by comparing the MER numbers for the PAPR-reduction-enabled and PAPR-reduction-disabled cases versus the signal without added noise. The difference in MER numbers quickly diminishes with added noise, indicating that the introduced noise is dominating. Visual inspection of Figure B-4 and Figure B-9 shows that the constellations start to look quite similar when Cd/No=64 dB-Hz, where no bit errors are detected.
Bit errors are only detected when Cd/No=56 dB-Hz, where the difference in MER between the PAPR-reduction-enabled and PAPR-reduction-disabled cases is only about 0.5 dB.
The argument could be made that as long as the PAPR-reduction-induced constellation noise, as measured by the IBOC quality metric, is sufficiently better than the MER of the PAPR-reduction-disabled signal with added noise, then the impact of the PAPR-reduction-induced noise should be minimal to the received signal in an AWGN channel. So in the case where Cd/No=56 dB-Hz, the PAPR-reduction-disabled signal shows bit errors at a MER of 6.0 dB for data carriers and 5.0 dB for reference carriers. The PAPR-reduction-induced MER of 18.0 dB for data carriers and 21.6 dB for reference carriers provides a rather large margin before the system breaks down.
It is, however, prudent to add significant margin to account for multipath and mobile channel environments. The following analysis provides a method to derive a suitable MER specification point with a reasonable margin taken into account.
Consider a receiver that, due to channel noise, is operating approximately 2 dB above the blending point. According to the BER data, this is at Cd/No=56 dB-Hz. This is the point where the BER is around 10-7; or almost error free. Assume for this analysis that the transmission system is perfect; that is, equivalent to the “PAPR Reduction Off – No Added Noise” reference file (mp1_PARoff_noAnalog, Figure B-7).
It is recommended that, when a realistic transmission system is introduced into the above scenario, the total Cd/No of the link shall not be degraded by more than 0.5 dB; that is, Cd/No(total) ≥ 55.5 dB-Hz.
Cd/No(total) = Combined Cd/No of channel and transmitter.
This is computed by combining the noise from the two sources: No(total) = No(channel) + No(transmitter).
This computation must be a linear addition; so the No values must be converted from dB to linear.
For 0.5-dB degradation:
Cd/No(total) = 55.5 dB-Hz
55.5 = -10*log10{10-56/10 + 10-Cd/No(transmitter)}
Solving the above equation for Cd/No(transmitter), the following result is obtained:
Cd/No(transmitter) = 65 dB-Hz
Doc. No.: SY_TN_2646s 23 Rev.: 02.06

Transmission Signal Quality Metrics for FM IBOC Signals
Doc. No.: SY_TN_2646s 24 Rev.: 02.06
Referring to Table B-1, for the PAPR Reduction Off case, Cd/No=65 dB-Hz produces an average MER value of 13.8 dB for both the data and reference subcarriers. This can be obtained through interpolation of the MER cases for Cd/No= 64 dB-Hz and Cd/No=66 dB-Hz.
Rounding this average MER value to the nearest dB produces a specification of 14 dB. Allowing for a 3-dB margin for the worst case, the specification would be 11 dB. See Section 14.

Transmission Signal Quality Metrics for FM IBOC Signals
Constellation Plots
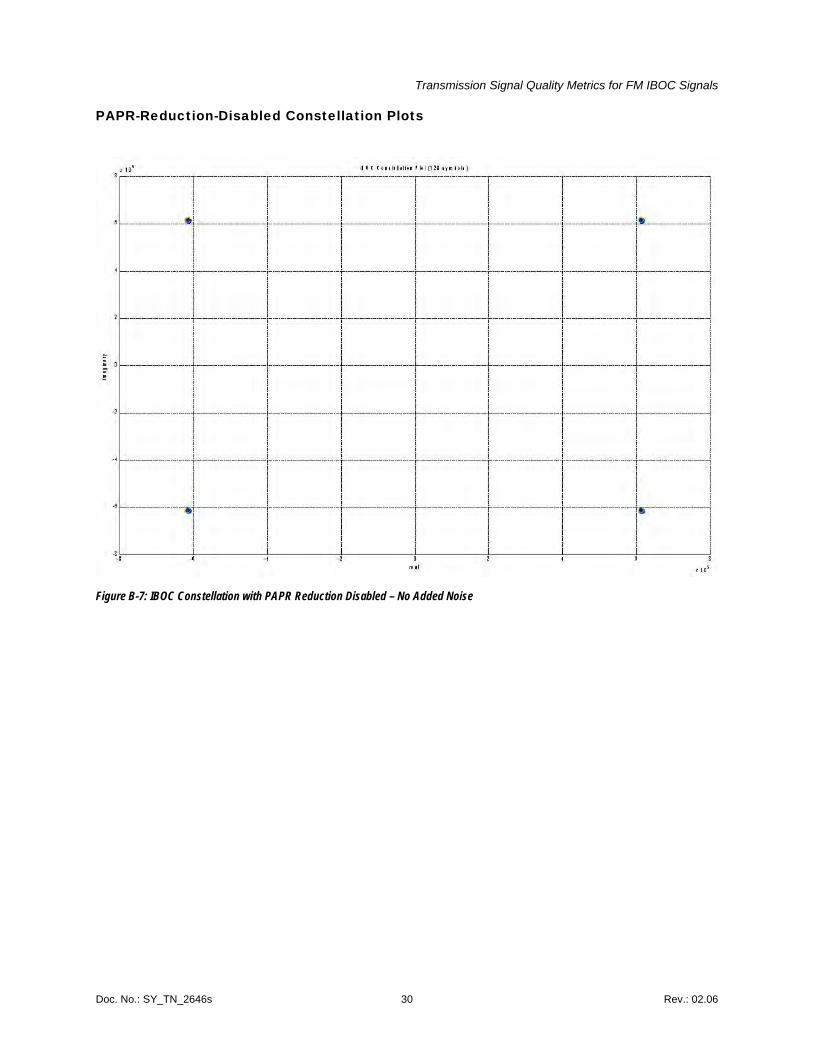
Figure B-2 through Figure B-6 show the signal constellations for various Cd/No values with PAPR-reduction-enabled; Figure B-7 through Figure B-11 show the equivalent cases with PAPR-reduction-disabled.
Data carriers are shown in blue, reference carriers are shown in red. The average power of the reference and data carriers is indicated by thicker blue and red dots with a green outline.
PAPR-Reduction-Enabled Constellation Plots
Figure B-2: IBOC Constellation with PAPR Reduction Enabled – No Added Noise
Doc. No.: SY_TN_2646s 25 Rev.: 02.06

Transmission Signal Quality Metrics for FM IBOC Signals
Figure B-3: IBOC Constellation with PAPR Reduction Enabled – Cd/No = 68 dB-Hz
Doc. No.: SY_TN_2646s 26 Rev.: 02.06

Transmission Signal Quality Metrics for FM IBOC Signals
Figure B-4: IBOC Constellation with PAPR Reduction Enabled – Cd/No = 64 dB-Hz
Doc. No.: SY_TN_2646s 27 Rev.: 02.06

Transmission Signal Quality Metrics for FM IBOC Signals
Figure B-5: IBOC Constellation with PAPR Reduction Enabled – Cd/No = 56 dB-Hz
Doc. No.: SY_TN_2646s 28 Rev.: 02.06

Transmission Signal Quality Metrics for FM IBOC Signals
Figure B-6: IBOC Constellation with PAPR Reduction Enabled – Cd/No = 52 dB-Hz
Doc. No.: SY_TN_2646s 29 Rev.: 02.06
Transmission Signal Quality Metrics for FM IBOC Signals
PAPR-Reduction-Disabled Constellation Plots
Figure B-7: IBOC Constellation with PAPR Reduction Disabled – No Added Noise
Doc. No.: SY_TN_2646s 30 Rev.: 02.06
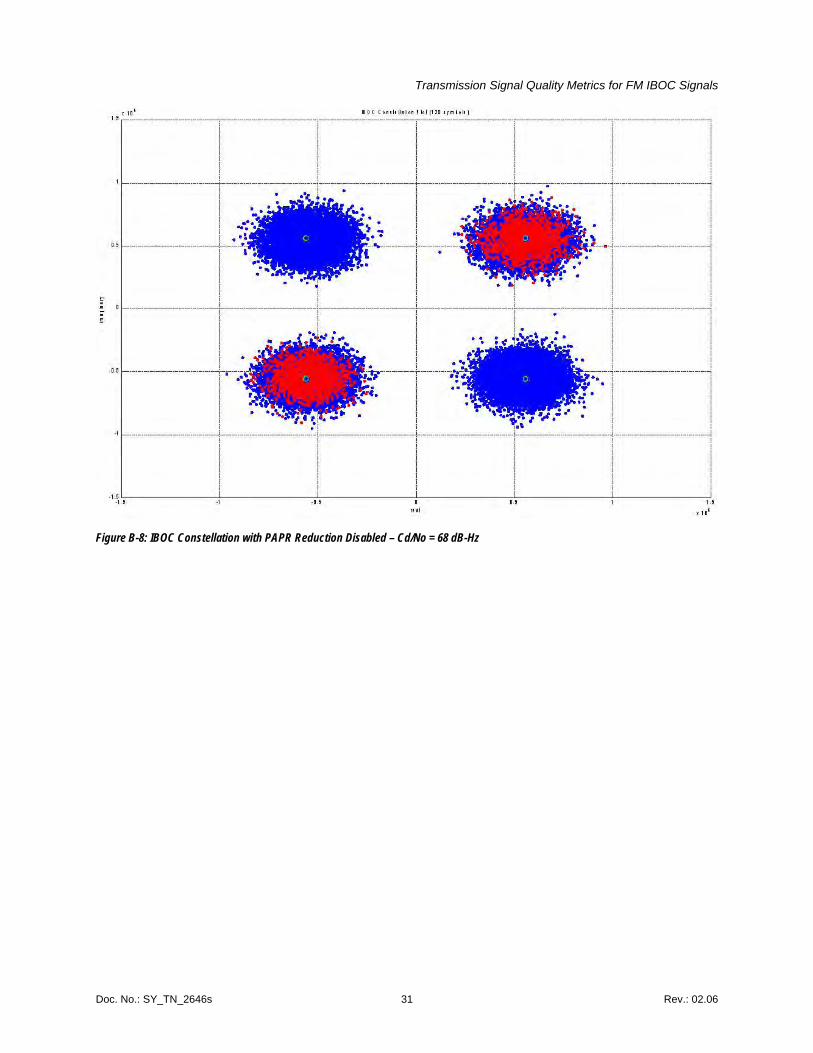
Transmission Signal Quality Metrics for FM IBOC Signals
Figure B-8: IBOC Constellation with PAPR Reduction Disabled – Cd/No = 68 dB-Hz
Doc. No.: SY_TN_2646s 31 Rev.: 02.06

Transmission Signal Quality Metrics for FM IBOC Signals
Figure B-9: IBOC Constellation with PAPR Reduction Disabled – Cd/No = 64 dB-Hz
Doc. No.: SY_TN_2646s 32 Rev.: 02.06

Transmission Signal Quality Metrics for FM IBOC Signals
Figure B-10: IBOC Constellation with PAPR Reduction Disabled – Cd/No = 56 dB-Hz
Doc. No.: SY_TN_2646s 33 Rev.: 02.06

Transmission Signal Quality Metrics for FM IBOC Signals
Figure B-11: IBOC Constellation with PAPR Reduction Disabled – Cd/No = 52 dB-Hz
Doc. No.: SY_TN_2646s 34 Rev.: 02.06
Transmission Signal Quality Metrics for FM IBOC Signals
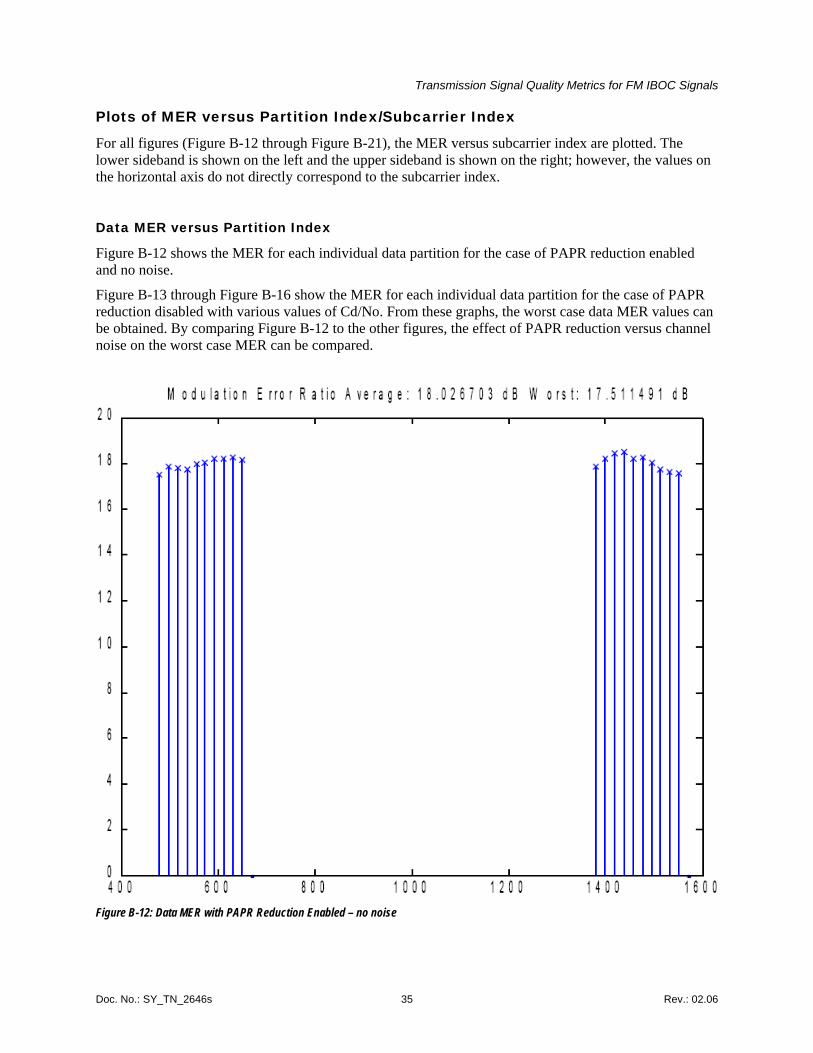
Plots of MER versus Partition Index/Subcarrier Index
For all figures (Figure B-12 through Figure B-21), the MER versus subcarrier index are plotted. The lower sideband is shown on the left and the upper sideband is shown on the right; however, the values on the horizontal axis do not directly correspond to the subcarrier index.
Data MER versus Partition Index
Figure B-12 shows the MER for each individual data partition for the case of PAPR reduction enabled and no noise.
Figure B-13 through Figure B-16 show the MER for each individual data partition for the case of PAPR reduction disabled with various values of Cd/No. From these graphs, the worst case data MER values can be obtained. By comparing Figure B-12 to the other figures, the effect of PAPR reduction versus channel noise on the worst case MER can be compared.
Figure B-12: Data MER with PAPR Reduction Enabled – no noise
Doc. No.: SY_TN_2646s 35 Rev.: 02.06

Transmission Signal Quality Metrics for FM IBOC Signals
Figure B-13: Data MER with PAPR Reduction Disabled – Cd/No = 68 dB-Hz
Doc. No.: SY_TN_2646s 36 Rev.: 02.06

Transmission Signal Quality Metrics for FM IBOC Signals
Figure B-14: Data MER with PAPR Reduction Disabled – Cd/No = 64 dB-Hz
Doc. No.: SY_TN_2646s 37 Rev.: 02.06

Transmission Signal Quality Metrics for FM IBOC Signals
Figure B-15: Data MER with PAPR Reduction Disabled – Cd/No = 56 dB-Hz
Doc. No.: SY_TN_2646s 38 Rev.: 02.06
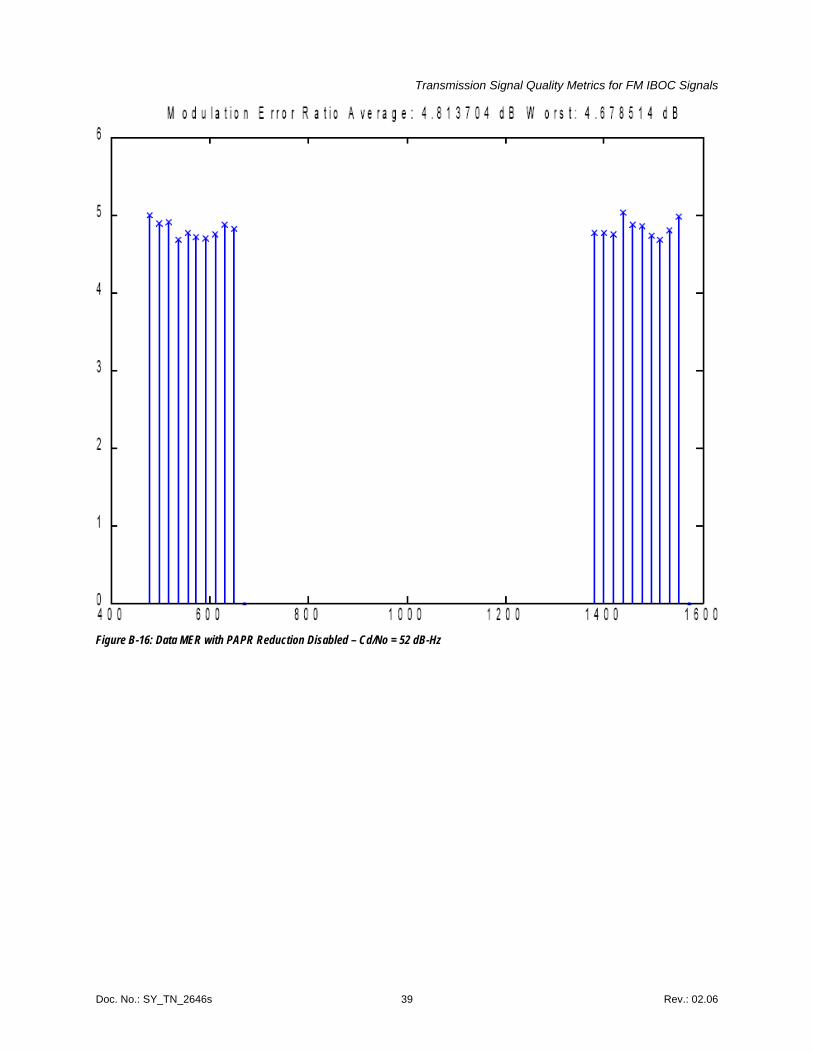
Transmission Signal Quality Metrics for FM IBOC Signals
Figure B-16: Data MER with PAPR Reduction Disabled – Cd/No = 52 dB-Hz
Doc. No.: SY_TN_2646s 39 Rev.: 02.06

Transmission Signal Quality Metrics for FM IBOC Signals
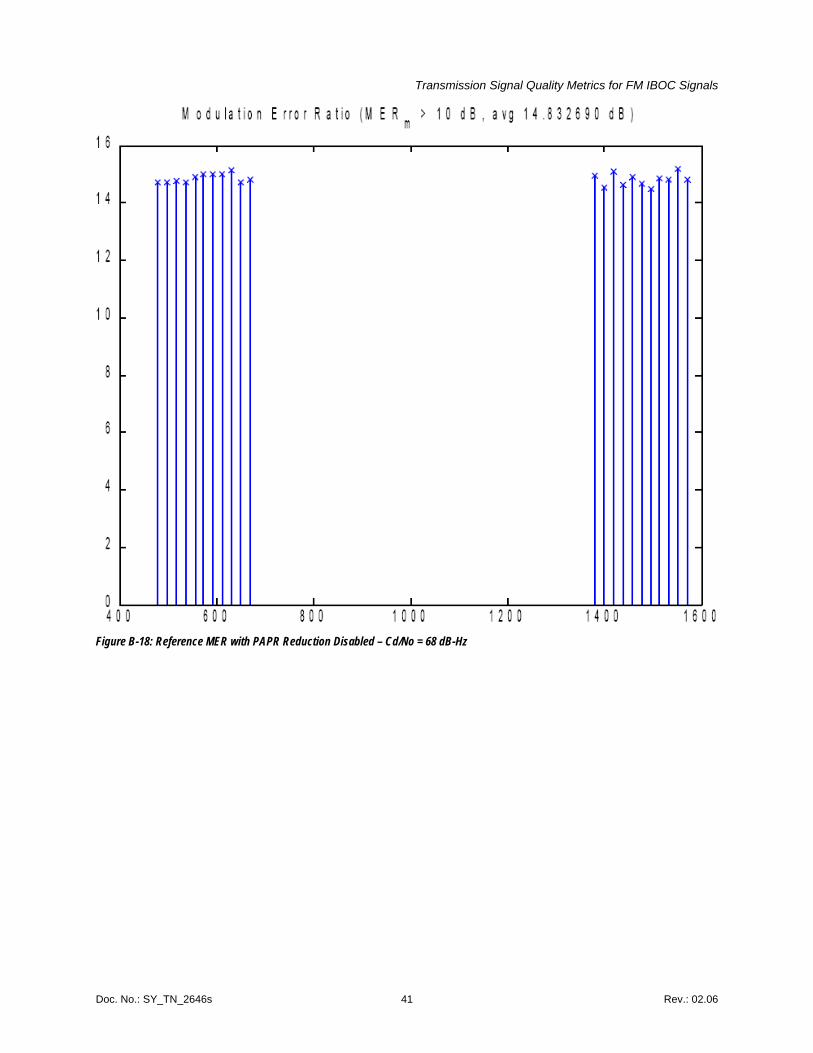
Reference MER versus Reference Subcarrier Index
Figure B-17 shows the MER for each individual reference subcarrier for the case of PAPR reduction enabled and no noise.
Figure B-18 through Figure B-21 show the MER for each individual reference subcarrier for the case of PAPR reduction disabled with various values of Cd/No. From these graphs, the worst case reference subcarrier MER values can be obtained. By comparing Figure B-17 to the other figures, the effect of PAPR reduction versus channel noise on the worst case MER can be compared.
Figure B-17: Reference MER with PAPR Reduction Enabled – no noise
Doc. No.: SY_TN_2646s 40 Rev.: 02.06
Transmission Signal Quality Metrics for FM IBOC Signals
Figure B-18: Reference MER with PAPR Reduction Disabled – Cd/No = 68 dB-Hz
Doc. No.: SY_TN_2646s 41 Rev.: 02.06

Transmission Signal Quality Metrics for FM IBOC Signals
Figure B-19: Reference MER with PAPR Reduction Disabled – Cd/No = 64 dB-Hz
Doc. No.: SY_TN_2646s 42 Rev.: 02.06

Transmission Signal Quality Metrics for FM IBOC Signals
Figure B-20: Reference MER with PAPR Reduction Disabled – Cd/No = 56 dB-Hz
Doc. No.: SY_TN_2646s 43 Rev.: 02.06

Transmission Signal Quality Metrics for FM IBOC Signals
Figure B-21: Reference MER with PAPR Reduction Disabled – Cd/No = 52 dB-Hz
Doc. No.: SY_TN_2646s 44 Rev.: 02.06