transitioning to green fertilizers in agriculture: outlook
TRANSCRIPT
November 16, 2020
Presented by:
Michael Reese
Director, Renewable Energy Program
University of Minnesota West Central Research and Outreach Center
ARPA-E MACROALGAE VALORIZATION WORKSHOP
Transitioning to Green Fertilizers in Agriculture:
Outlook and Opportunities
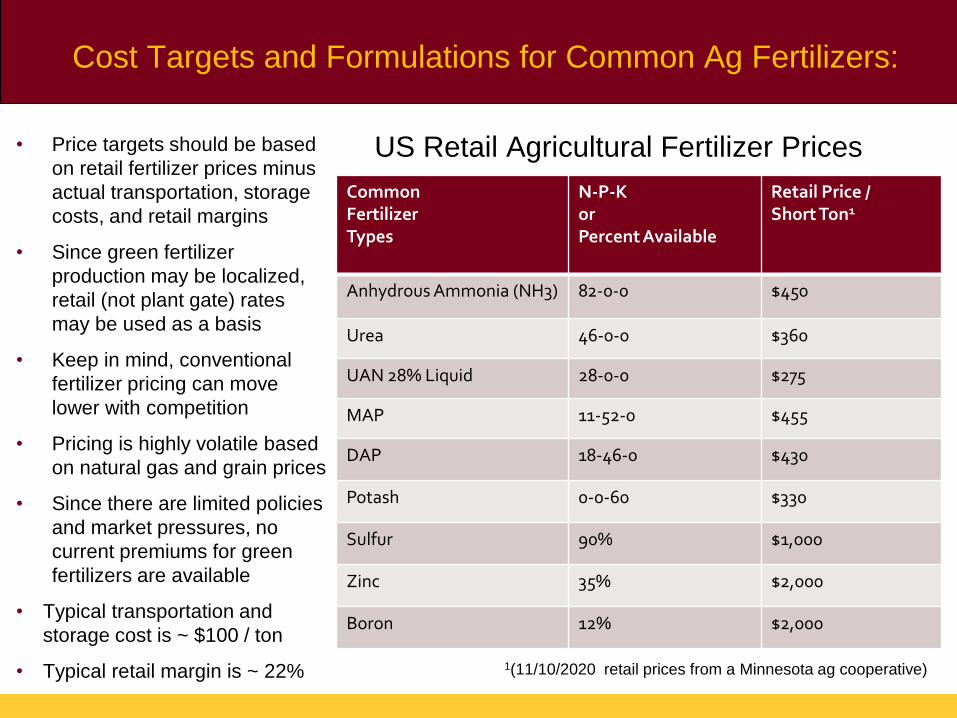
Cost Targets and Formulations for Common Ag Fertilizers:
CommonFertilizerTypes
N-P-K orPercent Available
Retail Price / Short Ton1
Anhydrous Ammonia (NH3) 82-0-0 $450
Urea 46-0-0 $360
UAN 28% Liquid 28-0-0 $275
MAP 11-52-0 $455
DAP 18-46-0 $430
Potash 0-0-60 $330
Sulfur 90% $1,000
Zinc 35% $2,000
Boron 12% $2,000
• Price targets should be based
on retail fertilizer prices minus
actual transportation, storage
costs, and retail margins
• Since green fertilizer
production may be localized,
retail (not plant gate) rates
may be used as a basis
• Keep in mind, conventional
fertilizer pricing can move
lower with competition
• Pricing is highly volatile based
on natural gas and grain prices
• Since there are limited policies
and market pressures, no
current premiums for green
fertilizers are available
• Typical transportation and
storage cost is ~ $100 / ton
• Typical retail margin is ~ 22%
US Retail Agricultural Fertilizer Prices
1(11/10/2020 retail prices from a Minnesota ag cooperative)
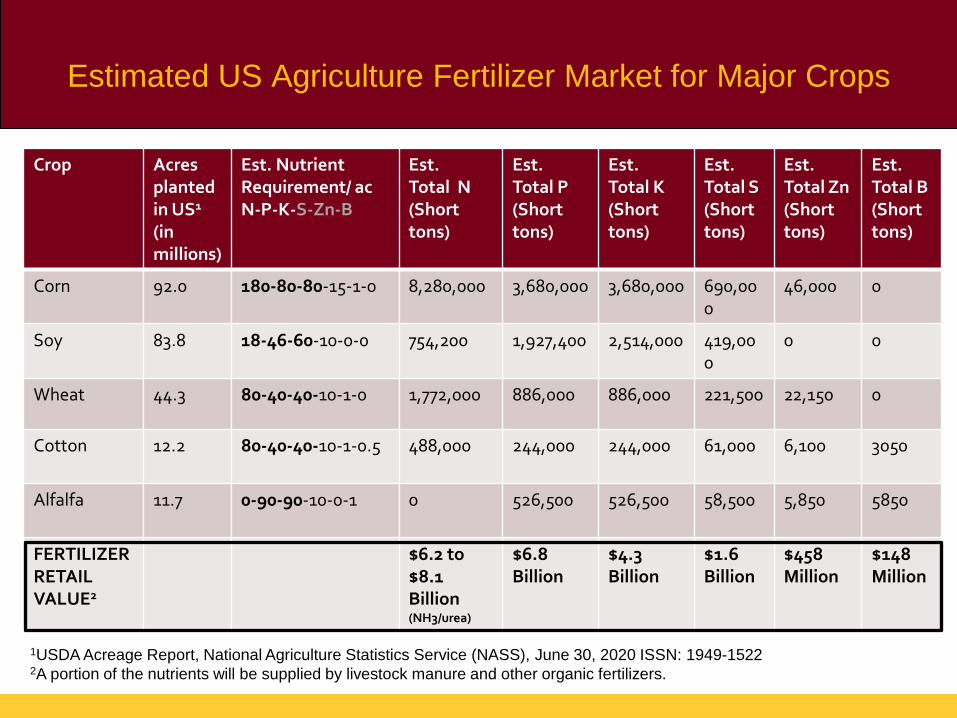
Estimated US Agriculture Fertilizer Market for Major Crops
Crop Acres planted in US1
(in millions)
Est. NutrientRequirement/ acN-P-K-S-Zn-B
Est.Total N(Short tons)
Est.Total P(Short tons)
Est.Total K(Short tons)
Est.Total S(Short tons)
Est.Total Zn(Short tons)
Est.Total B(Short tons)
Corn 92.0 180-80-80-15-1-0 8,280,000 3,680,000 3,680,000 690,000
46,000 0
Soy 83.8 18-46-60-10-0-0 754,200 1,927,400 2,514,000 419,000
0 0
Wheat 44.3 80-40-40-10-1-0 1,772,000 886,000 886,000 221,500 22,150 0
Cotton 12.2 80-40-40-10-1-0.5 488,000 244,000 244,000 61,000 6,100 3050
Alfalfa 11.7 0-90-90-10-0-1 0 526,500 526,500 58,500 5,850 5850
FERTILIZER RETAILVALUE2
$6.2 to$8.1 Billion(NH3/urea)
$6.8 Billion
$4.3 Billion
$1.6Billion
$458Million
$148 Million
1USDA Acreage Report, National Agriculture Statistics Service (NASS), June 30, 2020 ISSN: 1949-15222A portion of the nutrients will be supplied by livestock manure and other organic fertilizers.
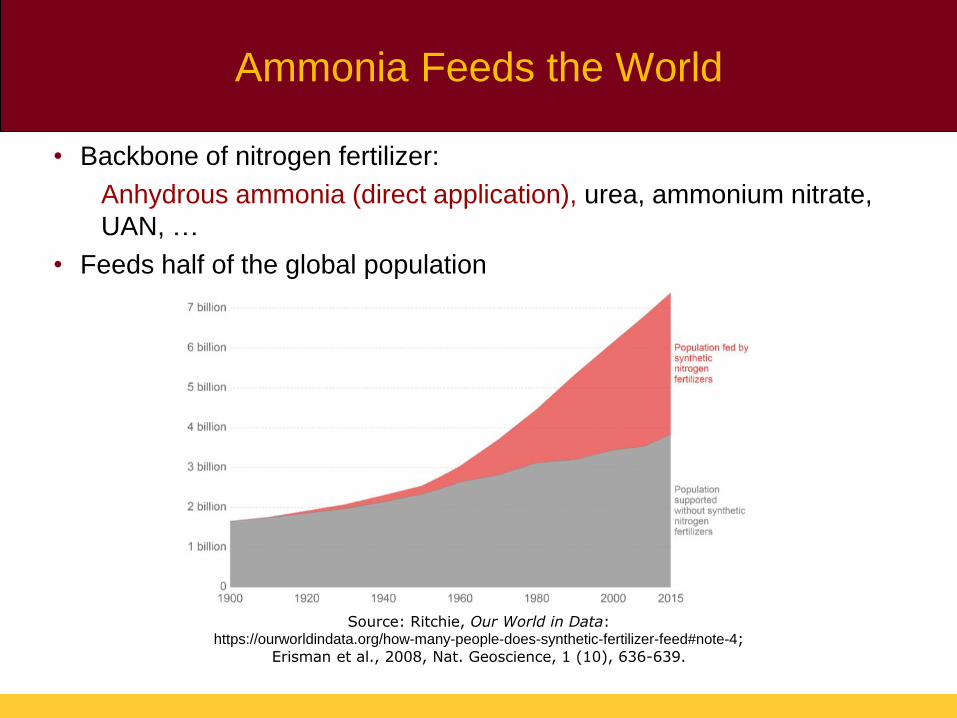
Ammonia Feeds the World
• Backbone of nitrogen fertilizer:
Anhydrous ammonia (direct application), urea, ammonium nitrate,
UAN, …
• Feeds half of the global population
Source: Ritchie, Our World in Data: https://ourworldindata.org/how-many-people-does-synthetic-fertilizer-feed#note-4;
Erisman et al., 2008, Nat. Geoscience, 1 (10), 636-639.
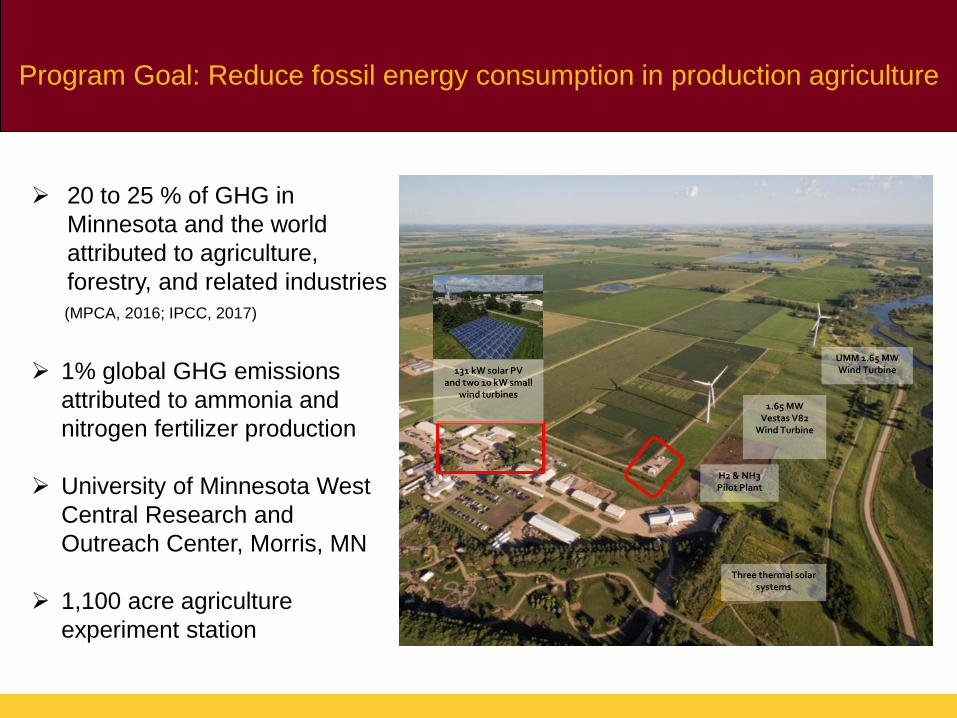
Program Goal: Reduce fossil energy consumption in production agriculture
H2 & NH3 Pilot Plant
1.65 MW Vestas V82
Wind Turbine
131 kW solar PVand two 10 kW small
wind turbines
Three thermal solar systems
UMM 1.65 MW Wind Turbine
➢ 20 to 25 % of GHG in
Minnesota and the world
attributed to agriculture,
forestry, and related industries
(MPCA, 2016; IPCC, 2017)
➢ 1% global GHG emissions
attributed to ammonia and
nitrogen fertilizer production
➢ University of Minnesota West
Central Research and
Outreach Center, Morris, MN
➢ 1,100 acre agriculture
experiment station
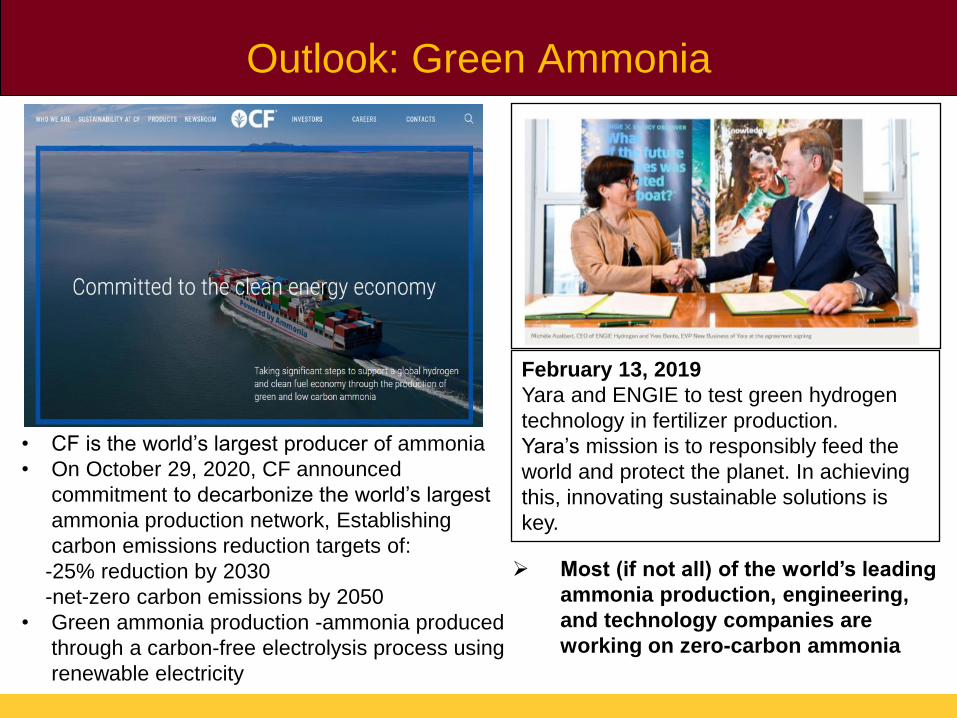
February 13, 2019
Yara and ENGIE to test green hydrogen
technology in fertilizer production.
Yara’s mission is to responsibly feed the
world and protect the planet. In achieving
this, innovating sustainable solutions is
key.
Outlook: Green Ammonia
• CF is the world’s largest producer of ammonia
• On October 29, 2020, CF announced
commitment to decarbonize the world’s largest
ammonia production network, Establishing
carbon emissions reduction targets of:
-25% reduction by 2030
-net-zero carbon emissions by 2050
• Green ammonia production -ammonia produced
through a carbon-free electrolysis process using
renewable electricity
➢ Most (if not all) of the world’s leading
ammonia production, engineering,
and technology companies are
working on zero-carbon ammonia
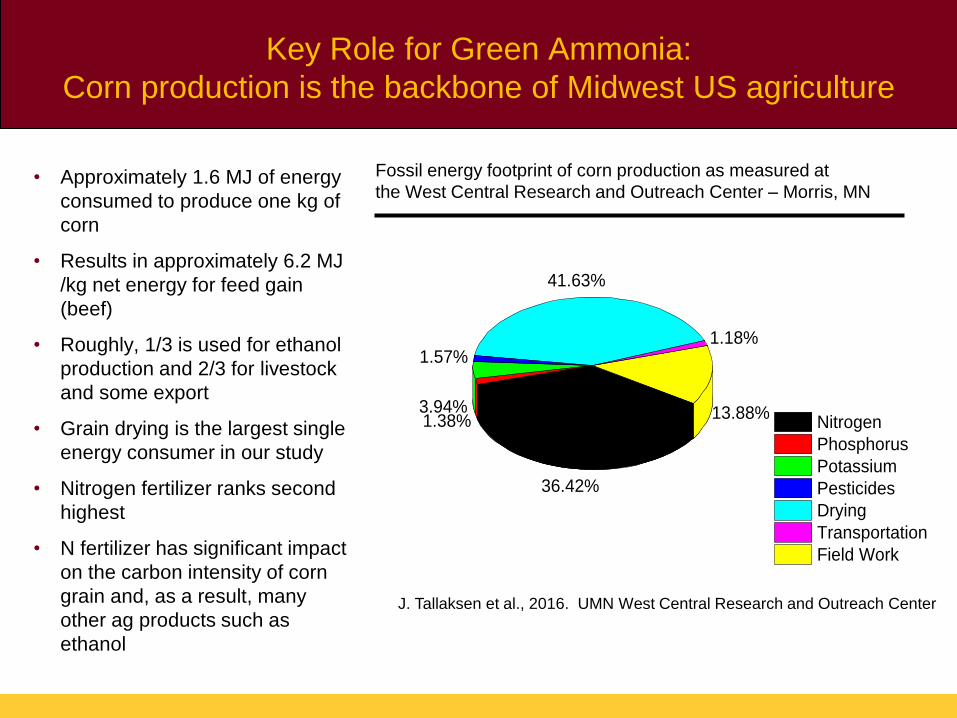
• Approximately 1.6 MJ of energy
consumed to produce one kg of
corn
• Results in approximately 6.2 MJ
/kg net energy for feed gain
(beef)
• Roughly, 1/3 is used for ethanol
production and 2/3 for livestock
and some export
• Grain drying is the largest single
energy consumer in our study
• Nitrogen fertilizer ranks second
highest
• N fertilizer has significant impact
on the carbon intensity of corn
grain and, as a result, many
other ag products such as
ethanol
Key Role for Green Ammonia:
Corn production is the backbone of Midwest US agriculture
13.88%
1.18%
41.63%
1.57%
3.94%1.38%
36.42%
Nitrogen
Phosphorus
Potassium
Pesticides
Drying
Transportation
Field Work
Fossil energy footprint of corn production as measured at
the West Central Research and Outreach Center – Morris, MN
J. Tallaksen et al., 2016. UMN West Central Research and Outreach Center
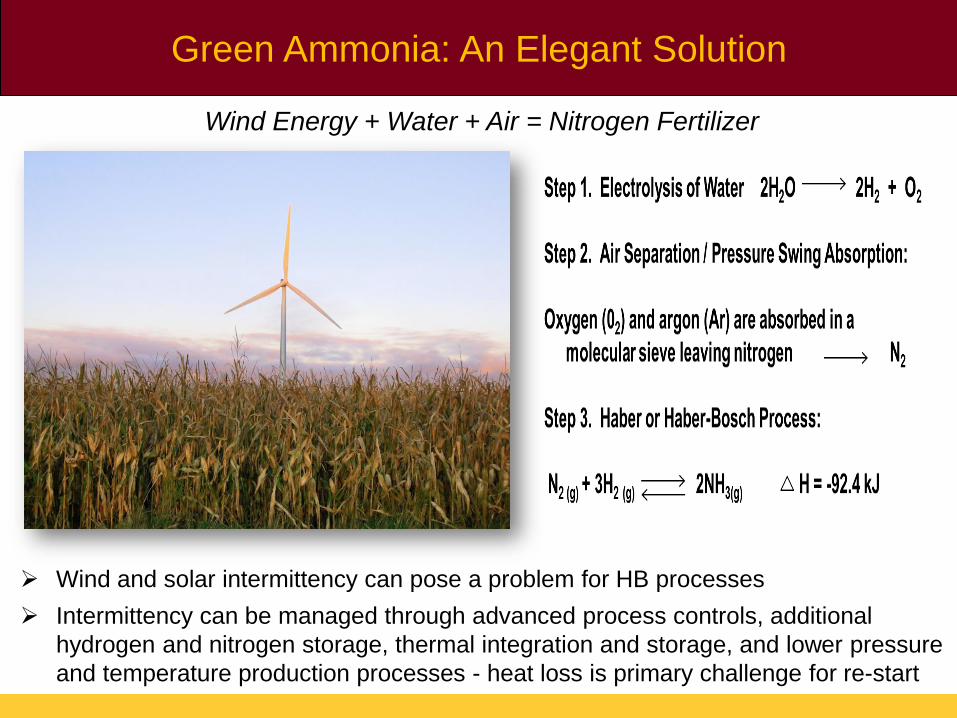
Wind Energy + Water + Air = Nitrogen Fertilizer
Green Ammonia: An Elegant Solution
➢ Wind and solar intermittency can pose a problem for HB processes
➢ Intermittency can be managed through advanced process controls, additional
hydrogen and nitrogen storage, thermal integration and storage, and lower pressure
and temperature production processes - heat loss is primary challenge for re-start
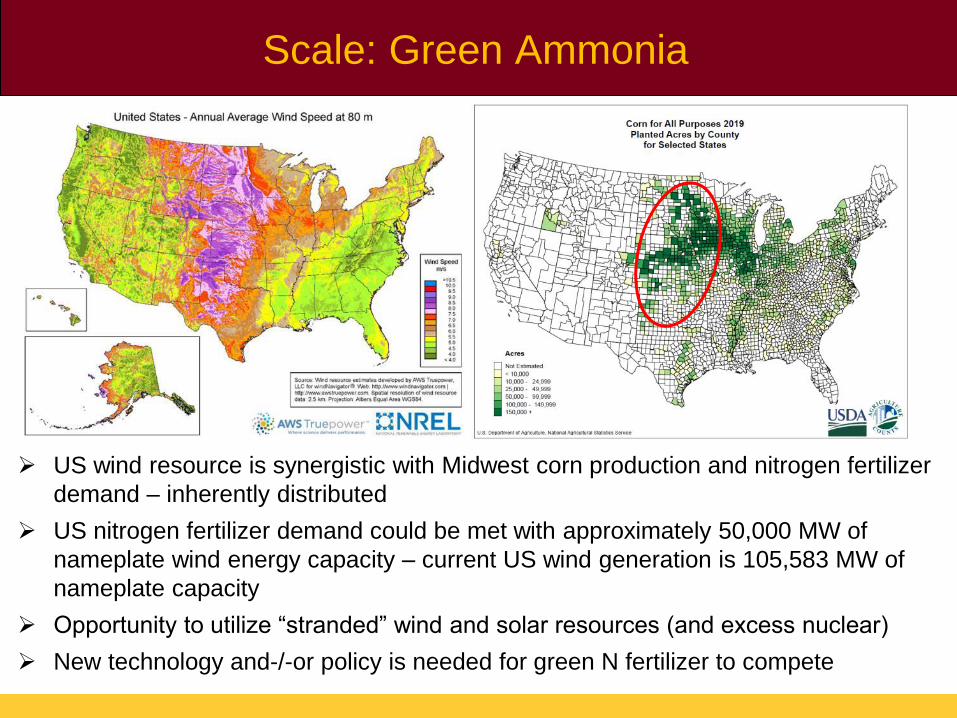
➢ US wind resource is synergistic with Midwest corn production and nitrogen fertilizer
demand – inherently distributed
➢ US nitrogen fertilizer demand could be met with approximately 50,000 MW of
nameplate wind energy capacity – current US wind generation is 105,583 MW of
nameplate capacity
➢ Opportunity to utilize “stranded” wind and solar resources (and excess nuclear)
➢ New technology and-/-or policy is needed for green N fertilizer to compete
Scale: Green Ammonia
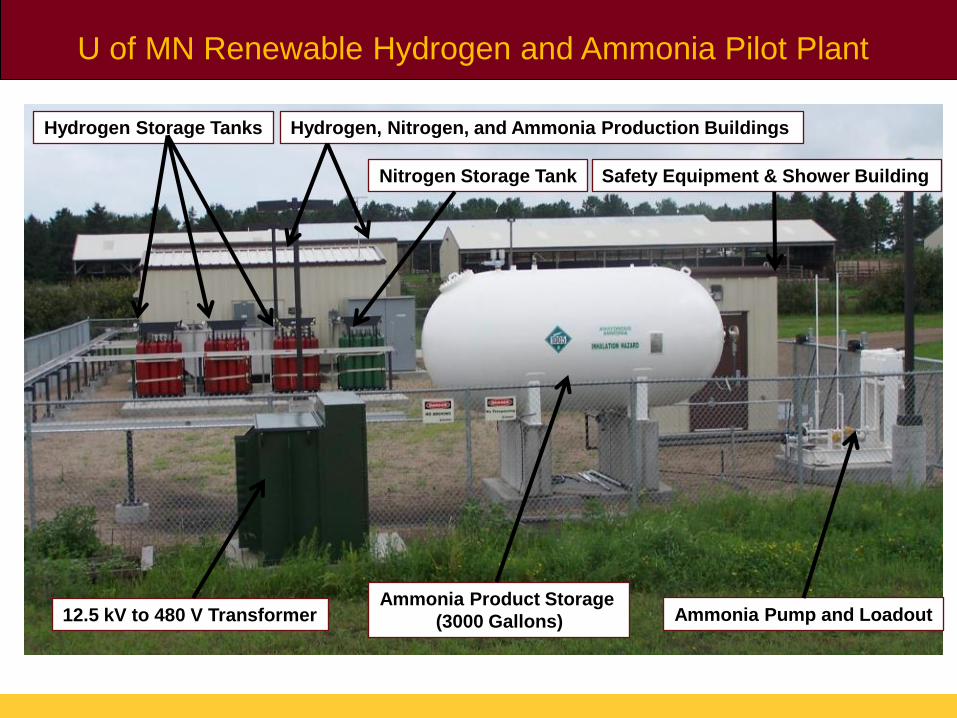
U of MN Renewable Hydrogen and Ammonia Pilot Plant
Hydrogen Storage Tanks
Nitrogen Storage Tank
Hydrogen, Nitrogen, and Ammonia Production Buildings
12.5 kV to 480 V TransformerAmmonia Product Storage
(3000 Gallons)
Safety Equipment & Shower Building
Ammonia Pump and Loadout
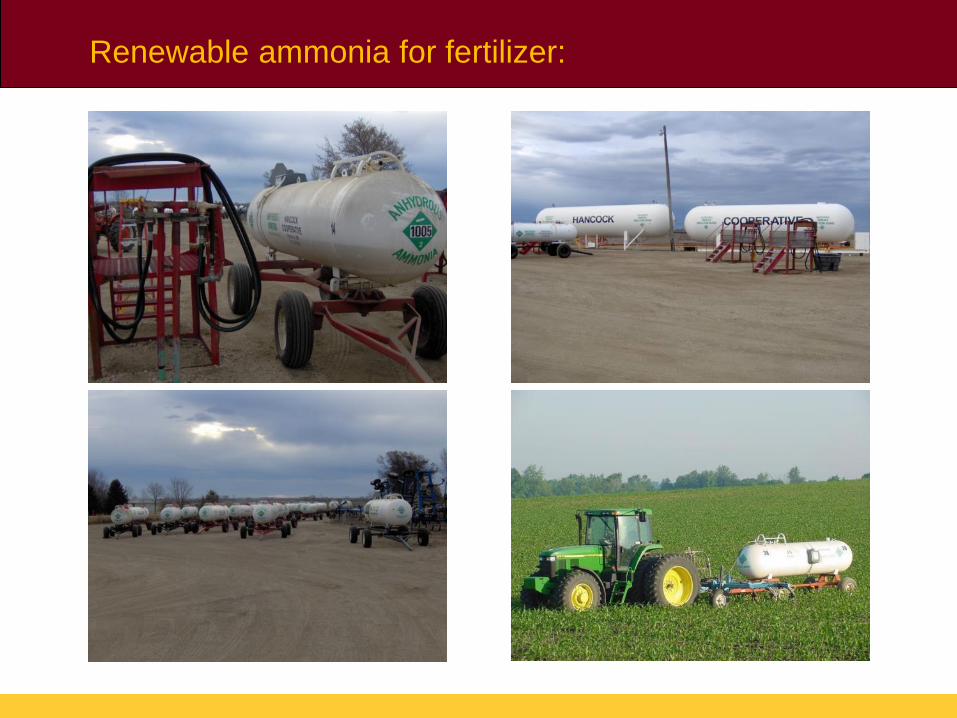
Renewable ammonia for fertilizer:
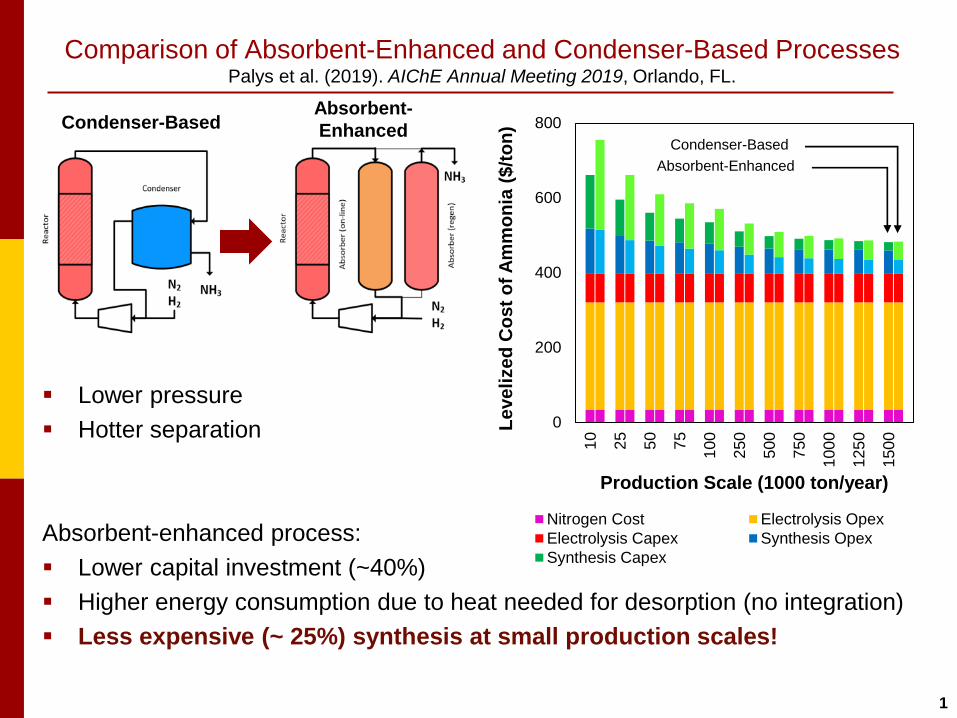
Comparison of Absorbent-Enhanced and Condenser-Based Processes Palys et al. (2019). AIChE Annual Meeting 2019, Orlando, FL.
1
▪ Lower pressure
▪ Hotter separation
Absorbent-enhanced process:
▪ Lower capital investment (~40%)
▪ Higher energy consumption due to heat needed for desorption (no integration)
▪ Less expensive (~ 25%) synthesis at small production scales!
Absorbent-
EnhancedCondenser-Based
0
200
400
600
800
10
25
50
75
100
250
500
750
100
0
125
0
150
0
Le
ve
lize
d C
os
t o
f A
mm
on
ia (
$/t
on
)
Production Scale (1000 ton/year)
Nitrogen Cost Electrolysis Opex
Electrolysis Capex Synthesis Opex
Synthesis Capex
Absorbent-Enhanced
Condenser-Based
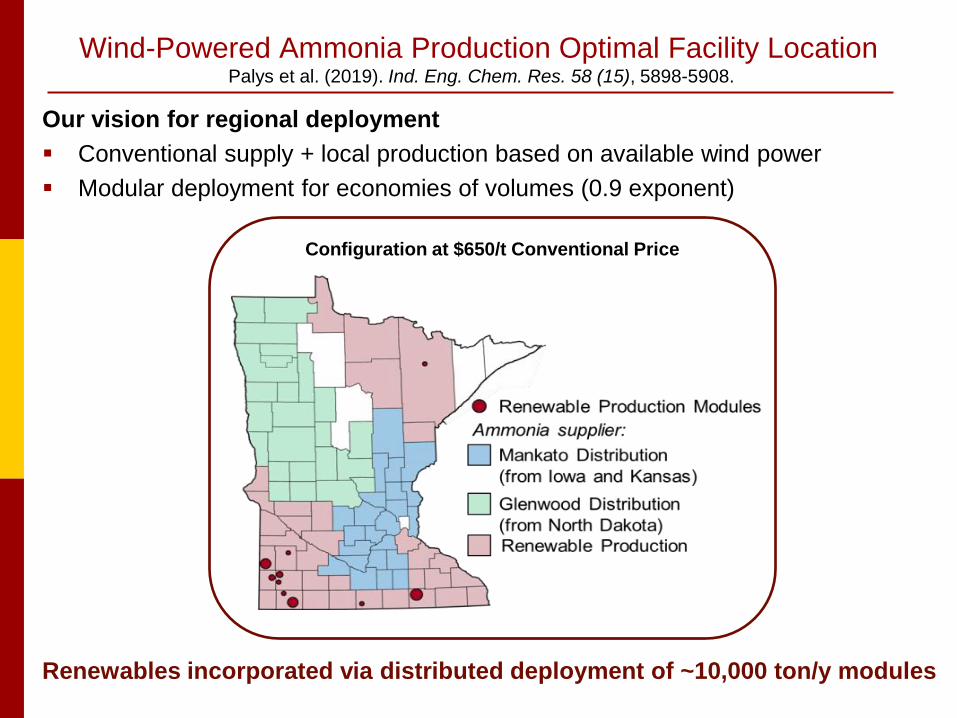
Wind-Powered Ammonia Production Optimal Facility LocationPalys et al. (2019). Ind. Eng. Chem. Res. 58 (15), 5898-5908.
Our vision for regional deployment
▪ Conventional supply + local production based on available wind power
▪ Modular deployment for economies of volumes (0.9 exponent)
Renewables incorporated via distributed deployment of ~10,000 ton/y modules
Configuration at $650/t Conventional Price
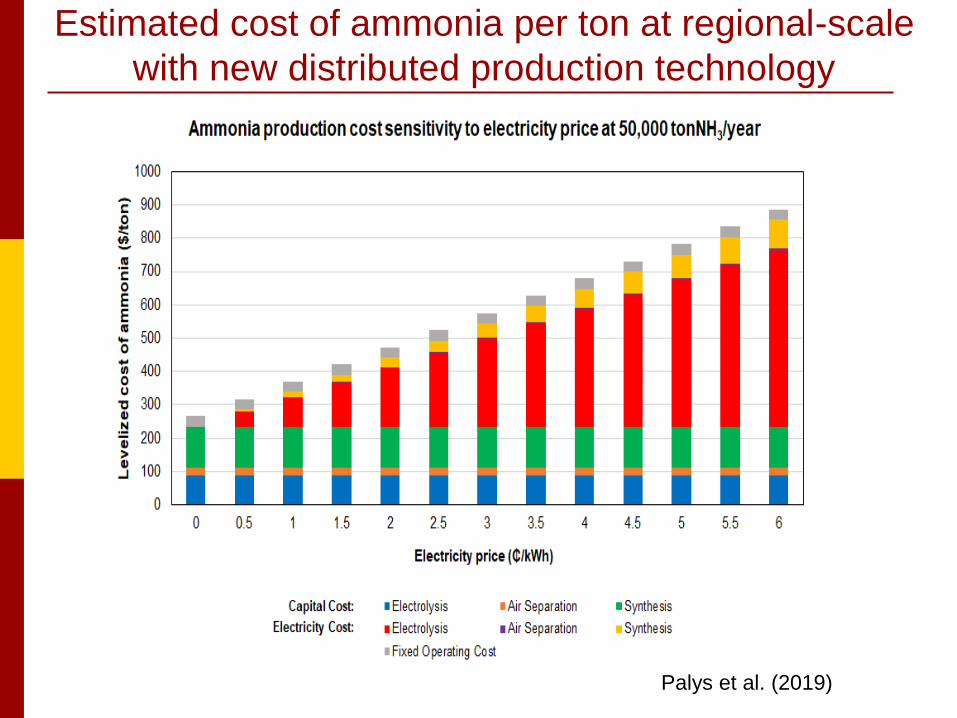
Estimated cost of ammonia per ton at regional-scale
with new distributed production technology
Palys et al. (2019)
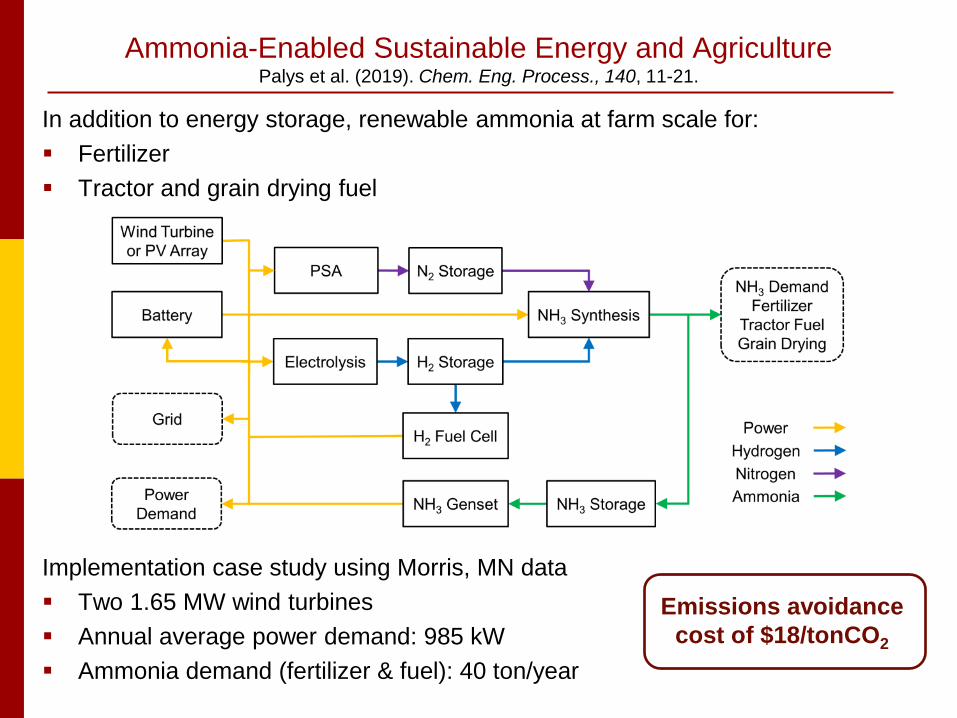
Ammonia-Enabled Sustainable Energy and AgriculturePalys et al. (2019). Chem. Eng. Process., 140, 11-21.
In addition to energy storage, renewable ammonia at farm scale for:
▪ Fertilizer
▪ Tractor and grain drying fuel
Implementation case study using Morris, MN data
▪ Two 1.65 MW wind turbines
▪ Annual average power demand: 985 kW
▪ Ammonia demand (fertilizer & fuel): 40 ton/year
Emissions avoidance
cost of $18/tonCO2
Opportunity: Other Green Fertilizers
➢ Manure – increased emphasis on livestock production – perhaps further
processed to recover nutrients or provide more available, less harmful
formulations (e.g. N2Applied)
➢ Ammonia nitrate and aqueous ammonia production via non-thermal
plasma (e.g. FarmGenN)
➢ Nutrient capture from agricultural and other forms of run-off and wastes
➢ Biochars and other nutrients from gasification and pyrolysis processes
➢ Seaweed and algae production and harvest
➢ Phosphorus recovery (peak phosphorus?)
▪ As a note, there is a finite supply of rock phosphorus in the world and
there may be opportunities to develop phosphorus production / recovery
systems.
➢ Micro-nutrients such as sulfur, zinc, and boron have high values but much
lower quantities are applied to crops
Acknowledgements
Funding provided by:
❖ MnDRIVE
❖ Minnesota Agricultural Experiment Station Rapid
Ag Response Fund
❖ Minnesota Environment and Natural Resources
Trust Fund as recommended by the Legislative
Citizen Commission on Minnesota Resources
❖ State of Minnesota
❖ United States Department of Energy ARPA-E
REFUEL Program
❖ University of Minnesota College of Food,
Agricultural, and Natural Resource Sciences
(CFANS)
❖ Clean Energy Resource Teams (CERTS)
❖ Electric Power Research Institute (EPRI)
Conclusions:
✓ The US has significant market demand for agricultural fertilizers
✓ Conventional nitrogen fertilizer production represents approximately 1% of
all global greenhouse gas emissions
✓ The carbon-intensity of grain, meat, milk, ethanol, and other agricultural
products is highly influenced by the conventional production of nitrogen
fertilizer
✓ In the absence of GHG reduction policies or market pressures, price
targets for green or zero- or low-carbon fertilizers need to be on par with
conventional fertilizer prices
✓ The distributed nature of renewable electricity generation favors the
distributed production of green nitrogen fertilizer over centralized plants
✓ US nitrogen fertilizer market could be supplied 100% by adding ~50,000
MW of wind capacity
✓ Coupled with the declining costs of wind and solar generation, green
ammonia production technologies are becoming cost competitive
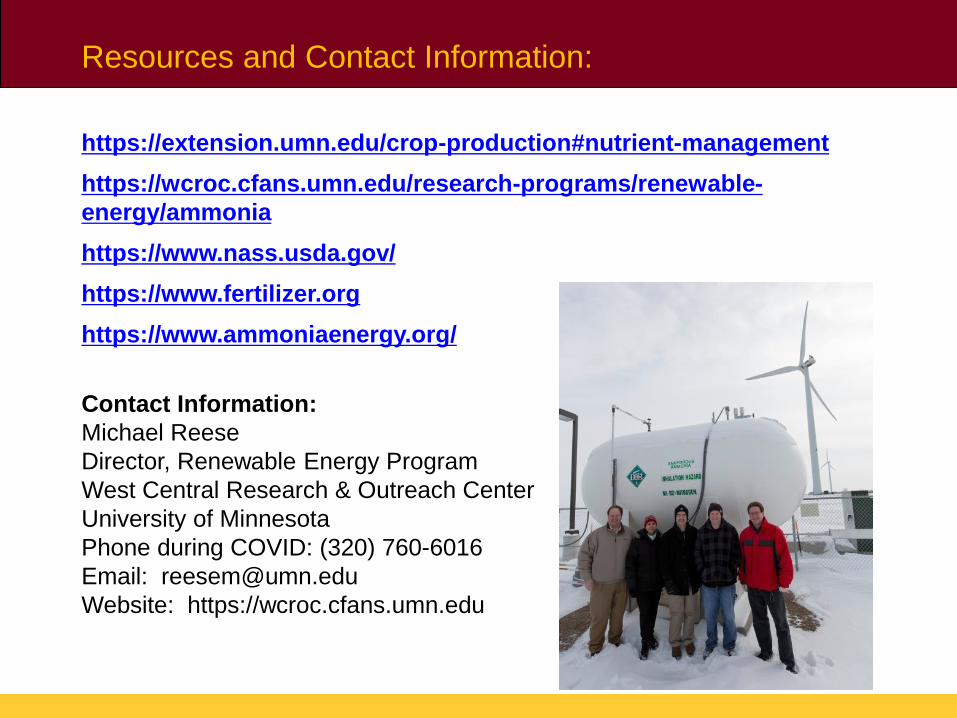
Resources and Contact Information:
https://extension.umn.edu/crop-production#nutrient-management
https://wcroc.cfans.umn.edu/research-programs/renewable-
energy/ammonia
https://www.nass.usda.gov/
https://www.fertilizer.org
https://www.ammoniaenergy.org/
Contact Information:
Michael Reese
Director, Renewable Energy Program
West Central Research & Outreach Center
University of Minnesota
Phone during COVID: (320) 760-6016
Email: [email protected]
Website: https://wcroc.cfans.umn.edu