transitioning from an entrepreneurship to a professionally ... · objectives what do the data say...
TRANSCRIPT
Transitioning from an Entrepreneurship to a Professionally Managed Firm
Objectives
What do the Data say about Growth Expectations
Overview of the Concept of Growing Pains
Evaluation of Your Business’ Growing Pains
What Can we Do About them?

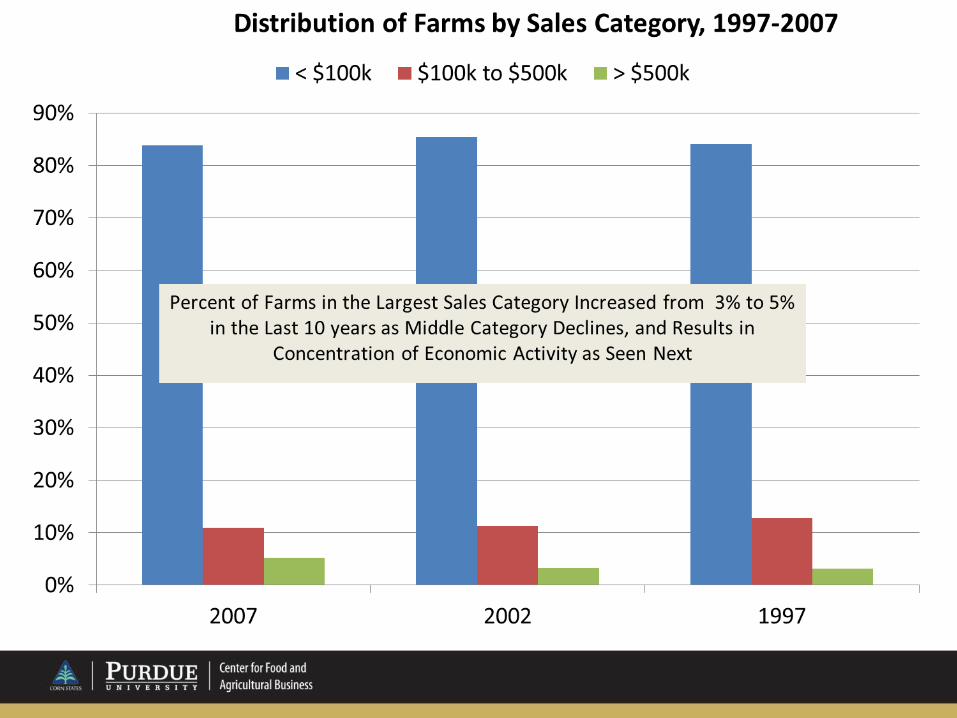
A Historical Perspective on Growth


What do our data show about growth expectations going forward?
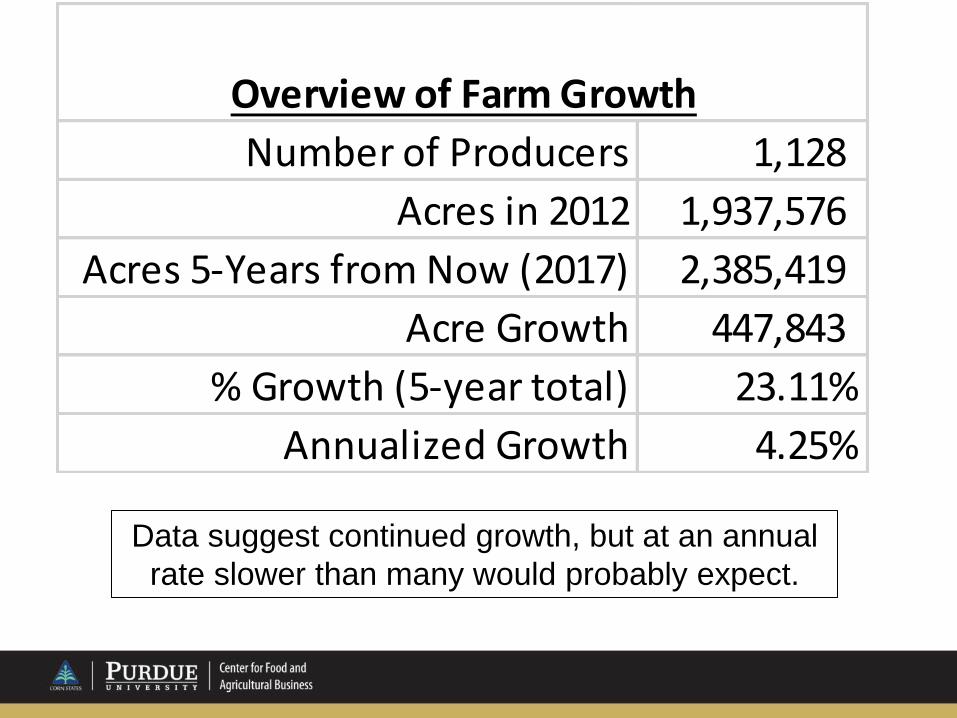
Number of Producers 1,128
Acres in 2012 1,937,576
Acres 5-Years from Now (2017) 2,385,419
Acre Growth 447,843
% Growth (5-year total) 23.11%
Annualized Growth 4.25%
Overview of Farm Growth
Data suggest continued growth, but at an annual
rate slower than many would probably expect.

Number of Producers 511
Acres in 2012 701,581
Acres 5-Years from Now (2017) 701,581
Acre Growth -
% Growth (5-year total) 0.00%
Annualized Growth 0.00%
Overview of Farms with No Acre Growth
About half of the sample indicated that they expected no
growth!

Number of Producers 535
Acres in 2012 1,068,772
Acres 5-Years from Now (2017) 1,565,024
Acre Growth 496,252
% Growth (5-year total) 46.43%
Annualized Growth 7.93%
Overview of Farms with Positive Acre
Growth
When you remove farms that aren’t growing, a much
more robust growth story emerges.

Number of Producers 82
Acres in 2012 167,223
Acres 5-Years from Now (2017) 118,814
Acre Growth (48,409)
% Growth (5-year total) -28.95%
Annualized Growth -6.61%
Overview of Farms with Negative Acre
Growth
Some also have equally strong negative growth expectations,
making the stakes high for retailers investing in customer
relationships!

A look at concentration
# of
Producers
% of Total
Producers Avg. Acres
Total Acres
(Group)
% of Total
Acres
# of
Producers
% of Total
Producers Avg. Acres
Total Acres
(Group)
% of Total
Acres
<1000 476 42.2% 539 256,395 13.2% 425 37.7% 540 229,405 9.6%
1000-1,999 338 30.0% 1,370 462,989 23.9% 314 27.8% 1,390 436,585 18.3%
2000-2,999 144 12.8% 2,371 341,489 17.6% 157 13.9% 2,391 375,371 15.7%
3000-3,999 70 6.2% 3,252 227,674 11.8% 85 7.5% 3,295 280,061 11.7%
4000-4,999 38 3.4% 4,258 161,819 8.4% 51 4.5% 4,259 217,189 9.1%
>5000 62 5.5% 7,858 487,210 25.1% 96 8.5% 8,821 846,808 35.5%
Gro
up
s o
f P
rod
uce
rs
2012 5-Years from Now (2017)
Today Tomorrow
This suggests that in only 5 years, the proportion of total acres farmed by
those with over 5,000 acres to increase from 25% to 36%. Virtually all the
share would be lost by farms under 3,000 acres!

What are Growing Pains?
Growing pains are problems that occur as a result of inadequate organizational development in relation to business size and complexity

Ten Most Common Organizational Growing Pains
There aren’t enough hours in the day
Too much time “putting out fires”
Don’t know what others are doing
Don’t know where the firm is headed
Not enough good managers
“I have to do it if it is to be done right”
Meetings are a waste of time
Very little follow up on plans so things don’t get done
Some feel insecure about their place
Sales are growing but profits aren’t keeping pace
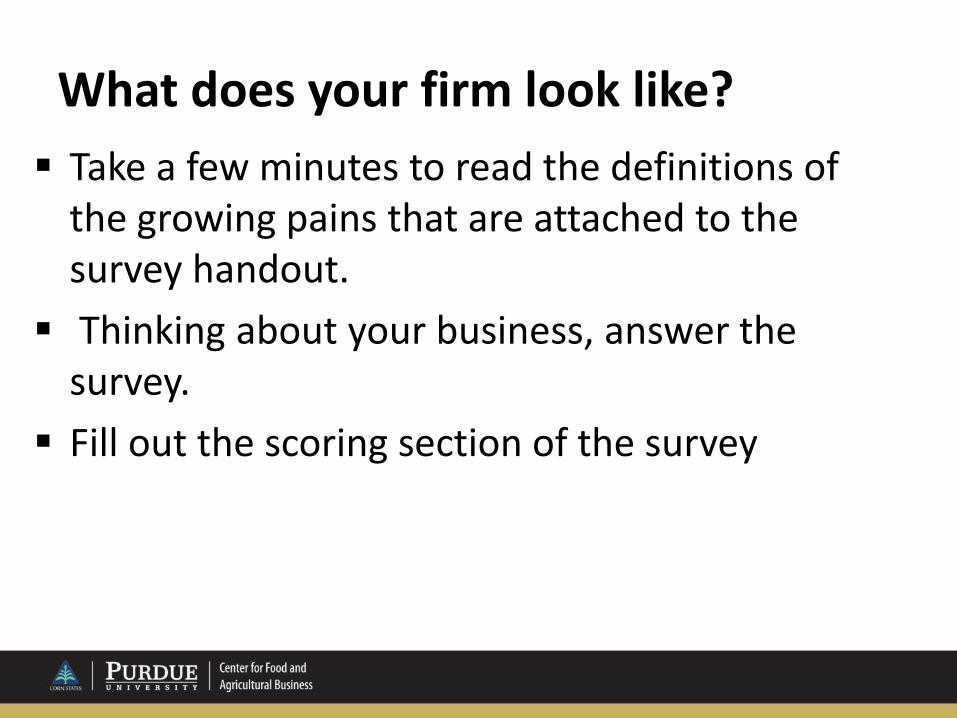
What does your firm look like?
Take a few minutes to read the definitions of the growing pains that are attached to the survey handout.
Thinking about your business, answer the survey.
Fill out the scoring section of the survey
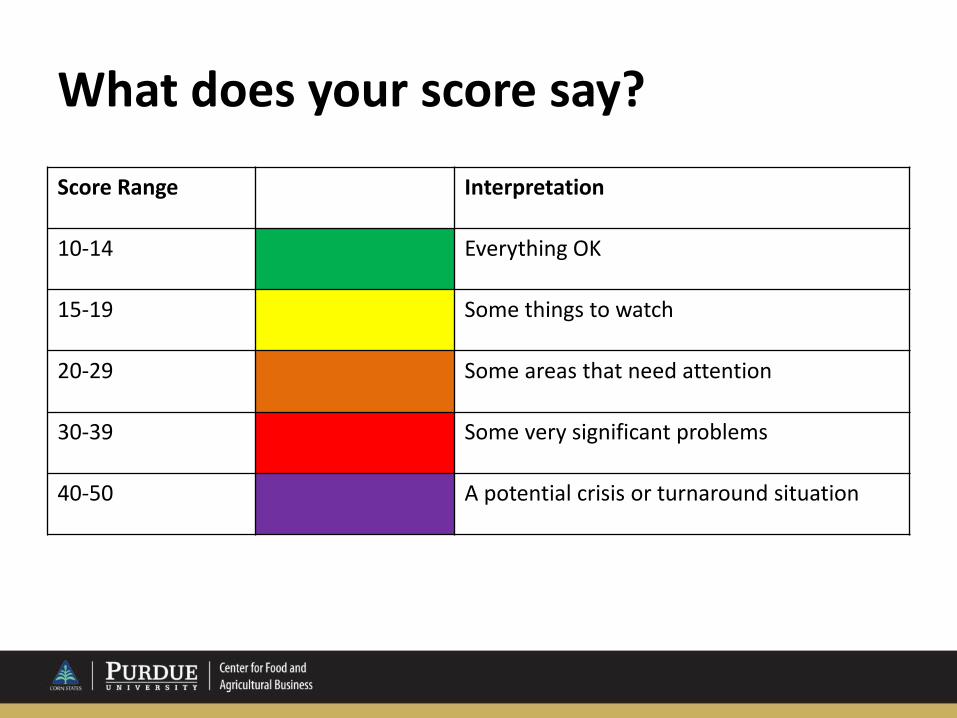
What does your score say?
Score Range Interpretation
10-14 Everything OK
15-19 Some things to watch
20-29 Some areas that need attention
30-39 Some very significant problems
40-50 A potential crisis or turnaround situation
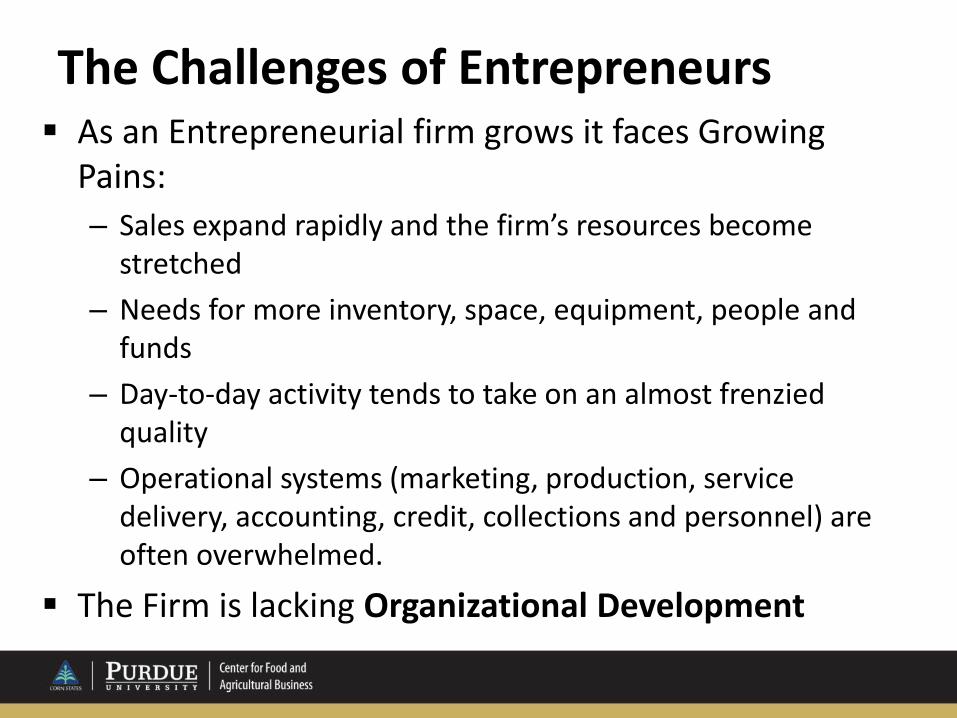
The Challenges of Entrepreneurs As an Entrepreneurial firm grows it faces Growing
Pains:
– Sales expand rapidly and the firm’s resources become stretched
– Needs for more inventory, space, equipment, people and funds
– Day-to-day activity tends to take on an almost frenzied quality
– Operational systems (marketing, production, service delivery, accounting, credit, collections and personnel) are often overwhelmed.
The Firm is lacking Organizational Development
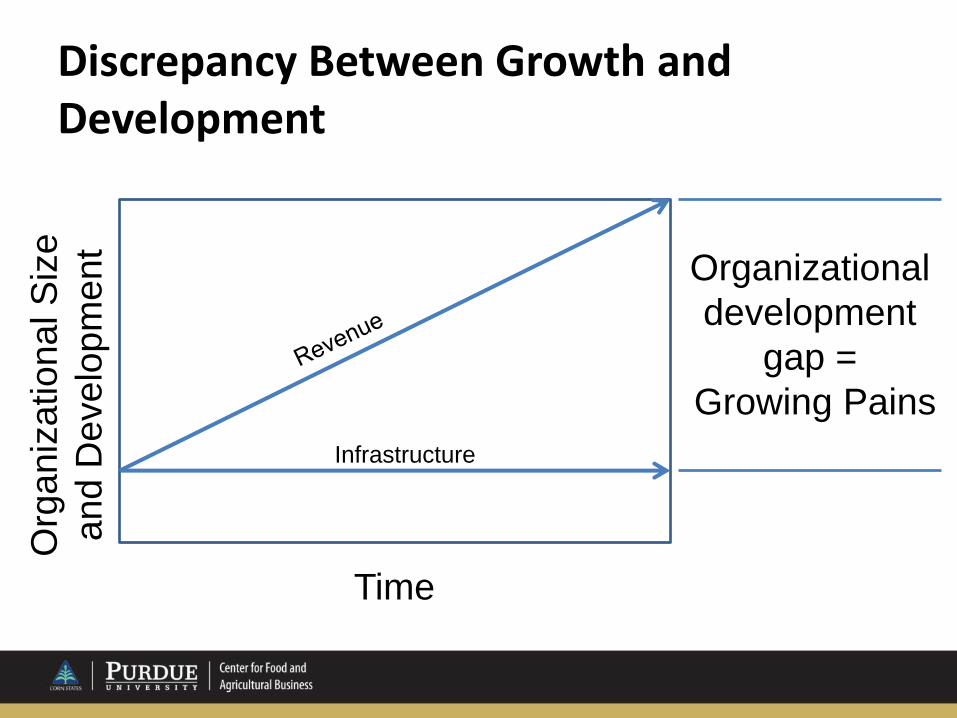
Discrepancy Between Growth and Development
Org
aniz
atio
na
l S
ize
an
d D
eve
lop
me
nt
Time
Organizational
development
gap =
Growing Pains
Infrastructure
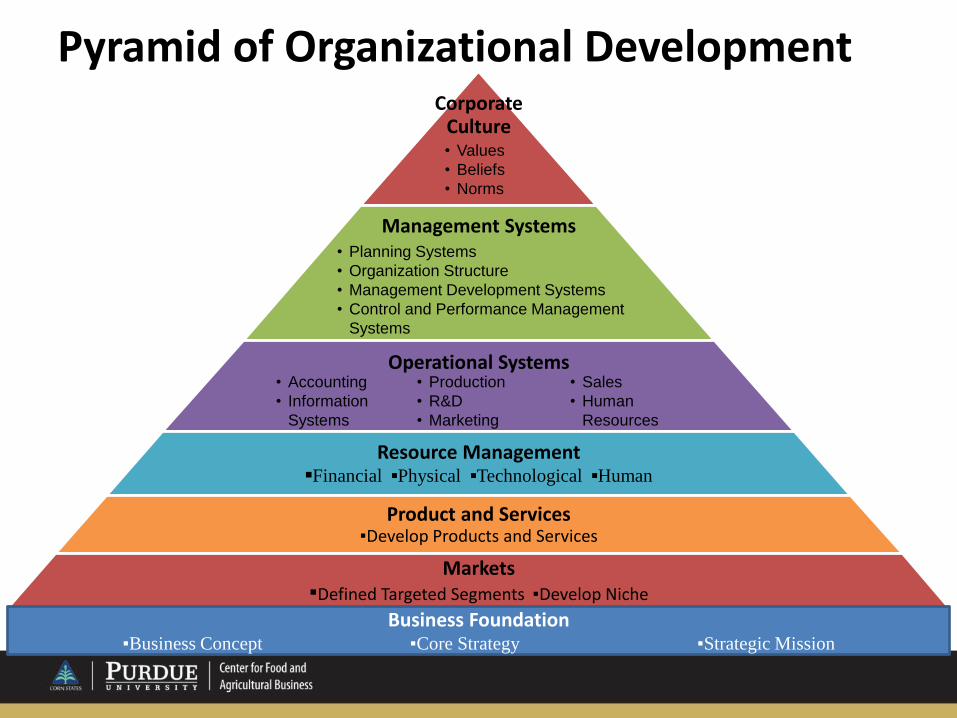
Pyramid of Organizational Development Corporate
Culture
Management Systems
Operational Systems
Resource Management ▪Financial ▪Physical ▪Technological ▪Human
Product and Services ▪Develop Products and Services
Markets ▪Defined Targeted Segments ▪Develop Niche
Business Foundation ▪Business Concept ▪Core Strategy ▪Strategic Mission
• Accounting
• Information
Systems
• Production
• R&D
• Marketing
• Sales
• Human
Resources
• Planning Systems
• Organization Structure
• Management Development Systems
• Control and Performance Management
Systems
• Values
• Beliefs
• Norms

Stages of Organizational Growth and the key developmental Tasks
Stages of Growth
Stage I -- New Venture
Stage II -- Expansion
Stage III -- Professionalization
Stage IV -- Consolidation
Approximate Organizational Size ($Million of Sales)
$0.3 – 441 Acres
$0.3 to $3.3 – 441 to 4800
$3.3 to $33 – 4800 to 48,000
$33 to $167 -- > 48,000
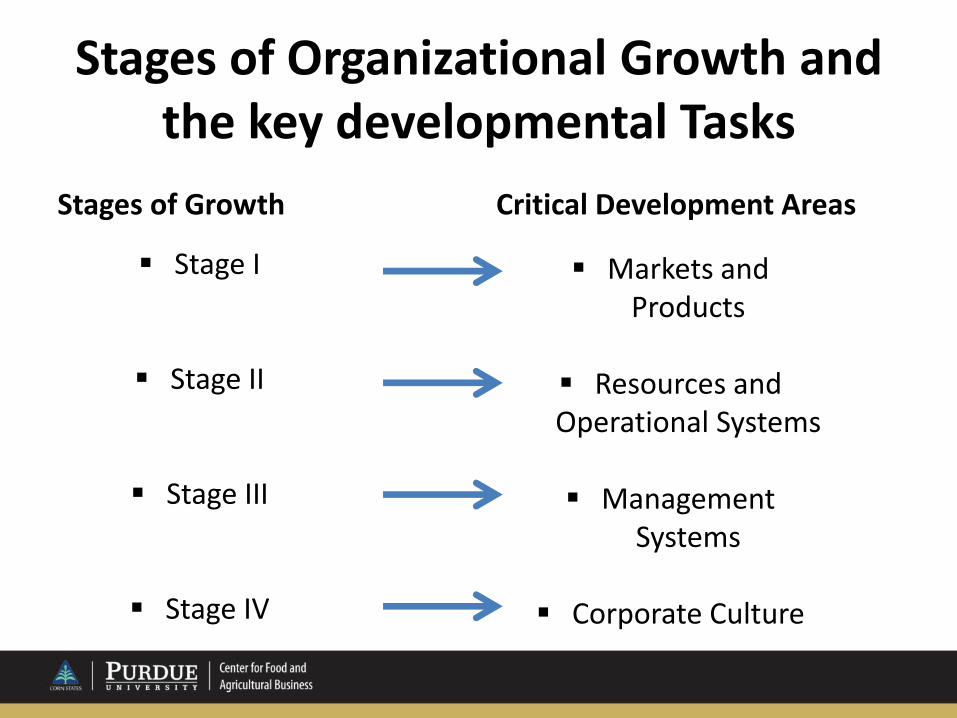
Stages of Organizational Growth and the key developmental Tasks
Stages of Growth
Stage I
Stage II
Stage III
Stage IV
Critical Development Areas
Markets and Products
Resources and Operational Systems
Management
Systems
Corporate Culture

Professional or Entrepreneurial? Key Result Areas Professional Management Entrepreneurship
Profit Profit orientation; profit as an explicit goal
Profit as a by-product
Planning Formal systematic planning: • Strategic Planning • Operational Planning • Contingency Planning
Informal, ad hoc planning
Organization Formal, explicit role descriptions that are mutually exclusive and exhaustive
Informal structure with overlapping and undefined responsibilities
Control Formal, planned system of organizational control, including explicit objectives, targets, measures, evaluations, and awards
Partial, ad hoc control, seldom with formal measurement
Mgmt Development Planned Mgmt. Development: • Identification of requirements • Design of Programs
Ad hoc development, principally through on-the-job training
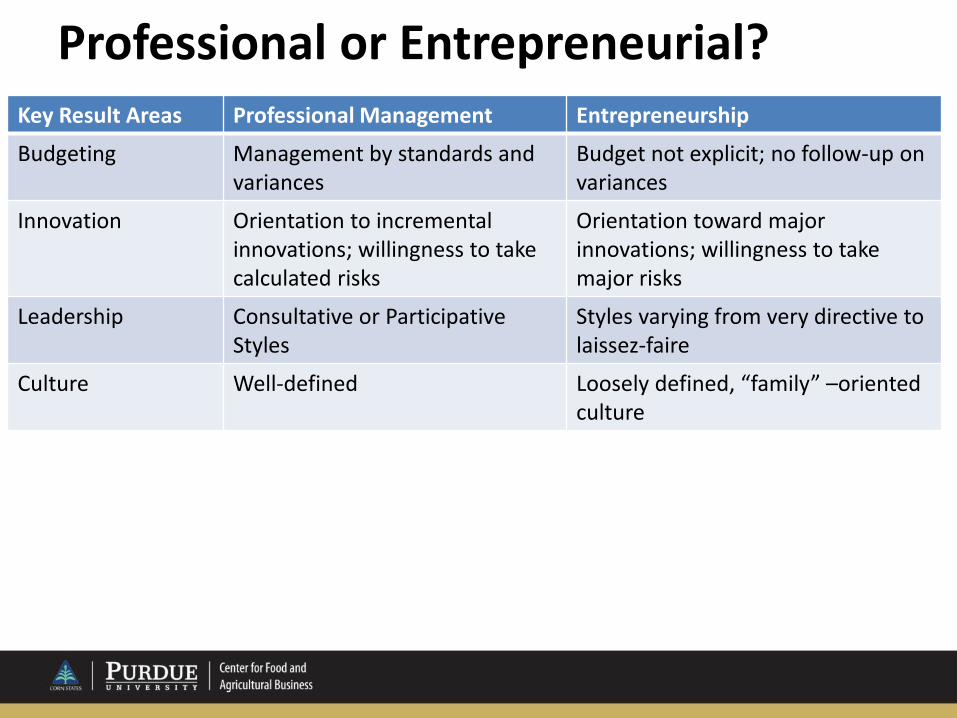
Professional or Entrepreneurial? Key Result Areas Professional Management Entrepreneurship
Budgeting Management by standards and variances
Budget not explicit; no follow-up on variances
Innovation Orientation to incremental innovations; willingness to take calculated risks
Orientation toward major innovations; willingness to take major risks
Leadership Consultative or Participative Styles
Styles varying from very directive to laissez-faire
Culture Well-defined Loosely defined, “family” –oriented culture

The Professional Management System Planning System
Organization
Operations
Performance Review Meetings
Performance Appraisal
Compensation
Results Management Development
System
Performance Measurement
System

The Tools of Professional Management
Strategic Planning
Organizational Structure
Management Leadership Development
Organizational Control and Performance Management Systems
Effective Leadership
Corporate Culture Management

Pyramid of Organizational Development Corporate
Culture
Management Systems
Operational Systems
Resource Management ▪Financial ▪Physical ▪Technological ▪Human
Product and Services ▪Develop Products and Services
Markets ▪Defined Targeted Segments ▪Develop Niche
Business Foundation ▪Business Concept ▪Core Strategy ▪Strategic Mission
• Accounting
• Information
Systems
• Production
• R&D
• Marketing
• Sales
• Human
Resources
• Planning Systems
• Organization Structure
• Management Development Systems
• Control and Performance Management
Systems
• Values
• Beliefs
• Norms
