transit: unlocking options for efficient logistics ... · pdf filetransit: unlocking options...
TRANSCRIPT
FINAL REPORT
TraNSIT: Unlocking options for efficient logistics infrastructure in Australian agriculture
June 2017Andrew Higgins, Stephen McFallan, Adam McKeown, Caroline Bruce, Oswald Marinoni, Chris Chilcott, Peter Stone, Luis Laredo, Matt Beaty
LAND AND WATERwww.csiro.au
CITATION
Higgins AJ, McFallan S, McKeown A, Bruce C, Marinoni O, Chilcott C, Stone P, Laredo L, Beaty M (2017) TraNSIT: Unlocking options for efficient logistics infrastructure in Australian agriculture. CSIRO, Australia.
COPYRIGHT AND DISCLAIMER
© Commonwealth Scientific and Industrial Research Organisation 2017. To the extent permitted by law, all rights are reserved and no part of this publication covered by copyright may be reproduced or copied in any form or by any means except with the written permission of CSIRO.
IMPORTANT DISCLAIMER
CSIRO advises that the information contained in this publication comprises general statements based on scientific research. The reader is advised and needs to be aware that such information may be incomplete or unable to be used in any specific situation. No reliance or actions must therefore be made on that information without seeking prior expert professional, scientific and technical advice. To the extent permitted by law, CSIRO (including its employees and consultants) excludes all liability to any person for any consequences, including but not limited to all losses, damages, costs, expenses and any other compensation, arising directly or indirectly from using this publication (in part or in whole) and any information or material contained in it.
CSIRO is committed to providing web accessible content wherever possible. If you are having difficulties with accessing this document please contact [email protected].
TraNSIT: Unlocking options for efficient logistics infrastructure in Australian agriculture

1 Introduction .......................................................................................................................2
2 Methods to inform agricultural investments and regulatory changes .....................................32.1 Background to TraNSIT ............................................................................................................................................3
2.2 Methods ...................................................................................................................................................................4
3 Objectives ..........................................................................................................................6
4 Adaptation of TraNSIT to each agricultural commodity .........................................................74.1 Beef...........................................................................................................................................................................8
4.2 Grains (winter cereals) ............................................................................................................................................9
4.3 Cotton ....................................................................................................................................................................10
4.4 Dairy .......................................................................................................................................................................10
4.5 Pigs .........................................................................................................................................................................11
4.6 Sugar ......................................................................................................................................................................12
4.7 Rice .........................................................................................................................................................................13
4.8 Horticulture ...........................................................................................................................................................13
4.9 Sheep/Goats ...........................................................................................................................................................15
4.10 Chicken Meat .........................................................................................................................................................16
4.11 Buffalo ....................................................................................................................................................................16
4.12 Other supply chains ..............................................................................................................................................17
4.12.1 Stockfeed ...................................................................................................................................................17
4.12.2 Retail Chain ...............................................................................................................................................17
4.13 General statistics ...................................................................................................................................................17
5 Baseline analysis ..............................................................................................................20
6 Case Studies ....................................................................................................................356.1 Toowoomba Second Range Crossing (TSRC) .......................................................................................................35
6.2 Higher mass limit for milk transport- Mt Gambier to Warrambool to Melbourne ..........................................37
6.3 Sheep feedlot near Albany Western Australia ....................................................................................................38
6.4 Impact of road closures from flooding in the Forbes region in NSW ...............................................................41
6.5 Evaluation of Northern Australian Beef Roads projects .....................................................................................43
6.6 Type 2 upgrade from Barringun Qld to Nyngan NSW ......................................................................................44
6.7 All agriculture shifted from rail to road ..............................................................................................................45
7 Sensitivities .....................................................................................................................47
8 Next Steps .......................................................................................................................478.1 Extension to rain and flood hazards ....................................................................................................................47
8.2 Extension to broader freight ................................................................................................................................48
8.3 National Freight and Supply Chain Strategy ........................................................................................................48
8.4 Web based version of TraNSIT ..............................................................................................................................48
References ............................................................................................................................49
APPENDIX A Technical Overview of TraNSIT ...........................................................................50
Contents
i
ii TraNSIT: Unlocking options for efficient logistics infrastructure in Australian agriculture
AcknowledgementsThis initiative was funded through the Australian Government’s Agricultural Competitiveness White Paper - the government’s plan for stronger farmers and a stronger economy.
We are very grateful for the support that a large number of organisations, associations and government agencies have contributed to this project. Contributions included expert knowledge, data, input into case studies and communications to broader stakeholders.
Australian Agriculural Company
Australian Bureau of Agriculture and Resource Ecomomcs (ABARES)
AgForce
AgriGrowth
Apple & Pear Growers Association of SA Inc
Apple and Pear Australia Ltd
Australian Bureau of Statistics
Australian Food and Grocery Council
Australian Horticultural Exporters Association
Australian Livestock and Rural Transporters Association
Australian Local Government Association
Australian Lot Feeders Association
Australian Melons Association Inc
Australian Pork Ltd
Australian Rail Track Corporation
Ausveg
Biosecurity Tasmania
Cattle Council of Australia
CBH Group
Citrus Australia
Cotton Australia
Cotton Ginners Association
Dairy Australia
Darwin Port
Department of Agriculture and Food Western Australia
Department of Agriculture and Water Resources
Department of Foreign Affairs and Trade
Department of Infrastructure and Regional Development
Department of Primary Industries and Regions South Australia
Flinders Shire Council
Fremantle Ports
Grain Growers
GrainCorp
Grove Juice
Horticulture Industry Network
Horticulture Innovation Australian Limited
Infrastructure Australia
JBS Australia
Local Government Association of Queensland
Mareeba Shire Council
McCain
Naomi Cotton
National Farmers Federation
National Heavy Vehicle Regulator

iii
National Livestock Identification System - NLIS
National Transport Commission
Northern Territory Cattlemans Association
NSW Department of Primary Industries
NSW Department of Transport
NT Department of Lands and Planning
NT Department of Primary Industries
NT Department of Resources
NT Department of Transport
NT Farmers
NT Road Transport Association
Olam
Onions Australia
Pacific National
Pesico
Port of Brisbane Pty Ltd
Port of Townsville
Ports Australia
Potato Processors Association of Australia
Potatoes SA
QLD Department of Transport and Main Roads
Queensland Department of Agriculture and Fisheries
Queensland Rail
Richmond Shire Council
Sheep Meat Council
Shepparton Distilleries Pty Ltd
Simplot
Snack Brands Australia
South Australia Horticulture Coalition
SunRice
Vic DEPI
Vic Roads
Viterra
WA Department of Agriculture and Food
WA Department of Main Roads
WA Department of Transport
Wakefield Transport Group
iv TraNSIT: Unlocking options for efficient logistics infrastructure in Australian agriculture
ANDREW HIGGINSAndrew is a Principal Research Scientist at CSIRO, based in Brisbane. He joined CSIRO in 1996, with a passion in developing novel methods to optimise agriculture transport and logistics to increase profitability across supply chains. Andrew has worked closely with various Australian agriculture industries (particularly sugar and beef) for over 15 years, improving strategic and operational logistics across all segments between farming and marketing.
From 2012, Andrew led development of the Transport Network Strategic Investment Tool (TraNSIT) and its application to the Beef Roads Programme as part of the White Paper for Developing Northern Australia. The results demonstrated significant transport cost savings for many road upgrades. Andrew has a background in operations research and received his PhD from Queensland University of Technology on the topic of optimising rail freight schedules.
STEPHEN McFALLANStephen is a mathematical modeller and statistical analyst with high-level skills in software development. He joined CSIRO in 1998 and has applied his skills to develop decision support tools which enable decision makers to carry out a range of activities such as forecasting, scheduling, and optimal investment. The tools allow decision makers to compare outcomes for often conflicting policy objectives using simulation to provide robust informative data. He has applied this expertise to transport logistics in the agricultural sector, in particular leading the technical development of TraNSIT.
OSWALD MARINONIOswald is a computational geologist with a focus on complex spatial analysis to optimise planning across various scales. He has delivered a variety of projects both in Australia and overseas that include suitability assessments for mining, industrial planning, urban planning and optimisation of portfolios of environmental investments. Oswald’s part in the TraNSIT project involves the integration of data that allows for the mapping of points of production and associated yields. He is based in Brisbane.
CAROLINE BRUCECaroline assists with project coordination, mapping and data collection for the TraNSIT project. She joined CSIRO in 2001 to research the changing landscape of Australia’s Wet Tropics region. She later focused on the use of GIS to map and model environmental issues within the region, and then moved in to large project coordination. She is based in Cairns, Queensland.
ADAM McKEOWNAdam is a researcher based in Cairns, with 25 years’ experience with CSIRO. He has experience in a wide range of areas, including population and spatial ecology. For the TraNSIT project, his focus is in modelling and network analysis.
CHRIS CHILCOTTChris joined CSIRO in 2016 as Research Leader for the Northern Territory and Team Leader of Northern Australian Development. He has over 20 years’ experience in the agricultural sector, largely in livestock industries research and development, extension, industry development, trade and policy. He currently leads an ACIAR funded project working in Indonesia, Laos and Vietnam - “Evaluating options for reducing agricultural transport costs and improving market access for smallholders in South East Asia”.
LUIS LAREDOLuis, as part of his 20 years in CSIRO, contributed to work in web site development, data management and spatial sciences. He was involved in the Central Highlands Regional Resource Use Project (CHRRUPP), and development of various sugar industry models such as SugarMax and the Harvest Haul Model. More recently, he developed the road layer network used in TraNSIT and assisted in model code development and map production. He currently works at the Queensland Department of Agriculture and Fisheries as part of the Strategic Planning Policy team in the Agriculture Division.
MATT BEATYMatt is a geographer with substantial experience working across a range of geospatial topics in the areas of climate change adaptation, sustainable and liveable cities, transportation logistics, urban planning and green infrastructure, and human health and wellbeing. He is currently based in Canberra with the Australian Government Department of Health and is Co-joint Senior Lecturer at the University of New South Wales.
PETER STONEPeter Stone is a Research Program Director at CSIRO, and leads CSIRO’s work on the development of northern Australia. His work history includes farm management, food industry consulting and grain marketing. He has worked as a research agronomist throughout Australia and overseas. His most recent research has focused on identifying the scale and location of opportunities for developing northern Australia. This has included projects such as the Northern Australia Land and Water Science Review, the Flinders-Gilbert Agricultural Resource Assessment, and work relating to mosaic irrigation, land tenure and transport logistics.
SYNOPSIS OF AUTHORS

Executive Summary Transport infrastructure is essential to moving over 80 million tonnes of Australian agricultural (including horticultural) output between farms, storage, processors and to markets each year. Agriculture in Australia is characterised by long supply chains with total distance between production, processing and markets often exceeding thousands of kilometres. CSIRO developed the Transport Network Strategic Investment Tool (TraNSIT) to provide a comprehensive view of transport logistics costs and benefits due to infrastructure investments and policy changes in agriculture supply chains in Australia.
This initiative of the Agricultural Competitiveness White Paper allowed TraNSIT to be extended to a broad range of Australian agricultural commodities. The initial project goal of extending TraNSIT to 25 agricultural commodities has been exceeded with the extension of the tool to over 30 commodities representing 98% of Australian agricultural volume transported. TraNSIT is now a comprehensive logistics tool that has been applied to an extensive agricultural value chain dataset assembled through this project. TraNSIT now includes data for 222,000 enterprises, including 216,000 farms or production locations, 350 processors, 500 saleyards/feedlots, 530 storage facilities, and 3600 supermarkets and DCs. Commodities included to date are: beef, sheep/goats, dairy, pigs, poultry, grains, cotton, rice, sugar, buffalo, stockfeed, and horticulture. From these enterprises a total of 332,000 different origin to destination paths were created. The extension of TraNSIT to broader Australian agricultural commodities was conducted with support, input and validation from over 70 organisations, agencies and associations representing the agricultural/horticultural and transport sectors.
A baseline analysis was produced to show the annual transport cost for each commodity along with freight volumes along each road segment. The total annual transport cost (road and rail) is $5.8 billion or 9.8% of the total farm gross value of production in 2015/2016. Several case studies were identified by industry and government and were chosen for this report to represent the diversity of applications across Australia: Toowoomba Second Range Crossing (TSRC); flood events of 2016 in NSW Forbes shire; implementation of northern Australia Beef Roads Programme, higher mass vehicles for milk transport in Victoria; shift from rail to road transport; higher productivity vehicles between Barringun and Nyngan; and introduction of integrated sheep feedlotting and stock feed in south west Western Australia. The TSRC case study showed an annual saving of $5.4 million for agriculture, predominately for cattle, grains and post-processed commodities, with an average saving of about $21 per semi-trailer equivalent. For the flood events in central NSW late 2016, there was about a 5% increase in transport costs (or about $2 million) created by the road closures. Some commodities (e.g. cotton, grains) were impacted minimally (or not at all) during September and October, since the roads were blocked outside the harvest season. For the rail to road scenario, grains were more expensive ($208 million) when transported by road whilst cattle was much less expensive (about 70% less). These differences were primarily due to rail wagon capacity versus semi-trailer capacity.
TraNSIT is now being applied abroad, particularly in Indonesia, Laos and Vietnam to address supply chain inefficiencies and cross-border bottlenecks. In the future, TranSIT will be extended to incorporate rain and flood hazards. The updated tool will provide Australian agriculture and related stakeholders with a capacity to inform infrastructure (and related supply chain) investments and identify opportunities to reduce the economic impact of weather and flood events that disrupt either transport access or stock health. A future version of TraNSIT will have a web interface (TraNSIT Web) that can be used by key Federal and State agencies to test a range of transport infrastructure and regulatory scenarios.
1
1 Introductionreduce costs of existing supply chains and to plan for new production and markets. In November 2016, the Australian Government released its Response to Infrastructure Australia’s “Australian Infrastructure Plan”. A major focus of the Response was to investigate how the productivity and efficiency of Australia’s freight and supply chain infrastructure can best be lifted. The Australian Local Government Association (ALGA) recommended a strategy that considers an ‘end to end’ supply chain approach. Such a strategy would define nationally significant freight corridors and precincts, identify gaps, and outline a reform and investment pipeline to address these challenges. This could have significant benefits across the agricultural community, particularly as agriculture transport costs are up to 40% of market price, while also having the most diverse and seasonally variable transport chains of any commodity and a high reliance on rural infrastructure.
To provide a holistic view of transport logistics costs and benefits due to infrastructure investments and policy changes in agriculture supply chains in Australia, CSIRO developed the Transport Network Strategic Investment Tool (TraNSIT). TraNSIT is a ground up approach that, depending on the application, optimises transport routes for up to tens of thousands of enterprises and hundreds of thousands of vehicle trips between them and their markets. The outputs provide input to inform operational, investment and regulatory decisions from small scale to freight and supply chain strategies at a national scale. TraNSIT provides a rigorous, quantitative understanding of what infrastructure investment and regulatory scenarios may mean to supply chain flows and transport costs across all agricultural enterprises. This input will be critical to optimising value from the investment options available.
This project TraNSIT: Unlocking options for efficient logistics infrastructure in Australian agriculture is an initiative for “Building the infrastructure of the 21st Century” under the Agricultural Competitiveness White Paper (http://agwhitepaper.agriculture.gov.au/). The goal is to extend TraNSIT from beef to broader agricultural and horticultural supply chains across Australia and apply it to a range of case studies. It will deliver the agriculture sector and related stakeholders with options to reduce transport costs by reducing road and rail inefficiencies such as bottlenecks and pinch points.
Transport infrastructure is essential to moving over 80 million tonnes of Australian agricultural (including horticultural) output between farms, storage, and processors and to markets each year. Agriculture in Australia is characterised by long supply chains with distance between production, processing and markets often exceeding thousands of kilometres, and rarely less than hundreds. While most highways and major roads are sealed, much of the sparse rural road network, particularly near production areas, is unsealed and in poor condition.
About 80% or 657,000km of the nation’s roads are managed by local governments and about 11% of these roads are considered in poor condition (ALGA 2016). These poor road conditions substantially reduce average travel speeds (often to less than 40km/hr), damage transported livestock and horticulture, and increase maintenance costs of heavy vehicles. Unlike other resource commodities such as minerals and fuels, the agricultural industry is characterised by a very large number of transport paths to facilities such as storage, processors and saleyards, which vary substantially by time of year and between seasons. The industry uses a large proportion of Australia’s rural road network, and has a high reliance on minor roads.
Farm income, particularly in the north, is highly vulnerable to climate variability (Nelson et al. 2010) and supply chains are regularly cut by seasonal rain, restricting access to processors and markets and reducing diversification options for businesses. However, with agricultural production increasing and high seasonal variability in some parts of Australia, the government has recognised the need to invest in the nation’s road network. A range of possible future industry scenarios is being developed by industry, local, state and federal governments to
2 TraNSIT: Unlocking options for efficient logistics infrastructure in Australian agriculture

2 Methods to inform agricultural investments and regulatory changes
groups were based on different methodologies and assumptions, making it difficult to compare investment/s to assess which would have the greatest benefits to industry. TraNSIT evaluated the transport savings for 60 road upgrade submissions, where the total construction cost was estimated to exceed $3 billion. A report outlining the application of TraNSIT to the Beef Roads Programme and the resultant transport cost savings for each road upgrade can be accessed via www.csiro.au/transit.
TraNSIT is readily extendable to other commodities and road users by incorporating information representing the locations of enterprises and their new supply chains. This includes volumes of commodity moved between enterprises (origins and destinations) and transport characteristics (e.g. vehicle types, vehicle access) relating to these commodities. TraNSIT can examine transported related cost savings for a wide range of infrastructure investment and regulatory opportunities, including:
• Analysing the impact of road upgrades, e.g. sealing, widening, first/last mile improvements, upgrading roads for higher productivity vehicles and bridges. This has previously been undertaken for the northern Australian beef industry (report accessible from www.csiro.au/transit);
• Informing improvements to rail infrastructure at different locations including new freights hubs and integration with road transport;
• Informing optimisation of supply chains in the private sector;
• Forecasting freight volumes, supply chain dynamics and bottlenecks under future production scenarios, from farm to national scale;
• Testing potential outcomes for changes in policy, e.g. alignment of driver and animal welfare stops, changing truck limitations for road classes, changed biosecurity regulation such as changes to tick-clearing and controls for cattle being transported directly to abattoirs;
• Comparing infrastructure investment and regulatory-change opportunities that maximise transport cost reductions for a given (limited) investment budget.
In this project, some of these applications were tested using TraNSIT.
2.1 Background to TraNSITTraNSIT was initially built to model livestock supply chains in northern Australia in 2012/13 through an initiative by the Office of Northern Australia and with co-funding from the NT, WA and Queensland Governments. In 2014, TraNSIT was extended to all beef transport in Australia through a Meat and Livestock Australia initiative (Higgins et al 2015). In 2014/2015, the tool was further used to inform various road upgrades and regulatory changes for the beef industry, including sealing of roads in north Queensland and changing of tick clearing regulations for transport of cattle direct to abattoirs. These applications all incorporated significant industry (e.g. cattleman and feedlot associations, Livestock and Rural Transporters Association) and government (transport and agriculture Departments) support in the form of data and expertise to calibrate and refine the model. Rigorous validation with the beef industry also occurred, to ensure outputs stood up to extensive scrutiny and are supported by stakeholders.
The largest application of TraNSIT to date was to inform the $100 million Beef Roads Programme - an initiative in the White Paper on Developing Northern Australia. The Beef Roads Programme was the first of its type in Australia to call upon an optimisation tool to evaluate the transport cost savings for a large number of submissions. The Beef Roads Programme included a series of round table discussions in late 2015 and early 2016 to familiarise industry and government participants with TraNSIT and how it would be used to evaluate road improvements. Whilst TraNSIT had been previously used and was well known amongst most beef industry leaders, the discussions presented an opportunity for a wide range of stakeholders to critique the model and provide input to improve TraNSIT, before it was used to evaluate submissions. Rigour was essential for the components modelled in TraNSIT; the road network and it’s representation of road conditions, the vehicle travel costing module; and the supply chain paths across 45,000+ beef enterprises. As a core component of building the model to the high level of accuracy needed for analysis, TraNSIT outputs were regularly checked by state/territory transport Departments, transport providers and farming groups. The application of TraNSIT to the Beef Roads Programme enabled a consistent, rigorous and fair comparison across all of the submissions. Previously, submissions provided by different jurisdictions and industry
3
2.2 MethodsComputer based modelling of agriculture transport movements and cost provides a means to understand the agriculture transport volumes across the road/rail network and logistics bottlenecks, and to analyse opportunities to reduce transport costs to agricultural enterprises and service providers. There have been a few methods to mapping transport logistics in agricultural supply chains. The most common approaches use national and publicly available statistics on regional agricultural (and other commodity) production and supply chain slows. These are used to map vehicle and rail movements along major corridors and to ports. In Australia, the Australian Government’s Bureau of Infrastructure, Transport and Regional Economics (BITRE) has conducted several studies which map agriculture transport flows through the supply chain. These include general freight forecasts for multiple commodities (BITRE, 2006) and more recently, a freight flow analysis for sugar (BITRE, 2016). The freight flow mapping have been used to identify future major flows of commodities to markets, both domestic and international. A State of Logistics study by Higgins et al. (2011) developed and tested a methodology that estimates the costs of logistics for a number of Australian food commodities (mango, sugar, wine, livestock) and identifies supply chain path challenges. These methods and the data that underpins them, compliment complement TraNSIT through painting the big picture freight task for different commodities, and providing information when data at enterprise level is not available/accessible.
To evaluate road related infrastructure investments, various cost-benefit have been utilised by government and consultants, and are usually based on Annual Average Daily Traffic (AADT) volumes. State/Territory transport departments gather AADT volumes at various locations across the state/territory road network, and are readily available for road upgrade applications. At each specific location, vehicle (or axel) numbers are calculated over a period of time and are used to estimate passenger and freight vehicle numbers per year. Recent applications of this approach include the Inland Queensland Roads Action
Plan (IQ-RAP 2016) and the Austroads report “Identification of Risk Indicator to Support Life Line Freight Routes” (Austroads 2016). Methods based on AADT volumes are: 1) simple to use, quick to apply and do not require knowledge about the industry supply chains; and 2) they cover all road users, not just those associated with a specific industry such as agriculture. However, the cost-benefit methods using AADT volumes have limitations. Firstly, they usually do not discern the commodity being transported on heavy vehicles. Secondly, they usually do not consider vehicle counts at different points of the road corridor - vehicles enter and exit at different points of the road corridor, and the point on the road where AADT volumes are made may not be representative of vehicle counts on other parts of the road. Thirdly, AADT volumes are usually not available for all roads, particularly minor and local roads. Lastly, they do not consider change in road usage, supply chain paths and freight flows across the network in the event of a road upgrade. Methods based on AADT volumes can be used for road upgrades that are unlikely to change traffic flows or supply chain paths. They can also be a useful first step to inform a more detailed and comprehensive analysis.
TraNSIT takes a different approach to the above methods through a ground-up approach utilising detailed industry data at enterprise level. The method focuses on transport between enterprises, providing the most granular analysis possible whilst providing a dynamic representation of agriculture transport paths at different locations. It represents all movements between agricultural enterprises, capturing the industry specific characteristics of the transport network, the vehicle movements and supply chains structures. Transport logistics and costs between enterprises is calculated through simulating/optimising individual vehicle/rail trips using detailed vehicle/train models that accommodate likely driver routes, vehicle choice capabilities or other complicated operational logistics that are linked to the infrastructure. For example, if a small road segment in a B-Double road corridor is limited to semi-trailers, the driver has the choice between decoupling versus taking a detour, and there is a different
4 TraNSIT: Unlocking options for efficient logistics infrastructure in Australian agriculture
cost for each choice. TraNSIT was primarily developed to estimate the transport related cost savings for infrastructure investment e.g. road/rail upgrades, higher productivity vehicles, freight hubs, processing, storage facilities and regulatory changes at the highest level of detail along major and minor freight routes (e.g. minor/local roads, last mile), accommodating additional transport impacts associate with changes to the supply chain and transport path/vehicle/mode that may occur after the investment.
A challenge to constructing TraNSIT is accessing high quality dis-aggregated data (at enterprise level), including historical data on enterprise locations and tonnes of crop/livestock produced at each enterprise and transported to other enterprises. In Australia, those data are generally collected by processors, traders and industry representative organisations and as such are usually confidential and only released under special circumstances. A further challenge in using the data is accurately representing the supply chains dynamics at an enterprise or enterprise cluster level. This can involve understanding integrated supply chains, the nature of different supply chain paths at different locations, bottlenecks, sensitivity to seasonal and market variability, among other things. This required expert input from the different supply chain participants: large number of farmers, transport operators, industry organisations/associations and government agencies across Australia.
This project has brought together these large data sets and industry experience across the agricultural sector on a scale never achieved before in Australia. By linking them with state-of-the-art transport logistics modelling, it is providing Australian farmers, processors, transport providers and different levels of government with the best capability to inform feasibility of infrastructure investments and broader freight strategies.
5
3 Objectives
This project – TraNSIT: Unlocking options for efficient logistics infrastructure in Australian agriculture – provides governments, industry, the farming community and other stakeholders with a baseline of freight transport costs between Australian agricultural value chain enterprises, along with a capacity to identify and evaluate a range of scenarios to minimise transport costs and maximise long-term profitability. This has been achieved by adapting the existing TraNSIT tool to a range of major agricultural commodities across Australia, and mapping their supply chains and subsequent transport routes through to processing, domestic markets and export ports.
The initial goal of the project was to determine freight costs and model costs/profitability for 25 agricultural commodities or 95% of Australian agriculture. This was exceeded and about 98% of agriculture transported representing 32 commodities are now incorporated. Most commodities were selected based on their significance (production volume and market value [$m] (source ABS)) and some further commodities were selected based on their importance with some states or territories. A further goal of the project was to apply the model to a range of infrastructure and regulatory case studies across Australia, as identified by industry and government.
6 TraNSIT: Unlocking options for efficient logistics infrastructure in Australian agriculture
4 Adaptation of TraNSIT to each agricultural commodity
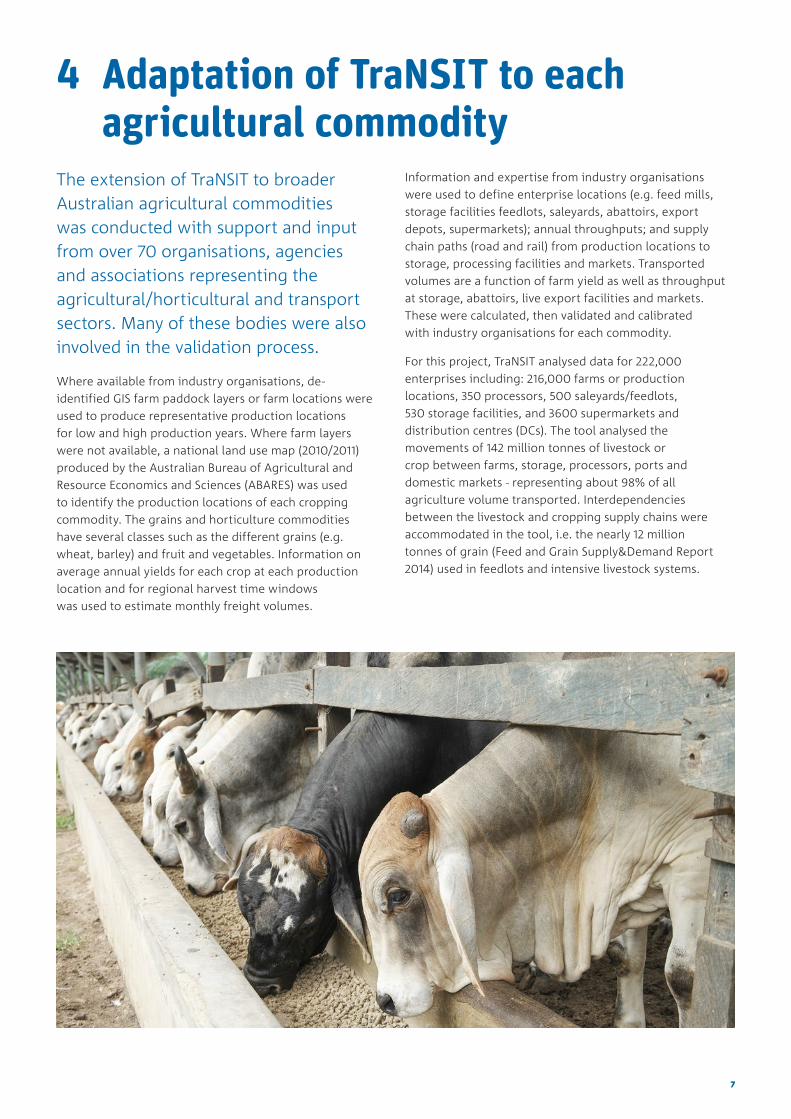
The extension of TraNSIT to broader Australian agricultural commodities was conducted with support and input from over 70 organisations, agencies and associations representing the agricultural/horticultural and transport sectors. Many of these bodies were also involved in the validation process.
Where available from industry organisations, de-identified GIS farm paddock layers or farm locations were used to produce representative production locations for low and high production years. Where farm layers were not available, a national land use map (2010/2011) produced by the Australian Bureau of Agricultural and Resource Economics and Sciences (ABARES) was used to identify the production locations of each cropping commodity. The grains and horticulture commodities have several classes such as the different grains (e.g. wheat, barley) and fruit and vegetables. Information on average annual yields for each crop at each production location and for regional harvest time windows was used to estimate monthly freight volumes.
Information and expertise from industry organisations were used to define enterprise locations (e.g. feed mills, storage facilities feedlots, saleyards, abattoirs, export depots, supermarkets); annual throughputs; and supply chain paths (road and rail) from production locations to storage, processing facilities and markets. Transported volumes are a function of farm yield as well as throughput at storage, abattoirs, live export facilities and markets. These were calculated, then validated and calibrated with industry organisations for each commodity.
For this project, TraNSIT analysed data for 222,000 enterprises including: 216,000 farms or production locations, 350 processors, 500 saleyards/feedlots, 530 storage facilities, and 3600 supermarkets and distribution centres (DCs). The tool analysed the movements of 142 million tonnes of livestock or crop between farms, storage, processors, ports and domestic markets - representing about 98% of all agriculture volume transported. Interdependencies between the livestock and cropping supply chains were accommodated in the tool, i.e. the nearly 12 million tonnes of grain (Feed and Grain Supply&Demand Report 2014) used in feedlots and intensive livestock systems.
7
The specifics of TraNSIT’s adaptation to each commodity is outlined in separate sections below.
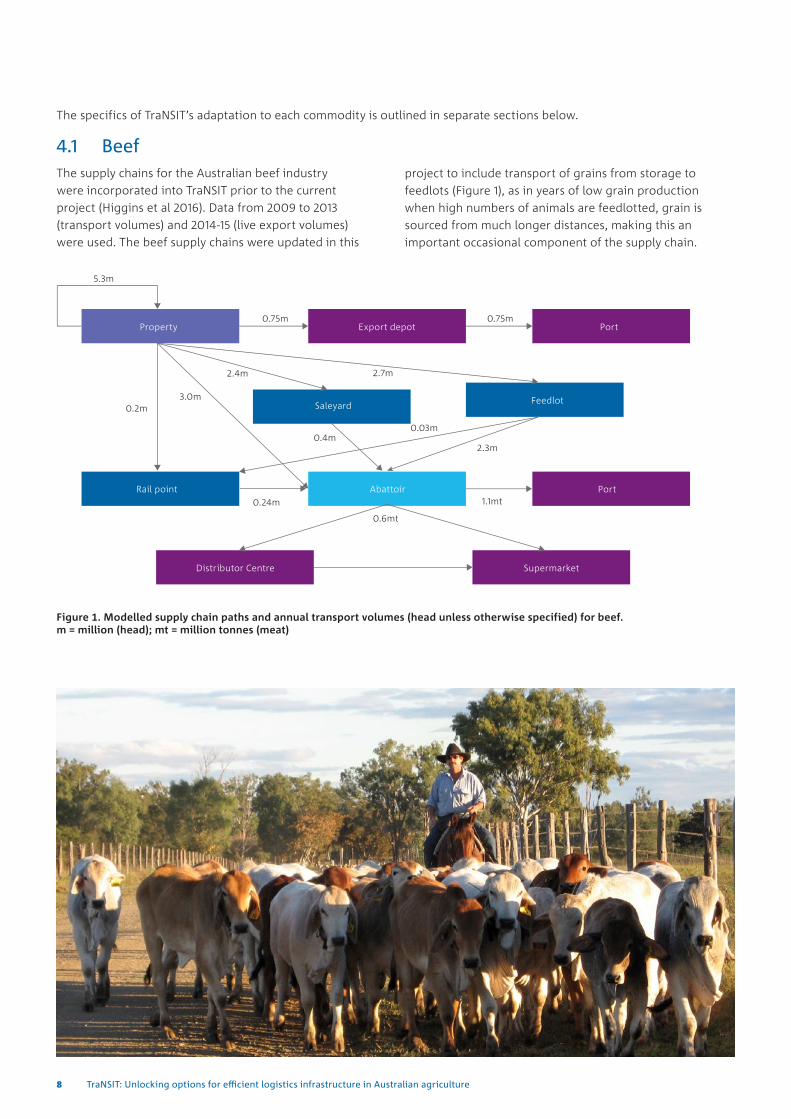
Figure 1. Modelled supply chain paths and annual transport volumes (head unless otherwise specified) for beef. m = million (head); mt = million tonnes (meat)
project to include transport of grains from storage to feedlots (Figure 1), as in years of low grain production when high numbers of animals are feedlotted, grain is sourced from much longer distances, making this an important occasional component of the supply chain.
4.1 BeefThe supply chains for the Australian beef industry were incorporated into TraNSIT prior to the current project (Higgins et al 2016). Data from 2009 to 2013 (transport volumes) and 2014-15 (live export volumes) were used. The beef supply chains were updated in this
8 TraNSIT: Unlocking options for efficient logistics infrastructure in Australian agriculture
4.2 Grains (winter cereals)Grains encompass the winter cereals wheat, barley and oats. Winter cereals are by far the largest cropped commodity in terms of cropped area and volume transported.
Due to the limited availability of farm boundary data (GIS shape files) for grains, the latest Australian national land use map (ALUM) representing the year 2010/11 was used to infer production locations and volumes. The ALUM represents land use in Australia as a collection of cells (pixels) of approximately 1km x 1km. Where available, information on historical volumes transported from individual farms to grain storage facilities was given priority over any data inferred using the land use map.
Apart from showing how land in Australia is used, the ALUM provides information about which agricultural commodities are grown where. Commodity classes are mapped in the ALUM using a combination of time series remote sensing data, census data and ground control points which provide a probability estimate for the occurrence of a certain commodity at a given location.
Winter cereals are generically mapped and the ALUM does not differentiate between individual types of winter cereals. To be able to spatially differentiate between transport volumes of wheat, barley and oats, winter cereal pixels were given an additional attribute that defined whether a pixel represented one of these winter cereal types. To derive this attribute, commodity related census information reported per statistical local area (SLA) was examined. The proportional representation of wheat, barley or oats pixels within each SLA was determined by matching the respective area share of these commodities as reported by the ABS. For example, if ABS reported that wheat covered 40% of the area of winter cereals within an SLA, 40% of the winter cereal pixels in that SLA were randomly selected and given the attribute “wheat”. Reported yield totals for wheat, barley and oats within an SLA were then evenly distributed across the available wheat, barley and oats pixels. This process thus allowed for mapping of the production
pixels for individual winter cereals as well as assigning a production volume (tonnage) to each pixel. Grain movement data provided by industry was used instead of or to refine information derived from ABS and ALUM data.
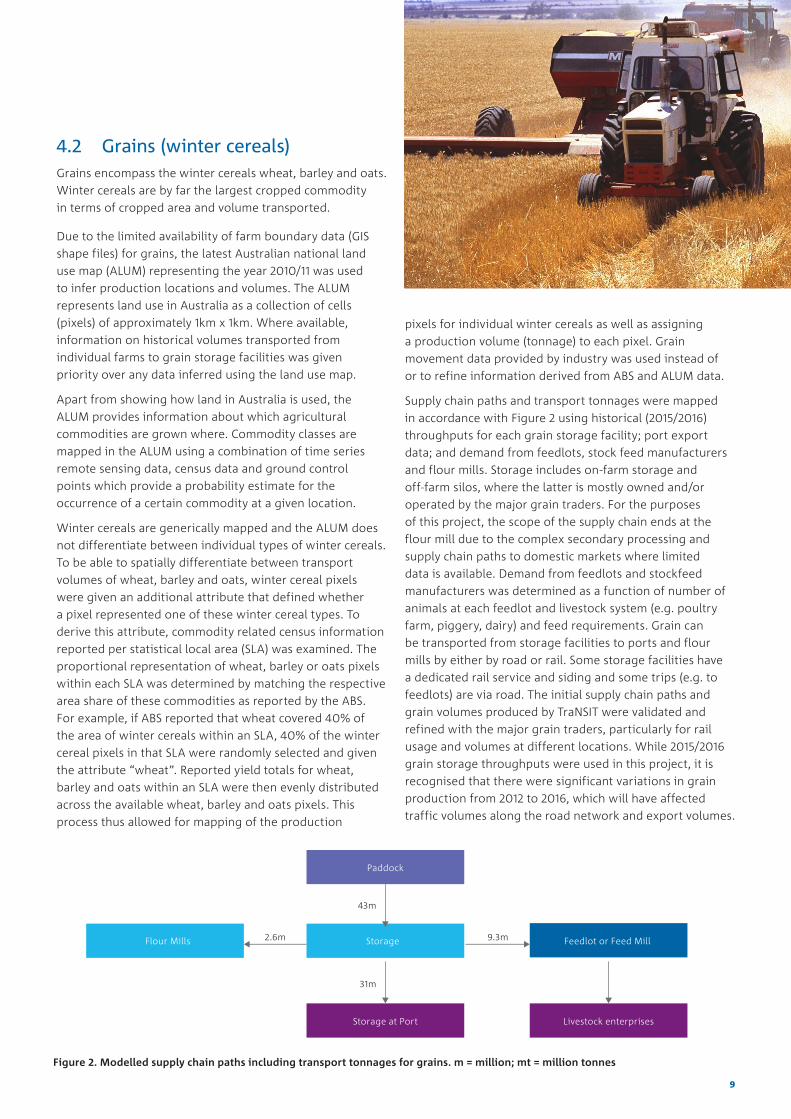
Supply chain paths and transport tonnages were mapped in accordance with Figure 2 using historical (2015/2016) throughputs for each grain storage facility; port export data; and demand from feedlots, stock feed manufacturers and flour mills. Storage includes on-farm storage and off-farm silos, where the latter is mostly owned and/or operated by the major grain traders. For the purposes of this project, the scope of the supply chain ends at the flour mill due to the complex secondary processing and supply chain paths to domestic markets where limited data is available. Demand from feedlots and stockfeed manufacturers was determined as a function of number of animals at each feedlot and livestock system (e.g. poultry farm, piggery, dairy) and feed requirements. Grain can be transported from storage facilities to ports and flour mills by either by road or rail. Some storage facilities have a dedicated rail service and siding and some trips (e.g. to feedlots) are via road. The initial supply chain paths and grain volumes produced by TraNSIT were validated and refined with the major grain traders, particularly for rail usage and volumes at different locations. While 2015/2016 grain storage throughputs were used in this project, it is recognised that there were significant variations in grain production from 2012 to 2016, which will have affected traffic volumes along the road network and export volumes.
Figure 2. Modelled supply chain paths including transport tonnages for grains. m = million; mt = million tonnes
9

4.3 CottonCotton production and volumes were mapped using farm boundary information produced by Cotton Australia for the 2011 to 2016 growing seasons. From these farm boundary data, de-identified farm locations and production volumes (number of bales per year) were derived. Due to the high variation in cotton production between years (e.g. 190,000 hectares in 2014 versus 580,000 hectares in 2011) both a low and high production scenario were included in TraNSIT.
Freight paths were mapped in accordance with Figure 3 using annual throughputs and supply chain paths provided by the cotton gins. Some rail was used for transport of cotton fibre to ports.
4.4 DairyUnlike for beef, where location of properties were easily determined from property identification codes (PICs), the mapping of dairy production required the use of the ABARES 2010/11 land use map, combined with regional annual milk production figures relevant to 2015, as provided by Dairy Australia. The two main supply chain paths (milk and cheese) were analysed (Figure 4) and the location of processors was provided by Dairy Australia.
Figure 3. Modelled supply chain paths and transport tonnages for cotton, where about 35% of harvested cotton is converted to cotton fibre and the remaining 65% is seed and waste. m = million tonnes
Figure 4. Modelled supply chain paths and annual transport volumes (kilolitres unless specified otherwise) for dairy. mt = million tonnes (meat); m kl for million kilolitres
10 TraNSIT: Unlocking options for efficient logistics infrastructure in Australian agriculture
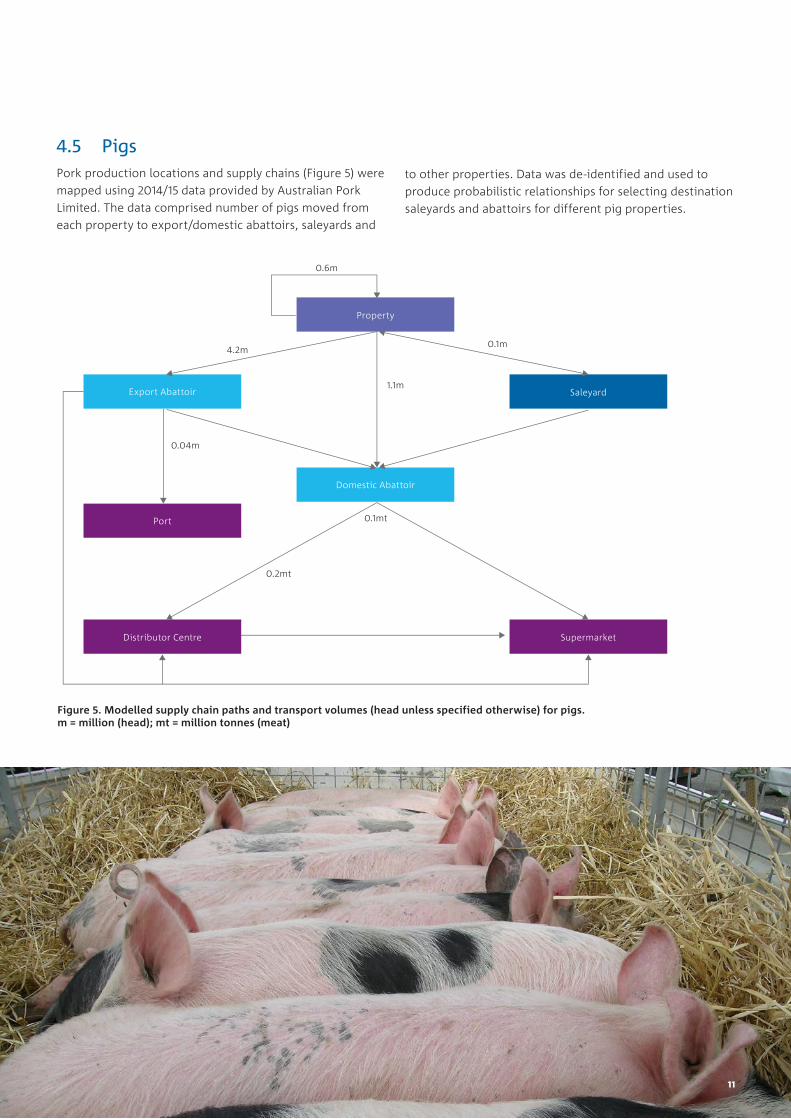
4.5 PigsPork production locations and supply chains (Figure 5) were mapped using 2014/15 data provided by Australian Pork Limited. The data comprised number of pigs moved from each property to export/domestic abattoirs, saleyards and
Figure 5. Modelled supply chain paths and transport volumes (head unless specified otherwise) for pigs. m = million (head); mt = million tonnes (meat)
to other properties. Data was de-identified and used to produce probabilistic relationships for selecting destination saleyards and abattoirs for different pig properties.
11

Figure 6. Modelled supply chain paths and annual transport tonnages for sugar. m = million. Does not include about 30 million tonnes of cane transported by the mill rail system.
4.6 SugarSugar production was based on 2014 sugar yields for each region (e.g. Burdekin, Herbert, Mackay). Production data was determined from farm paddock data where available, or from the 2010/11 ALUM land use map otherwise. Unlike other agricultural commodities, the majority of cane transported to mill is via a narrow gauge railway owned and operated by the mill. Sugarcane transported by narrow gauge railway (owned and managed by the mills) was not included in TraNSIT for this project (Figure 6). Some mill regions (e.g. Maryborough, NSW, Atherton Tableland) rely completely on road transport for sugarcane, while others use a small amount of road transport to a rail load point. Due to the low value of sugarcane (usually less than $60 per tonne of cane depending upon sugar price) and contractual arrangements between growers and mill owners, it is usually transported to the nearest sugar mill. Raw sugar that is exported is usually transported to the nearest suitable port that contains dedicated sugar storage sheds. Some sugar mills (e.g. in NSW) are predominately dedicated towards domestic use, which is not included in this report (noting that domestic consumption represents about 10%of industry output).
12 TraNSIT: Unlocking options for efficient logistics infrastructure in Australian agriculture

4.7 RiceRice production locations were based on the ABARES 2010/11 land use map for NSW and Victoria. Volumes transported to storage facilities and rice mills were based on 2013/2014 historical movements from SunRice (Figure 7).
Figure 7. Modelled supply chain paths and annual transport tonnages for rice. mt = million tonnes
4.8 HorticultureApplication of TraNSIT to horticulture focused on fruit and vegetable crops with the largest Australia-wide economic value, transport volumes and distances. The list of horticultural crops modelled was: oranges, mandarins, potatoes, broccoli, onions, apples, pears, mangoes, bananas, pumpkins, melons, carrots, lettuces and pineapples. Spatial datasets of farm/paddock boundaries were mostly unavailable for horticulture, thus growing locations were inferred using the 2010/11 ALUM landuse map. The ALUM dataset shows both commodity classes that represent individual commodities such as apples, pears, rice and grapes as well as classes which represent commodity groups. Examples of these more generic commodity groups include winter cereals, vegetables or plantation fruit.
Production locations and volumes were determined mainly from the ALUM dataset and ABS production volumes per SLA and/or, where available and usable, production data from the horticulture industry and associations (eg. NT Farmers). Quality (completeness, currency, granularity) and availability of the industry-supplied data varied significantly between commodities. The ABS census data are based on a national survey which takes place every 5 years. The data are a result of a large sample of production information
13
across commodities that are produced in Australia. The production of the ALUM data is linked to ABS census years, with the ALUM dataset also being produced every five years. To provide spatial and temporal consistency, the 2010/11 ALUM and census data were used in this analysis.
To associate commodity volumes to points of production, ABS data was disaggregated across commodity pixels in the ALUM dataset. Reported ABS yields for commodities such as apples or pears were spatially distributed across the available ALUM pixels for apples and pears within individual SLAs. However, many commodities are mapped to a generic commodity group. In these instances, production locations of individual commodities comprising this commodity group remain unknown. The spatial locations of these commodities can however be estimated. For example, while the ALUM dataset shows where vegetables were produced, it does not provide information about where potatoes (a commodity within the ‘vegetables’ group) were grown. However, with potatoes being a vegetable, the spatial locations of potatoes can be associated to the mapped extent of “vegetables”.
Linking to ABS data, which defines in which SLA potatoes were produced and in what quantity, allows spatial allocation of a potato yield to vegetable pixels that were mapped within the boundary of the corresponding SLA.
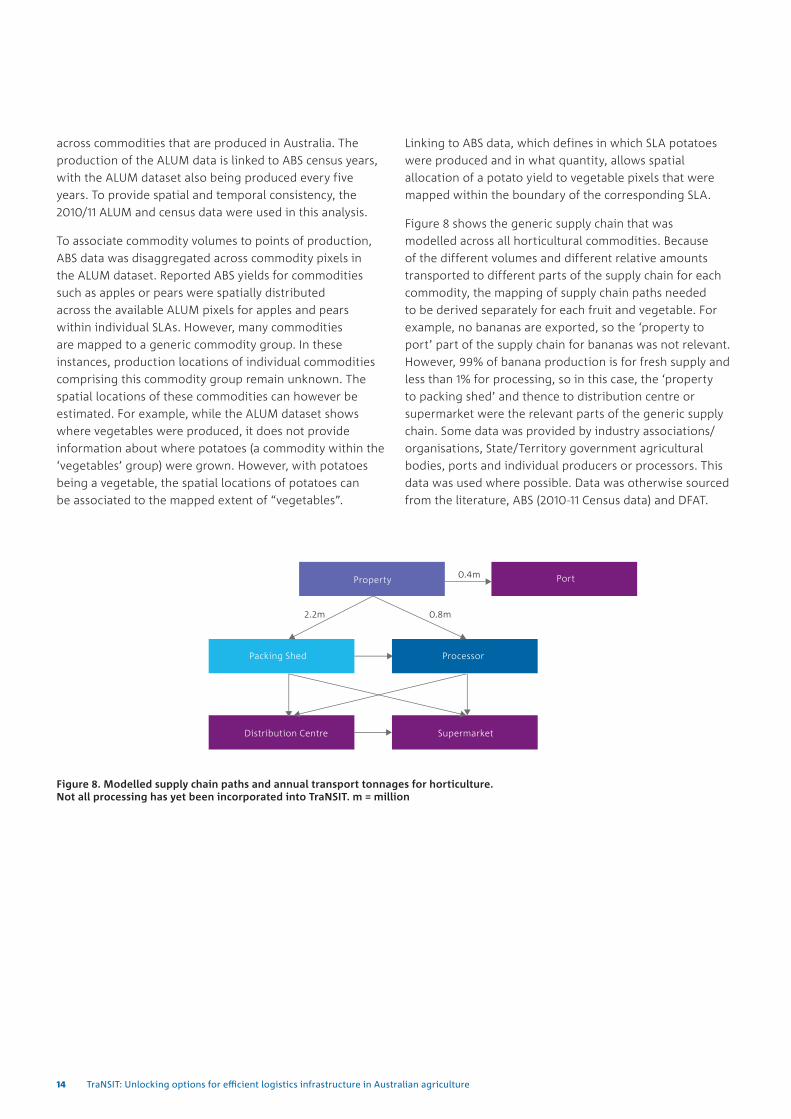
Figure 8 shows the generic supply chain that was modelled across all horticultural commodities. Because of the different volumes and different relative amounts transported to different parts of the supply chain for each commodity, the mapping of supply chain paths needed to be derived separately for each fruit and vegetable. For example, no bananas are exported, so the ‘property to port’ part of the supply chain for bananas was not relevant. However, 99% of banana production is for fresh supply and less than 1% for processing, so in this case, the ‘property to packing shed’ and thence to distribution centre or supermarket were the relevant parts of the generic supply chain. Some data was provided by industry associations/organisations, State/Territory government agricultural bodies, ports and individual producers or processors. This data was used where possible. Data was otherwise sourced from the literature, ABS (2010-11 Census data) and DFAT.
Figure 8. Modelled supply chain paths and annual transport tonnages for horticulture. Not all processing has yet been incorporated into TraNSIT. m = million
14 TraNSIT: Unlocking options for efficient logistics infrastructure in Australian agriculture
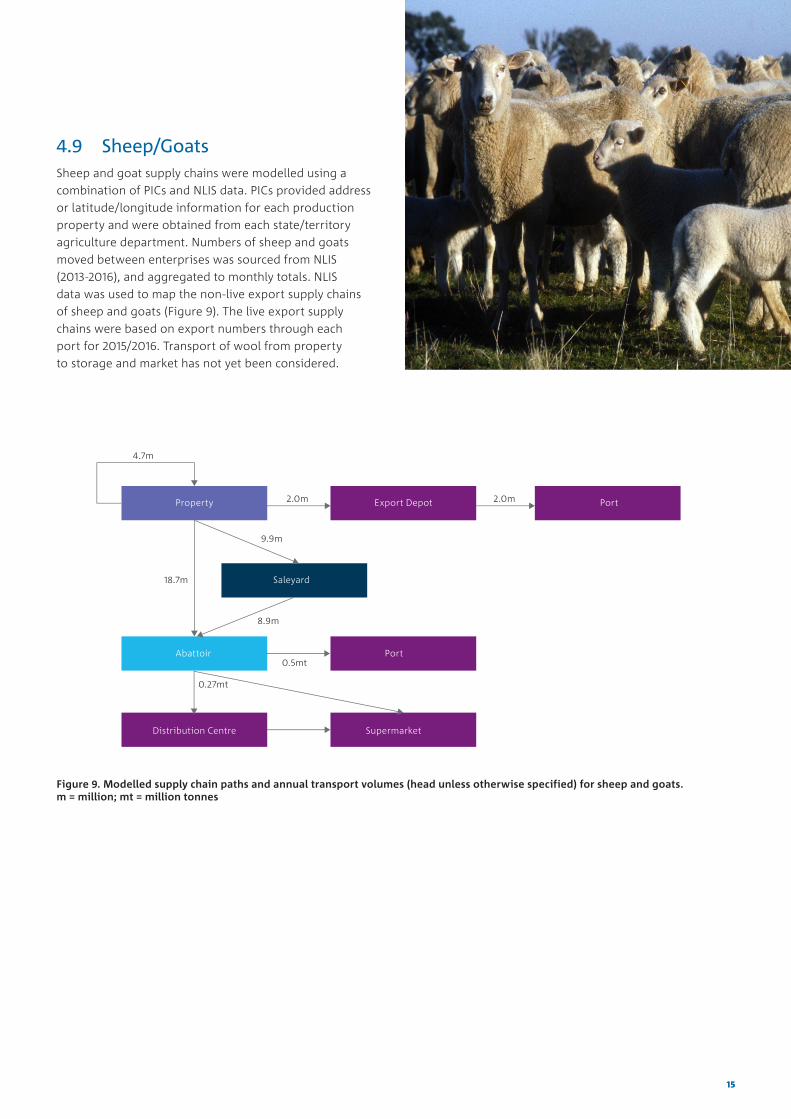
4.9 Sheep/GoatsSheep and goat supply chains were modelled using a combination of PICs and NLIS data. PICs provided address or latitude/longitude information for each production property and were obtained from each state/territory agriculture department. Numbers of sheep and goats moved between enterprises was sourced from NLIS (2013-2016), and aggregated to monthly totals. NLIS data was used to map the non-live export supply chains of sheep and goats (Figure 9). The live export supply chains were based on export numbers through each port for 2015/2016. Transport of wool from property to storage and market has not yet been considered.
Figure 9. Modelled supply chain paths and annual transport volumes (head unless otherwise specified) for sheep and goats. m = million; mt = million tonnes
Supermarket
15
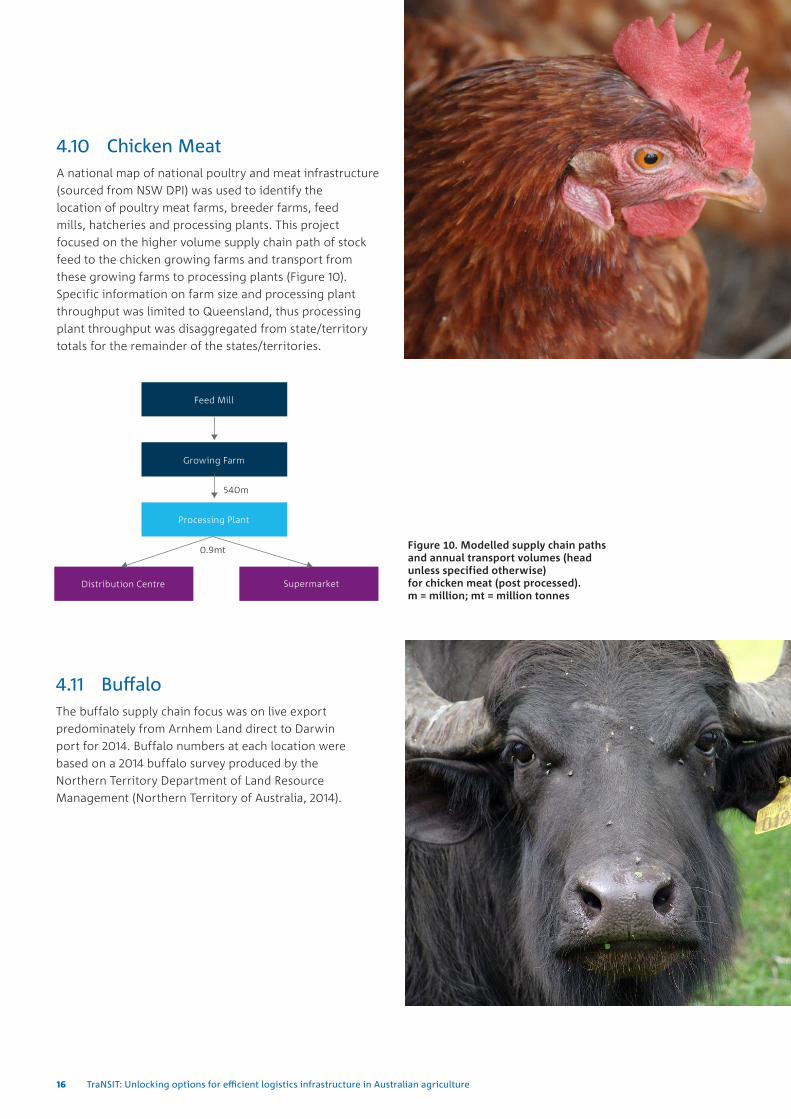
4.10 Chicken MeatA national map of national poultry and meat infrastructure (sourced from NSW DPI) was used to identify the location of poultry meat farms, breeder farms, feed mills, hatcheries and processing plants. This project focused on the higher volume supply chain path of stock feed to the chicken growing farms and transport from these growing farms to processing plants (Figure 10). Specific information on farm size and processing plant throughput was limited to Queensland, thus processing plant throughput was disaggregated from state/territory totals for the remainder of the states/territories.
4.11 BuffaloThe buffalo supply chain focus was on live export predominately from Arnhem Land direct to Darwin port for 2014. Buffalo numbers at each location were based on a 2014 buffalo survey produced by the Northern Territory Department of Land Resource Management (Northern Territory of Australia, 2014).
Figure 10. Modelled supply chain paths and annual transport volumes (head unless specified otherwise) for chicken meat (post processed). m = million; mt = million tonnes
16 TraNSIT: Unlocking options for efficient logistics infrastructure in Australian agriculture
4.12 Other supply chains
4.12.1 STOCKFEED
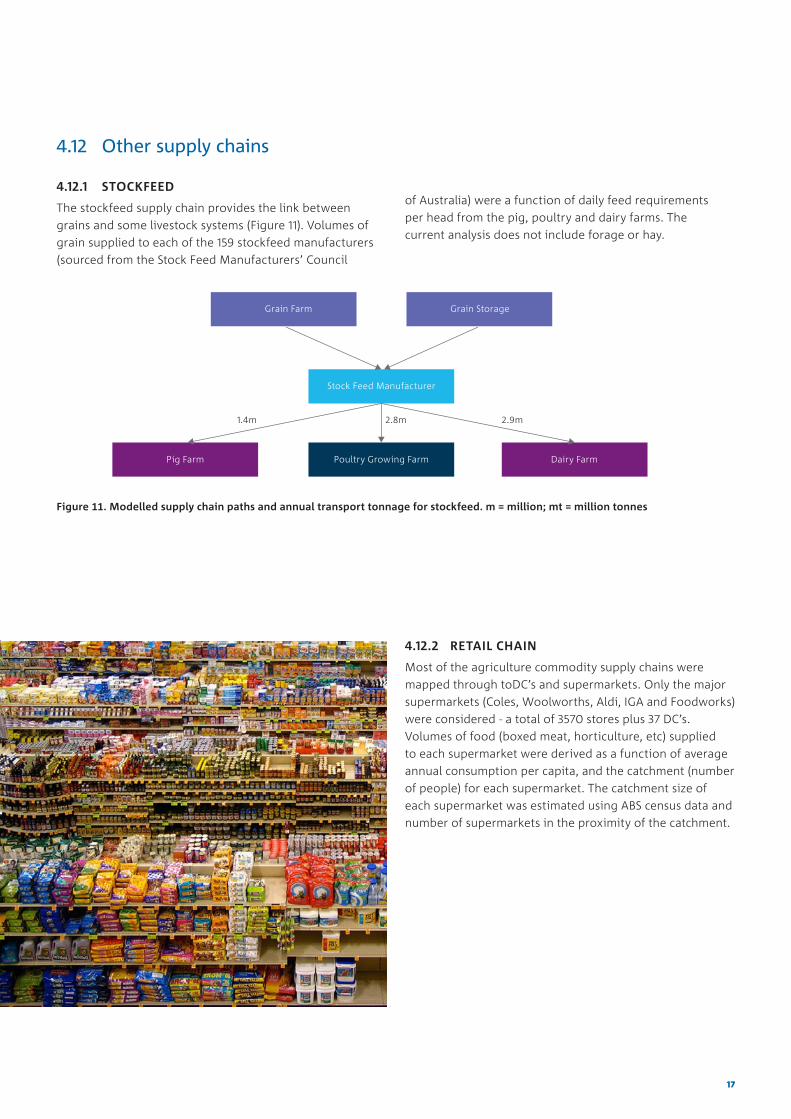
The stockfeed supply chain provides the link between grains and some livestock systems (Figure 11). Volumes of grain supplied to each of the 159 stockfeed manufacturers (sourced from the Stock Feed Manufacturers’ Council
Figure 11. Modelled supply chain paths and annual transport tonnage for stockfeed. m = million; mt = million tonnes
4.12.2 RETAIL CHAIN
Most of the agriculture commodity supply chains were mapped through toDC’s and supermarkets. Only the major supermarkets (Coles, Woolworths, Aldi, IGA and Foodworks) were considered - a total of 3570 stores plus 37 DC’s. Volumes of food (boxed meat, horticulture, etc) supplied to each supermarket were derived as a function of average annual consumption per capita, and the catchment (number of people) for each supermarket. The catchment size of each supermarket was estimated using ABS census data and number of supermarkets in the proximity of the catchment.
of Australia) were a function of daily feed requirements per head from the pig, poultry and dairy farms. The current analysis does not include forage or hay.
17
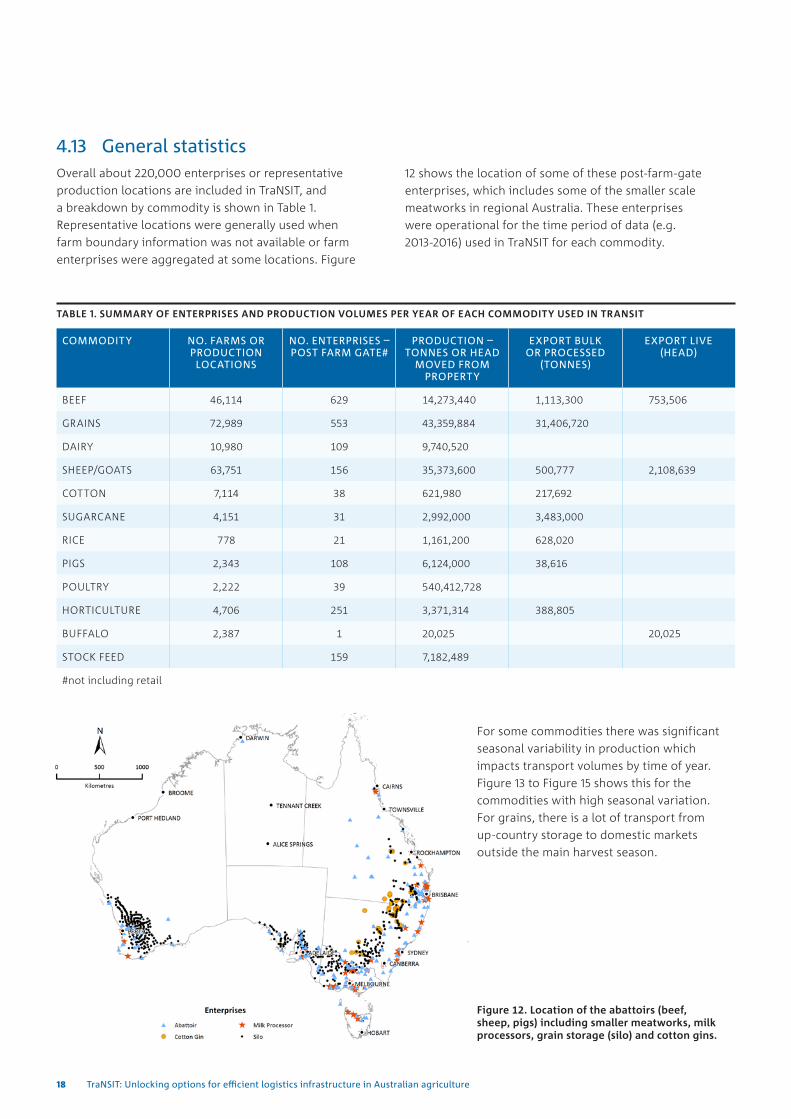
4.13 General statisticsOverall about 220,000 enterprises or representative production locations are included in TraNSIT, and a breakdown by commodity is shown in Table 1. Representative locations were generally used when farm boundary information was not available or farm enterprises were aggregated at some locations. Figure
TABLE 1. SUMMARY OF ENTERPRISES AND PRODUCTION VOLUMES PER YEAR OF EACH COMMODITY USED IN TRANSIT
COMMODITY NO. FARMS OR PRODUCTION LOCATIONS
NO. ENTERPRISES – POST FARM GATE#
PRODUCTION –TONNES OR HEAD
MOVED FROM PROPERTY
EXPORT BULK OR PROCESSED
(TONNES)
EXPORT LIVE (HEAD)
BEEF 46,114 629 14,273,440 1,113,300 753,506
GRAINS 72,989 553 43,359,884 31,406,720
DAIRY 10,980 109 9,740,520
SHEEP/GOATS 63,751 156 35,373,600 500,777 2,108,639
COTTON 7,114 38 621,980 217,692
SUGARCANE 4,151 31 2,992,000 3,483,000
RICE 778 21 1,161,200 628,020
PIGS 2,343 108 6,124,000 38,616
POULTRY 2,222 39 540,412,728
HORTICULTURE 4,706 251 3,371,314 388,805
BUFFALO 2,387 1 20,025 20,025
STOCK FEED 159 7,182,489
#not including retail
Figure 12. Location of the abattoirs (beef, sheep, pigs) including smaller meatworks, milk processors, grain storage (silo) and cotton gins.
12 shows the location of some of these post-farm-gate enterprises, which includes some of the smaller scale meatworks in regional Australia. These enterprises were operational for the time period of data (e.g. 2013-2016) used in TraNSIT for each commodity.
For some commodities there was significant seasonal variability in production which impacts transport volumes by time of year. Figure 13 to Figure 15 shows this for the commodities with high seasonal variation. For grains, there is a lot of transport from up-country storage to domestic markets outside the main harvest season.
18 TraNSIT: Unlocking options for efficient logistics infrastructure in Australian agriculture
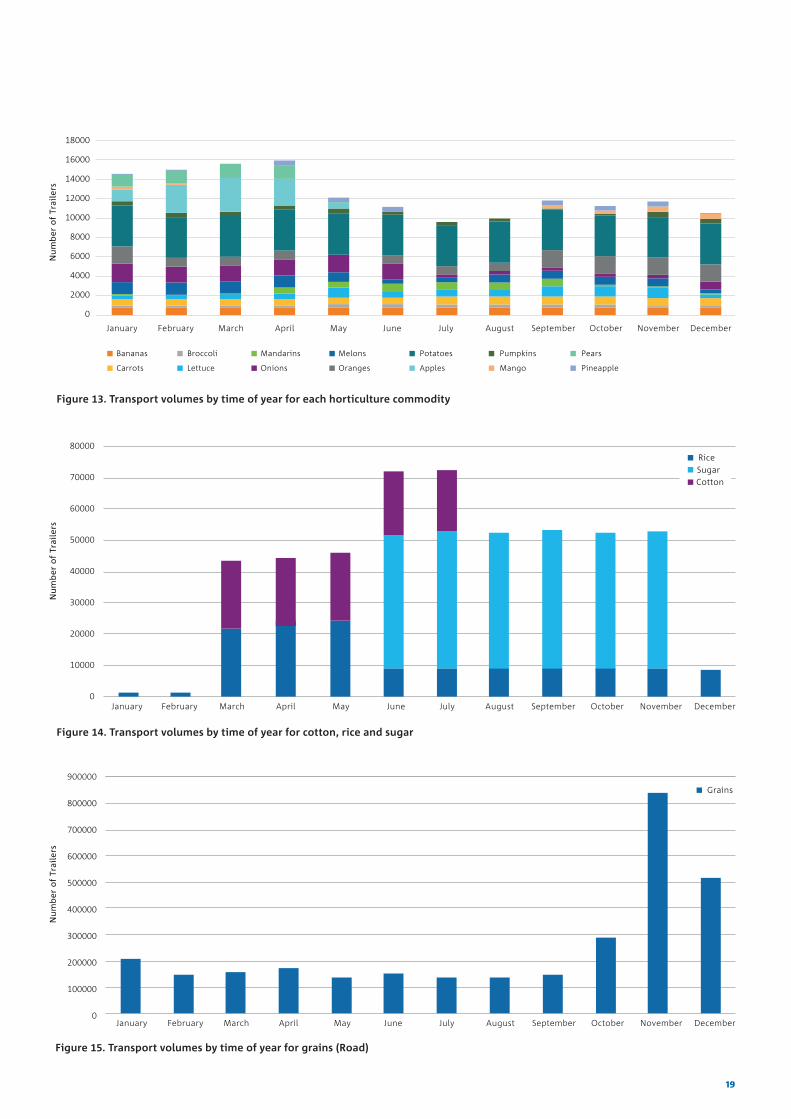
Figure 13. Transport volumes by time of year for each horticulture commodity
Figure 14. Transport volumes by time of year for cotton, rice and sugar
Figure 15. Transport volumes by time of year for grains (Road)
19
5 Baseline analysisA baseline analysis provides information on the number of vehicles travelling along each road/rail segment, and needs to be undertaken before case studies can be tested. The main outputs from the baseline are:
• number of vehicles using each road segment by commodity, month of year, origin and destinations routes.
• number of trains operating across the rail network by time of year, rail loads.
• detailed cost of road and rail transport for every vehicle and rail trip.
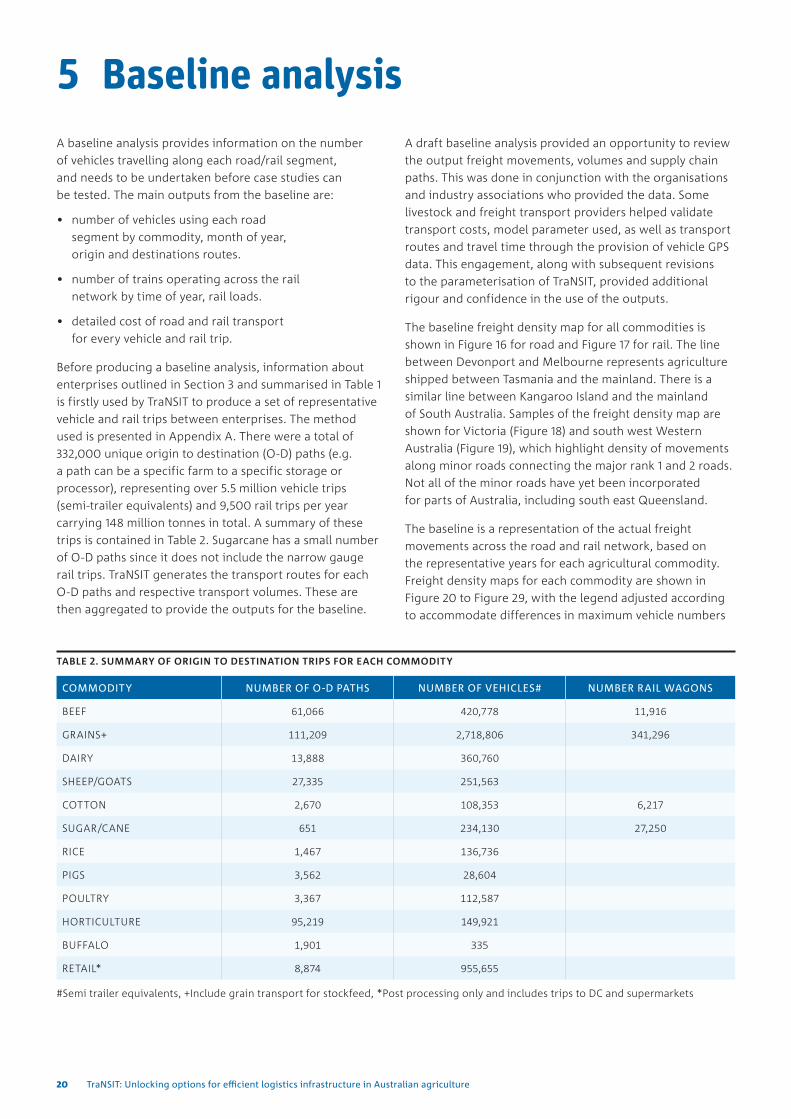
Before producing a baseline analysis, information about enterprises outlined in Section 3 and summarised in Table 1 is firstly used by TraNSIT to produce a set of representative vehicle and rail trips between enterprises. The method used is presented in Appendix A. There were a total of 332,000 unique origin to destination (O-D) paths (e.g. a path can be a specific farm to a specific storage or processor), representing over 5.5 million vehicle trips (semi-trailer equivalents) and 9,500 rail trips per year carrying 148 million tonnes in total. A summary of these trips is contained in Table 2. Sugarcane has a small number of O-D paths since it does not include the narrow gauge rail trips. TraNSIT generates the transport routes for each O-D paths and respective transport volumes. These are then aggregated to provide the outputs for the baseline.
A draft baseline analysis provided an opportunity to review the output freight movements, volumes and supply chain paths. This was done in conjunction with the organisations and industry associations who provided the data. Some livestock and freight transport providers helped validate transport costs, model parameter used, as well as transport routes and travel time through the provision of vehicle GPS data. This engagement, along with subsequent revisions to the parameterisation of TraNSIT, provided additional rigour and confidence in the use of the outputs.
The baseline freight density map for all commodities is shown in Figure 16 for road and Figure 17 for rail. The line between Devonport and Melbourne represents agriculture shipped between Tasmania and the mainland. There is a similar line between Kangaroo Island and the mainland of South Australia. Samples of the freight density map are shown for Victoria (Figure 18) and south west Western Australia (Figure 19), which highlight density of movements along minor roads connecting the major rank 1 and 2 roads. Not all of the minor roads have yet been incorporated for parts of Australia, including south east Queensland.
The baseline is a representation of the actual freight movements across the road and rail network, based on the representative years for each agricultural commodity. Freight density maps for each commodity are shown in Figure 20 to Figure 29, with the legend adjusted according to accommodate differences in maximum vehicle numbers
TABLE 2. SUMMARY OF ORIGIN TO DESTINATION TRIPS FOR EACH COMMODITY
COMMODITY NUMBER OF O-D PATHS NUMBER OF VEHICLES# NUMBER RAIL WAGONS
BEEF 61,066 420,778 11,916
GRAINS+ 111,209 2,718,806 341,296
DAIRY 13,888 360,760
SHEEP/GOATS 27,335 251,563
COTTON 2,670 108,353 6,217
SUGAR/CANE 651 234,130 27,250
RICE 1,467 136,736
PIGS 3,562 28,604
POULTRY 3,367 112,587
HORTICULTURE 95,219 149,921
BUFFALO 1,901 335
RETAIL* 8,874 955,655
#Semi trailer equivalents, +Include grain transport for stockfeed, *Post processing only and includes trips to DC and supermarkets
20 TraNSIT: Unlocking options for efficient logistics infrastructure in Australian agriculture

between commodities. Unused road segments are left as dark grey. To highlight differences between the pre-processing and post-processing (processer to supermarket or port) stages of the supply chain, all post processing vehicle trips (except cotton) are shown in Figure 29. These post processing vehicle trips are often long distances to DC’s and supermarkets across the country, particularly when the production/processing locations are a long distance to the major domestic markets. Horticulture (Figure 25) also involves long travel distances from production locations to domestic markets, particularly for tropical crops (e.g. mango, bananas, melons, pineapple) that are predominately grown in a small number of locations in northern Australia and transported to markets in the south. Poultry (Figure 28) is dominated by short travel distances (usually <100km) between growing farms and processing plans, with freight mostly near the major centres of population.
A summary of modelled annual transport cost for each commodity is shown in Table 3. These summary transport costs can be disaggregated by state, local government area, individual roads, etc. The total annual transport cost (road and rail) is $5.8 billion or 9.8% of the total farm gross value of production in 2015/2016 (ABARES 2017). This % would be slightly higher if the current version of TraNSIT included the remainder of Australian agriculture transport. It currently has about 98% of agriculture volume on road and rail (excluding cane rail). The total greenhouse gas emissions is 6.6% of the baseline 2010 emissions for non-car road vehicles in Australia (BITRE 2007). Grains account for nearly 90% of all rail costs. The rail costs are sensitive to parameters used in the rail costing model embedded in TraNSIT, particularly the wagon capacity, axel load limits, travel time, capital costs and the number of round trips the rolling stock is used per year.
Figure 16. Baseline annual trailer (semi-trailer equivalent) freight flow map for all commodities - beef, sheep, grains, pigs, goats, dairy, cotton, rice, sugar, poultry, horticulture, buffalo.
21
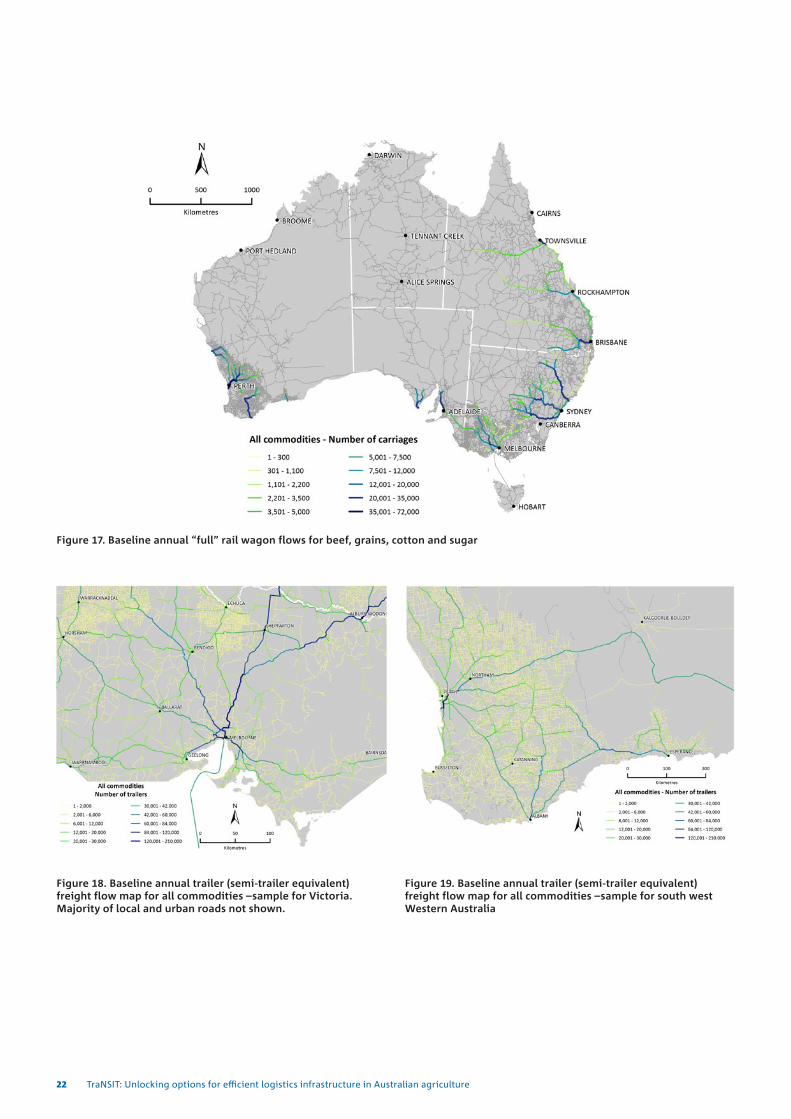
Figure 17. Baseline annual “full” rail wagon flows for beef, grains, cotton and sugar
Figure 18. Baseline annual trailer (semi-trailer equivalent) freight flow map for all commodities –sample for Victoria. Majority of local and urban roads not shown.
Figure 19. Baseline annual trailer (semi-trailer equivalent) freight flow map for all commodities –sample for south west Western Australia
22 TraNSIT: Unlocking options for efficient logistics infrastructure in Australian agriculture
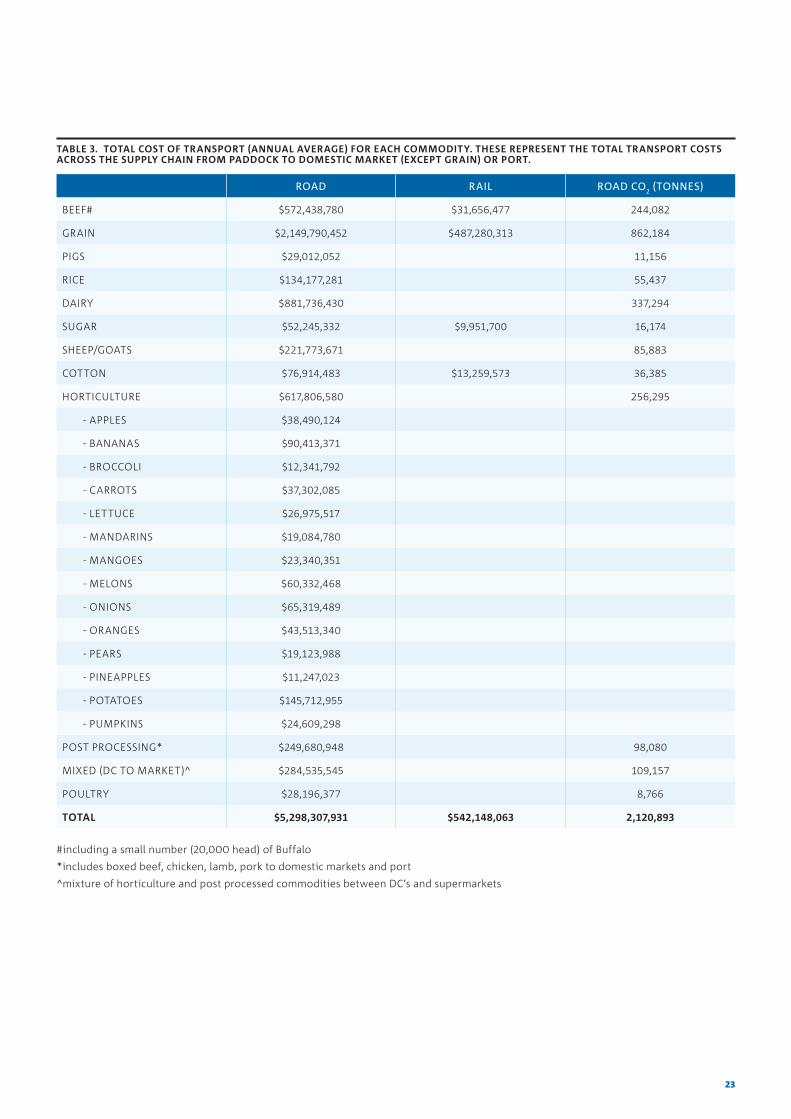
TABLE 3. TOTAL COST OF TRANSPORT (ANNUAL AVERAGE) FOR EACH COMMODITY. THESE REPRESENT THE TOTAL TRANSPORT COSTS ACROSS THE SUPPLY CHAIN FROM PADDOCK TO DOMESTIC MARKET (EXCEPT GRAIN) OR PORT.
ROAD RAIL ROAD CO2 (TONNES)
BEEF# $572,438,780 $31,656,477 244,082
GRAIN $2,149,790,452 $487,280,313 862,184
PIGS $29,012,052 11,156
RICE $134,177,281 55,437
DAIRY $881,736,430 337,294
SUGAR $52,245,332 $9,951,700 16,174
SHEEP/GOATS $221,773,671 85,883
COTTON $76,914,483 $13,259,573 36,385
HORTICULTURE $617,806,580 256,295
- APPLES $38,490,124
- BANANAS $90,413,371
- BROCCOLI $12,341,792
- CARROTS $37,302,085
- LETTUCE $26,975,517
- MANDARINS $19,084,780
- MANGOES $23,340,351
- MELONS $60,332,468
- ONIONS $65,319,489
- ORANGES $43,513,340
- PEARS $19,123,988
- PINEAPPLES $11,247,023
- POTATOES $145,712,955
- PUMPKINS $24,609,298
POST PROCESSING* $249,680,948 98,080
MIXED (DC TO MARKET)^ $284,535,545 109,157
POULTRY $28,196,377 8,766
TOTAL $5,298,307,931 $542,148,063 2,120,893
#including a small number (20,000 head) of Buffalo
*includes boxed beef, chicken, lamb, pork to domestic markets and port
^mixture of horticulture and post processed commodities between DC’s and supermarkets
23
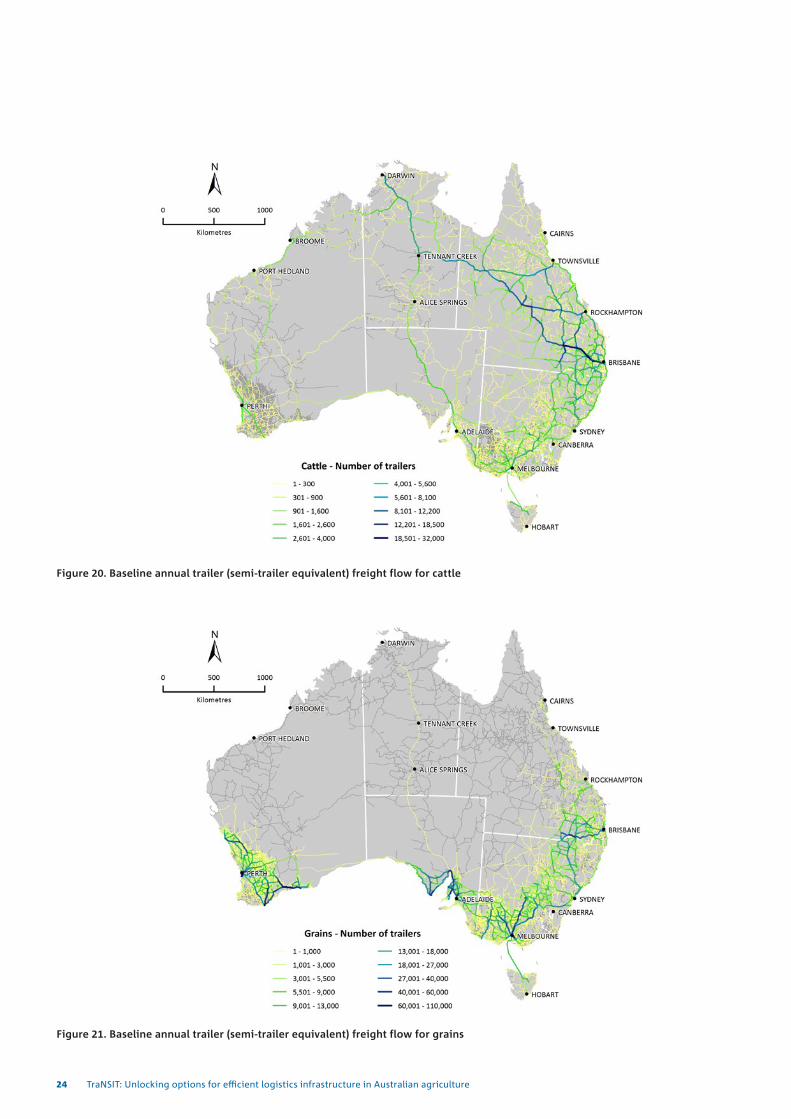
Figure 20. Baseline annual trailer (semi-trailer equivalent) freight flow for cattle
Figure 21. Baseline annual trailer (semi-trailer equivalent) freight flow for grains
24 TraNSIT: Unlocking options for efficient logistics infrastructure in Australian agriculture
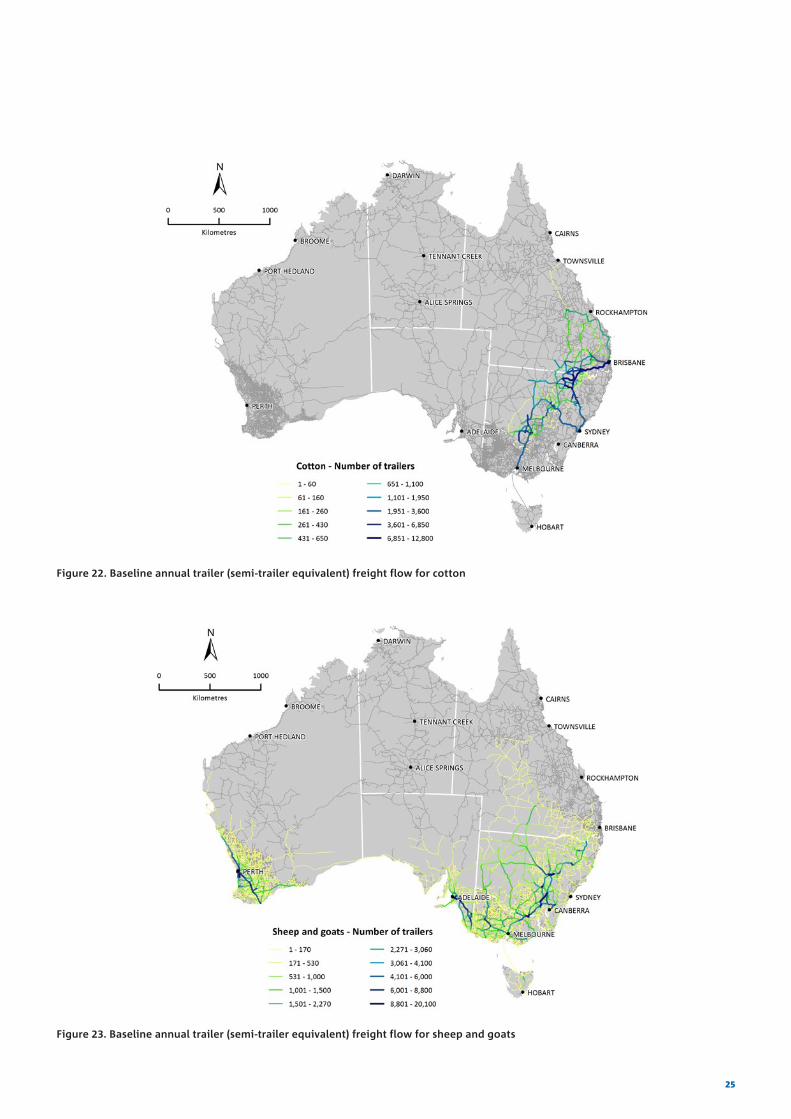
Figure 22. Baseline annual trailer (semi-trailer equivalent) freight flow for cotton
Figure 23. Baseline annual trailer (semi-trailer equivalent) freight flow for sheep and goats
25
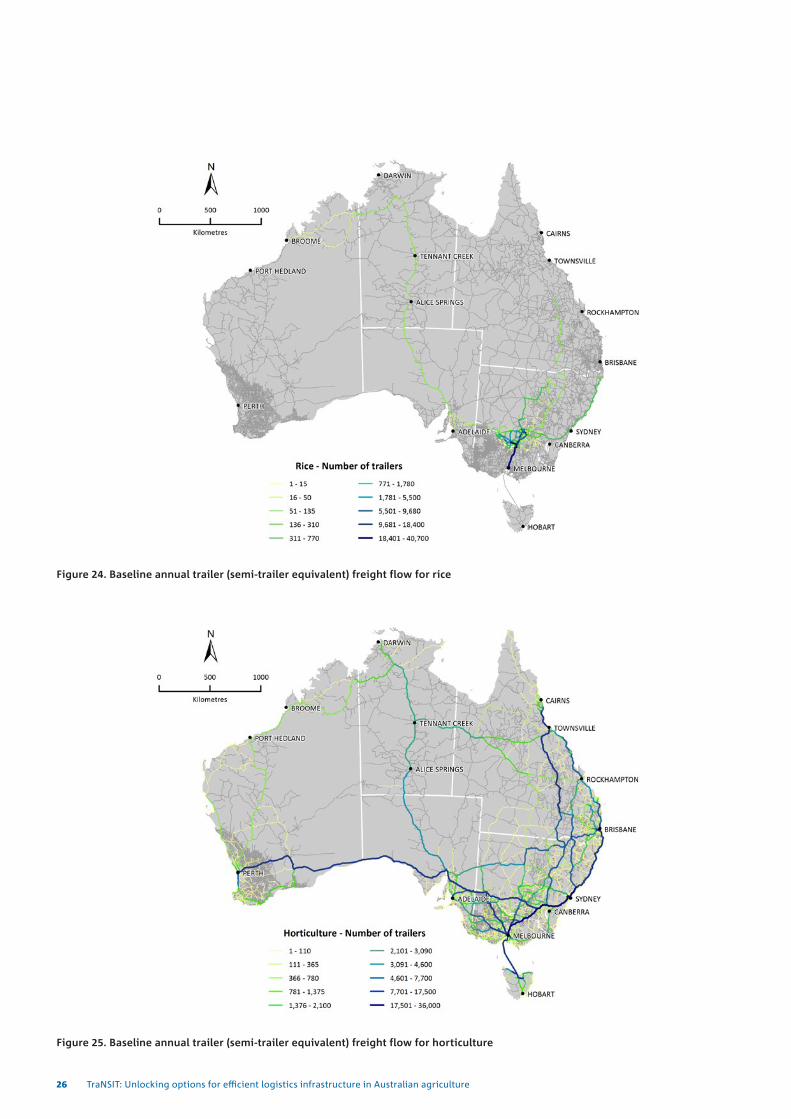
Figure 24. Baseline annual trailer (semi-trailer equivalent) freight flow for rice
Figure 25. Baseline annual trailer (semi-trailer equivalent) freight flow for horticulture
26 TraNSIT: Unlocking options for efficient logistics infrastructure in Australian agriculture
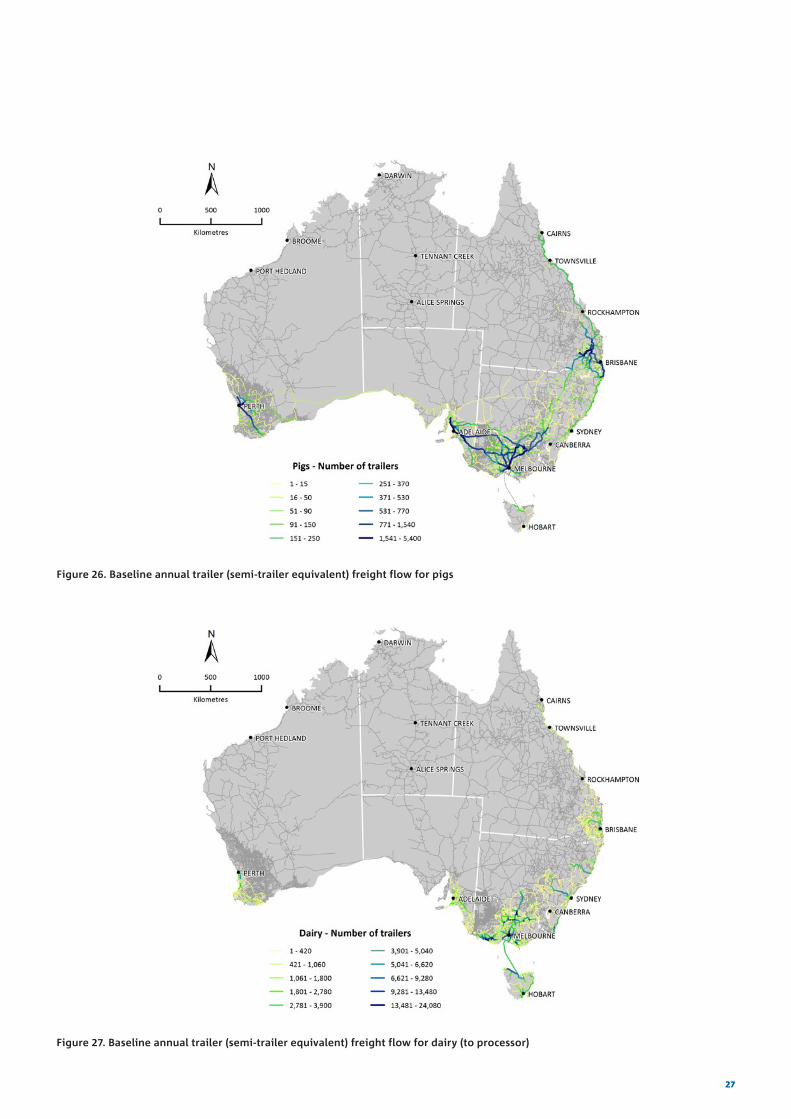
Figure 26. Baseline annual trailer (semi-trailer equivalent) freight flow for pigs
Figure 27. Baseline annual trailer (semi-trailer equivalent) freight flow for dairy (to processor)
27

Figure 28. Baseline annual trailer (semi-trailer equivalent) freight flow for poultry (growing farm to processing plant)
Figure 29. Baseline annual trailer (semi-trailer equivalent) freight flow for processor to supermarkets – beef, lamb, poultry, pork, milk, cheese
28 TraNSIT: Unlocking options for efficient logistics infrastructure in Australian agriculture

Figure 30 to Figure 39 show the breakdown of transport costs (total and per head of tonne) for each commodity. For each commodity with retail chain components, a single cost is shown for the trips to DC’s and supermarkets. Where both rail and road is used, these costs are shown separately. For cattle (Figure 30) and other live animal movements, the cost per head will be substantially less than the cost per tonne of harvested crop and processed meat. For example, a semi-trailer has a capacity of 40 cattle for slaughter (or 60 cattle to live export) or about 28 tonnes of grain. In Figure 30 the cost of transporting cattle to abattoirs is particularly high compared to road. This is partly due to the long distance of travel from rail loading points to abattoirs in south east Queensland, and the low number of cattle (20) that a rail wagon can cart. Cost of transport for live export is the addition of the cost from property to export depot and export depot to port ($21.98m or $29.31 per head). For grains (Figure 31), the average cost per tonne of transporting grains from farm to up-country storage is significantly less than the cost to ports and domestic markets. This is due to the shorter distances to storage and roads to domestic markets and some ports limited to Performance Based Standard (PBS) Level 2A (B-Double) access. Cost of transporting grains to feedlots or feed mills largely depends on crop size in that region. The large 2016 grain harvest was used for the east coast of Australia, which reduced the transport distance to source grain for feedlots, feed mills and domestic markets. Cost per tonne of transporting cotton (Figure 32) is high compared to other commodities due to the low bulk density. For dairy (Figure 33) the cost of transport from farm to processor was significantly less than the cost to DC’s and supermarkets. The main reason is the long distances between processing and markets and the disproportionate production versus consumption in each stage. Victoria has over 60% of Australia’s milk production,
leading to large volumes of milk being transported between states to meet domestic demand. This is unlike poultry (Figure 39) where production is closer to the major cities and production volumes in each state is closer aligned to consumption. For pork (Figure 34) the transport of pigs to export accredited abattoirs is higher than domestic abattoirs, since there are significantly fewer of them. They also have much higher annual throughputs and need to source pigs from longer distances. For sugar (Figure 35) the cost of transporting sugarcane by road to the mill is low compared to other commodities though it represents over 20% of the total cost of production (farming and milling costs). Rice (Figure 36) has a similar pattern of costs as dairy. Rice is predominately grown in southern NSW but needs to be transported to retail outlets across Australian, leading to long average distances of transport and high costs per tonne. Horticulture also has high transport costs per tonne (Figure 37) due to the production often being very long distances to major markets (e.g. bananas predominately grown in north Queensland). The analysis assumed consumption per capita was consistent across Australia, regardless of the location of production. This may not be the case for some horticulture, where urban areas closer to production have greater market access.
Outputs can also be disaggregated by road segment to show vehicle numbers by commodity or vehicle type including direction. Figure 40 is an example for the Newell Highway from Goondiwindi south. Road segments in the GIS network are not equal length. The significant changes in vehicle numbers between some road segments (e.g. south of Goondiwindi or at Narrandera) is due to major highway intersections where vehicles will turn off or enter the Newell Highway.
29
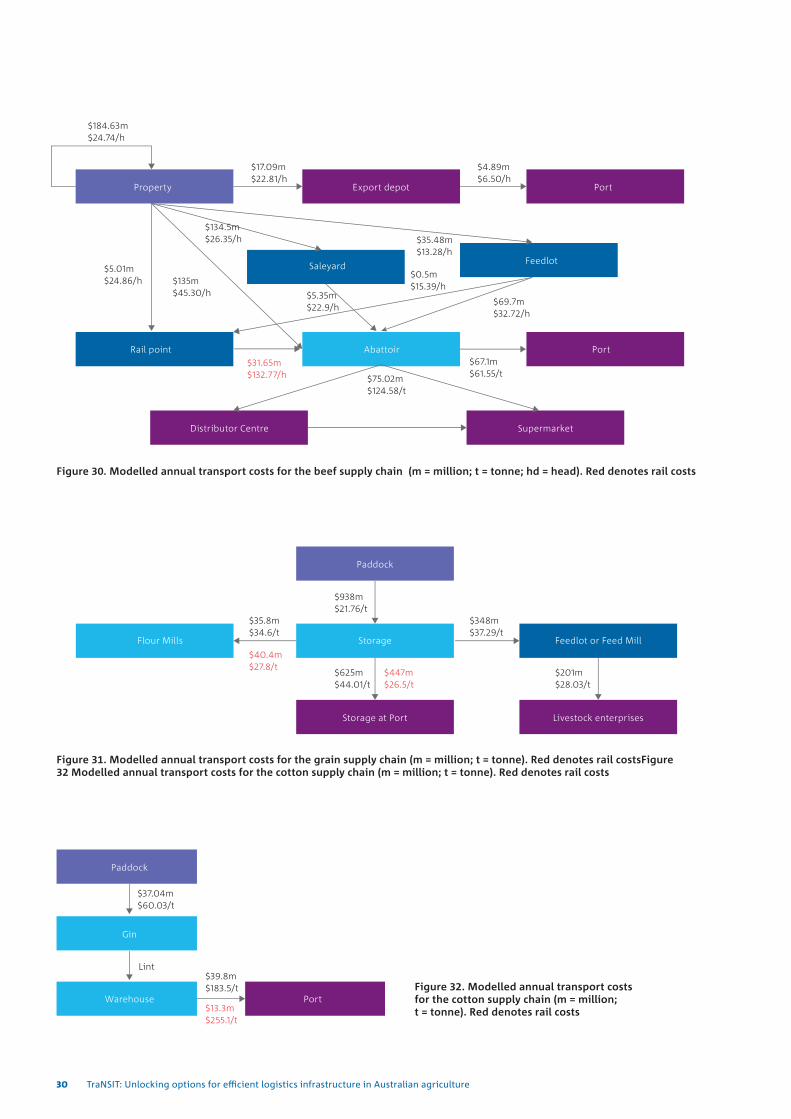
Figure 30. Modelled annual transport costs for the beef supply chain (m = million; t = tonne; hd = head). Red denotes rail costs
Figure 31. Modelled annual transport costs for the grain supply chain (m = million; t = tonne). Red denotes rail costsFigure 32 Modelled annual transport costs for the cotton supply chain (m = million; t = tonne). Red denotes rail costs
Storage
Figure 32. Modelled annual transport costs for the cotton supply chain (m = million; t = tonne). Red denotes rail costs
30 TraNSIT: Unlocking options for efficient logistics infrastructure in Australian agriculture
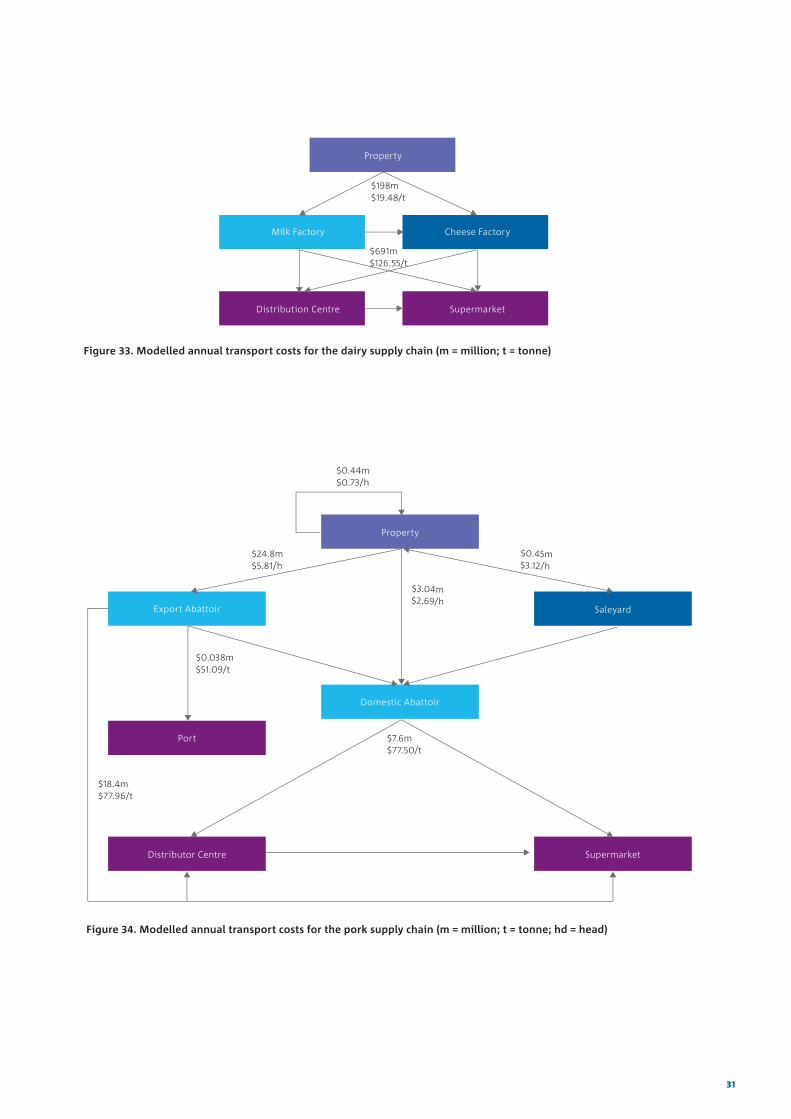
Figure 33. Modelled annual transport costs for the dairy supply chain (m = million; t = tonne)
Figure 34. Modelled annual transport costs for the pork supply chain (m = million; t = tonne; hd = head)
31
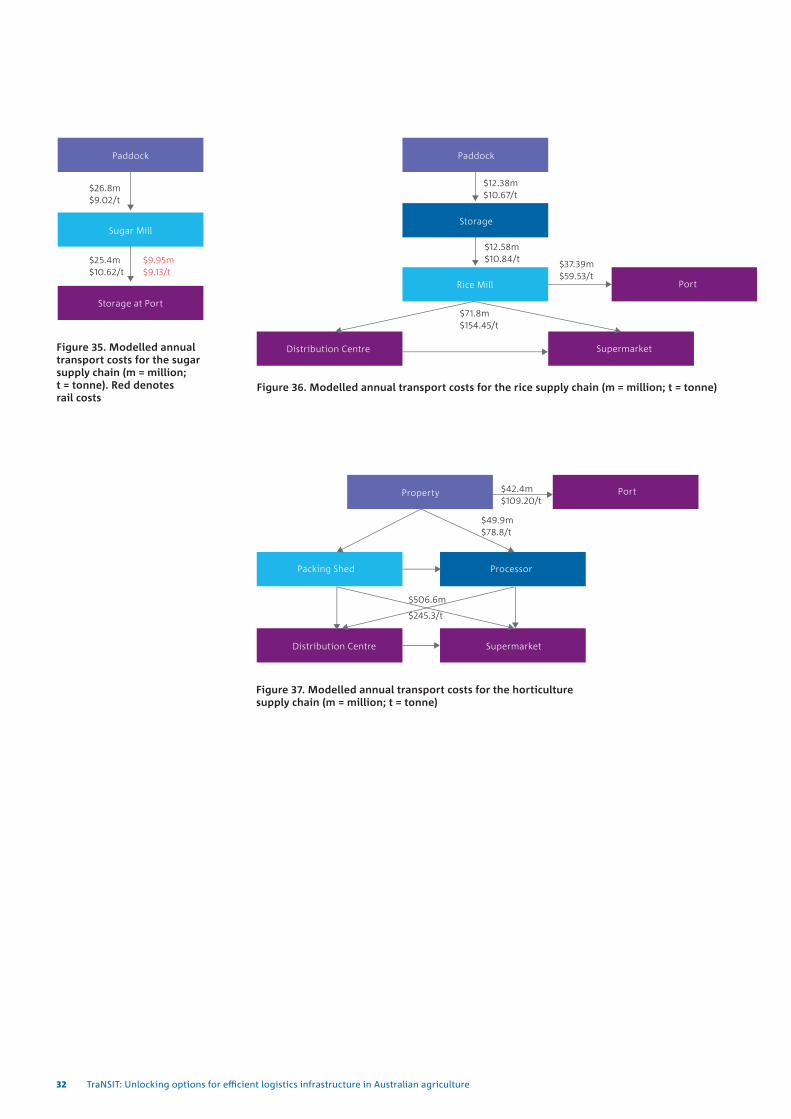
Figure 35. Modelled annual transport costs for the sugar supply chain (m = million; t = tonne). Red denotes rail costs
Figure 36. Modelled annual transport costs for the rice supply chain (m = million; t = tonne)
Storage
Figure 37. Modelled annual transport costs for the horticulture supply chain (m = million; t = tonne)
32 TraNSIT: Unlocking options for efficient logistics infrastructure in Australian agriculture
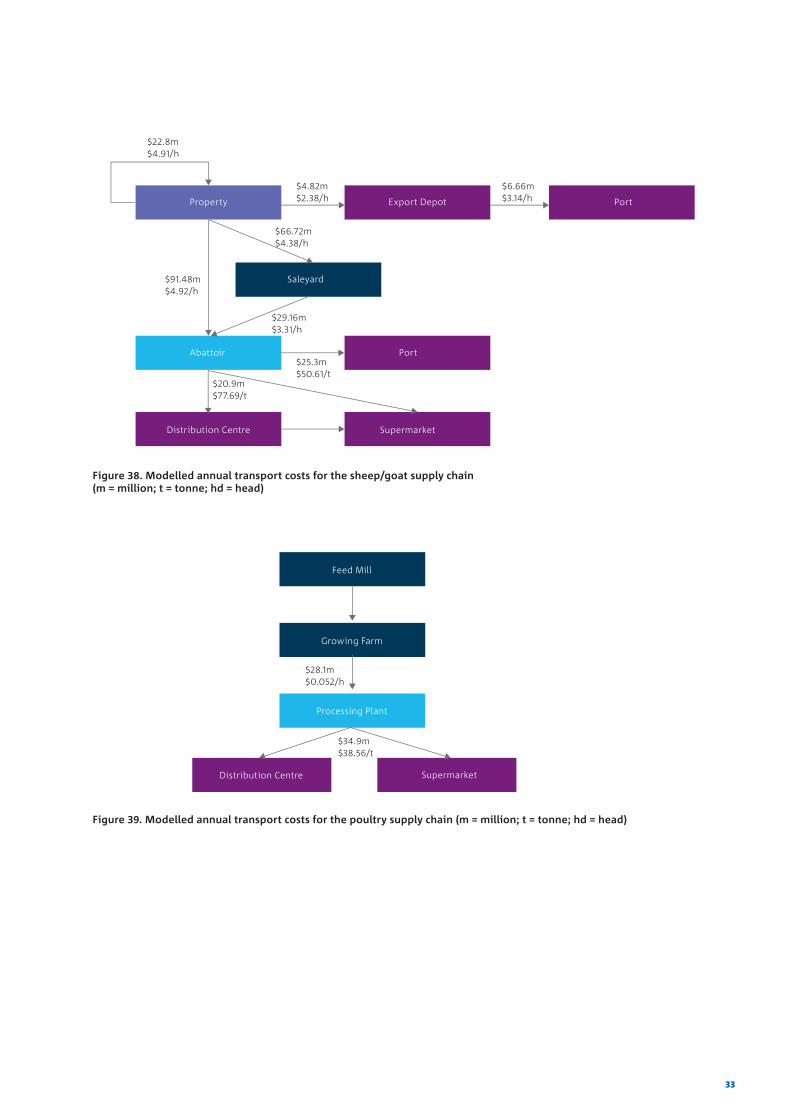
Figure 38. Modelled annual transport costs for the sheep/goat supply chain (m = million; t = tonne; hd = head)
Figure 39. Modelled annual transport costs for the poultry supply chain (m = million; t = tonne; hd = head)
33
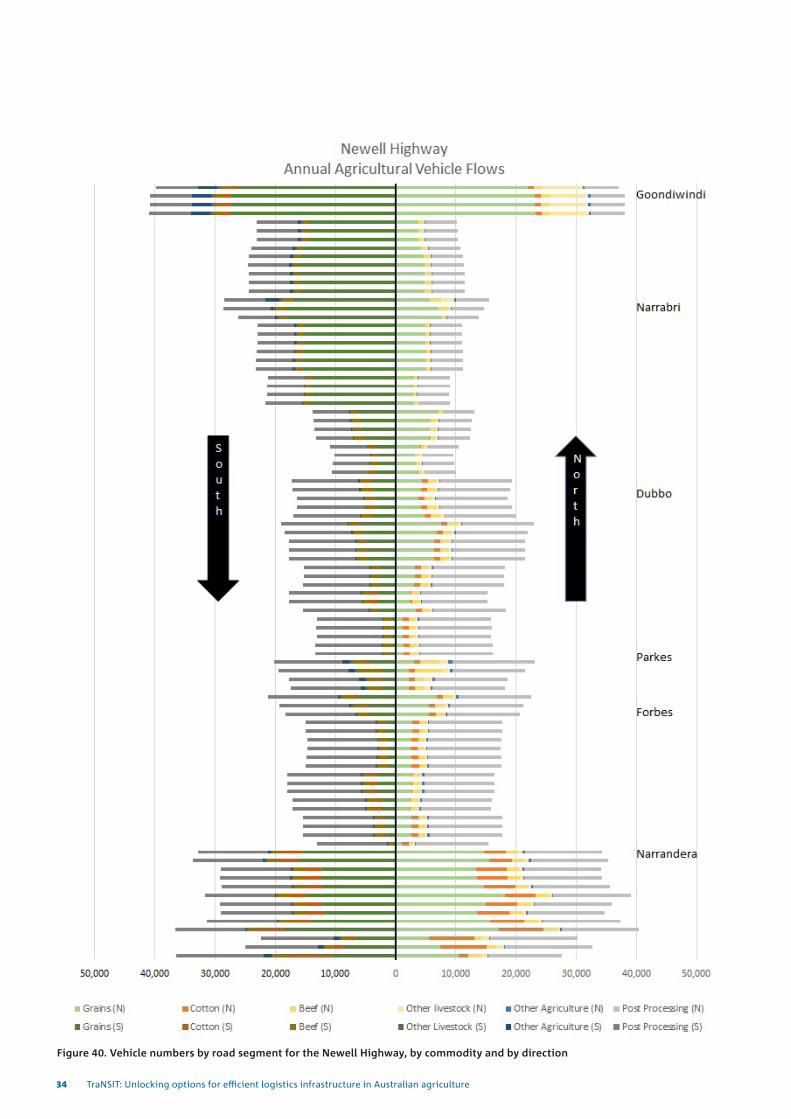
Figure 40. Vehicle numbers by road segment for the Newell Highway, by commodity and by direction
34 TraNSIT: Unlocking options for efficient logistics infrastructure in Australian agriculture
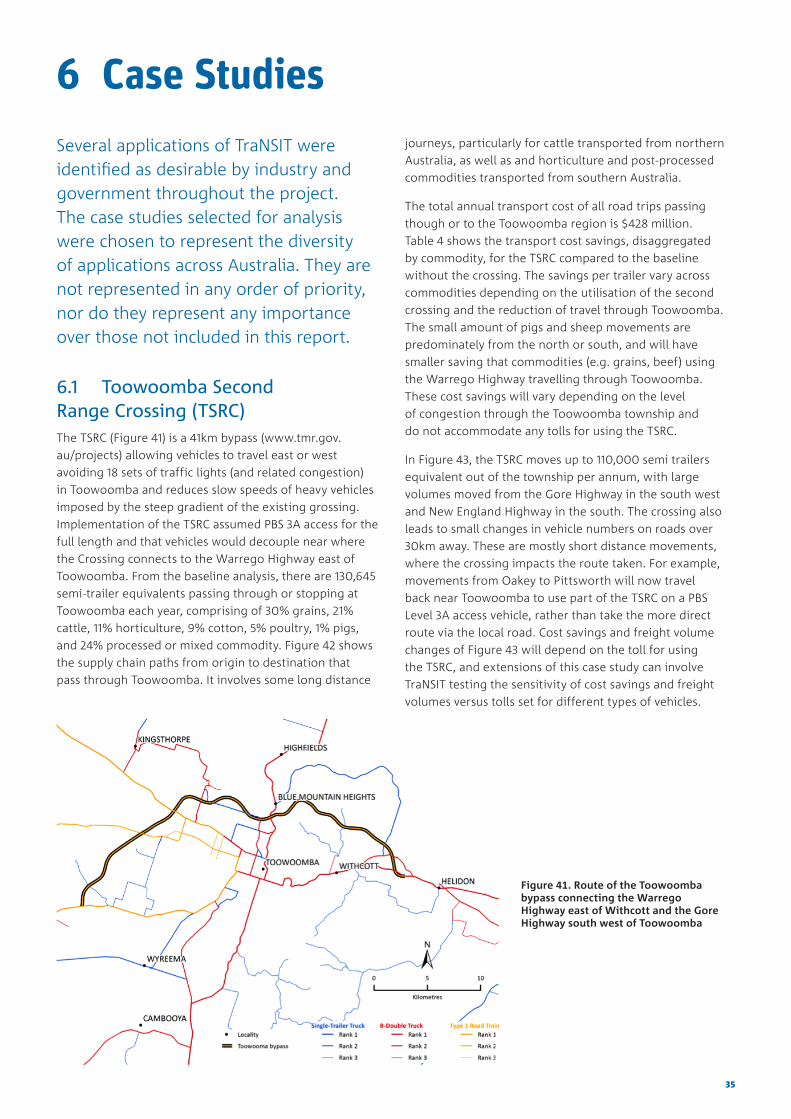
6 Case StudiesSeveral applications of TraNSIT were identified as desirable by industry and government throughout the project. The case studies selected for analysis were chosen to represent the diversity of applications across Australia. They are not represented in any order of priority, nor do they represent any importance over those not included in this report.
6.1 Toowoomba Second Range Crossing (TSRC)The TSRC (Figure 41) is a 41km bypass (www.tmr.gov.au/projects) allowing vehicles to travel east or west avoiding 18 sets of traffic lights (and related congestion) in Toowoomba and reduces slow speeds of heavy vehicles imposed by the steep gradient of the existing grossing. Implementation of the TSRC assumed PBS 3A access for the full length and that vehicles would decouple near where the Crossing connects to the Warrego Highway east of Toowoomba. From the baseline analysis, there are 130,645 semi-trailer equivalents passing through or stopping at Toowoomba each year, comprising of 30% grains, 21% cattle, 11% horticulture, 9% cotton, 5% poultry, 1% pigs, and 24% processed or mixed commodity. Figure 42 shows the supply chain paths from origin to destination that pass through Toowoomba. It involves some long distance
journeys, particularly for cattle transported from northern Australia, as well as and horticulture and post-processed commodities transported from southern Australia.
The total annual transport cost of all road trips passing though or to the Toowoomba region is $428 million. Table 4 shows the transport cost savings, disaggregated by commodity, for the TSRC compared to the baseline without the crossing. The savings per trailer vary across commodities depending on the utilisation of the second crossing and the reduction of travel through Toowoomba. The small amount of pigs and sheep movements are predominately from the north or south, and will have smaller saving that commodities (e.g. grains, beef) using the Warrego Highway travelling through Toowoomba. These cost savings will vary depending on the level of congestion through the Toowoomba township and do not accommodate any tolls for using the TSRC.
In Figure 43, the TSRC moves up to 110,000 semi trailers equivalent out of the township per annum, with large volumes moved from the Gore Highway in the south west and New England Highway in the south. The crossing also leads to small changes in vehicle numbers on roads over 30km away. These are mostly short distance movements, where the crossing impacts the route taken. For example, movements from Oakey to Pittsworth will now travel back near Toowoomba to use part of the TSRC on a PBS Level 3A access vehicle, rather than take the more direct route via the local road. Cost savings and freight volume changes of Figure 43 will depend on the toll for using the TSRC, and extensions of this case study can involve TraNSIT testing the sensitivity of cost savings and freight volumes versus tolls set for different types of vehicles.
Figure 41. Route of the Toowoomba bypass connecting the Warrego Highway east of Withcott and the Gore Highway south west of Toowoomba
35

Figure 42. Map of supply chain paths passing through Toowoomba –includes east and westbound movements
TABLE 4. ANNUAL TRANSPORT COST SAVINGS FOR AGRICULTURE TRAVELLING THROUGH TOOWOOMBA AFTER CONSTRUCTION OF THE SECOND TOOWOOMBA RANGE CROSSING. SAVINGS INCLUDE RETURN TRIP OF EMPTY TRAILERS UNLESS SPECIFIED.
COMMODITY TOTAL SAVINGS SEMI-TRAILER EQUIVALENTS (FULL
LOADS)
SAVINGS PER TRAILER (ONE WAY)
SAVINGS PER TONNE OR HEAD
TRANSPORTED
BEEF $1,694,400 27,385 $30.94 $1.55
CHICKEN $1,137 5,914 $0.10 $0.00
COTTON $432,253 10,507 $20.57 $4.78
DAIRY $16,306 540 $15.10 $1.32
GRAINS $1,501,357 39,483 $19.02 $1.41
HORTICULTURE $522,185 13,575 $19.24 $1.54
PIGS $25,756 1,212 $10.63 $0.11
POST-PROCESSED $1,206,992 31,759 $19.00 $1.90
SHEEP/GOAT $2,591 270 $4.80 $0.05
TOTAL $5,402,976 130,645 $20.68
36 TraNSIT: Unlocking options for efficient logistics infrastructure in Australian agriculture
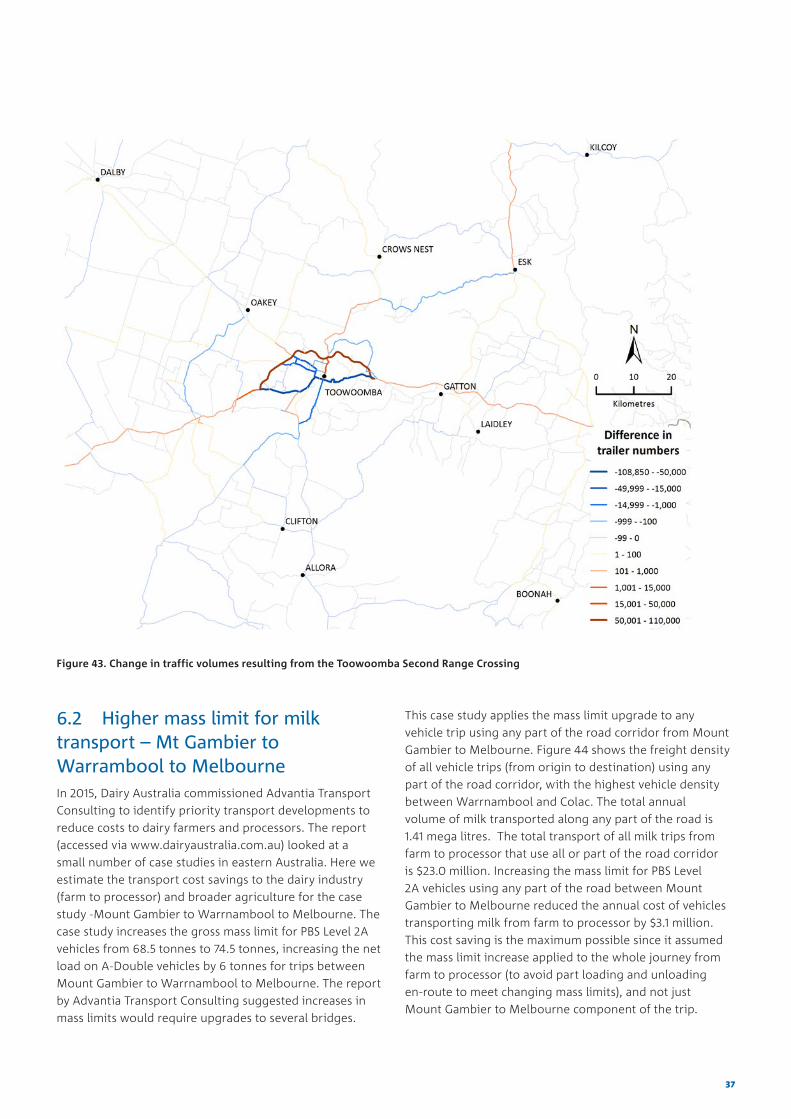
Figure 43. Change in traffic volumes resulting from the Toowoomba Second Range Crossing
6.2 Higher mass limit for milk transport – Mt Gambier to Warrambool to MelbourneIn 2015, Dairy Australia commissioned Advantia Transport Consulting to identify priority transport developments to reduce costs to dairy farmers and processors. The report (accessed via www.dairyaustralia.com.au) looked at a small number of case studies in eastern Australia. Here we estimate the transport cost savings to the dairy industry (farm to processor) and broader agriculture for the case study -Mount Gambier to Warrnambool to Melbourne. The case study increases the gross mass limit for PBS Level 2A vehicles from 68.5 tonnes to 74.5 tonnes, increasing the net load on A-Double vehicles by 6 tonnes for trips between Mount Gambier to Warrnambool to Melbourne. The report by Advantia Transport Consulting suggested increases in mass limits would require upgrades to several bridges.
This case study applies the mass limit upgrade to any vehicle trip using any part of the road corridor from Mount Gambier to Melbourne. Figure 44 shows the freight density of all vehicle trips (from origin to destination) using any part of the road corridor, with the highest vehicle density between Warrnambool and Colac. The total annual volume of milk transported along any part of the road is 1.41 mega litres. The total transport of all milk trips from farm to processor that use all or part of the road corridor is $23.0 million. Increasing the mass limit for PBS Level 2A vehicles using any part of the road between Mount Gambier to Melbourne reduced the annual cost of vehicles transporting milk from farm to processor by $3.1 million. This cost saving is the maximum possible since it assumed the mass limit increase applied to the whole journey from farm to processor (to avoid part loading and unloading en-route to meet changing mass limits), and not just Mount Gambier to Melbourne component of the trip.
37
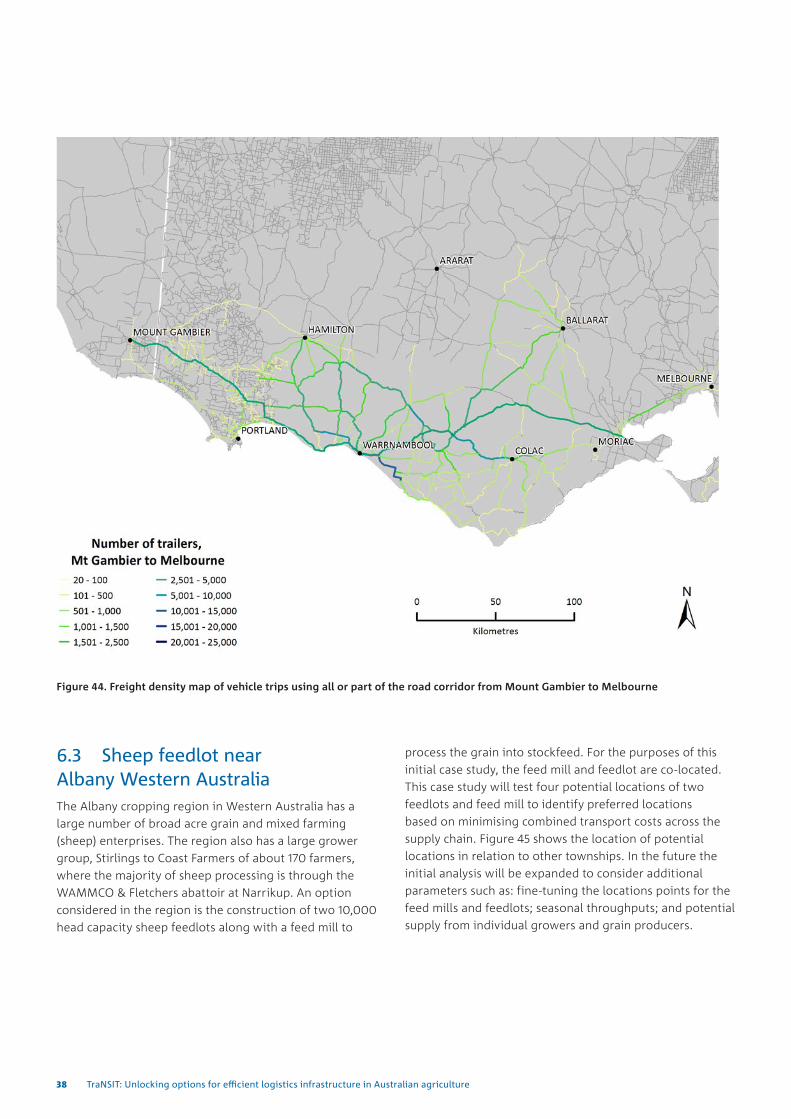
Figure 44. Freight density map of vehicle trips using all or part of the road corridor from Mount Gambier to Melbourne
6.3 Sheep feedlot near Albany Western AustraliaThe Albany cropping region in Western Australia has a large number of broad acre grain and mixed farming (sheep) enterprises. The region also has a large grower group, Stirlings to Coast Farmers of about 170 farmers, where the majority of sheep processing is through the WAMMCO & Fletchers abattoir at Narrikup. An option considered in the region is the construction of two 10,000 head capacity sheep feedlots along with a feed mill to
process the grain into stockfeed. For the purposes of this initial case study, the feed mill and feedlot are co-located. This case study will test four potential locations of two feedlots and feed mill to identify preferred locations based on minimising combined transport costs across the supply chain. Figure 45 shows the location of potential locations in relation to other townships. In the future the initial analysis will be expanded to consider additional parameters such as: fine-tuning the locations points for the feed mills and feedlots; seasonal throughputs; and potential supply from individual growers and grain producers.
38 TraNSIT: Unlocking options for efficient logistics infrastructure in Australian agriculture
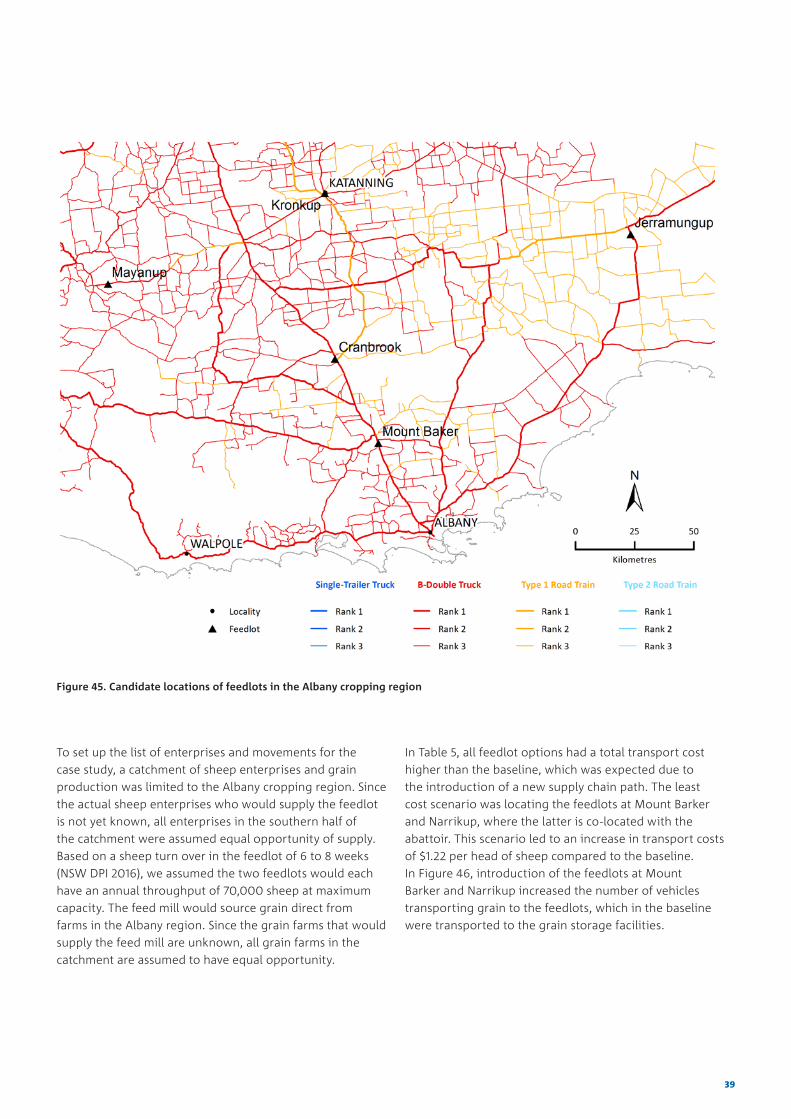
Figure 45. Candidate locations of feedlots in the Albany cropping region
To set up the list of enterprises and movements for the case study, a catchment of sheep enterprises and grain production was limited to the Albany cropping region. Since the actual sheep enterprises who would supply the feedlot is not yet known, all enterprises in the southern half of the catchment were assumed equal opportunity of supply. Based on a sheep turn over in the feedlot of 6 to 8 weeks (NSW DPI 2016), we assumed the two feedlots would each have an annual throughput of 70,000 sheep at maximum capacity. The feed mill would source grain direct from farms in the Albany region. Since the grain farms that would supply the feed mill are unknown, all grain farms in the catchment are assumed to have equal opportunity.
In Table 5, all feedlot options had a total transport cost higher than the baseline, which was expected due to the introduction of a new supply chain path. The least cost scenario was locating the feedlots at Mount Barker and Narrikup, where the latter is co-located with the abattoir. This scenario led to an increase in transport costs of $1.22 per head of sheep compared to the baseline. In Figure 46, introduction of the feedlots at Mount Barker and Narrikup increased the number of vehicles transporting grain to the feedlots, which in the baseline were transported to the grain storage facilities.
39
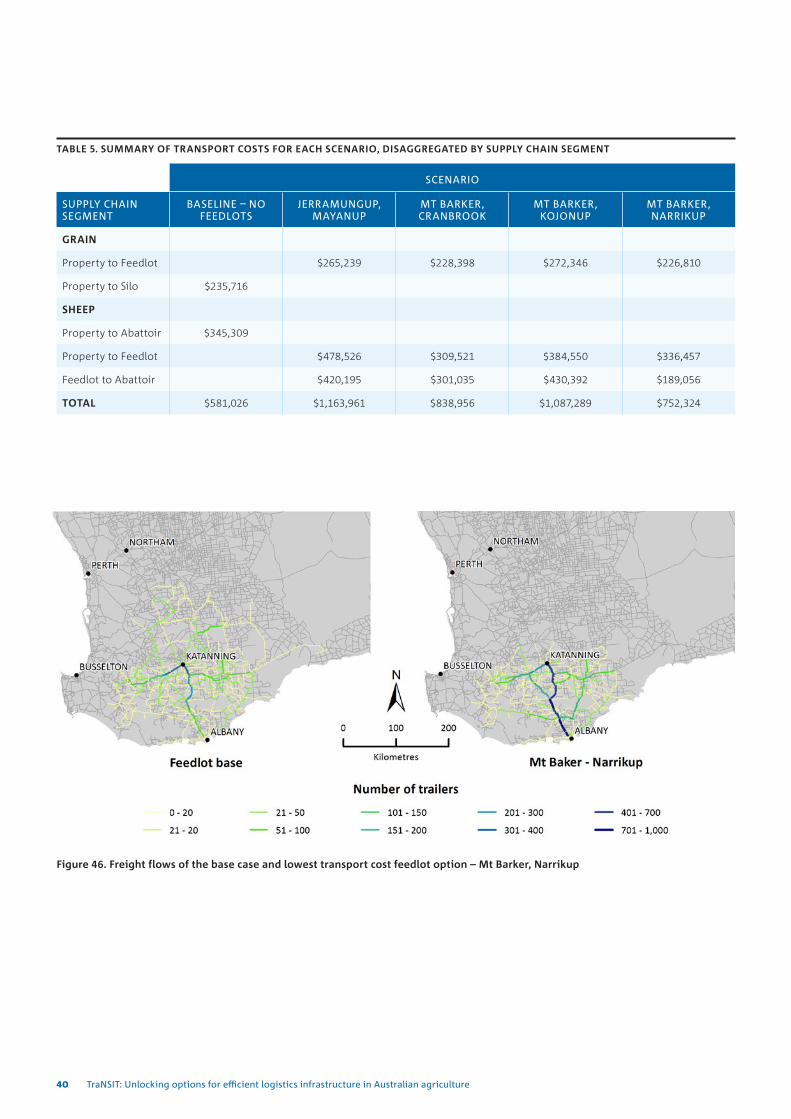
TABLE 5. SUMMARY OF TRANSPORT COSTS FOR EACH SCENARIO, DISAGGREGATED BY SUPPLY CHAIN SEGMENT
SCENARIO
SUPPLY CHAIN SEGMENT
BASELINE – NO FEEDLOTS
JERRAMUNGUP, MAYANUP
MT BARKER, CRANBROOK
MT BARKER, KOJONUP
MT BARKER, NARRIKUP
GRAIN
Property to Feedlot $265,239 $228,398 $272,346 $226,810
Property to Silo $235,716
SHEEP
Property to Abattoir $345,309
Property to Feedlot $478,526 $309,521 $384,550 $336,457
Feedlot to Abattoir $420,195 $301,035 $430,392 $189,056
TOTAL $581,026 $1,163,961 $838,956 $1,087,289 $752,324
Figure 46. Freight flows of the base case and lowest transport cost feedlot option – Mt Barker, Narrikup
40 TraNSIT: Unlocking options for efficient logistics infrastructure in Australian agriculture
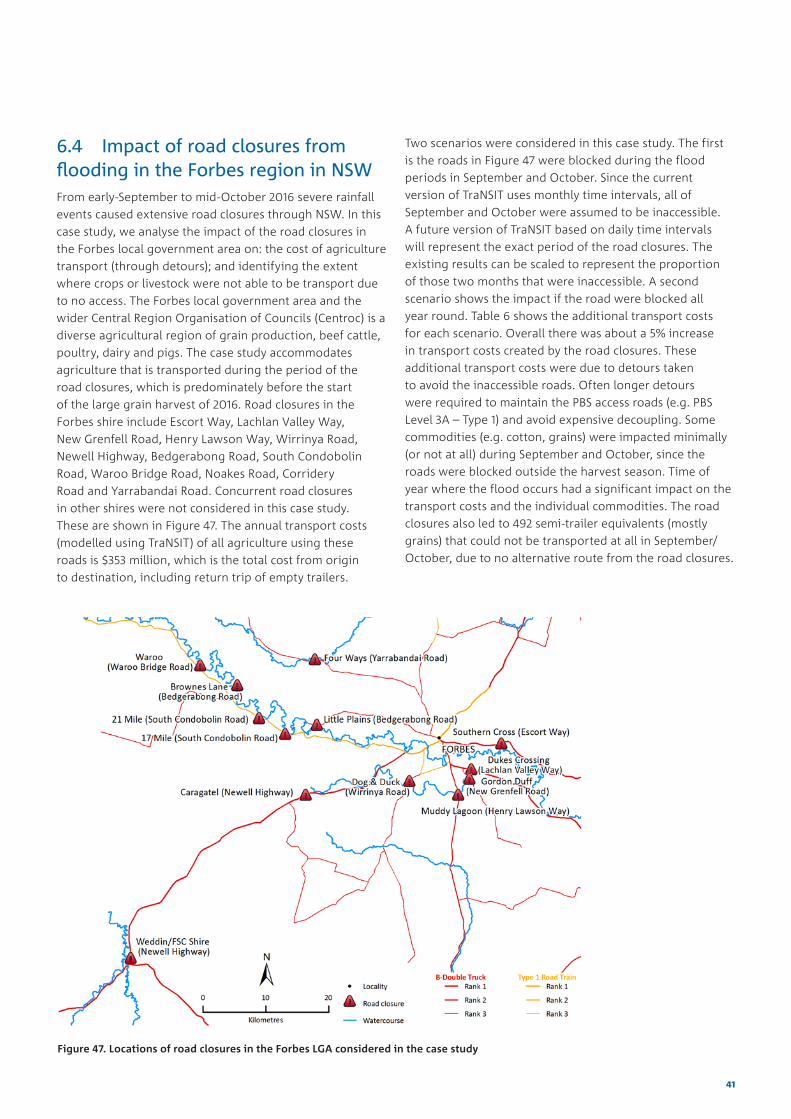
6.4 Impact of road closures from flooding in the Forbes region in NSWFrom early-September to mid-October 2016 severe rainfall events caused extensive road closures through NSW. In this case study, we analyse the impact of the road closures in the Forbes local government area on: the cost of agriculture transport (through detours); and identifying the extent where crops or livestock were not able to be transport due to no access. The Forbes local government area and the wider Central Region Organisation of Councils (Centroc) is a diverse agricultural region of grain production, beef cattle, poultry, dairy and pigs. The case study accommodates agriculture that is transported during the period of the road closures, which is predominately before the start of the large grain harvest of 2016. Road closures in the Forbes shire include Escort Way, Lachlan Valley Way, New Grenfell Road, Henry Lawson Way, Wirrinya Road, Newell Highway, Bedgerabong Road, South Condobolin Road, Waroo Bridge Road, Noakes Road, Corridery Road and Yarrabandai Road. Concurrent road closures in other shires were not considered in this case study. These are shown in Figure 47. The annual transport costs (modelled using TraNSIT) of all agriculture using these roads is $353 million, which is the total cost from origin to destination, including return trip of empty trailers.
Two scenarios were considered in this case study. The first is the roads in Figure 47 were blocked during the flood periods in September and October. Since the current version of TraNSIT uses monthly time intervals, all of September and October were assumed to be inaccessible. A future version of TraNSIT based on daily time intervals will represent the exact period of the road closures. The existing results can be scaled to represent the proportion of those two months that were inaccessible. A second scenario shows the impact if the road were blocked all year round. Table 6 shows the additional transport costs for each scenario. Overall there was about a 5% increase in transport costs created by the road closures. These additional transport costs were due to detours taken to avoid the inaccessible roads. Often longer detours were required to maintain the PBS access roads (e.g. PBS Level 3A – Type 1) and avoid expensive decoupling. Some commodities (e.g. cotton, grains) were impacted minimally (or not at all) during September and October, since the roads were blocked outside the harvest season. Time of year where the flood occurs had a significant impact on the transport costs and the individual commodities. The road closures also led to 492 semi-trailer equivalents (mostly grains) that could not be transported at all in September/October, due to no alternative route from the road closures.
Figure 47. Locations of road closures in the Forbes LGA considered in the case study
41
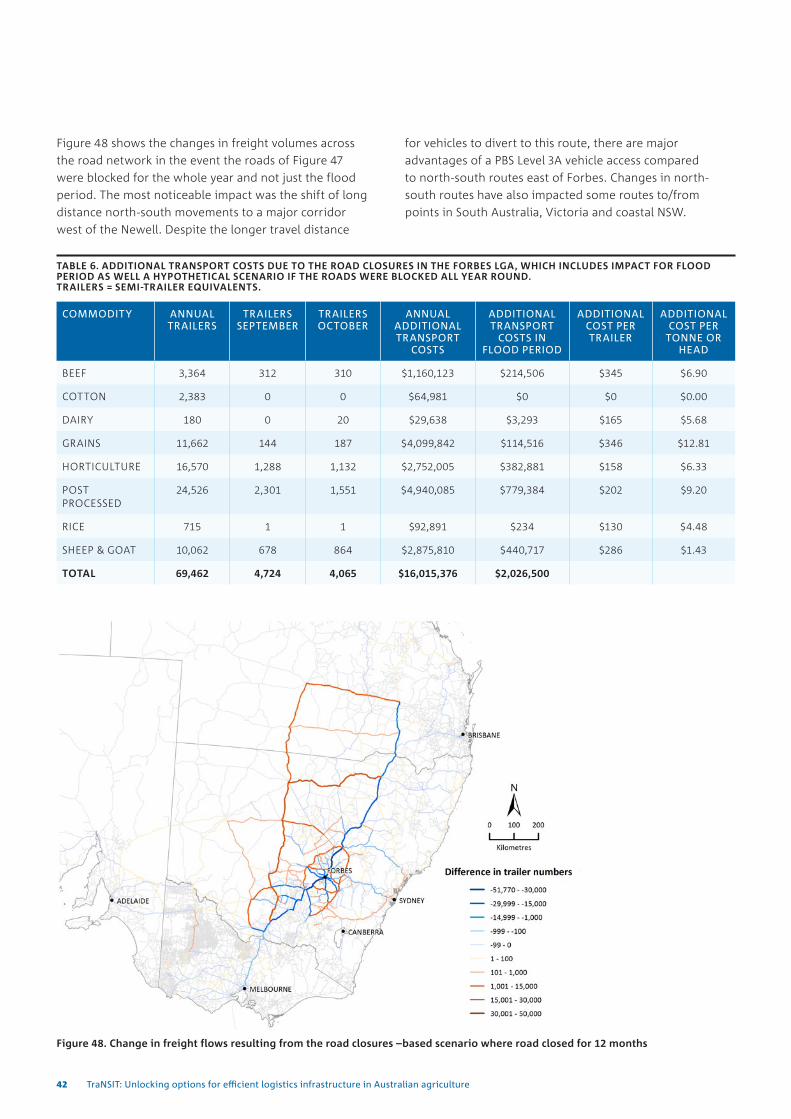
Figure 48. Change in freight flows resulting from the road closures –based scenario where road closed for 12 months
Figure 48 shows the changes in freight volumes across the road network in the event the roads of Figure 47 were blocked for the whole year and not just the flood period. The most noticeable impact was the shift of long distance north-south movements to a major corridor west of the Newell. Despite the longer travel distance
TABLE 6. ADDITIONAL TRANSPORT COSTS DUE TO THE ROAD CLOSURES IN THE FORBES LGA, WHICH INCLUDES IMPACT FOR FLOOD PERIOD AS WELL A HYPOTHETICAL SCENARIO IF THE ROADS WERE BLOCKED ALL YEAR ROUND. TRAILERS = SEMI-TRAILER EQUIVALENTS.
COMMODITY ANNUAL TRAILERS
TRAILERS SEPTEMBER
TRAILERS OCTOBER
ANNUAL ADDITIONAL TRANSPORT
COSTS
ADDITIONAL TRANSPORT
COSTS IN FLOOD PERIOD
ADDITIONAL COST PER TRAILER
ADDITIONAL COST PER
TONNE OR HEAD
BEEF 3,364 312 310 $1,160,123 $214,506 $345 $6.90
COTTON 2,383 0 0 $64,981 $0 $0 $0.00
DAIRY 180 0 20 $29,638 $3,293 $165 $5.68
GRAINS 11,662 144 187 $4,099,842 $114,516 $346 $12.81
HORTICULTURE 16,570 1,288 1,132 $2,752,005 $382,881 $158 $6.33
POST PROCESSED
24,526 2,301 1,551 $4,940,085 $779,384 $202 $9.20
RICE 715 1 1 $92,891 $234 $130 $4.48
SHEEP & GOAT 10,062 678 864 $2,875,810 $440,717 $286 $1.43
TOTAL 69,462 4,724 4,065 $16,015,376 $2,026,500
for vehicles to divert to this route, there are major advantages of a PBS Level 3A vehicle access compared to north-south routes east of Forbes. Changes in north-south routes have also impacted some routes to/from points in South Australia, Victoria and coastal NSW.
42 TraNSIT: Unlocking options for efficient logistics infrastructure in Australian agriculture
6.5 Evaluation of Northern Australian Beef Roads projectsThe $100 million Beef Roads Programme formed part of “Our North, Our Future: White Paper on Developing Northern Australia”. In 2015/2016, TraNSIT informed this Programme by estimating the transport cost savings to the beef industry for each of the 60 road upgrade submissions to the Programme. These were initial submissions from state and local government and industry, and included sealing/widening of unsealed roads, higher productivity vehicle access, last mile bottleneck reductions and reducing flood risks. A report produced by CSIRO (accessed at www.csiro.au/TraNSIT) gives an overview of how TraNSIT was used in the Programme along with application to each submissions. Government (state and local) and industry provided final submissions
to the Programme, with one of the submission criteria being the transport cost savings estimated by TraNSIT. In October 2016, the Australian Government announced the projects funded by the Programme (http://investment.infrastructure.gov.au/funding/NABeef/index.aspx) and the features of these projects are listed in Table 7. Since the total funding from the Australian Government was limited to $100 million, whereas the total construction costs of the initial submissions was over $4 billion, many of the funded projects (particularly in Queensland) were scaled down versions of initial submissions.
In this case study, we estimate the transport cost savings to cattle from the implementation of all packages. For three projects in Table 7, the exact location of the upgrade was not yet confirmed at the time of this report. In such cases, a location was selected with the highest cattle vehicle numbers.
TABLE 7. PROJECTS FUNDED UNDER THE BEEF ROADS PROGRAMME
PROJECT DESCRIPTION
Clermont to Alpha road A 3 package project to seal 16.9km (2 lane) of the road corridor
Burke Development Road – Chillagoe to Almaden A 2 package project to seal 7km of the road corridor
Rockhampton Road Network PBS 3A road access between Gracemere and the Rockhampton abattoirs. Currently limited to PBS 2A (B-Double access)
Ootann Road Sealing of 7.8km between Almanden and Kennedy Highway.
Gregory Development Road Widening of 8.5km between Belyando Crossing and Collinsville
Richmond to Croydon Road A 2 package project to seal 15km segment
Cloncurry to Dajarra Road Sealing of a 4.5km segment
Diamantina Developmental Road Widening and rehabilitating 11.5 segment
Richmond to Winton Road A 2 package project to seal 9.5km of unsealed segments
Barkley Stock Route (as per modelled) Widening and upgrading of the road
Tableland Highway (as per modelled Sealing parts of the Tableland Highway
Great Northern Highway (as per modelled) Reconstruction, realignment and installation of passing lanes between Ord and Turkey Creek
Implementation of the road projects of Table 7 led to an annual transport cost saving of $957,616, though $738,919 of those savings were from the PBS Level 3A road access upgrade between Gracemere and the Rockhampton abattoirs. The remainder projects led to a $218,597 annual savings, across 440,400 cattle transported across those road segments per year, with an average saving of $0.50 per head of cattle. Road projects of Table 7 had minimal benefits to other agriculture transport. Some road upgrade
scenarios will create additional benefits, which the current version of TraNSIT does not show. These include:
• reduced slow down and acceleration from passing on narrow roads, as well as less congestion
• increased road safety for all road users, and increased health and safety for drivers
• improved animal welfare from reduced travel on unsealed roads
• reduced dust
43

6.6 Type 2 upgrade from Barringun Qld to Nyngan NSW The National Heavy Vehicle Regulator (NHVR) established the National Harmonisation Program in October 2016 to drive progress towards improving heavy vehicle regulation consistency. As part of this program of work, the NHVR is leading a comprehensive review and redesign of the National Class 2 Heavy Vehicle Road Train Authorisation Notice. The aim is to develop a nationally harmonised notice by producing standardised definitions and categorisation of road train configurations. The NHVR will also examine road train access inconsistencies across state and territory borders. During initial consultation, the NHVR received feedback from transport operators on restricted Type 2 road train access into NSW. Currently, the road from Barringun to North Burke is limited to Type 1 vehicles and for specific combinations of Type 2 (including A-Triple), with other Type 2 (PBS Level 4A) road trains travelling south from Queensland needing to decouple at Barringun. From Burke to Dubbo, via Nyngan, access is restricted to Type 1 (PBS Level 3A) vehicles. Upgrading the road to all PBS Level 4A vehicle combinations will provide greater road train access to freight corridors at the intersection of the Barrier Highway (linking NSW with South Australia), and
to grain storage near Nyngan. Beyond agriculture, the upgrade would reduce the significant operational and financial burden for long haul operators transporting from Darwin to Sydney. Figure 49 shows a freight density map of the agricultural supply chains using the road between Barringun to Dubbo. The section between Nyngan and Dubbo has a much higher utilisation than north of Nyngan, and caters for trips in and out of the neighbouring states. From the TraNSIT baseline analysis, a total of 16,761 semi-trailer equivalents used the road between Barringun and Nyngan per annum, with 33% of the trips carrying sheep, 30% grains, 13% beef, 11% cotton, and 11% post processed commodities. Upgrading the road to PBS Level 4A (Type 2), reduced the annual transport costs by $192,372 per annum, and 2,969 of the 16,761 semi-trailer equivalents received a reduction in transport costs (average $64.79 per semi-trailer equivalent). Whilst sheep/goats represented only 33% of the trips using the road, it represented 80% of the total transport cost savings. This is due to the transport or sheep/goats using a larger proportion of the road between Barringun and Nyngan. From Figure 49, the transport costs savings would likely be significantly higher if the PBS Level 4A was upgraded to major destinations at Dubbo and Goondiwindi where the vehicles could commence or complete their journey without de-coupling.
Figure 49. Freight density map of supply chains using all of part of the road between Barringun and Dubbo
44 TraNSIT: Unlocking options for efficient logistics infrastructure in Australian agriculture
An additional scenario was tested by extending the PBS Level 4A corridor upgrade from Nyngan to Dubbo via Narromine. The number of semi-trailer equivalents using the road from Barringun to Dubbo was 65,912, a significant increase above the 16,761 between Barringun and Nyngan. It captured a large amount of grain movements to silos (e.g. Narromine) near Dubbo, with 57% of all movements being grain. By extending the PBS Level 4A upgrade to Dubbo, a much large number of trips could complete their journey without decoupling into smaller vehicle combinations en-route. Out of the 65,912 semi-trailer equivalents using all or part of the road corridor, 27,164 received some cost savings from the upgrade to Dubbo. The total cost savings for all these trips was $3.602 million per annum, which is a significant increase above the PBS Level 4A to Nyngan only.
6.7 All agriculture shifted from rail to roadThis hypothetical scenario looked at the impact of shifting all agriculture (grains, beef, sugar, cotton) that currently use rail to be road only. To test the scenario, movements using rail were converted to vehicle trips, accommodating differences in capacity between rail wagon and vehicles (semi-trailer equivalents. Use of rail for beef and cotton firstly required a road trip (from farm, feedlot or cotton gin) to a rail siding, which is often a detour compared to if road was used for the whole journey. The road trip to the rail siding is accommodated for beef and cotton. For grains, the rail trips from the grain silos will be converted to road trips. Since the grain silos are located at the rail sidings, there is no impact to the road transport to the
siding. Table 8 shows a comparison of the cost of rail (and related road costs) for the baseline versus shifting the rail trips to road. In Table 8 there are major differences in cost changes. Beef is significantly less expensive by road, primarily due to the load capacity of a rail wagon (20 head) and a semi trailer equivalent (40 head) when transporting to an abattoir. Other factors include greater efficiencies from using road trains in Queensland, and detours to unload at rail sidings. Higher costs of road transport for grains was primarily due to the higher wagon capacity (particularly outside Queensland) versus semi-trailer equivalents, as well as the transport from grain silos to port being predominately limited to PBS Level 2A access. Table 8 does not include other economic costs such as pollution, safety and congestion. Additional road maintenance costs associated with increased vehicle numbers along the freight routes are based on current charging arrangements (e.g. Fuel excise) and may not reflect the true cost of specific sections of the road and rail network. Figure 50 shows a freight density map (semi trailer equivalents) of the additional number of vehicles along the road network if all agriculture using rail was shifted to road. The largest increase in vehicle movements is due to grain and sugar movements to the ports and flour mills, with up to an additional 150,000 semi-trailers (or 100,000 B-Double equivalents) per year. This increase in road traffic is predominately concentrated during the harvest seasons of grains, sugar and cotton. For some road segments (particularly Queensland) the small decrease in vehicle movements is due to the vehicle trip no longer transporting the cattle or cotton to the rail loading points, as they are now transported direct to abattoirs or port.
TABLE 8. COSTS OF EXISTING RAIL MOVEMENTS VERSUS SHIFTING TO ROAD
COMMODITY EXISTING RAIL COSTS COST IF SHIFTED TO ROAD ROAD MINUS RAIL
BEEF $36,669,692# $10,867,715 -$25,801,975
GRAINS $487,280,313 $696,084,065 $208,803,752
COTTON $15,783,872# $12,531,654 -$3,252,218
SUGAR $9,951,700 $12,137,587 $2,185,887
TOTAL $551,897,754 $731,621,021 $179,723,267
# Includes $5,013,245 in road transport costs to rail siding
## Includes $2,524,299 in road transport costs to rail siding
45
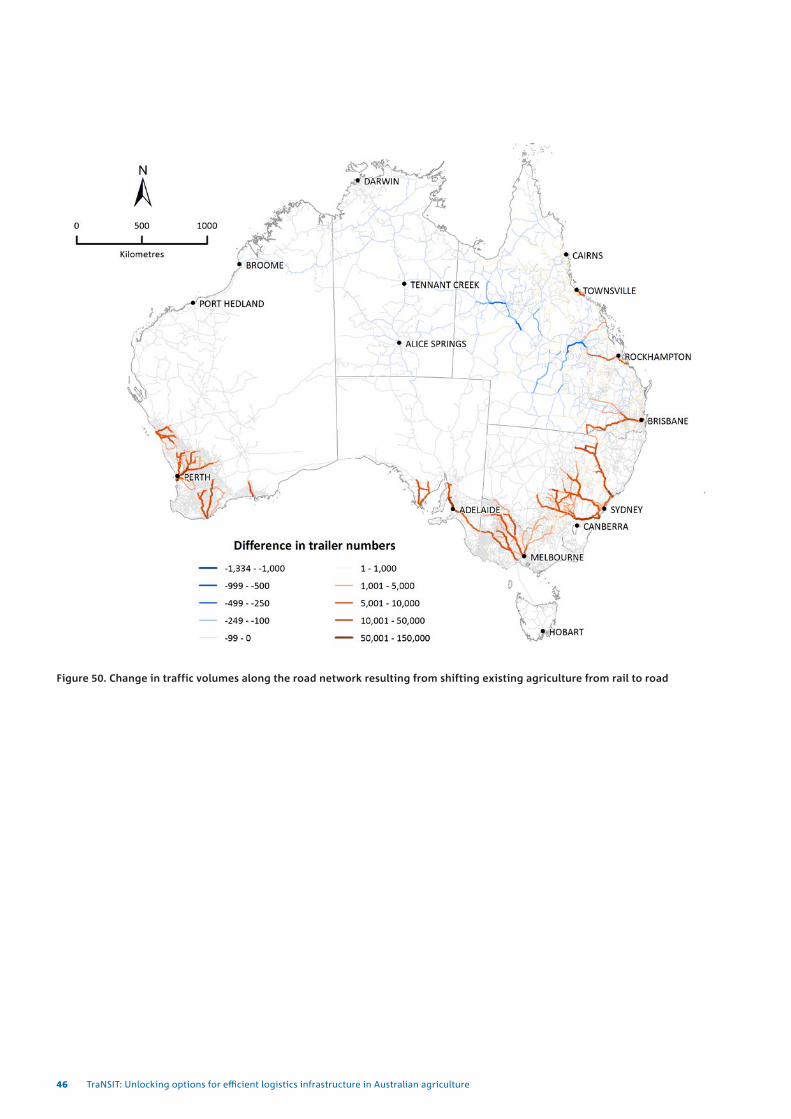
Figure 50. Change in traffic volumes along the road network resulting from shifting existing agriculture from rail to road
46 TraNSIT: Unlocking options for efficient logistics infrastructure in Australian agriculture
7 SensitivitiesTraNSIT is a computer based model, requiring technical expertise and training to set up for different types of applications. TraNSIT uses the largest and most rigorous supply chain dataset ever assembled across Australian agriculture, and a large proportion of the industry data was provided under confidentiality agreements. As a result, the current version of TraNSIT can only be used by the CSIRO project team.
Due to the sensitive nature of the industry data provided and used in TraNSIT, the model cannot be used in applications that allow an organisation to gain competitive commercial advantage. A proposed future version of TraNSIT will remove this sensitivity and allow an organisation to input its own data or forecasts and use the model to optimise its own logistics.
The primary outputs from TraNSIT contain the number of vehicles (of each type) and related transport costs for every road/rail segment across Australia. These can be aggregated to provide total costs and freight flows for the baseline and any scenario. For this project, this information will be made available to industry and government agencies in the form of a GIS shape or KMZ file (for Google Earth), subject to any necessary desensitising of data. These outputs will not reveal information at enterprise level.
8 Next StepsNew projects are underway for TraNSIT to address transport bottlenecks (rail and road) in agriculture and forestry within different regions across Australia. Through an ACIAR initiative, TraNSIT is now being used abroad, particularly in Indonesia, Laos and Vietnam to address supply chain inefficiencies and cross-border bottlenecks.
Some major innovative developments to the TraNSIT tool have been identified by industry and government partners, which would substantially increase its value for government investment, industry and road users.
8.1 Extension to rain and flood hazardsA priority extension to TraNSIT is to incorporate the Bureau of Meteorology’s (BoM) weather, climate and flood data. This would provide additional insight to inform infrastructure investments and economic impact assessments, such as establishing the impact due to heavy rain / flood events. This is particularly important for parts of Australia, particularly the north, where limited road access to markets exists.
It would provide Australian agriculture and related stakeholders (e.g. federal and state governments) with a capacity to inform infrastructure (and related supply chain) investments and identifying opportunities to reduce the economic impact of weather and flood events that disrupt either transport access or stock health. It will achieve this by incorporating BoM’s weather and flood hazard information into TraNSIT. For each enterprise and supply path, it will allow TraNSIT to:
• Identify the likelihood of transport disruption for each supply chain path and enterprise each month of the year, taking into account whether or not alternative transport routes exist.
• Identify the economic impact of disrupting each supply chain at key dates, accounting for critical stock movement periods, market time windows (and related prices) as well as infrastructure damaged by floods.
47
By scaling up across all supply chain paths for Australian agriculture (currently 332,000 supply chain paths in TraNSIT), it will provide a comprehensive picture of the cost of weather and flood events that cause transport disruptions, and the resilience of the overall network. This can be disaggregated to identify costs for: specific commodities (e.g. beef, sheep, grains dairy, etc); road corridors; and regions. For infrastructure or road funding programmes, the upgraded tool could be used to identify road upgrades that will dramatically reduce both transport costs and the economic losses observed during weather/flood events.
8.2 Extension to broader freightTraNSIT is currently being extended to other commodities and industries on a case by case basis, with an initial focus on non-urban freight (e.g. origin and destination not in the same urban centre). Bulk freight (e.g. minerals, fuels) will be relatively simple subject to data availability, since the supply chain paths can be readily mapped. Mixed and urban freight will be more difficult due to 1) a large number of privately owned enterprises to source data from; and 2) fragmented supply chain paths often with small volumes. The availability of such data would significantly increase the coverage of the overall freight task in TraNSIT and its ability to inform infrastructure investment in the urban space. The need for access and sharing such data is widely recognised as a big information gap to transport planning. The National Transport Commission released a discussion paper “What Moves What Where” (NTC 2017) to highlight the information gaps, importance of such data for future planning and to provide recommendations to Ministers in late 2017.
8.3 National Freight and Supply Chain StrategyThe Australian Infrastructure Plan, released by Infrastructure Australian in February 2016 (infrastructureaustralia.gov.au/policy-publications), provided a long term plan and list of recommendation for infrastructure reform and investment. These recommendations included the better use of technologies to support more efficient regional supply chains. Recommendation 4.5 noted the development of the proposed National Freight and Supply Chain Strategy be informed using TraNSIT. The Australian Government’s Response to the Infrastructure Australia’s Australian Infrastructure Plan (November 2016) supported TraNSIT as one of the tools to support ongoing work on the national freight strategy by the COAG Transport and Infrastructure Council.
8.4 Web based version of TraNSITTraNSIT is a valuable tool that assists Federal and State agencies for infrastructure investments, freight strategies, regulatory changes and planning for future agriculture scenarios. To maximise the benefits achieved from TraNSIT, a version needs to be created for use by these agencies. A web based version will protect access to confidential input data, production of outputs revealing sensitive enterprise level information, and use for competitive commercial advantage, whilst providing flexibility to test a range of infrastructure and regulatory scenarios.
48 TraNSIT: Unlocking options for efficient logistics infrastructure in Australian agriculture
ReferencesABARES (2017). Agricultural commodities. Research by the Australian Bureau of Resource Economics and Sciences. March Quarter 2017. Data.daff.gov.au.
ALGA (2016). Local Infrastructure Driving Productivity. Australian Local Government Association Congress Bulletin. http://alga.asn.au/site/misc/alga/downloads/publications/ALGA_Roads16_CongressBulletin.pdf?Menu=50,600
Austroads (2016). Identification of a Risk Indicator to Support ‘Life Line’ Freight Routes. Research Repot AP-R525-16.
ATA (2016). Truck Impact Chart. Australian Trucking Association. Edition 2.1, www.truck.net.au.
BITRE. (2006). Freight Measurement and Modelling in Australia. Report 112, Bureau of Transport and Regional Services, Australian Government, bitre.gov.au/publications.
BITRE (2007). Greenhouse gas emissions from Australian transport: projections to 2020. Working paper 73, bitre.gov.au/publications
BITRE (2016). Freightline 3 - Australian sugar freight transport. Bureau of Transport and Regional Services, Australian Government, bitre.gov.au/publications.
DEE (2016). National Greenhouse Accounts Factors. Australian Government – Department of the Environment and Energy. www.environment.gov.au
Feed Grain S&D Report (2014). Australian Feed Supply and Demand Report 2013/2014. Prepared by JCS Solutions.
Higgins A, Estrada-Flores S, Singh G, Ton T. (2011). The state of logistics in the Australian food industries. ASOR Bulletin. 30(1), 24-41.
Higgins A, McFallan S, Laredo L, Prestwidge D, Stone P. (2015). TRANSIT- A model for simulating infrastructure and policy interventions in agriculture logistics: Application to the northern Australia beef industry Computers and Electronics in Agriculture. Computers and Electronics and Agriculture, 114, 32-42.
Higgins A, Watson I, Chilcott C, Zhou M, Garcia-Flores R, Eady S, McFallan S, Prestwidge D, Laredo L. (2013). Optimising Capital Investment and Operations for the Livestock Industry in Northern Australia. The Rangeland Journal, 35, 181-191.
Higgins A, McFallan S, Bruce C, Laredo L, McKeown A, Beaty M, Marinoni O. (2016). Informing major government programs for rural transport infrastructure in Australia using TraNSIT. Transportation Research A, Under review.
Higgins A, et al. (2014). Livestock Industry Logistics: Optimising Industry Capital Investment and Operations. CSIRO report submitted to Office of Northern Australia, http://www.regional.gov.au/regional/ona/reports-publications.aspx accessed June 2014.
IQ-RAP (2016). Inland Queensland Roads Action Plan. Regional Development Australia Townsville and North West Queensland. www.rdanwq.org.au.
Nelson R, Kokic P, Crimp S, Martin P, Meinke H, Howden M, de Voil P, Nidumolu U. (2010). The vulnerability of Australian rural communities to climate variability and change: Part 2- Integrating impacts with adaptive capacity. Environmental Science & Policy. 13, 18-27.
Northern Territory of Australia (2014). Feral buffalo: distribution and abundance in Arnhem Land, Northern territory, Department of Land Resource Management.
NSW DPI (2016). Feedlotting Lambs, NSW Department of Primary Industries, July 2016, Primefact, 2nd edition.
NTC (2017). Who moves what where: Better informing transport planning for Australians. www.ntc.gov.au
49
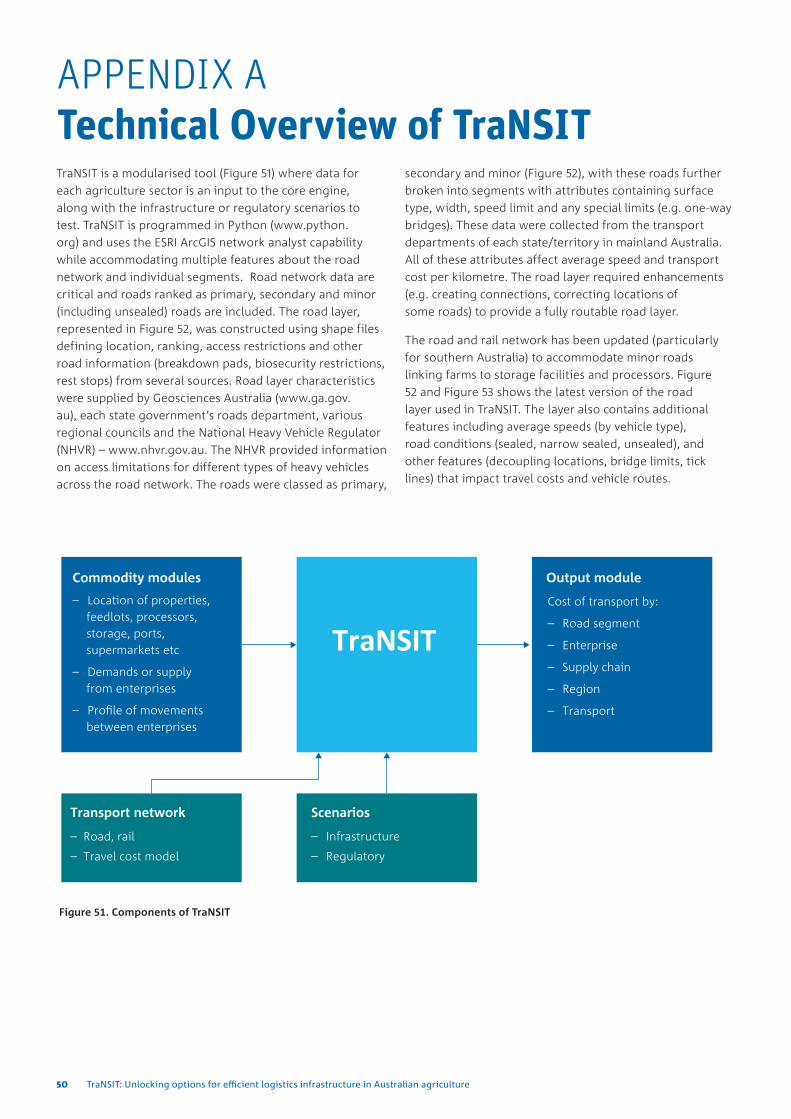
APPENDIX A Technical Overview of TraNSITTraNSIT is a modularised tool (Figure 51) where data for each agriculture sector is an input to the core engine, along with the infrastructure or regulatory scenarios to test. TraNSIT is programmed in Python (www.python.org) and uses the ESRI ArcGIS network analyst capability while accommodating multiple features about the road network and individual segments. Road network data are critical and roads ranked as primary, secondary and minor (including unsealed) roads are included. The road layer, represented in Figure 52, was constructed using shape files defining location, ranking, access restrictions and other road information (breakdown pads, biosecurity restrictions, rest stops) from several sources. Road layer characteristics were supplied by Geosciences Australia (www.ga.gov.au), each state government’s roads department, various regional councils and the National Heavy Vehicle Regulator (NHVR) – www.nhvr.gov.au. The NHVR provided information on access limitations for different types of heavy vehicles across the road network. The roads were classed as primary,
secondary and minor (Figure 52), with these roads further broken into segments with attributes containing surface type, width, speed limit and any special limits (e.g. one-way bridges). These data were collected from the transport departments of each state/territory in mainland Australia. All of these attributes affect average speed and transport cost per kilometre. The road layer required enhancements (e.g. creating connections, correcting locations of some roads) to provide a fully routable road layer.
The road and rail network has been updated (particularly for southern Australia) to accommodate minor roads linking farms to storage facilities and processors. Figure 52 and Figure 53 shows the latest version of the road layer used in TraNSIT. The layer also contains additional features including average speeds (by vehicle type), road conditions (sealed, narrow sealed, unsealed), and other features (decoupling locations, bridge limits, tick lines) that impact travel costs and vehicle routes.
Figure 51. Components of TraNSIT
50 TraNSIT: Unlocking options for efficient logistics infrastructure in Australian agriculture
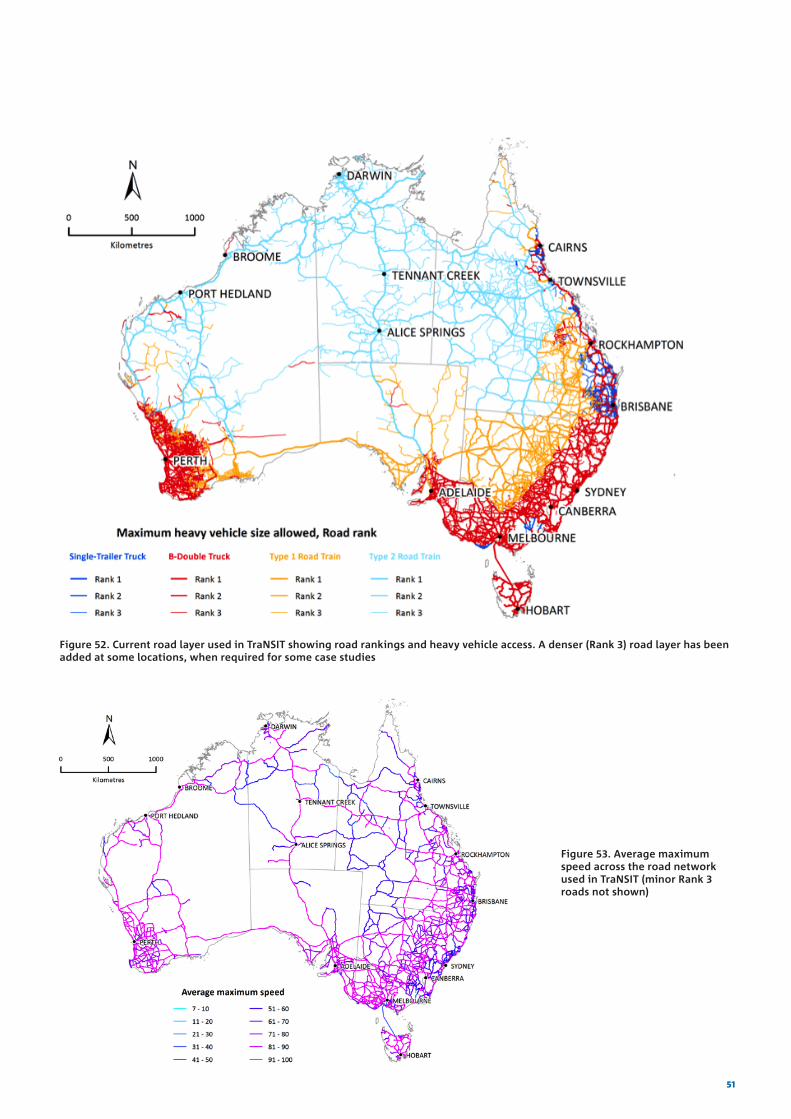
Figure 52. Current road layer used in TraNSIT showing road rankings and heavy vehicle access. A denser (Rank 3) road layer has been added at some locations, when required for some case studies
Figure 53. Average maximum speed across the road network used in TraNSIT (minor Rank 3 roads not shown)
51
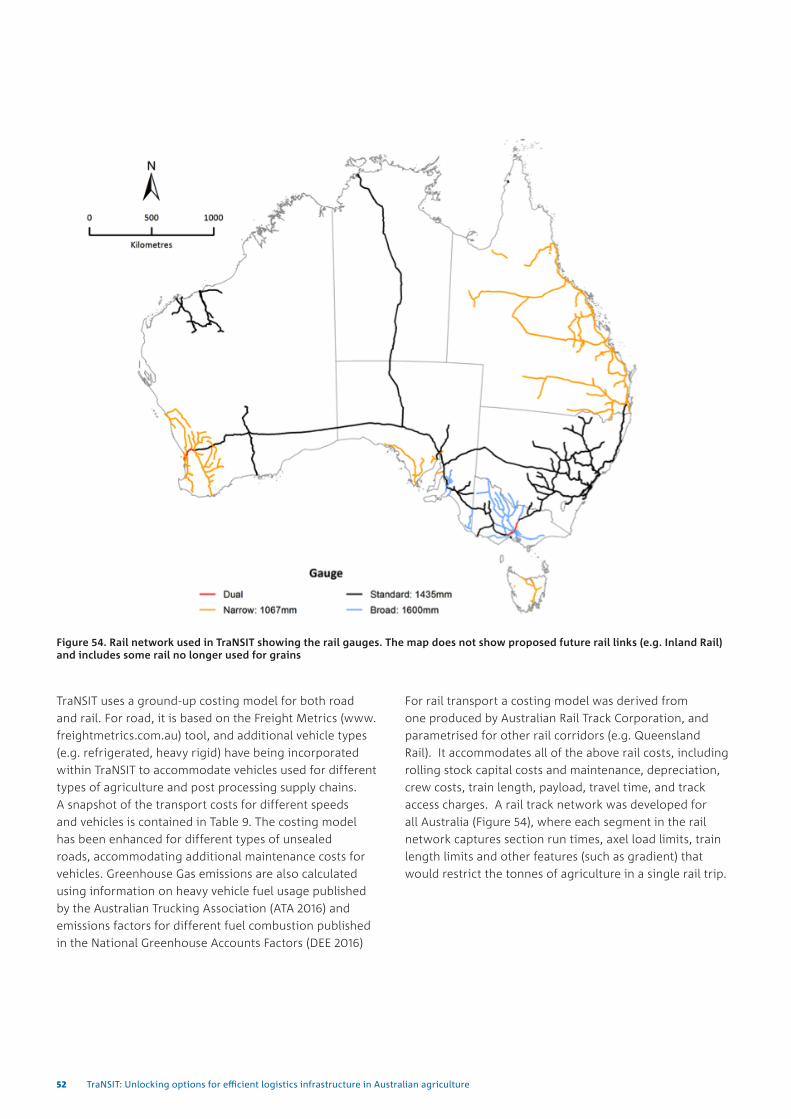
Figure 54. Rail network used in TraNSIT showing the rail gauges. The map does not show proposed future rail links (e.g. Inland Rail) and includes some rail no longer used for grains
TraNSIT uses a ground-up costing model for both road and rail. For road, it is based on the Freight Metrics (www.freightmetrics.com.au) tool, and additional vehicle types (e.g. refrigerated, heavy rigid) have being incorporated within TraNSIT to accommodate vehicles used for different types of agriculture and post processing supply chains. A snapshot of the transport costs for different speeds and vehicles is contained in Table 9. The costing model has been enhanced for different types of unsealed roads, accommodating additional maintenance costs for vehicles. Greenhouse Gas emissions are also calculated using information on heavy vehicle fuel usage published by the Australian Trucking Association (ATA 2016) and emissions factors for different fuel combustion published in the National Greenhouse Accounts Factors (DEE 2016)
For rail transport a costing model was derived from one produced by Australian Rail Track Corporation, and parametrised for other rail corridors (e.g. Queensland Rail). It accommodates all of the above rail costs, including rolling stock capital costs and maintenance, depreciation, crew costs, train length, payload, travel time, and track access charges. A rail track network was developed for all Australia (Figure 54), where each segment in the rail network captures section run times, axel load limits, train length limits and other features (such as gradient) that would restrict the tonnes of agriculture in a single rail trip.
52 TraNSIT: Unlocking options for efficient logistics infrastructure in Australian agriculture
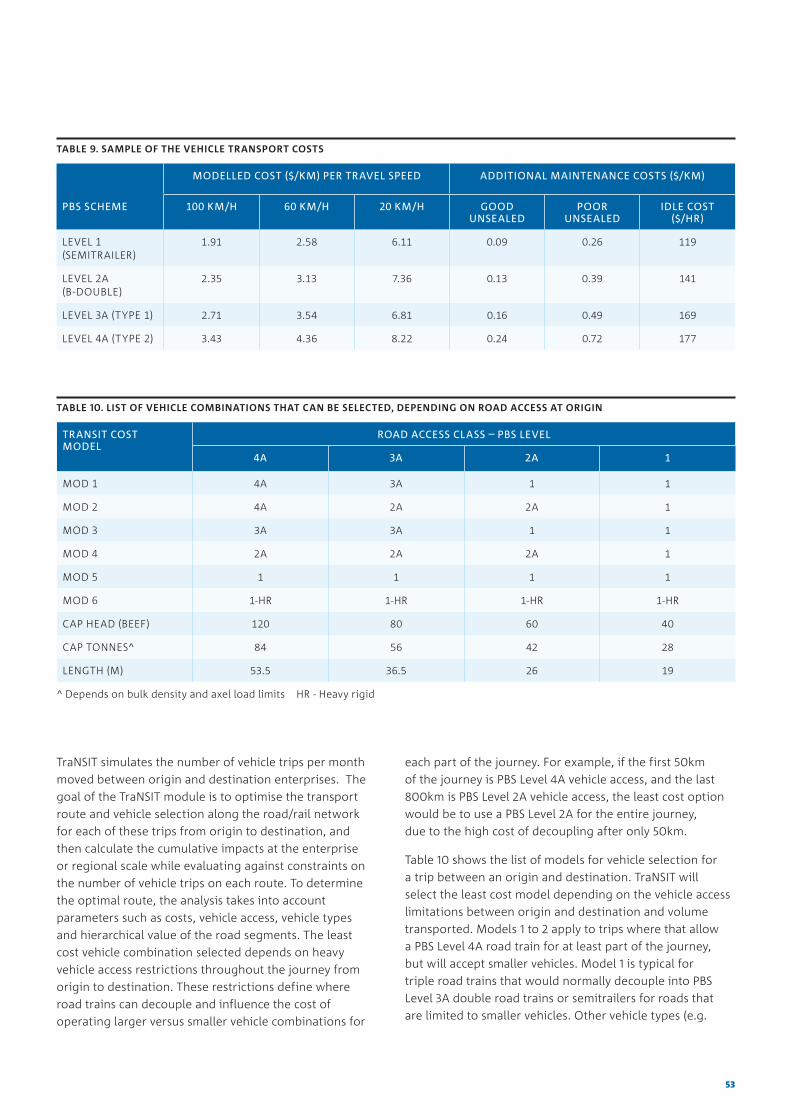
TABLE 9. SAMPLE OF THE VEHICLE TRANSPORT COSTS
MODELLED COST ($/KM) PER TRAVEL SPEED ADDITIONAL MAINTENANCE COSTS ($/KM)
PBS SCHEME 100 KM/H 60 KM/H 20 KM/H GOOD UNSEALED
POOR UNSEALED
IDLE COST ($/HR)
LEVEL 1 (SEMITRAILER)
1.91 2.58 6.11 0.09 0.26 119
LEVEL 2A (B-DOUBLE)
2.35 3.13 7.36 0.13 0.39 141
LEVEL 3A (TYPE 1) 2.71 3.54 6.81 0.16 0.49 169
LEVEL 4A (TYPE 2) 3.43 4.36 8.22 0.24 0.72 177
TABLE 10. LIST OF VEHICLE COMBINATIONS THAT CAN BE SELECTED, DEPENDING ON ROAD ACCESS AT ORIGIN
TRANSIT COST MODEL
ROAD ACCESS CLASS – PBS LEVEL
4A 3A 2A 1
MOD 1 4A 3A 1 1
MOD 2 4A 2A 2A 1
MOD 3 3A 3A 1 1
MOD 4 2A 2A 2A 1
MOD 5 1 1 1 1
MOD 6 1-HR 1-HR 1-HR 1-HR
CAP HEAD (BEEF) 120 80 60 40
CAP TONNES^ 84 56 42 28
LENGTH (M) 53.5 36.5 26 19
^ Depends on bulk density and axel load limits HR - Heavy rigid
TraNSIT simulates the number of vehicle trips per month moved between origin and destination enterprises. The goal of the TraNSIT module is to optimise the transport route and vehicle selection along the road/rail network for each of these trips from origin to destination, and then calculate the cumulative impacts at the enterprise or regional scale while evaluating against constraints on the number of vehicle trips on each route. To determine the optimal route, the analysis takes into account parameters such as costs, vehicle access, vehicle types and hierarchical value of the road segments. The least cost vehicle combination selected depends on heavy vehicle access restrictions throughout the journey from origin to destination. These restrictions define where road trains can decouple and influence the cost of operating larger versus smaller vehicle combinations for
each part of the journey. For example, if the first 50km of the journey is PBS Level 4A vehicle access, and the last 800km is PBS Level 2A vehicle access, the least cost option would be to use a PBS Level 2A for the entire journey, due to the high cost of decoupling after only 50km.
Table 10 shows the list of models for vehicle selection for a trip between an origin and destination. TraNSIT will select the least cost model depending on the vehicle access limitations between origin and destination and volume transported. Models 1 to 2 apply to trips where that allow a PBS Level 4A road train for at least part of the journey, but will accept smaller vehicles. Model 1 is typical for triple road trains that would normally decouple into PBS Level 3A double road trains or semitrailers for roads that are limited to smaller vehicles. Other vehicle types (e.g.
53

BAB Quads, AB triples, A-Doubles) can readily be added. Model 3 are for trips where the maximum vehicle is a PBS Level 3A for any part of the journey. The vehicle selected may also affect the optimal route taken. For example, the use of a semitrailer vehicle from the origin could take the shortest travel time path and would not need to decouple. Commencing travel from the origin in a PBS Level 3A or 4A vehicle may take a longer travel time path to increase the proportion of the trip in the higher performance vehicle before decoupling into smaller vehicles, to minimise costs.
Since a property is not always geographically attached to a road in the road network, a trip from an origin to destination (O-D) is modelled to travel from the closest road segment to the origin, and finish at the closest point on a road segment to the destination point. This process is repeated for all routes, always searching for the minimum cost route (including penalty costs), and selecting it as the optimal route.
Figure 55 represents a process diagram of TraNSIT. The first processing stage of TraNSIT is to construct a set of vehicle and train trips between enterprises across the supply chains. Historical data of actual movements between enterprises are used to generate a set of synthetic movements for TraNSIT. These historical demands and production levels at each farm are used to generate a set of synthetic trips so that annual total tonnage (or head) transported across the synthetic trips are representative of past movements. Historical data on commodity movements between enterprises (e.g. farm to processor) are used to derive statistical probabilities of transport between farms (in case of cattle movement), farm to storage, farm to processor, etc. For example, farms would more likely supply a closer processor (depending on price paid) compared to a processor with a much longer travel distance. These probabilities are calibrated so that distribution of travel distances (including interstate) are similar to those recorded in past actual data.
Figure 55. Process diagram of TraNSIT, comprising the stages from set up to running of each model component
54 TraNSIT: Unlocking options for efficient logistics infrastructure in Australian agriculture
Once the set of movements have been produced, TraNSIT finds the optimal route (based on transport cost) and selection of vehicle types, for each Origin-Destination (O-D) pair input. Optimal road sections travelled for each O-D pair are saved. These road sections can be constrained by access restrictions such as vehicle size/load limit which will determine the route final set of route segments. The optimal route selected may not necessarily be the actual route taken by the driver in the existing network but rather the route that would be taken should the driver be seeking a least travel cost option. Once the optimal set of segments for all O-D pairs are saved, Python scripts calculate the cost of transport and number of vehicles for a given resource flow between each O-D pair. These are then aggregated over all O-D pairs to provide a total cost of transport for the scenario. It currently takes about 16 hours (on 25 cores - Dual Xeon CPU 3.3GhZ processor) to run all of steps of TraNSIT shown in Figure 55 for the 332,000 different O-D’s across all agriculture.
55

56 TraNSIT: Unlocking options for efficient logistics infrastructure in Australian agriculture

FOR FURTHER INFORMATIONCSIRO Land and WaterAndrew Higginst +61 7 3833 5738e [email protected]
Stephen McFallant +61 7 3833 5722e [email protected]
Adam McKeownt +61 7 4059 5009e [email protected]
Chris Chilcottt +61 8 8944 8422e [email protected]
Caroline Brucet +61 7 4059 5024e [email protected]
Oswald Marinonit +61 7 3833 5713e [email protected]
Peter Stonet +61 7 3833 5659e [email protected]
CONTACT USt 1300 363 400 +61 3 9545 2176 e [email protected] w www.csiro.au
WE DO THE EXTRAORDINARY EVERY DAY
We innovate for tomorrow and help improve today – for our customers, all Australians and the world.
Our innovations contribute billions of dollars to the Australian economy every year. As the largest patent holder in the nation, our vast wealth of intellectual property has led to more than 150 spin‑off companies.
With more than 5,000 experts and a burning desire to get things done, we are Australia’s catalyst for innovation.
WE IMAGINE. WE COLLABORATE. WE INNOVATE.
B&M 17-0082