transit station access trips and factors affecting
TRANSCRIPT

Proceedings of the Eastern Asia Society for Transportation Studies, Vol.6, 2007
TRANSIT STATION ACCESS TRIPS AND FACTORS AFFECTING PROPENSITY TO WALK TO TRANSIT STATIONS IN BANGKOK,
THAILAND
Saksith CHALERMPONG Assistant Professor Department of Civil Engineering Chulalongkorn University Phyathai Road, Bangkok 10330 Thailand Fax: +66-251-7304 E-mail: [email protected]
Sony S. WIBOWO Doctoral Student Department of Civil Engineering Chulalongkorn University Phyathai Road, Bangkok 10330 Thailand Fax: +66-251-7304 E-mail: [email protected]
Abstract: An important strategy to improve rail transit ridership is to improve station accessibility conditions. The objectives of this research are twofold: to understand patterns of access trips to transit stations and to determine the factors affecting propensity to walk to stations in Bangkok. The results show that most popular access modes are bus, motorcycle taxi, and walking. Within transit catchment area, Bangkok’s share of walking is less than those in other major cities, due to competition from motorcycle taxis. Estimation results of choice model show that distance to station is the most critical factor affecting propensity to walk, and that station-specific characteristics have significant impacts. Key Words: Transit station, Access mode, Propensity to walk 1. BACKGROUND Bangkok’s rail transit systems are operated by two independent transit agencies. The Bangkok Transit System Company (BTSC), a wholly privately owned company, operates two elevated rail lines, known as the BTS, under concession from Bangkok Metropolitan Administration (BMA), the city’s municipal government. The Mass Rapid Transit Authority (MRTA), a national public enterprise, oversees the city’s only subway line, which was built and operated by a private joint venture, BMCL, under the Build-Operate-Transfer (BOT) model. (See Figure 1 for the map of the two systems.) Since operations began in 1999 and 2004 for BTS and MRT, respectively, the ridership of both systems has failed to meet the forecasted figures by a wide margin. There are several reasons for this shortfall. For example, an important assumption in ridership forecasting process is that the government would expand rail transit lines to cover the city more extensively. This never happens, and therefore opportunities to increase ridership via economies of network never materialize. While expanding the rail system’s coverage is necessary to improve ridership in the long run, doing so is very expensive and takes very long time. An alternative strategy is to attract as many people as possible, particularly those who live within the existing systems’ catchments areas to use transit. As many transportation researchers have long realized, this necessitates improving the conditions of access trips to transit stations, a strategy that usually receives little attention from policymakers in Thailand, who often focus more on developing the rail construction project. For example, when the BTS began operation in 1999, Bangkok Mass Transit Authority (BMTA), a national public enterprise that operate the city’s buses, did not re-route its bus services in order to feed the BTS stations, and many of the bus routes actually compete directly with the BTS. To make the matter worse, the academics have done little to

Proceedings of the Eastern Asia Society for Transportation Studies, Vol.6, 2007
inform the policy debate in order to improve transit station accessibility. Little research effort in Thailand has been expended on trying to understand the existing pattern of transit station access trips and even less still to find ways to improve the status quo.
Figure 1 Map of Bangkok’s rail transit systems
(Source: ESRI, Thailand) More recently, in the feasibility study of new transit lines, prepared by BMTD (2005), the importance of access trips has been recognized and intermodal transfer facilities were proposed to accommodate this aspect of transit trips. To predict the demand for these transfer facilities, the consultants surveyed mode shares of access trips at existing BTS and MRT
Proceedings of the Eastern Asia Society for Transportation Studies, Vol.6, 2007
stations, which are categorized into four groups by station and land use characteristics, namely, interchange station, CBD/high-density, medium-density residential, and low-density residential. By multiplying these mode shares with ridership forecasts, the number of access trips to station by various modes can be computed, and the facilities are design to accommodate the forecasted demand. BMTD’s methodology presupposes that transit station access mode shares depend on station and land use characteristics. Unfortunately, the mode share data were collected from only one or two “representative” stations in each station group and are far too crude to reflect the effect of land use on modal split. The forecasts of mode shares and access trips at new stations, based on existing pattern of the existing BTS and MRT stations, necessarily presume that access environments, facilities, and feeder services are similar to those of the “representative” stations. The use of such forecasts to design access facilities is appropriate if access conditions at the representative stations are already good. However, evidence in this paper will show the contrary, and that there are many improvements that can be made with regards to station accessibility in Bangkok’s transit systems.
In this paper, we aim to contribute to the policy debate on how Bangkok’s transit systems can be improved by addressing the following research questions: 1) What are the patterns of access trip to transit stations in Bangkok, Thailand?, 2) What are the factors that affect propensity to walk to transit stations for those who live within the catchment area?, 3) Why traveler using certain transit stations are more likely to walk than others?, and 4) How can we formulate policies to help improve conditions for access trips, particularly by non-motorized modes, to transit stations? 2. LITERATURE REVIEW 2.1 Catchment Area In past studies, rail transit station’s catchment area has been defined in different ways. The most common definition is probably the area in which a majority of rail passengers reach a station by walking. More specifically, Vuchic (2005) defined the area as a circular surface with a radius of the maximum walking distance. However, the value of maximum walking distance may vary significantly in different places. For example, in Great Britain, based on the National Travel Survey conducted in 1975 and 1976, over 70% of all walk trips were shorter than 1,600 meters (Mitchell and Stokes, 1982). Halden et al. (2000), in a Swedish study, also found similar results to suggest that 1,600 meters be the maximum acceptable walking distance. Stringham (1982) reported that the maximum distance that commuters walk in Toronto, Canada, is approximately 1,200 meters. Wibowo (2005) studied access patterns of Singapore’s rail transit system and reported the maximum walking distance of 2,000 meters. Alternatively, some researchers used walking time to a station to define the catchments area. For example, O’Sullivan and Morrall (1996) and Halden et al., (2000) used the maximum walking time of 10 to 15 minutes to indicate maximum acceptable range of walking access. Based on these past studies, an acceptable maximum walking distance seems to fall between 1,000 and 1,600 meters.
2.2 Distance vs. Mode Share for Access Trips The single most important factor affecting mode choice of access trips to a transit station is probably the distance to a transit station. Many researchers developed diagrams showing mode shares at each distance from transit stations as illustrated in Figure 2. The diagram can

Proceedings of the Eastern Asia Society for Transportation Studies, Vol.6, 2007
help identify the range over which walking is competitive with other modes, particularly motorized modes, such as bus and car.
Figure 2 Mode share of access trip to station relative to distance (Source: Stringham, 1982)
Generally, walking is most competitive over a short distance, i.e. within the maximum walking distance as discussed previously. For instance, Rastogi and Rao (2003) reported in the Mumbai study that more than 85 per cent of access trips within 1,250 meters to a transit station are on foot, but the share of walking is only 14 per cent beyond that distance. Evidence from North American studies suggests a lower level of tolerance to walking in North America where the walking share is 50 per cent for access trips within 900 meters of a station. (O’Sullivan and Morrall, 1996)
Motorized modes are more competitive beyond the maximum walking distance threshold, with cars being the most competitive over a very long distance. A study of the Bay Area Rapid Transit (BART), for example, revealed that over 70 per cent of all access trips beyond the distance of 3,200 meters to a station are made by driving alone, kiss and ride, or shared ride (Cervero, 2001). Public buses are, in general, utilized over a wider range of distance than other modes, with the share gradually rising with distance to a station. The range of distance over which public buses are competitive can be from one kilometer to as long as five kilometer (e.g. Stringham, 1982; Cervero, 2001; Rastogi and Rao, 2003.)
2.3 Effects of Land Use and Other Station Characteristics Some researchers studied the effects land use and other characteristics of transit station on access modes. For example, Loutzenheiser (2001) modeled access mode share of walking in 29 BART stations as a function of various station-specific characteristics. He found statistically significant relationship between the walk share and four types of station-specific variables, i.e. socioeconomic characteristics, parking availability, street pattern, and land use.

Proceedings of the Eastern Asia Society for Transportation Studies, Vol.6, 2007
Specifically, population density, housing density, and distance to nearest retail center are all significant determinants of walk share. Stations in higher-density areas have higher walk share. The closer to retail center a station is, the higher the walk share.
Loutzenheiser also examined the effects of land use on the propensity to use motorized modes, as opposed to walking. Using discrete choice modeling approach, he found that, after controlling for traveler’s socioeconomic characteristics, trip characteristics, and distance to a station, grid street patterns, proximity to freeways, high degree of mixed land use, and parking availability all increase the propensity to choose motorized modes over walking. The only land use characteristic that favor walking is the retail-dominant land use. Physical characteristics of transit station and its environments can also greatly influence the propensity to walk to a station. In the case study of Singapore’s rapid transit system, Wibowo (2005) found that the effort of walking to access station is influenced by such factors as the number of access roads, the number of road crossings, and the number of ascending steps, and the presence of pedestrian bridge. He also demonstrated that an equivalent of walking distance can be found for each of these factors. The review of literature shows that the patterns of transit station access trips are varied in different places. The patterns depend not only on distance to a transit station, but also characteristics of travelers, characteristics of transit station, and land use patterns in surrounding areas. While the results and policy implications from the literature cannot be readily transferable, the review provides a useful framework for examining access trips to transit stations in Bangkok, Thailand, where the patterns and problems of transit station access are likely to be unique, due to local characteristics. 3. TRANSIT STATION ACCESS MODES AND SURVEY DATA 3.1 Transit Station Access Modes in Bangkok In Bangkok, common modes of access trip to transit stations are walking, fixed-route services (bus, van, BTS-operated shuttle bus, and modified pickup truck, known locally as songtaew), for-hire services (taxi, motorcycle taxi, and tricycle, known locally as tuk-tuk), and driving (cars and motorcycles). A unique feature of Bangkok’s public transportation is the widely available motorcycle taxi. The motorcycle taxis serve mainly in Bangkok’s numerous “Soi”, normally two-lane narrow alleys off the main roads, but are also common on the city’s major arterial roads. Bicycles are almost never seen in Bangkok, due to the city’s dangerous environments for cycling – too many cars and too little road surface. Walking can also be difficult and dangerous because there are usually many obstructions on sidewalks, such as street vendors, food stalls, utility polls, telephone booths, so much so that pedestrians sometimes must walk on the road surface to avoid these obstructions. Worse still, many of the city’s Sois have no sidewalks altogether. All these factors contribute to the propensity of transit users to choose motorized modes over “green” modes like walking or cycling. 3.2 Survey Data Passenger surveys were conducted at 14 transit stations in Bangkok. To focus on access trips, only stations where most commute trips originate are selected, and stations in Commercial Business Districts, where most commute trips end with commuters walking to destination, are therefore not included. On station platforms, passengers were asked about how they arrived at transit stations: mode of access, number of transfers, costs, time, and distance. Socioeconomic

Proceedings of the Eastern Asia Society for Transportation Studies, Vol.6, 2007
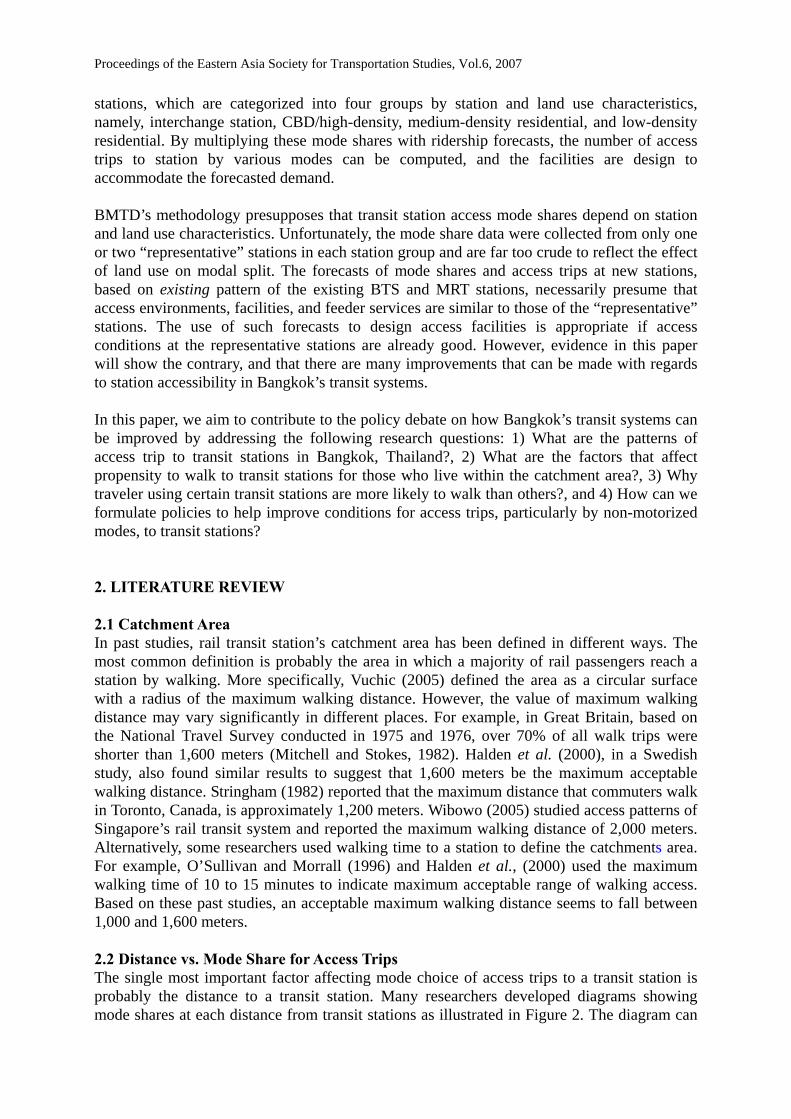
characteristics of passengers were also recorded. The surveys were conducted on weekdays during the morning peak hours (7.00 A.M. to 9.00 A.M.), and so the majority of the sample can be classified as commuters. In all, the surveys produced 5,105 observations of transit passengers. 4. CHARACTERISTICS OF TRANSIT STATION ACCESS TRIPS IN BANGKOK 4.1 Access Mode Shares Table 1 shows mode shares of access trips at selected transit stations in Bangkok, seven of which are BTS and the rest are MRT stations. The table shows that access mode with the highest share, 34.12 per cent on average, is bus transit, which includes fixed-route full-length bus and 11-passenger van services. Some stations have very high share of bus as access mode, including Chatuchak Park, Hua Lamphong, Mo Chit, and Victory Monument. These locations are also major transportation hubs where numerous bus and van routes converge. It is, therefore, not surprising that the share of bus transit at these stations well exceed 50 per cent.
Table 1 Access mode share (per cent) at selected stations Station System Walk Drive-
alone Kiss & Ride
Bus Transit
Motorcycle Taxi Others
Bang Sue MRT 6.46 9.89 12.55 34.60 28.52 7.98 Chatuchak Park MRT 0.35 12.28 10.53 65.27 2.81 8.77 Hua Lamphong MRT 19.87 2.65 12.25 57.95 2.32 4.96 Lat Phrao MRT 26.82 23.62 11.95 30.32 4.66 2.63 Phra Ram 9 MRT 27.22 3.33 12.50 26.67 28.61 1.67 Sukhumvit MRT 17.00 7.91 6.32 8.70 8.30 51.79 Sutthisan MRT 28.57 2.80 10.25 4.04 53.11 1.24 Aree BTS 21.77 11.07 7.75 35.79 18.08 5.54 Asok BTS 8.68 4.96 13.64 12.81 8.68 51.23 Mo Chit BTS 0.36 18.12 14.13 53.62 2.54 11.23 Onnut BTS 10.33 9.09 12.40 30.79 21.69 15.70 Taksin BTS 13.94 7.67 4.18 34.15 8.36 31.70 Thonglor BTS 20.53 9.13 16.35 12.55 29.28 12.16 Victory Monument BTS 11.75 4.22 5.72 70.48 4.52 3.31 Average 15.26 9.05 10.75 34.12 15.82 14.99
The shares of motorcycle taxi and walk as access mode are similar, averaging 15.82 and 15.26, respectively. The high share of motorcycle taxi is unique in Bangkok and not commonly found elsewhere. One of the reasons for this is probably the city’s idiosyncratic street networks, i.e. the Soi, as discussed above, which make formal public transit services like bus difficult to operate. Dangerous though it may seem, motorcycle taxis thrive in these narrow alleys, and the government, realizing the importance of its role for people living deep in the Soi, was quick to legalize and regulate the service. Also, due to the Soi’s narrowness and the lack of formal transit services in them, another reasonable alternative of residents in the Soi is to walk. The network structure of Soi is very dominant in areas surrounding Sutthisan, Lat Phrao, and Thong Lor stations, thereby explaining high share of motorcycle taxi and walk at these locations. Accessing transit stations by cars, including driving alone and kiss & ride, is also common in Thailand, consisting of about one fifth of all access trips. Stations with high share of drive-alone access are those with park & ride facilities, notably Mo Chit, Chatuchak Park, Lat Prao,
Proceedings of the Eastern Asia Society for Transportation Studies, Vol.6, 2007
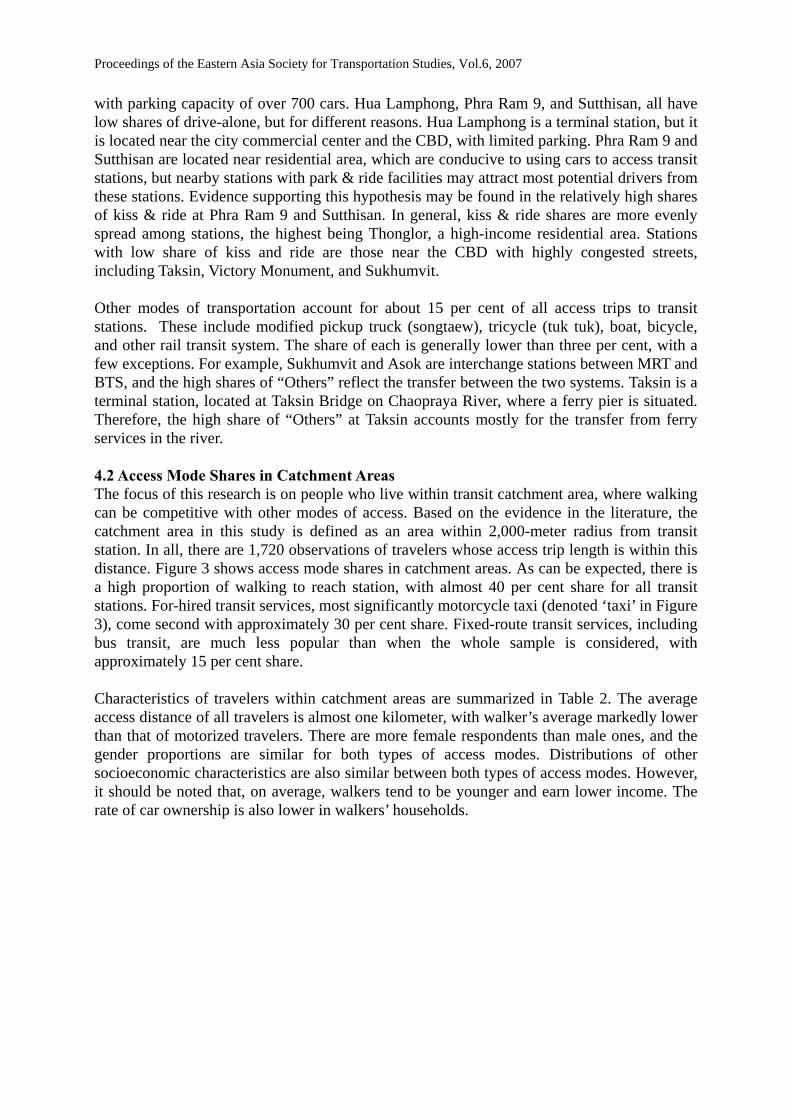
with parking capacity of over 700 cars. Hua Lamphong, Phra Ram 9, and Sutthisan, all have low shares of drive-alone, but for different reasons. Hua Lamphong is a terminal station, but it is located near the city commercial center and the CBD, with limited parking. Phra Ram 9 and Sutthisan are located near residential area, which are conducive to using cars to access transit stations, but nearby stations with park & ride facilities may attract most potential drivers from these stations. Evidence supporting this hypothesis may be found in the relatively high shares of kiss & ride at Phra Ram 9 and Sutthisan. In general, kiss & ride shares are more evenly spread among stations, the highest being Thonglor, a high-income residential area. Stations with low share of kiss and ride are those near the CBD with highly congested streets, including Taksin, Victory Monument, and Sukhumvit. Other modes of transportation account for about 15 per cent of all access trips to transit stations. These include modified pickup truck (songtaew), tricycle (tuk tuk), boat, bicycle, and other rail transit system. The share of each is generally lower than three per cent, with a few exceptions. For example, Sukhumvit and Asok are interchange stations between MRT and BTS, and the high shares of “Others” reflect the transfer between the two systems. Taksin is a terminal station, located at Taksin Bridge on Chaopraya River, where a ferry pier is situated. Therefore, the high share of “Others” at Taksin accounts mostly for the transfer from ferry services in the river. 4.2 Access Mode Shares in Catchment Areas The focus of this research is on people who live within transit catchment area, where walking can be competitive with other modes of access. Based on the evidence in the literature, the catchment area in this study is defined as an area within 2,000-meter radius from transit station. In all, there are 1,720 observations of travelers whose access trip length is within this distance. Figure 3 shows access mode shares in catchment areas. As can be expected, there is a high proportion of walking to reach station, with almost 40 per cent share for all transit stations. For-hired transit services, most significantly motorcycle taxi (denoted ‘taxi’ in Figure 3), come second with approximately 30 per cent share. Fixed-route transit services, including bus transit, are much less popular than when the whole sample is considered, with approximately 15 per cent share. Characteristics of travelers within catchment areas are summarized in Table 2. The average access distance of all travelers is almost one kilometer, with walker’s average markedly lower than that of motorized travelers. There are more female respondents than male ones, and the gender proportions are similar for both types of access modes. Distributions of other socioeconomic characteristics are also similar between both types of access modes. However, it should be noted that, on average, walkers tend to be younger and earn lower income. The rate of car ownership is also lower in walkers’ households.

Proceedings of the Eastern Asia Society for Transportation Studies, Vol.6, 2007
0% 10% 20% 30% 40% 50% 60% 70% 80% 90% 100%
ALL
BTS
MRTse
lect
ed m
ass r
apid
tran
sit s
tatio
n
proportion of access mode
walk drive-alone kiss&ride bus transit taxi other Figure 3 Access mode shares in transit catchment areas
Table 2 Summary of characteristics of travelers within catchment areas
Overal
l Walk Motorized
Number of Observations 1720 636 1084 Share (%) 36.98 63.02 Access Distance (Meter) Average 942 574 1158 S.D. 546 343 527 Gender Male (%) 37.67 37.89 37.55 Female (%) 62.33 62.11 62.45 Age (Year) Average 28.05 27.94 28.11 S.D. 8.35 8.49 8.26 Occupation Student (%) 23.02 21.22 24.08 Office worker (%) 53.95 57.55 51.85 Others (%) 23.02 21.22 24.08 Household Car Ownership No (%) 65.29 66.51 64.58 Yes(%) 34.71 33.49 35.42 Income (Thousand Baht) Average 23.01 24.43 25.05 S.D. 20.19 22.73 22.35

Proceedings of the Eastern Asia Society for Transportation Studies, Vol.6, 2007
4.3 Access Modes vs. Distance to Transit Station Figure 4 shows the relationship between access mode shares and distance to a transit station. As can be seen, the walking share decreases with distance, and it drop sharply beyond the distance of 0.4 kilometer. Less than 10 per cent of travelers walk from the distance longer than 1 kilometer.
0
10
20
30
40
50
60
70
80
90
100
0 0.1 0.2 0.3 0.4 0.5 0.6 0.7 0.8 0.9 1 1.1 1.2 1.3 1.4 1.5distance from station (km)
cum
ulat
ive
resp
onde
nt (%
)
walking
motorcycle taxi
kiss&rideothers
bus transitdrive alone
Figure 4 Relationship between access mode share and distance from station
Beyond the distance of 0.9 kilometer, the use of motorcycle taxi rises sharply. This reflects the distance beyond which travelers prefer to use motorized access mode, and hence motorcycle taxi becomes much more desirable. In Bangkok, a motorcycle taxi has high mobility, especially in congested area. It can move between vehicles, on the sidewalk, or even go against the traffic direction to reach its destination. The problems include not only dangers associated with riding motorcycles and risky driving behavior, but also security threats, such as robberies. Also problematic is the irregular fare system, which makes motorcycle taxis sometimes even more expensive than regular taxis. 5. FACTORS AFFECTING PROPENSITY TO WALK Preliminary analysis in the previous section shows how distance affects the share of walking as an access mode to transit stations. In this section, we examine the differences of walking share at different locations after controlling for distance. In other words, we attempt to determine the factors, other than distance, that drive traveler’s propensity to walk to transit stations. Since our focus is on walking trips, we define our scope of analysis as the transit catchment area, where walking is competitive with other motorized modes. As mentioned earlier, based on evidence in the literature, we use the radius of 2,000 meters from a transit station to define the catchment area. As discussed extensively in the literature, the propensity to walk to a transit station depends on several factors other than distance. These factors can be classified into two main groups, namely travelers’ socioeconomic characteristics and accessibility and other characteristics of transit stations. Using the discrete choice framework, we can model the probability of a
Proceedings of the Eastern Asia Society for Transportation Studies, Vol.6, 2007
traveler walking to a transit station as a function of distance to the station, traveler’s socioeconomic characteristics, and station characteristics. The probability function can be written as follows:
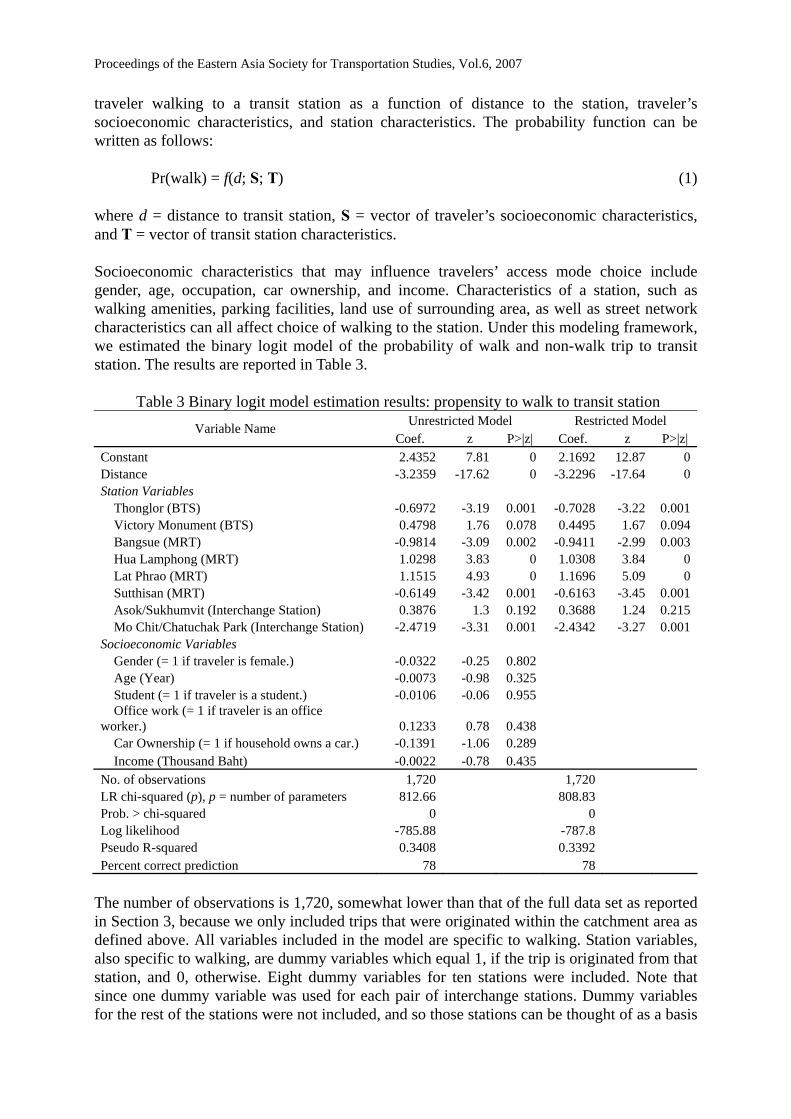
Pr(walk) = f(d; S; T) (1) where d = distance to transit station, S = vector of traveler’s socioeconomic characteristics, and T = vector of transit station characteristics. Socioeconomic characteristics that may influence travelers’ access mode choice include gender, age, occupation, car ownership, and income. Characteristics of a station, such as walking amenities, parking facilities, land use of surrounding area, as well as street network characteristics can all affect choice of walking to the station. Under this modeling framework, we estimated the binary logit model of the probability of walk and non-walk trip to transit station. The results are reported in Table 3.
Table 3 Binary logit model estimation results: propensity to walk to transit station Unrestricted Model Restricted Model Variable Name
Coef. z P>|z| Coef. z P>|z| Constant 2.4352 7.81 0 2.1692 12.87 0 Distance -3.2359 -17.62 0 -3.2296 -17.64 0 Station Variables
Thonglor (BTS) -0.6972 -3.19 0.001 -0.7028 -3.22 0.001 Victory Monument (BTS) 0.4798 1.76 0.078 0.4495 1.67 0.094 Bangsue (MRT) -0.9814 -3.09 0.002 -0.9411 -2.99 0.003 Hua Lamphong (MRT) 1.0298 3.83 0 1.0308 3.84 0 Lat Phrao (MRT) 1.1515 4.93 0 1.1696 5.09 0 Sutthisan (MRT) -0.6149 -3.42 0.001 -0.6163 -3.45 0.001 Asok/Sukhumvit (Interchange Station) 0.3876 1.3 0.192 0.3688 1.24 0.215 Mo Chit/Chatuchak Park (Interchange Station) -2.4719 -3.31 0.001 -2.4342 -3.27 0.001
Socioeconomic Variables Gender (= 1 if traveler is female.) -0.0322 -0.25 0.802 Age (Year) -0.0073 -0.98 0.325 Student (= 1 if traveler is a student.) -0.0106 -0.06 0.955 Office work (= 1 if traveler is an office
worker.) 0.1233 0.78 0.438 Car Ownership (= 1 if household owns a car.) -0.1391 -1.06 0.289 Income (Thousand Baht) -0.0022 -0.78 0.435
No. of observations 1,720 1,720 LR chi-squared (p), p = number of parameters 812.66 808.83 Prob. > chi-squared 0 0 Log likelihood -785.88 -787.8 Pseudo R-squared 0.3408 0.3392 Percent correct prediction 78 78
The number of observations is 1,720, somewhat lower than that of the full data set as reported in Section 3, because we only included trips that were originated within the catchment area as defined above. All variables included in the model are specific to walking. Station variables, also specific to walking, are dummy variables which equal 1, if the trip is originated from that station, and 0, otherwise. Eight dummy variables for ten stations were included. Note that since one dummy variable was used for each pair of interchange stations. Dummy variables for the rest of the stations were not included, and so those stations can be thought of as a basis

Proceedings of the Eastern Asia Society for Transportation Studies, Vol.6, 2007
for comparing propensity to walk among all stations. In addition, six socioeconomic variables were considered in model specifications. We tested two specifications, unrestricted and restricted ones. While the former includes all six socioeconomic variables, restrictions were imposed on the latter, such that the coefficients of socioeconomic variables are all zero. Since estimation results of the unrestricted model show that none of the coefficients of socioeconomic variables is statistically significant, we used the Likelihood Ratio Test (LRT) to test the validity of the restricted model. The test statistic is –2(L(βR) – L(βU)), where L(βR) and L(βU) are the values of likelihood functions from estimations of restricted and unrestricted models, respectively. This test statistic is Chi-squared distributed with k degrees of freedom, where k is the number of restrictions imposed on the restricted models, which in this case is six. From the results in Table 3, we can compute the test statistic as follows: –2(L(βR) – L(βU)) = –2(–787.80 – (–785.88)) = 3.84 < =12.59 2
05.0,6χ Since the value of the test statistic is well below the critical value, we cannot reject the null hypothesis that the restrictions are true at the 5 percent level of significance. Therefore, we choose the restricted model for further considerations. The results in Table 3 show that the restricted model’s performance is acceptable, with the goodness of fit measure of 0.3392, which is within the normal range of travel mode choice studies, and 78 per cent of correct prediction. The coefficients of all variables are statistically significant at a 95 per cent confidence level except for dummy variables for Victory Monument and Asok/Sukhumvit stations. The constant term is highly significant and positive, reflecting the fact that walking is highly competitive within this data set. The distance variable is, as expected, also highly statistically significant and negative, implying decreasing propensity to walk with distance. It should also be noted that the magnitudes of estimated coefficients in restricted and unrestricted models are very similar, as are their statistical performances in terms of percent of correct prediction. As mentioned earlier, we tested several socioeconomic variables, such as gender, occupation, etc., and found that they are not significant determinant of the propensity to walk. This is unusual and contrary to evidence in the literature, but might reflect the unique behavioral characteristics of Bangkok’s residents. It may also imply that there is no sufficient variation in the data to estimate the socioeconomic effect. For example, residents of most neighborhoods that were survey have relatively similar range of household incomes. Also, there might be collinearity problems between socioeconomic characteristics and station characteristics. For example, the effect of income maybe captured partly by the station dummy variable, in the case of Thonglor, which is located in a high-income neighborhood. Another example is that car-ownership might not be able to explain the tendency to drive rather than to walk to a station as well as the availability of parking facilities at the station. In this case, the effect of this station’s characteristic also dominates the choice of access by walking as opposed to by car. Statistically significant and positive coefficients of Lat Phrao and Hua Lamphong station dummy variables imply that, after controlling for distance, the propensity to walk to these transit stations is the highest. These can be explained by two different reasons. Lat Phrao station is located in high-density residential area, and as evidence in the literature showed,

Proceedings of the Eastern Asia Society for Transportation Studies, Vol.6, 2007
such environment is conducive to walking. Hua Lamphong, on the contrary, is located near the center of Bangkok. The street network in this high-density commercial area is also dense, and may explain the high propensity to walk in the area. The coefficient of Victory Monument station variable is also positive, but it is significantly only at a 90 per cent confidence level. Land use characteristics of Victory Monument are similar to those of Hua Lamphong, but the station itself is somewhat more difficult to access. It is also a major transportation hub, as mentioned earlier, and may therefore be more attractive for travelers to use other modes to access this station than walking. Asok/Sukhumvit interchange station variable also has positive coefficient, but it is not statistically significant. The Mo Chit/Chatuchak Park interchange station has statistically significant and negative coefficient of the largest magnitude, implying that travelers accessing this station are least likely to walk than all other stations. Several factors may contribute to this result. First, the station was planned to serve the city’s main intercity bus terminal which was originally located adjacent to them, but poor planning and coordination, the terminal was moved to another location, approximately two kilometers away. The terminal is therefore notoriously difficult to access, and travelers have long complained about this problem. Secondly, the environments of this station are conducive to driving. The roads are wide and the network around the station area is sparse, thanks to the presence of the public park and the nearby weekend market. In addition, there is a huge park & ride facility with the capacity of over 600. Thirdly, the station is a terminal station of the BTS line and near the end of the MRT line. It is where many bus routes end, serving as feeder routes to the transit systems, and therefore a large number of transit passengers ride bus to this station. Thanks to all these factors, it is not so surprising that travelers accessing Mo Chit/Chatuchak Park station are much less likely to walk than those using other stations. The coefficients of both Bangsue and Thonglor station dummy variables are negative and statistically significant with similar magnitude, but probably due to different reasons. Bangsue is located in industrial area, with little residential land use. The station is integrated with a conventional rail station but is also located near the largest cement factory in Bangkok. In addition, there is somewhat limited sidewalk network to access the station. Bus and motorcycle taxi, rather than walking, are therefore the main modes to access Bangsue station. On the other hand, Thonglor is located in a mixed use, high-density residential and commercial area. The area is highly urbanized, with many condominiums, shops, restaurants, and offices. However, this is a high-income neighborhood, where residents usually own cars. The street network in the area is also dominated by numerous and winding Sois, sometimes with no sidewalks, which make it more much attractive to use motorcycle taxis than to walk. 6. CONCLUSION AND POLICY IMPLICATIONS In this research, we attempt to provide evidence to inform policy debates on how the conditions of Bangkok’s transit station accessibility can be improved. The results of this research, the first of its kind to be conducted in Thailand, provide an in-depth analysis of access trips at 14 transit stations in Bangkok. The results show that overall shares of the three most popular access modes: bus, motorcycle taxi, and walking, are 34.12, 15.82, and 15.26 per cent, respectively. The low share of walking, only about 15 per cent, to access transit stations is quite unusual in developing countries. Even within the catchment area, Bangkok’s share of walking is significantly lower than those in other cities with similar transit systems. This is so partly because of wide availability of motorcycle taxis, which is unique to the city.
Proceedings of the Eastern Asia Society for Transportation Studies, Vol.6, 2007
While motorized modes constitute much of transit access trips in Bangkok, the other “green” mode of access, bicycle, is virtually non-existent, due to unfavorable environments. The choice model results reveal that walking distance is not the only factor affecting the propensity to walk to transit stations. After controlling for the distance, we found that station-specific characteristics appear to have substantial influence on access behaviors. Different stations, with different walking amenities, physical characteristics, land use patterns, street network structure, and connectivity to other mode of transportation, seem to exert different levels of influence on the propensity to walk. For example, Mo Chit/Chatuchak Park Station, with environments that are highly inconducive to walking, such as sparse walkway network, and a great deal of driving amenities, shows great influence on travelers’ propensity not to walk. On the contrary, Lat Phrao station, which is located in high-density residential area, with extensive walkway network, seems to exert positive influence on traveler’s choice of walking to transit station. Lastly, the choice model results did not provide evidence that socioeconomic characteristics of travelers have influence over the propensity to walk to transit station within the catchment area. Taken together, the results show that there is substantial room for improvement of transit station access conditions in Bangkok, but concerted efforts by various agencies are necessary. The Bangkok Metropolitan Administration must improve conditions of sidewalks, by providing walking amenities, such as crosswalks, walkway covering, and lighting, and keep sidewalks free of obstructions, such as street vendors and stalls. The BMA’s long-run policies should incorporate the passing of Transit-Oriented Development zoning ordinances that bolster land use patterns that are conducive to walking and transit use. The Department of Land Transport must enforce effective regulation of for-hire modes, particularly motorcycle taxi, in order to make them safer, more secure, and reasonably priced. The DLT must also rationalize buses, by rerouting them to be more oriented toward feeder service. Transit agencies can help with provision of walking amenities such as elevators and escalators in order to achieve better walking experiences within transit station areas. Finally, the police can take part in improving security by patrolling walkway network around transit stations, as well as enforcing traffic rules to discourage aggressive and risky driving behaviors in transit station areas. Several aspects of this research can be improved upon. For example, the scope of the study can be expanded to include other transit stations in Bangkok area. Detailed surveys of land use and station characteristics may provide more variables that can be explicitly included in the analysis. Lastly, survey of passengers as well as travelers who are currently non-transit users for their opinion on how transit accessibility can be improved can help refine and validate the proposed policy prescriptions.

Proceedings of the Eastern Asia Society for Transportation Studies, Vol.6, 2007
ACKNOWLEDGEMENTS The authors would like to thank the Japanese International Cooperation Agency (JICA) for financial support. They also thank Professors Seiichi Kagaya, Alexis Fillone, and Kasem Choocharukul for their insightful and constructive comments. This research is part of the Transit Accessibility Improvement Project, a collaboration of Chulalongkorn University, De La Salle University, and Hokkaido University, under the support of JICA’s AUN/SEED-Net Program. The contents of this paper reflect the opinions of the authors, who are solely responsible for the accuracy of the data presented herein.
REFERENCES
Bangkok Mass Transit Design (BMTD) Consortium (2005) Feasibility Study Report for the
Remaining Extensions and New Routes, Mass Rapid Transit Authority of Thailand, Bangkok, Thailand.
Cervero, R. (2001) Walk-and-Ride: Factors Influencing Pedestrian Access to Transit, Journal of Public Transport, Vol.7, No. 3, 1-23.
Halden, D., McGuigan, D., Nisbet, A., and McKinnon, A. (2000), Accessibility: Review of Measuring Techniques and Their Application, Scottish Executive Central Research Unit.
Kean, A. and Tyler, N. (1999), Accessibility and Community-Centred Public Transport, Final Report, Centre for Transport Studies, University of London, London.
Loutzenheiser, D. R. (1997), Pedestrian Access to Transit, Model of Walk Trip and their Design and Urban Form Determinants Around Bay Area Rapid Transit Stations, Transportation Research Record, No 1604, TRB, National Research Council, Washington DC, 40-49.
Mitchell, C. G. B. and Stokes, R. G. F. (1982), Walking as a Mode Transport, TRRL Laboratory Report 1064, Transport and Road Research Laboratory, Department of the Environment, U.K. Department of Transport.
O’Sullivan, S. and Morrall, J. (1996), Walking Distances to and from Light-Rail Transit Stations, Transportation Research Record, No. 1538, TRB, National Research Council, Washington DC, 19-26.
Pikora, T. J., Giles-Corti, B., and Donovan, R. (2001), How Far will People Walk to Facilities in Their Local Neighbourhoods, Australia: Walking the 21st Century, Proceedings, Perth, West Australia, 26-31.
Rastogi, R. and Krishna Rao, K. V. (2003) Travel Characteristics of Commuter Accessing Transit: Case Study, Journal of Transportation Engineering, Vol. 129, No. 6, ASCE, 684-694
Shriver, K. (1996), Influence of Environmental Design on Pedestrian Travel Behavior in Four Austin Neighborhood, Transportation Research Record, No. 1578, TRB, National Research Council, Washington DC, 64-75.
Stringham, M. (1982), Travel Behavior Associated with Land Uses Adjacent to Rapid Transit Stations, ITE Journal, Vol. 52, No.4,16-18.
Vuchic, V. R. (2005), Urban Transit: Operations, Planning, and Economics, John Wiley & Son, Hoboken, New Jersey.
Wibowo, S. S. (2005), Modelling Walking Accessibility to Public Transport Terminals, Master’s Thesis, Department of Civil Engineering, Nanyang Technological University