transit overload
TRANSCRIPT

8/6/2019 Transit Overload
http://slidepdf.com/reader/full/transit-overload 1/14
Facing a crippling budget shortfall, the Metropolitan Transportation Authority(MTA) is threatening to make 318 proposed service cuts to subway and buslines across the five boroughs—meaning longer waits and more crowded andunpleasant rides as well as a number of subway lines and bus routes shut downaltogether. But even as these cuts loom, subway and bus ridership in 2008 washigher than at anytime since 1965.1 Moreover, although the cuts will have themost impact on people who live or work in the boroughs outside of Manhattan,our data shows that the number of daily transit riders in those areas has increased
dramatically more in the last ten years than in Manhattan.In this issue of New York by the Numbers, the Center for an Urban Future’smonthly economic snapshot of the five boroughs, we take a look at the increasein average weekday ridership between 1998 and 2008 for every subway stationin New York City and for bus riders per borough. Our analysis, based on datafrom MTA New York City Transit, show just how important the city ’s public trans-portation system has become for residents living outside the city center:
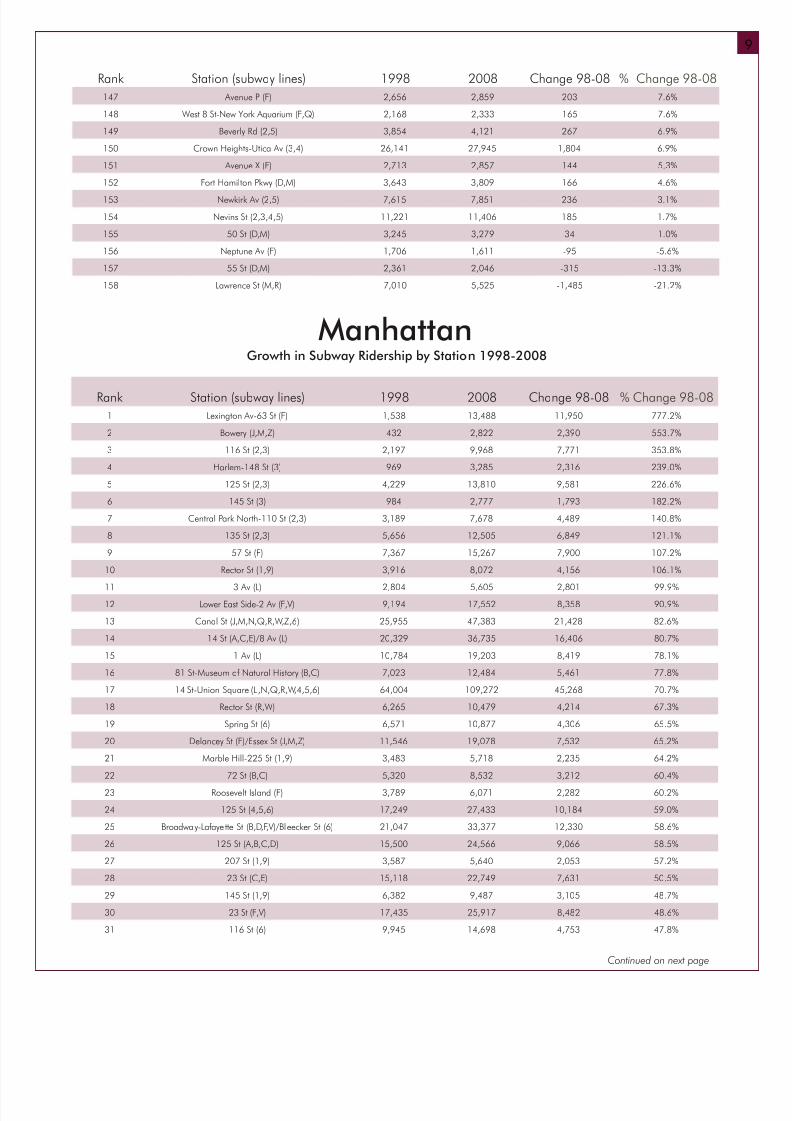
• 20 of the 22 stations with the largest percentage increase in subway ridershipwere either in the outer boroughs or in Manhattan north of 96th Street.
• In 2008, 62 stations outside of Manhattan had an average weekday rider -ship of over 10,000 people, up significantly from 46 stations in 2003 and 36 in1998.
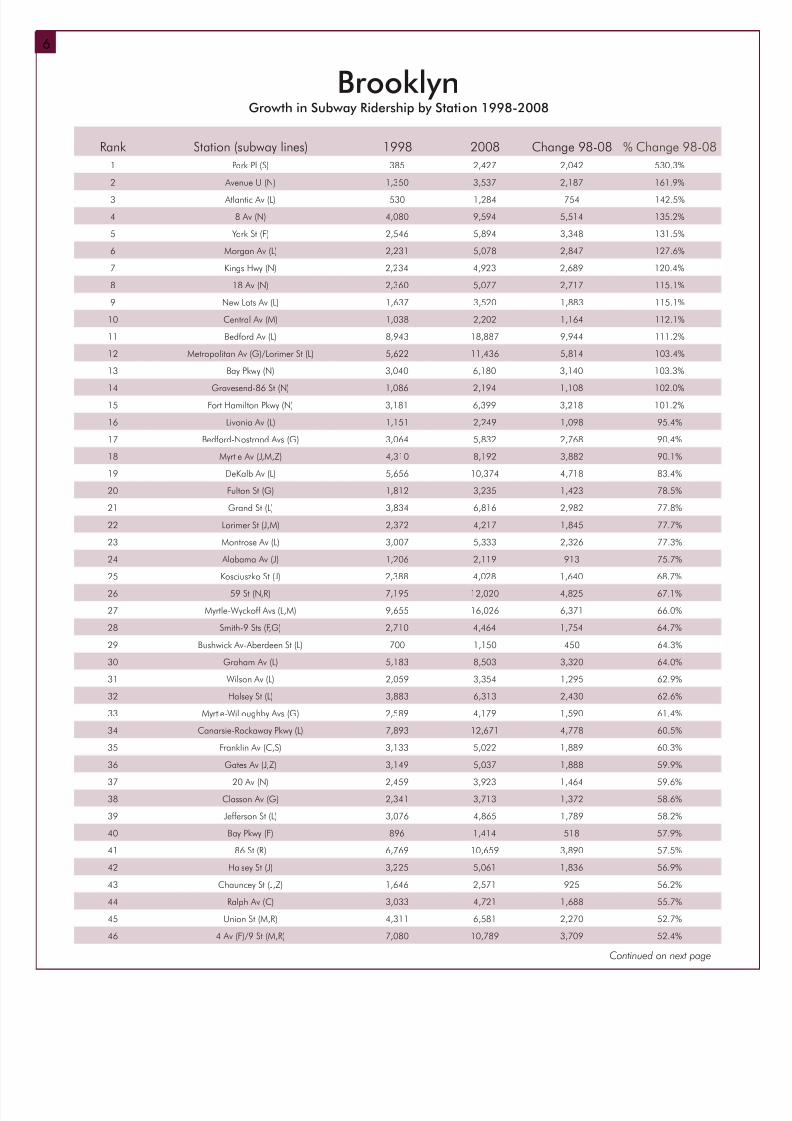
• More than a quarter of all New York City subway stations—111 out of 425—saw an increase in average weekday ridership of 50 percent or more during thepast decade. Brooklyn accounted for nearly half (51) of those stations; there were28 in Manhattan, 20 in the Bronx and 12 in Queens.
• 13 stations on the L line and nine on the N line were among the 50 fastestgrowing stations citywide. Other lines with several stations on the top-50 list: the2 (seven stations), 3 (six stations), F (five stations), J (five stations) and M (fivestations).
The growth in outer-borough bus ridership, meanwhile, dwarfed Manhattan’sduring the same period. Overall, 81.7 percent of the gain in bus riders occurredoutside Manhattan. Queens experienced a 28.4 percent increase; Brooklyn a21.9 percent increase; the Bronx a 23.5 percent increase and Staten Island a28.4 percent increase. By contrast, Manhattan’s bus ridership grew by only 7.6
percent since 1998. (It actually experienced a 6.7 percent decrease between2003 and 2008, the only borough to do so.)
The Center’s recent report on the challenges facing New York’s middle class,Reviving the City of Aspiration, showed that commute times were an increasinglyimportant quality of life issue for many residents in the city’s outer boroughs. Thisnew data makes a strong case that these residents should be seeing an increasein services rather than a dramatic cut—and it suggests that elected officials rep-resenting neighborhoods in Staten Island, Brooklyn, Queens and the Bronx mightbe well-served to pay as much or more attention to their transit-riding constituentsas to the relative handful of car drivers into Manhattan.
The Center for an UrbanFuture is New York City’shome for independentresearch and innova-tive thinking about keyissues affecting the fiveboroughs.
In this Issue:
Transit Overload: A station-by-station examination of subway ridership growth over the past decade
www.nycfuture.org
New York by the NumbersEconomic snapshots of the five boroughs
March 2009 Volume 2 • Issue 1
Inside
Subway RidershipGrowth:
Citywide:
Top 100 Stations bypercentage growth1998-2008
Subway lines with themost fast growingstations
By Borough:
Bronx
Brooklyn
Manhattan
Queens
Bus RidershipGrowth:
Percentage growth inbus ridership: 1998-2008 & 2003-2008
p. 2-3
p. 4
p. 4-5
p. 6-9
p. 9-11
p. 12-13
p. 14

8/6/2019 Transit Overload
http://slidepdf.com/reader/full/transit-overload 2/14
Rank Borough Station (subway lines) 1998 2008 Change98-08
% Change98-08
1 Manhattan Lexington Av-63 St (F) 1,538 13,488 11,950 777.2%
2 Manhattan Bowery (J,M,Z) 432 2,822 2,390 553.7%
3 Brooklyn Park Pl (S) 385 2,427 2,042 530.3%
4 Manhattan 116 St (2,3) 2,197 9,968 7,771 353.8%
5 Queens 21 St-Queensbridge (F) 2,088 7,374 5,286 253.1%
6 Manhattan Harlem-148 St (3) 969 3,285 2,316 239.0%
7 Manhattan 125 St (2,3) 4,229 13,810 9,581 226.6%
8 Queens 45 Rd-Court House Sq (7) 3,410 9,848 6,438 188.8%
9 Manhattan 145 St (3) 984 2,777 1,793 182.2%
10 Brooklyn Avenue U (N) 1,350 3,537 2,187 161.9%
11 Brooklyn Atlantic Av (L) 530 1,284 754 142.5%
12 Manhattan Central Park North-110 St (2,3) 3,189 7,678 4,489 140.8%
13 Brooklyn 8 Av (N) 4,080 9,594 5,514 135.2%
14 Brooklyn York St (F) 2,546 5,894 3,348 131.5%
15 Brooklyn Morgan Av (L) 2,231 5,078 2,847 127.6%
16 Queens Willets Point-Shea Stadium (7) 2,411 5,406 2,995 124.3%
17 Manhattan 135 St (2,3) 5,656 12,505 6,849 121.1%
18 Brooklyn Kings Hwy (N) 2,234 4,923 2,689 120.4%
19 Brooklyn 18 Av (N) 2,360 5,077 2,717 115.1%
20 Brooklyn New Lots Av (L) 1,637 3,520 1,883 115.1%
21 Brooklyn Central Av (M) 1,038 2,202 1,164 112.1%
22 Brooklyn Bedford Av (L) 8,943 18,887 9,944 111.2%
23 Manhattan 57 St (F) 7,367 15,267 7,900 107.2%
24 Manhattan Rector St (1,9) 3,916 8,072 4,156 106.1%
25 Brooklyn Metropolitan Av (G)/Lorimer St (L) 5,622 11,436 5,814 103.4%
26 Brooklyn Bay Pkwy (N) 3,040 6,180 3,140 103.3%
27 Brooklyn Gravesend-86 St (N) 1,086 2,194 1,108 102.0%
28 Brooklyn Fort Hamilton Pkwy (N) 3,181 6,399 3,218 101.2%
29 Manhattan 3 Av (L) 2,804 5,605 2,801 99.9%
30 Bronx Bronx Park East (2,5) 1,450 2,897 1,447 99.9%
31 Brooklyn Livonia Av (L) 1,151 2,249 1,098 95.4%
32 Manhattan Lower East Side-2 Av (F,V) 9,194 17,552 8,358 90.9%
33 Brooklyn Bedford-Nostrand Avs (G) 3,064 5,832 2,768 90.4%
34 Brooklyn Myrtle Av (J,M,Z) 4,310 8,192 3,882 90.1%
35 Brooklyn DeKalb Av (L) 5,656 10,374 4,718 83.4%
36 Manhattan Canal St (J,M,N,Q,R,W,Z,6) 25,955 47,383 21,428 82.6%
37 Manhattan 14 St (A,C,E)/8 Av (L) 20,329 36,735 16,406 80.7%
38 Queens 23 St-Ely Av (E,V, G) 10,708 19,194 8,486 79.2%
39 Brooklyn Fulton St (G) 1,812 3,235 1,423 78.5%
40 Manhattan 1 Av (L) 10,784 19,203 8,419 78.1%
41 Brooklyn Grand St (L) 3,834 6,816 2,982 77.8%
42 Manhattan 81 St-Museum of Natural History (B,C) 7,023 12,484 5,461 77.8%
43 Brooklyn Lorimer St (J,M) 2,372 4,217 1,845 77.7%
44 Brooklyn Montrose Av (L) 3,007 5,333 2,326 77.3%
45 Brooklyn Alabama Av (J) 1,206 2,119 913 75.7%
46 Bronx Simpson St (2,5) 5,371 9,375 4,004 74.5%
47 Bronx 174 St (2,5) 4,004 6,876 2,872 71.7%
48 Manhattan 14 St-Union Square (L ,N,Q,R,W,4,5,6) 64,004 109,272 45,268 70.7%
49 Queens Beach 36 St (A) 518 881 363 70.2%
Top 100 stations ranked by percentage growth in subway ridership from 1998 to 20082
Continued on next page

8/6/2019 Transit Overload
http://slidepdf.com/reader/full/transit-overload 3/14
Rank Borough Station (subway lines) 1998 2008 Change98-08
% Change98-08
50 Brooklyn Kosciuszko St (J) 2,388 4,028 1,640 68.7%
51 Bronx Prospect Av (2,5) 4,428 7,457 3,029 68.4%
52 Bronx Woodlawn (4) 4,001 6,723 2,722 68.1%
53 Bronx Freeman St (2,5) 2,163 3,635 1,472 68.0%
54 Bronx Gun Hill Rd (2,5) 3,588 6,005 2,417 67.3%
55 Manhattan Rector St (R,W) 6,265 10,479 4,214 67.3%
56 Bronx 3 Av-138 St (6) 4,115 6,878 2,763 67.1%
57 Brooklyn 59 St (N,R) 7,195 12,020 4,825 67.1%
58 Bronx Jackson Av (2,5) 3,048 5,089 2,041 67.0%
59 Queens Beach 44 St (A) 362 604 242 66.9%
60 Bronx Cypress Av (6) 2,204 3,670 1,466 66.5%
61 Brooklyn Myrtle-Wyckoff Avs (L,M) 9,655 16,026 6,371 66.0%
62 Manhattan Spring St (6) 6,571 10,877 4,306 65.5%
63 Manhattan Delancey St (F)/Essex St (J,M,Z) 11,546 19,078 7,532 65.2%
64 Brooklyn Smith-9 Sts (F,G) 2,710 4,464 1,754 64.7%
65 Queens 39 Av (N,W) 1,381 2,269 888 64.3%
66 Brooklyn Bushwick Av-Aberdeen St (L) 700 1,150 450 64.3%
67 Manhattan Marble Hill-225 St (1,9) 3,483 5,718 2,235 64.2%
68 Brooklyn Graham Av (L) 5,183 8,503 3,320 64.0%
69 Brooklyn Wilson Av (L) 2,059 3,354 1,295 62.9%
70 Brooklyn Halsey St (L) 3,883 6,313 2,430 62.6%
71 Queens Vernon Blvd-Jackson Av (7) 5,872 9,541 3,669 62.5%
72 Bronx Intervale Av (2,5) 1,714 2,775 1,061 61.9%
73 Brooklyn Myrtle-Willoughby Avs (G) 2,589 4,179 1,590 61.4%
74 Queens Hunters Point Av (7) 4,143 6,655 2,512 60.6%
75 Brooklyn Canarsie-Rockaway Pkwy (L) 7,893 12,671 4,778 60.5%
76 Bronx 238 St (1) 2,293 3,681 1,388 60.5%
77 Manhattan 72 St (B,C) 5,320 8,532 3,212 60.4%
78 Bronx Pelham Pkwy (2,5) 5,064 8,116 3,052 60.3%
79 Brooklyn Franklin Av (C,S) 3,133 5,022 1,889 60.3%
80 Manhattan Roosevelt Island (F) 3,789 6,071 2,282 60.2%
81 Queens Grand Av-Newtown (R,V,G) 11,106 17,789 6,683 60.2%
82 Brooklyn Gates Av (J,Z) 3,149 5,037 1,888 59.9%
83 Brooklyn 20 Av (N) 2,459 3,923 1,464 59.6%
84 Manhattan 125 St (4,5,6) 17,249 27,433 10,184 59.0%
85 Brooklyn Classon Av (G) 2,341 3,713 1,372 58.6%
86 Manhattan Broadway-Lafayette St (B,D,F,V)/Bleecker St (6) 21,047 33,377 12,330 58.6%
87 Manhattan 125 St (A,B,C,D) 15,500 24,566 9,066 58.5%
88 Brooklyn Jefferson St (L) 3,076 4,865 1,789 58.2%
89 Brooklyn Bay Pkwy (F) 896 1,414 518 57.9%
90 Brooklyn 86 St (R) 6,769 10,659 3,890 57.5%
91 Manhattan 207 St (1,9) 3,587 5,640 2,053 57.2%
92 Bronx West Farms Sq-East Tremont Av (2,5) 4,677 7,348 2,671 57.1%
93 Brooklyn Halsey St (J) 3,225 5,061 1,836 56.9%
94 Brooklyn Chauncey St (J,Z) 1,646 2,571 925 56.2%
95 Bronx Zerega Av (6) 1,574 2,455 881 56.0%
96 Brooklyn Ralph Av (C) 3,033 4,721 1,688 55.7%
97 Queens Woodhaven Blvd (J,Z) 2,685 4,173 1,488 55.4%
98 Bronx Whitlock Av (6) 987 1,524 537 54.4%
99 Bronx East 149 St (6) 2,851 4,386 1,535 53.8%
100 Queens Sutphin Blvd-Archer Av-JFK Airport (E,J,Z) 13,156 20,138 6,982 53.1%

8/6/2019 Transit Overload
http://slidepdf.com/reader/full/transit-overload 4/14
Continued on next page
4
Growth in Subway Ridership by Station 1998-2008
Bronx
0
3
6
9
12
15
13
9
7 6
5 5 5 4 4
5GMJF32NL
N u m b e r o f S
t a t i o n s
i n
T o p 5
0
Subway Line
Subway Lines with the Most Stations amongthe 50 Fastest Growing Stations 1998-2008
Rank Station (subway lines) 1998 2008 Change 98-08 % Change 98-08
1 Bronx Park East (2,5) 1,450 2,897 1,447 99.9%
2 Simpson St (2,5) 5,371 9,375 4,004 74.5%
3 174 St (2,5) 4,004 6,876 2,872 71.7%
4 Westchester Square-E Tremont Av (6) 3,719 6,322 2,603 70.0%
5 Prospect Av (2,5) 4,428 7,457 3,029 68.4%
6 Woodlawn (4) 4,001 6,723 2,722 68.1%
7 Freeman St (2,5) 2,163 3,635 1,472 68.0%
8 Gun Hill Rd (2,5) 3,588 6,005 2,417 67.3%
9 3 Av-138 St (6) 4,115 6,878 2,763 67.1%
10 Jackson Av (2,5) 3,048 5,089 2,041 67.0%
11 Cypress Av (6) 2,204 3,670 1,466 66.5%
12 Intervale Av (2,5) 1,714 2,775 1,061 61.9%
13 238 St (1) 2,293 3,681 1,388 60.5%
14 Pelham Pkwy (2,5) 5,064 8,116 3,052 60.3%
15 West Farms Sq-East Tremont Av (2,5) 4,677 7,348 2,671 57.1%
16 Zerega Av (6) 1,574 2,455 881 56.0%
17 Whitlock Av (6) 987 1,524 537 54.4%18 East 149 St (6) 2,851 4,386 1,535 53.8%
19 Fordham Rd (4) 7,571 11,511 3,940 52.0%
20 East 180 St (2,5) 4,282 6,428 2,146 50.1%
21 170 St (4) 5,823 8,661 2,838 48.7%
22 Hunts Point Av (6) 7,141 10,612 3,471 48.6%
23 3 Av-149 St (2,5) 16,072 23,859 7,787 48.5%
24 Brook Av (6) 3,991 5,877 1,886 47.3%
25 Bedford Park Blvd-Lehman College (4) 3,749 5,519 1,770 47.2%
26 Longwood Av (6) 2,289 3,352 1,063 46.4%

8/6/2019 Transit Overload
http://slidepdf.com/reader/full/transit-overload 5/14
Rank Station (subway lines) 1998 2008 Change 98-08 % Change 98-08
27 Elder Av (6) 4,493 6,480 1,987 44.2%
28 149 St-Grand Concourse (2,4,5) 7,980 11,395 3,415 42.8%
29 138 St-Grand Concourse (4,5) 2,059 2,926 867 42.1%
30 225 St (2,5) 2,686 3,798 1,112 41.4%
31 167 St (4) 6,461 9,125 2,664 41.2%
32 Pelham Bay Park (6) 4,439 6,262 1,823 41.1%
33 Tremont Av (B,D) 6,311 8,842 2,531 40.1%
34 Pelham Pkwy (5) 2,189 3,054 865 39.5%
35 161 St-Yankee Stadium (B,D,4) 19,213 26,511 7,298 38.0%
36 Middletown Rd (6) 1,306 1,796 490 37.6%
37 Fordham Rd (B,D) 8,424 11,576 3,152 37.4%
38 167 St (B,D) 6,504 8,913 2,409 37.0%
39 Buhre Av (6) 2,190 2,975 785 35.9%
40 Eastchester-Dyre Av (5) 3,175 4,301 1,126 35.4%
41 East 143 St-St Mary’s St (6) 667 899 232 34.9%
42 Wakefield-241 St (2) 3,188 4,257 1,069 33.5%
43 219 St (2,5) 2,235 2,982 747 33.5%
44 183 St (4) 4,432 5,890 1,458 32.9%
45 Allerton Av (2,5) 3,910 5,179 1,269 32.4%
46 Burnside Av (4) 7,916 10,433 2,517 31.8%
47 St Lawrence Av (6) 3,064 4,036 972 31.7%
48 170 St (B,D) 4,875 6,421 1,546 31.7%
49 Baychester Av (5) 2,991 3,924 933 31.2%
50 Morrison-Sound View Avs (6) 4,863 6,352 1,489 30.6%
51 Castle Hill Av (6) 5,346 6,969 1,623 30.4%
52 Morris Park (5) 1,504 1,957 453 30.2%
53 Parkchester (6) 11,694 15,189 3,495 29.9%
54 Nereid Av (2,5) 2,411 3,107 696 28.8%
55 Kingsbridge Rd (4) 6,993 8,980 1,987 28.4%
56 Bedford Park Blvd (B,D) 4,927 6,317 1,390 28.2%
57 Burke Av (2,5) 2,641 3,380 739 28.0%
58 176 St (4) 3,998 5,105 1,107 27.7%
59 Mt Eden Av (4) 4,117 5,174 1,057 25.7%
60 182-183 Sts (B,D) 3,784 4,747 963 25.4%
61 174-175 Sts (B,D) 3,903 4,822 919 23.5%
62 Van Cortlandt Park-242 St (1,9) 5,013 6,184 1,171 23.4%
63 231 St (1,9) 7,119 8,670 1,551 21.8%
64 Norwood-205 St (D) 6,480 7,869 1,389 21.4%
65 Gun Hill Rd (5) 4,965 6,025 1,060 21.3%
66 Kingsbridge Rd (B,D) 6,500 7,788 1,288 19.8%
67 233 St (2,5) 4,048 4,834 786 19.4%
68 Mosholu Pkwy (4) 7,189 8,468 1,279 17.8%
8/6/2019 Transit Overload
http://slidepdf.com/reader/full/transit-overload 6/14
Continued on next page
6
BrooklynGrowth in Subway Ridership by Station 1998-2008
Rank Station (subway lines) 1998 2008 Change 98-08 % Change 98-08
1 Park Pl (S) 385 2,427 2,042 530.3%
2 Avenue U (N) 1,350 3,537 2,187 161.9%
3 Atlantic Av (L) 530 1,284 754 142.5%
4 8 Av (N) 4,080 9,594 5,514 135.2%
5 York St (F) 2,546 5,894 3,348 131.5%
6 Morgan Av (L) 2,231 5,078 2,847 127.6%
7 Kings Hwy (N) 2,234 4,923 2,689 120.4%
8 18 Av (N) 2,360 5,077 2,717 115.1%
9 New Lots Av (L) 1,637 3,520 1,883 115.1%
10 Central Av (M) 1,038 2,202 1,164 112.1%
11 Bedford Av (L) 8,943 18,887 9,944 111.2%
12 Metropolitan Av (G)/Lorimer St (L) 5,622 11,436 5,814 103.4%
13 Bay Pkwy (N) 3,040 6,180 3,140 103.3%
14 Gravesend-86 St (N) 1,086 2,194 1,108 102.0%15 Fort Hamilton Pkwy (N) 3,181 6,399 3,218 101.2%
16 Livonia Av (L) 1,151 2,249 1,098 95.4%
17 Bedford-Nostrand Avs (G) 3,064 5,832 2,768 90.4%
18 Myrtle Av (J,M,Z) 4,310 8,192 3,882 90.1%
19 DeKalb Av (L) 5,656 10,374 4,718 83.4%
20 Fulton St (G) 1,812 3,235 1,423 78.5%
21 Grand St (L) 3,834 6,816 2,982 77.8%
22 Lorimer St (J,M) 2,372 4,217 1,845 77.7%
23 Montrose Av (L) 3,007 5,333 2,326 77.3%
24 Alabama Av (J) 1,206 2,119 913 75.7%
25 Kosciuszko St (J) 2,388 4,028 1,640 68.7%
26 59 St (N,R) 7,195 12,020 4,825 67.1%
27 Myrtle-Wyckoff Avs (L,M) 9,655 16,026 6,371 66.0%
28 Smith-9 Sts (F,G) 2,710 4,464 1,754 64.7%
29 Bushwick Av-Aberdeen St (L) 700 1,150 450 64.3%
30 Graham Av (L) 5,183 8,503 3,320 64.0%
31 Wilson Av (L) 2,059 3,354 1,295 62.9%
32 Halsey St (L) 3,883 6,313 2,430 62.6%
33 Myrtle-Willoughby Avs (G) 2,589 4,179 1,590 61.4%
34 Canarsie-Rockaway Pkwy (L) 7,893 12,671 4,778 60.5%
35 Franklin Av (C,S) 3,133 5,022 1,889 60.3%
36 Gates Av (J,Z) 3,149 5,037 1,888 59.9%
37 20 Av (N) 2,459 3,923 1,464 59.6%38 Classon Av (G) 2,341 3,713 1,372 58.6%
39 Jefferson St (L) 3,076 4,865 1,789 58.2%
40 Bay Pkwy (F) 896 1,414 518 57.9%
41 86 St (R) 6,769 10,659 3,890 57.5%
42 Halsey St (J) 3,225 5,061 1,836 56.9%
43 Chauncey St (J,Z) 1,646 2,571 925 56.2%
44 Ralph Av (C) 3,033 4,721 1,688 55.7%
45 Union St (M,R) 4,311 6,581 2,270 52.7%
46 4 Av (F)/9 St (M,R) 7,080 10,789 3,709 52.4%

8/6/2019 Transit Overload
http://slidepdf.com/reader/full/transit-overload 7/14
Continued on next page
Rank Station (subway lines) 1998 2008 Change 98-08 % Change 98-08
47 Marcy Av (J,M,Z) 6,072 9,217 3,145 51.8%
48 Fort Hamilton Pkwy (F) 3,166 4,805 1,639 51.8%
49 Brighton Beach (B,Q) 8,612 13,064 4,452 51.7%
50 Flushing Av (J,M) 4,870 7,378 2,508 51.5%
51 High St (A,C) 4,024 6,089 2,065 51.3%
52 Bergen St (F,G) 6,706 10,038 3,332 49.7%
53 Atlantic Av (B,Q,2,3,4,5)/Pacific St (D,M,N,R) 21,155 31,657 10,502 49.6%
54 Prospect Av (M,R) 4,050 6,042 1,992 49.2%
55 Cypress Hills (J) 940 1,393 453 48.2%
56 Utica Av (A,C) 9,485 14,057 4,572 48.2%
57 Sutter Av (L) 2,400 3,556 1,156 48.1%
58 Hewes St (J,M) 1,463 2,143 680 46.5%
59 East 105 St (L) 2,333 3,414 1,081 46.4%
60 Clinton-Washington Avs (C) 3,535 5,153 1,618 45.8%
61 Broadway Junction (A,C,J,L,Z) 6,115 8,913 2,798 45.8%
62 18 Av (D,M) 3,901 5,667 1,766 45.3%
63 New Utrecht Av (N)/62 St (D,M) 3,568 5,161 1,593 44.6%
64 Prospect Park (B,Q,S) 6,010 8,675 2,665 44.3%
65 36 St (D,M,N,R) 7,727 11,151 3,424 44.3%
66 25 St (M,R) 2,677 3,859 1,182 44.1%
67 79 St (D,M) 4,014 5,775 1,761 43.9%
68 9 Av (D,M) 4,330 6,152 1,822 42.1%
69 Shepherd Av (C) 2,169 3,076 907 41.8%
70 New Lots Av (3) 4,143 5,874 1,731 41.8%
71 45 St (R) 5,238 7,303 2,065 39.4%
72 53 St (R) 5,496 7,648 2,152 39.1%
73 Broadway (G) 2,417 3,352 935 38.7%
74 Coney Island-Stillwell Av (D,F,Q) 9,017 12,488 3,471 38.5%
75 Nostrand Av (A,C) 11,344 15,658 4,314 38.0%
76 Rockaway Av (C) 3,559 4,889 1,330 37.4%
77 Sheepshead Bay (B,Q) 10,858 14,899 4,041 37.2%
78 Clinton-Washington Avs (G) 3,459 4,728 1,269 36.7%
79 Bay Ridge Av (R) 6,107 8,215 2,108 34.5%
80 Hoyt-Schermerhorn Sts (A,C,G) 7,102 9,553 2,451 34.5%
81 Kings Hwy (B,Q) 14,288 19,193 4,905 34.3%
82 Lafayette Av (C) 3,376 4,518 1,142 33.8%
83 77 St (R) 3,960 5,236 1,276 32.2%
84 Jay St-Borough Hall (A,C,F) 23,538 31,071 7,533 32.0%
85 Bergen St (2,3) 3,058 4,033 975 31.9%
86 Carroll St (F,G) 7,643 10,051 2,408 31.5%
87 Euclid Av (A,C) 7,434 9,722 2,288 30.8%
88 Van Siclen Av (C) 2,226 2,903 678 30.4%
89 Knickerbocker Av (M) 2,458 3,204 746 30.4%
90 President St (2,5) 2,681 3,492 811 30.3%
91 Newkirk Av (B,Q) 7,692 10,004 2,312 30.0%
92 15 St-Prospect Park (F) 4,619 6,002 1,383 29.9%
93 Junius St (3) 1,625 2,105 480 29.5%
94 Norwood Av (J,Z) 2,618 3,390 772 29.5%
95 Cortelyou Rd (Q) 4,775 6,171 1,396 29.2%
96 Avenue J (Q) 5,035 6,506 1,471 29.2%

8/6/2019 Transit Overload
http://slidepdf.com/reader/full/transit-overload 8/14
Continued on next page
8
Rank Station (subway lines) 1998 2008 Change 98-08 % Change 98-08
97 Avenue M (Q) 4,803 6,188 1,385 28.8%
98 Clark St (2,3) 4,055 5,221 1,166 28.7%
99 7 Av (B,Q) 7,474 9,590 2,116 28.3%
100 Franklin Av (2,3,4,5)/Botanic Garden (S) 10,613 13,537 2,924 27.6%
101 Bay Pkwy (D,M) 5,473 6,979 1,506 27.5%
102 DeKalb Av (B,M,Q,R) 13,168 16,724 3,556 27.0%
103 Pennsylvania Av (3) 4,699 5,964 1,265 26.9%
104 Van Siclen Av (J,Z) 1,921 2,437 516 26.8%
105 Sutter Av-Rutland Rd (3) 5,926 7,495 1,569 26.5%
106 Winthrop St (2,5) 5,445 6,862 1,417 26.0%
107 Ocean Pkwy (Q) 2,387 2,992 605 25.3%
108 7 Av (F) 8,827 10,903 2,076 23.5%
109 Bay Ridge-95 St (R) 4,636 5,722 1,086 23.4%
110 Hoyt St (2,3) 5,363 6,613 1,250 23.3%
111 Crescent St (J,Z) 3,602 4,429 827 22.9%
112 Avenue H (Q) 2,295 2,820 525 22.9%
113 Nassau Av (G) 6,345 7,782 1,437 22.7%
114 18 Av (F) 3,436 4,209 773 22.5%115 Rockaway Av (3) 4,839 5,828 989 20.4%
116 Church Av (B,Q) 13,547 16,295 2,748 20.3%
117 Church Av (F) 7,752 9,305 1,553 20.0%
118 25 Av (D) 3,708 4,445 737 19.9%
119 Cleveland St (J) 2,457 2,943 486 19.8%
120 20 Av (D,M) 3,916 4,680 764 19.5%
121 Neck Rd (Q) 3,177 3,796 619 19.5%
122 Court St (M,R)/Borough Hall (2,3,4,5) 30,700 36,639 5,939 19.3%
123 Brooklyn College-Flatbush Av (2,5) 17,118 20,338 3,220 18.8%
124 Parkside Av (Q) 4,755 5,648 893 18.8%
125 Avenue N (F) 2,947 3,493 546 18.5%
126 Flushing Av (G) 1,666 1,974 308 18.5%
127 Avenue U (Q) 6,077 7,173 1,096 18.0%
128 Beverley Rd (Q) 2,462 2,875 413 16.8%
129 Ditmas Av (F) 4,054 4,728 674 16.6%
130 Grant Av (A) 5,292 6,170 878 16.6%
131 Eastern Pkwy-Brooklyn Museum (2,3) 4,159 4,842 683 16.4%
132 Van Siclen Av (3) 2,671 3,090 419 15.7%
133 Greenpoint Av (G) 6,637 7,660 1,023 15.4%
134 Saratoga Av (3) 4,858 5,572 714 14.7%
135 Nostrand Av (3) 3,394 3,891 497 14.7%
136 Kings Hwy (F) 3,083 3,513 430 14.0%
137 Bay 50 St (D) 2,481 2,820 339 13.7%
138 Liberty Av (C) 2,612 2,960 348 13.3%
139 Avenue I (F) 2,140 2,422 282 13.2%
140 Sterling St (2,5) 4,861 5,417 556 11.4%
141 Church Av (2,5) 8,585 9,539 954 11.1%
142 71 St (D,M) 4,088 4,538 450 11.0%
143 Kingston-Throop Avs (C) 4,513 4,962 449 9.9%
144 Grand Army Plaza (2,3) 7,206 7,841 635 8.8%
145 Kingston Av (3) 4,569 4,947 378 8.3%
146 Avenue U (F) 1,990 2,153 163 8.2%
8/6/2019 Transit Overload
http://slidepdf.com/reader/full/transit-overload 9/14
Continued on next page
Rank Station (subway lines) 1998 2008 Change 98-08 % Change 98-08
147 Avenue P (F) 2,656 2,859 203 7.6%
148 West 8 St-New York Aquarium (F,Q) 2,168 2,333 165 7.6%
149 Beverly Rd (2,5) 3,854 4,121 267 6.9%
150 Crown Heights-Utica Av (3,4) 26,141 27,945 1,804 6.9%
151 Avenue X (F) 2,713 2,857 144 5.3%
152 Fort Hamilton Pkwy (D,M) 3,643 3,809 166 4.6%
153 Newkirk Av (2,5) 7,615 7,851 236 3.1%
154 Nevins St (2,3,4,5) 11,221 11,406 185 1.7%
155 50 St (D,M) 3,245 3,279 34 1.0%
156 Neptune Av (F) 1,706 1,611 -95 -5.6%
157 55 St (D,M) 2,361 2,046 -315 -13.3%
158 Lawrence St (M,R) 7,010 5,525 -1,485 -21.2%
ManhattanGrowth in Subway Ridership by Station 1998-2008
Rank Station (subway lines) 1998 2008 Change 98-08 % Change 98-08
1 Lexington Av-63 St (F) 1,538 13,488 11,950 777.2%
2 Bowery (J,M,Z) 432 2,822 2,390 553.7%
3 116 St (2,3) 2,197 9,968 7,771 353.8%
4 Harlem-148 St (3) 969 3,285 2,316 239.0%
5 125 St (2,3) 4,229 13,810 9,581 226.6%
6 145 St (3) 984 2,777 1,793 182.2%
7 Central Park North-110 St (2,3) 3,189 7,678 4,489 140.8%
8 135 St (2,3) 5,656 12,505 6,849 121.1%
9 57 St (F) 7,367 15,267 7,900 107.2%
10 Rector St (1,9) 3,916 8,072 4,156 106.1%
11 3 Av (L) 2,804 5,605 2,801 99.9%12 Lower East Side-2 Av (F,V) 9,194 17,552 8,358 90.9%
13 Canal St (J,M,N,Q,R,W,Z,6) 25,955 47,383 21,428 82.6%
14 14 St (A,C,E)/8 Av (L) 20,329 36,735 16,406 80.7%
15 1 Av (L) 10,784 19,203 8,419 78.1%
16 81 St-Museum of Natural History (B,C) 7,023 12,484 5,461 77.8%
17 14 St-Union Square (L ,N,Q,R,W,4,5,6) 64,004 109,272 45,268 70.7%
18 Rector St (R,W) 6,265 10,479 4,214 67.3%
19 Spring St (6) 6,571 10,877 4,306 65.5%
20 Delancey St (F)/Essex St (J,M,Z) 11,546 19,078 7,532 65.2%
21 Marble Hill-225 St (1,9) 3,483 5,718 2,235 64.2%
22 72 St (B,C) 5,320 8,532 3,212 60.4%
23 Roosevelt Island (F) 3,789 6,071 2,282 60.2%
24 125 St (4,5,6) 17,249 27,433 10,184 59.0%
25 Broadway-Lafayette St (B,D,F,V)/Bleecker St (6) 21,047 33,377 12,330 58.6%
26 125 St (A,B,C,D) 15,500 24,566 9,066 58.5%
27 207 St (1,9) 3,587 5,640 2,053 57.2%
28 23 St (C,E) 15,118 22,749 7,631 50.5%
29 145 St (1,9) 6,382 9,487 3,105 48.7%
30 23 St (F,V) 17,435 25,917 8,482 48.6%
31 116 St (6) 9,945 14,698 4,753 47.8%

8/6/2019 Transit Overload
http://slidepdf.com/reader/full/transit-overload 10/14
Continued on next page
10
Rank Station (subway lines) 1998 2008 Change 98-08 % Change 98-08
32 103 St (B,C) 3,385 4,961 1,576 46.6%
33 181 St (1,9) 7,620 11,133 3,513 46.1%
34 168 St-Washington Heights (A,C,1,9) 16,117 23,458 7,341 45.6%
35 Times Sq-42 St (N,Q,R,S,W,1,2,3,7,9)/42 St (A,C,E) 130,526 189,506 58,980 45.2%
36 Spring St (C,E) 7,983 11,488 3,505 43.9%
37 86 St (B,C) 7,662 10,998 3,336 43.5%
38 Prince St (N,R,W) 10,002 14,330 4,328 43.3%
39 116 St (B,C) 4,049 5,752 1,703 42.1%
40 Inwood-207 St (A) 5,745 8,156 2,411 42.0%
41 59 St-Columbus Circle (A,B,C,D,1,9) 47,353 66,969 19,616 41.4%
42 34 St-Herald Square (B,D,F,N,Q,R,V,W) 89,516 126,117 36,601 40.9%
43 145 St (A,B,C,D) 14,552 20,476 5,924 40.7%
44 5 Av-59 St (N,R,W) 13,507 18,894 5,387 39.9%
45 96 St (B,C) 6,164 8,619 2,455 39.8%
46 191 St (1,9) 5,655 7,880 2,225 39.4%
47 49 St (N,R,W) 18,618 25,796 7,178 38.6%
48 135 St (B,C) 3,465 4,791 1,326 38.3%
49 50 St (C,E) 13,654 18,776 5,122 37.5%50 Midtown-57 St-7 Av (N,Q,R,W) 21,651 29,393 7,742 35.8%
51 66 St-Lincoln Center (1,9) 16,769 22,623 5,854 34.9%
52 14 St (F,V,1,2,3,9)/6 Av (L) 36,033 48,540 12,507 34.7%
53 33 St (6) 23,811 31,883 8,072 33.9%
54 163 St-Amsterdam Av (C) 2,689 3,600 911 33.9%
55 Cathedral Pkwy-110 St (B,C) 4,856 6,448 1,592 32.8%
56 157 St (1) 7,411 9,815 2,404 32.4%
57 Dyckman St (1) 5,668 7,482 1,814 32.0%
58 116 St-Columbia University (1,9) 12,099 15,939 3,840 31.7%
59 110 St (6) 8,593 11,320 2,727 31.7%
60 28 St (1,9) 9,570 12,601 3,031 31.7%
61 Canal St (A,C,E) 14,093 18,503 4,410 31.3%
62 34 St-Penn Station (1,2,3,9) 70,856 92,750 21,894 30.9%
63 215 St (1) 1,406 1,824 418 29.7%
64 Lexington Av (N,R,W)/59 St (4,5,6) 50,259 65,013 14,754 29.4%
65 23 St (6) 24,836 32,018 7,182 28.9%
66 23 St (1,9) 11,537 14,766 3,229 28.0%
67 175 St (A) 9,703 12,402 2,699 27.8%
68 Bowling Green (4,5) 22,039 28,094 6,055 27.5%
69 Wall St (2,3) 21,066 26,852 5,786 27.5%
70 Chambers St (1,2,3,9) 14,869 18,949 4,080 27.4%
71 103 St (6) 11,447 14,500 3,053 26.7%
72 190 St (A) 3,158 3,993 835 26.4%73 East Broadway (F) 10,551 13,321 2,770 26.2%
74 155 St (B,D) 2,967 3,735 768 25.9%
75 96 St (6) 19,892 25,033 5,141 25.8%
76 155 St (C) 1,845 2,321 476 25.8%
77 Grand Central-42 St (S,4,5,6,7) 122,931 153,747 30,816 25.1%
78 34 St-Penn Station (A,C,E) 68,456 85,542 17,086 25.0%
79 Fulton St (J,M,Z,2,3,4,5)/Bway-Nassau St (A,C) 55,367 68,975 13,608 24.6%
80 96 St (1,2,3,9) 28,666 35,682 7,016 24.5%
81 23 St (N,R,W) 15,895 19,695 3,800 23.9%

8/6/2019 Transit Overload
http://slidepdf.com/reader/full/transit-overload 11/14
Continued on next page
Rank Station (subway lines) 1998 2008 Change 98-08 % Change 98-08
82 77 St (6) 29,245 36,182 6,937 23.7%
83 86 St (4,5,6) 50,404 61,897 11,493 22.8%
84 72 St (1,2,3,9) 29,635 36,311 6,676 22.5%
85 137 St-City College (1,9) 11,872 14,454 2,582 21.8%
86 125 St (1,9) 6,089 7,380 1,291 21.2%
87 181 St (A) 8,114 9,772 1,658 20.4%
88 28 St (6) 19,119 22,750 3,631 19.0%
89 Astor Place (6) 15,127 17,927 2,800 18.5%
90 103 St (1,9) 11,626 13,573 1,947 16.7%
91 68 St-Hunter College (6) 31,123 36,269 5,146 16.5%
92 50 St (1,9) 22,780 26,187 3,407 15.0%
93 86 St (1,9) 16,853 19,354 2,501 14.8%
94 79 St (1,9) 14,275 16,345 2,070 14.5%
95 Wall St (4,5) 20,405 23,357 2,952 14.5%
96 5 Av-53 St (E,V) 23,382 26,667 3,285 14.1%
97 28 St (N,R,W) 8,750 9,965 1,215 13.9%
98 West 4 St (A,B,C,D,E,F,V) 33,496 38,018 4,522 13.5%
99 42 St-Bryant Pk (B,D,F,V)/5 Av (7) 43,204 48,939 5,735 13.3%100 18 St (1,9) 7,221 8,076 855 11.8%
101 7 Av (B,D,E) 13,336 14,793 1,457 10.9%
102 Houston St (1,9) 12,401 13,705 1,304 10.5%
103 Broad St (J,M,Z) 6,525 7,199 674 10.3%
104 South Ferry (1,9) 13,021 14,328 1,307 10.0%
105 Franklin St (1,9) 5,378 5,857 479 8.9%
106 Chambers St (J,M,Z)/Bklyn Bridge-City Hall (4,5,6) 33,862 36,656 2,794 8.2%
107 Whitehall St (R,W) 13,563 14,621 1,058 7.8%
108 Dyckman St (A) 5,412 5,778 366 6.8%
109 Lexington Av-53 St (E,V)/51 St (6) 66,398 70,667 4,269 6.4%
110 City Hall (R,W) 10,538 11,107 569 5.4%
111 47-50 Sts-Rockefeller Center (B,D,F,V) 57,743 60,818 3,075 5.3%
112 Christopher St-Sheridan Sq (1,9) 9,624 10,136 512 5.3%
113 Canal St (1,9) 5,454 5,689 235 4.3%
114 Grand St (B,D) 22,520 23,333 813 3.6%
115 8 St-New York University (N,R,W) 16,124 16,696 572 3.5%
116 Cathedral Pkwy-110 St (1,9) 12,946 13,382 436 3.4%
117 Chambers St-WTC (A,C,E)/Park Pl (2,3) 54,857 54,437 -420 -0.8%
118 Cortlandt St (1,9) 15,443 0 -15,443 -100.0%
119 Cortlandt St (R,W) 22,569 0 -22,569 -100.0%

8/6/2019 Transit Overload
http://slidepdf.com/reader/full/transit-overload 12/14
Continued on next page
12
Rank Station (subway lines) 1998 2008 Change 98-08 % Change 98-08
1 21 St-Queensbridge (F) 2,088 7,374 5,286 253.1%
2 45 Rd-Court House Sq (7) 3,410 9,848 6,438 188.8%
3 Willets Point-Shea Stadium (7) 2,411 5,406 2,995 124.3%
4 23 St-Ely Av (E,V)/Long Island City-Court Sq (G) 10,708 19,194 8,486 79.2%
5 Beach 36 St (A) 518 881 363 70.2%
6 Beach 44 St (A) 362 604 242 66.9%
7 39 Av (N,W) 1,381 2,269 888 64.3%
8 Vernon Blvd-Jackson Av (7) 5,872 9,541 3,669 62.5%
9 Hunters Point Av (7) 4,143 6,655 2,512 60.6%
10 Grand Av-Newtown (R,V,G) 11,106 17,789 6,683 60.2%
11 Woodhaven Blvd (J,Z) 2,685 4,173 1,488 55.4%
12 Sutphin Blvd-Archer Av-JFK Airport (E,J,Z) 13,156 20,138 6,982 53.1%
13 111 St (7) 6,973 10,381 3,408 48.9%
14 103 St-Corona Plaza (7) 12,120 18,021 5,901 48.7%15 21 St (G) 678 1,001 323 47.7%
16 Beach 67 St (A) 1,342 1,929 587 43.7%
17 Elmhurst Av (R,V,G) 9,855 13,885 4,030 40.9%
18 Rockaway Blvd (A) 5,327 7,422 2,095 39.3%
19 74-Bway (7)/Jackson Hts (E,F,R,V,G) 35,507 49,156 13,649 38.4%
20 33 St-Rawson St (7) 9,528 13,147 3,619 38.0%
21 85 St-Forest Pkwy (J) 2,677 3,693 1,016 37.9%
22 Woodside-61 St (7) 12,146 16,746 4,600 37.9%
23 Astoria Blvd (N,W) 8,099 11,146 3,047 37.6%
24 Northern Blvd (R,V,G) 5,542 7,584 2,042 36.8%
25 Woodhaven Blvd (R,V,G) 17,561 23,826 6,265 35.7%
26 80 St (A) 3,203 4,303 1,100 34.3%
27 75 St (J,Z) 2,806 3,758 952 33.9%
28 Junction Blvd (7) 16,029 21,038 5,009 31.2%
29 36 Av (N,W) 5,674 7,395 1,721 30.3%
30 111 St (J) 2,027 2,637 610 30.1%
31 Fresh Pond Rd (M) 3,739 4,849 1,110 29.7%
32 121 St (J,Z) 1,563 2,021 458 29.3%
33 Beach 60 St (A) 1,921 2,478 557 29.0%
34 65 St (R,V,G) 2,649 3,409 760 28.7%
35 Broad Channel (A,S) 280 360 80 28.5%
36 104 St (J,Z) 1,958 2,509 551 28.2%
37 88 St (A) 2,116 2,708 592 28.0%
38 46 St (R,V,G) 7,717 9,860 2,143 27.8%
39 Queensboro Plaza (N,W,7) 7,015 8,955 1,940 27.7%
40 Far Rockaway-Mott Av (A) 3,648 4,655 1,007 27.6%
41 Broadway (N,W) 10,283 13,018 2,735 26.6%
42 Seneca Av (M) 1,676 2,117 441 26.3%
43 Forest Av (M) 2,815 3,517 702 25.0%
44 46 St-Bliss St (7) 11,765 14,561 2,796 23.8%
45 Flushing-Main St (7) 47,428 58,681 11,253 23.7%
46 30 Av (N,W) 11,146 13,781 2,635 23.6%
QueensGrowth in Subway Ridership by Station 1998-2008

8/6/2019 Transit Overload
http://slidepdf.com/reader/full/transit-overload 13/14
Rank Station (subway lines) 1998 2008 Change 98-08 % Change 98-08
47 Beach 98 St (A,S) 650 794 144 22.1%
48 Astoria-Ditmars Blvd (N,W) 13,845 16,748 2,903 21.0%
49 67 Av (R,V,G) 7,901 9,534 1,633 20.7%
50 Forest Hills-71 Av (E,F,R,V,G) 22,576 27,139 4,563 20.2%
51 69 St (7) 4,161 4,927 766 18.4%
52 Briarwood-Van Wyck Blvd (E,F) 5,115 6,026 911 17.8%53 52 St (7) 5,643 6,614 971 17.2%
54 90 St-Elmhurst Av (7) 14,874 17,303 2,429 16.3%
55 169 St (F) 7,274 8,416 1,142 15.7%
56 Steinway St (R,V,G) 12,294 14,214 1,920 15.6%
57 40 St-Lowery St (7) 9,305 10,725 1,420 15.3%
58 Ozone Park-Lefferts Blvd (A) 6,754 7,773 1,019 15.1%
59 75 Av (E,F) 3,210 3,687 477 14.8%
60 63 Dr-Rego Park (R,V,G) 13,287 15,171 1,884 14.2%
61 Kew Gardens-Union Turnpike (E,F) 23,831 26,996 3,165 13.3%
62 Middle Village-Metropolitan Av (M) 3,221 3,640 419 13.0%
63 Beach 105 St (A,S) 250 282 32 13.0%
64 Sutphin Blvd (F) 3,953 4,464 511 12.9%
65 Jamaica Center-Parsons-Archer (E,J,Z) 34,968 38,966 3,998 11.4%
66 Beach 90 St (A,S) 1,002 1,114 112 11.2%
67 Aqueduct-North Conduit Av (A) 803 889 86 10.7%
68 Beach 25 St (A) 1,722 1,871 149 8.7%
69 82 St-Jackson Hts (7) 15,551 16,666 1,115 7.2%
70 36 St (R,V,G) 3,230 3,354 124 3.8%
71 Parsons Blvd (F) 5,939 6,122 183 3.1%
72 Jamaica-179 St (F) 22,725 23,394 669 2.9%
73 104 St (A) 1,802 1,827 25 1.4%
74 111 St (A) 2,746 2,770 24 0.9%
75 Jamaica-Van Wyck (E) 4,336 4,299 -37 -0.9%
76 Howard Beach-JFK Airport (A) 3,038 2,966 -72 -2.4%
77 Rockaway Park-Beach 116 St (A,S) 916 843 -73 -7.9%
78 Queens Plaza (E,R,V,G) 11,144 8,558 -2,586 -23.2%

8/6/2019 Transit Overload
http://slidepdf.com/reader/full/transit-overload 14/14
14
Borough 1998 2008 Change 98-08 % Change 98-08
Brooklyn 605,690 738,284 132,595 21.9%
Bronx 452,651 558,919 106,268 23.5%
Manhattan 515,474 554,633 39,159 7.6%Queens 302,042 387,849 85,806 28.4%
Staten Island 105,579 135,561 29,982 28.4%
Percentage Growth in Bus Ridership
by Borough 1998-2008
-10
-5
0
5
10
ManhattanBrooklynStaten IslandQueensBronx0
5
10
15
20
25
30
ManhattanBrooklynBronxStaten IslandQueens
Percentage Growth in Bus Ridership
by Borough 2003-2008
Borough 2003 2008 Change 03-08 % Change 03-08
Brooklyn 734,887 738,284 3,397 0.5%
Bronx 515,079 558,919 43,840 8.5%
Manhattan 594,607 554,633 (39,974) -6.7%
Queens 364,880 387,849 22,969 6.3%
Staten Island 128,416 135,561 7,145 5.6%
Bus Ridership Growth by Borough 1998-2008
Bus Ridership Growth by Borough 2003-2008
Source: For all charts in this document, the Center for an Urban Future analyzed data supplied by MTA New York CityTransit.
1 Sewell Chan, “How the M.T.A. Cuts Would Affect You,” New York Times City Room Blog, February 18, 2009; SewellChan, “Subway and Bus Ridership Sets Record,” New York Times City Room Blog, February 20, 2009.
Data analysis for the Center for an Urban Future by Jonathan Bowles and David Giles. Design by David Giles.
28.4%
-6.7%
0.5%
23.5%
28.4%
7.6%
21.9%6.3%
8.5%
5.6%