transit-oriented development: findings from recent research
TRANSCRIPT
Transit Use at Portland Area TODsJennifer Dill, PhDPortland State UniversityCenter for Transportation Studies

Survey locations• Merrick (@ Convention Center)
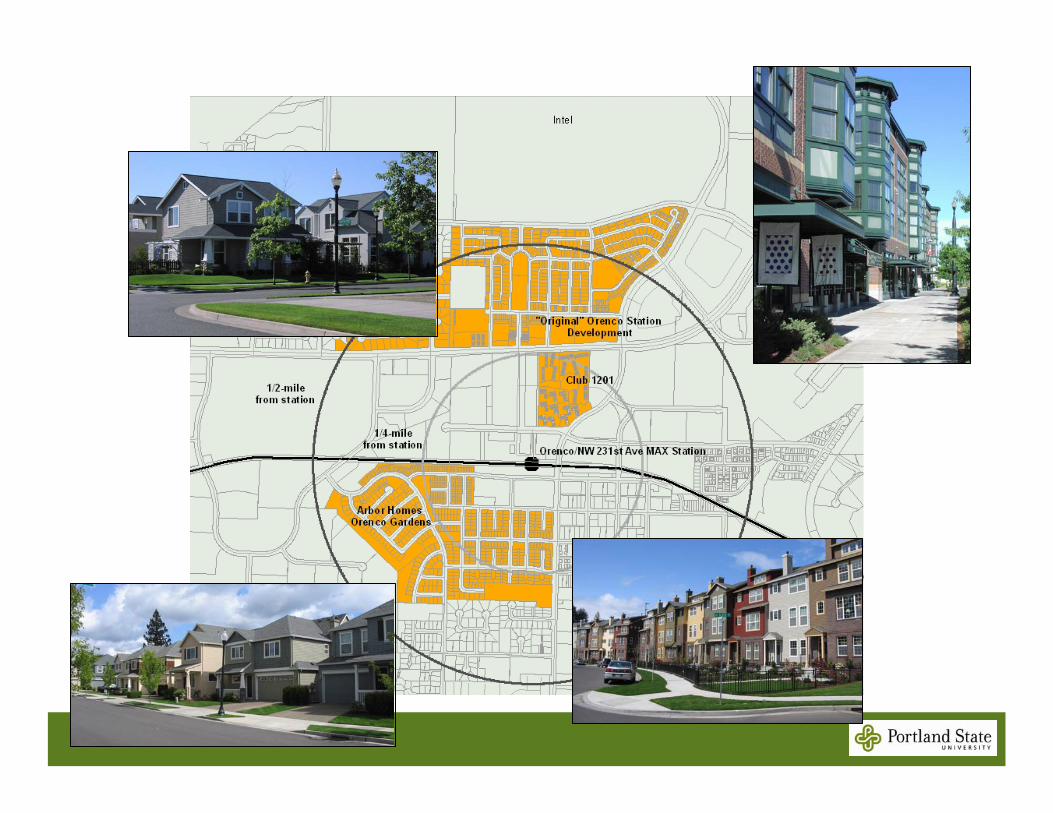
• Westside– Orenco Station
– Elmonica Station
– Beaverton Round
• Eastside– Russellville (@ NE 102nd, Portland)
– Center Commons (@ NE 60th, Portland)
– Gresham Central Station area: Gresham Central, Oneonta, Bridal Veil, Landmark, Three Cedars
– Burnside Station (@ NE 172nd, Portland)
Sunset Downs


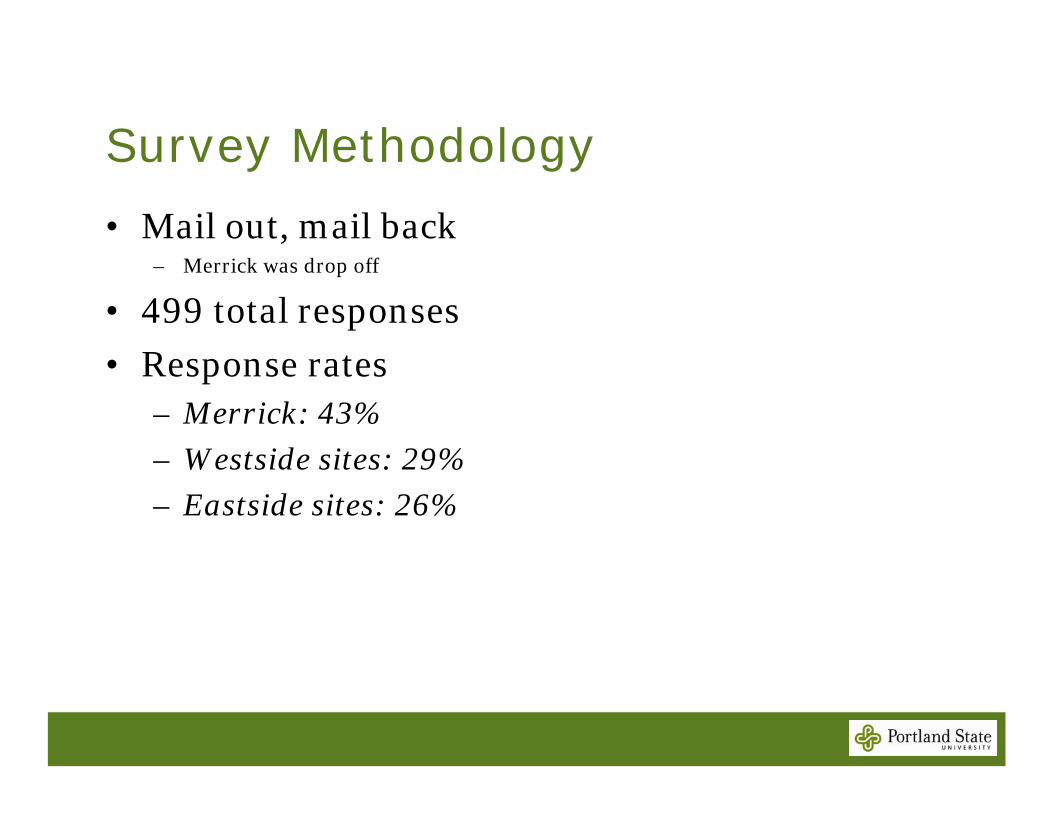
Survey Methodology
• Mail out, mail back– Merrick was drop off
• 499 total responses
• Response rates– Merrick: 43%
– Westside sites: 29%
– Eastside sites: 26%

Respondent Profile
180.833%$50,000-74,9991.8Other Eastside
180.818%$35,000-49,9991.7Gresham Central
540.912%$35,000-49,9991.8Russellville Commons
110.80%$35,000-49,9991.6Center Commons
800.919%$75,000-99,9991.7 in MF2.0 in SF
Orenco Station:Original
660.97%$35,000-49,9991.3The Merrick
121.10%$75,000-99,9991.6Beaverton Round
310.94%$50,000-74,9992.1Elmonica Station
230.917%$35,000-49,9991.5Orenco Station: Club 1201
680.96%$75,000-99,9992.4Orenco Station: Arbor Gardens
n
Vehicles perperson 16 or
older% 65 years and older
Median household
income
Average household
size

23%25%
30%
33%
28%
22%
Orenco Station:Original & Club
1201
Orenco Station:Arbor Gardens
Elmonica Station Beaverton Round The Merrick Eastside TODs
% c
om
muting p
rim
ari
ly b
y t
ransi
t
High transit commuting rates2005 citywide transit commuting shares:
Portland 13%
Gresham 7%
Beaverton 9%
Hillsboro 7%
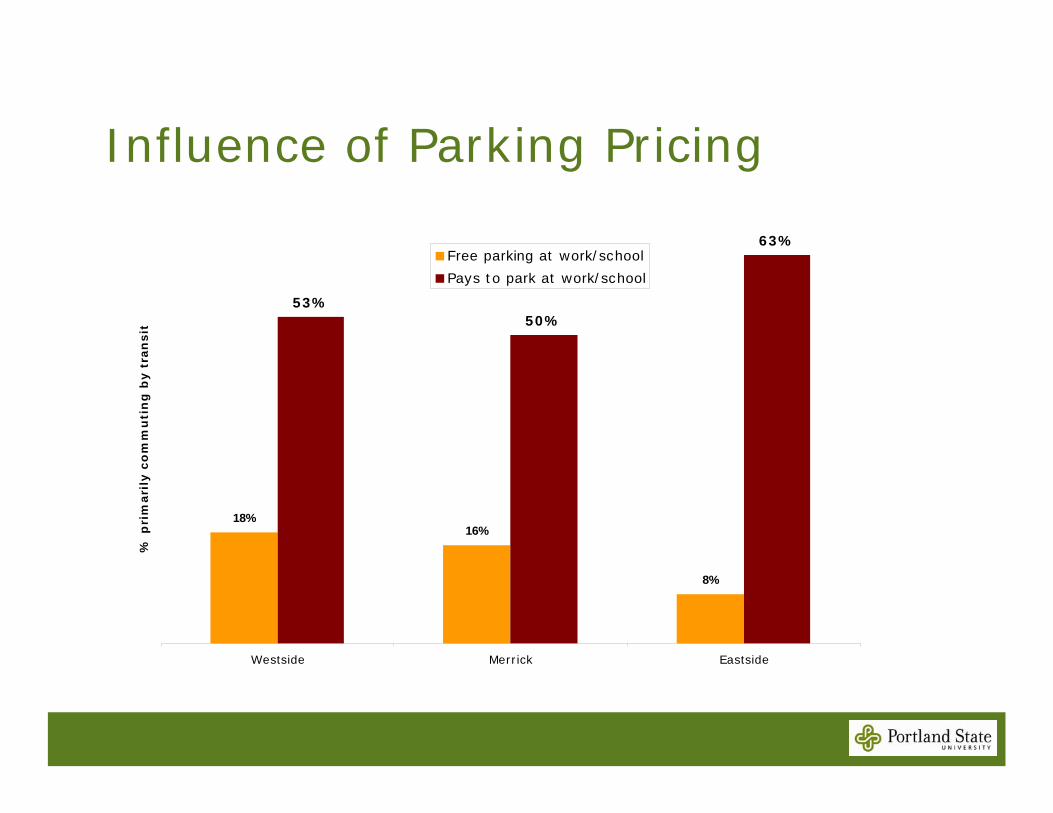
Influence of Parking Pricing
18%16%
8%
53%50%
63%
Westside Merrick Eastside
% p
rim
ari
ly c
om
mu
tin
g b
y t
ran
sit
Free parking at work/school
Pays to park at work/school

Walking time at end of trip
29%
36%33%
15% 15%
4%
<= 5 6-10 11-15 16-20 21-30 > 30
Estimated walking time (minutes) from MAX to work/school
% C
om
muti
ng b
y Tra
nsi
t

Change in Commute Mode: Westside
Non-transit to transit
20%
Transit to non-transit
4%
Continued with non-
transit70%
Continued using transit
6%
No net change towards transit among Eastside respondents

Commute vs. non-commute transit use
0%
5%
10%
15%
20%
25%
30%
35%
40%
45%
50%
Orenco Station Arbor Gardens ElmonicaStation
BeavertonRound
The Merrick RusellvilleCommons
Other EastsideTODs
% u
sin
g t
ransit
weekly
to d
esti
nati
on c
ate
gory
Shopping, dining, or services
Any non-commute destination
Commute to work or school

Mode split for trips leaving home: Eastside and Merrick
Walk/Bike19%
Personal vehicle67%
Transit14%
Walk/Bike29%
Personal vehicle53%
Transit18%
Eastside Merrick
