transit at a crossroads
TRANSCRIPT
Chicago Transit Authority
Transit at a Crossroads
President’s 2007 Budget Recommendations

Transit at a Crossroads
Chicago Transit BoardCarole L. Brown, ChairmanAppointed by: Mayor, City of Chicago
Susan A. Leonis, Vice ChairmanAppointed by: Governor, State of Illinois
Henry T. Chandler, Jr.Appointed by: Mayor, City of Chicago
Cynthia A. PanayotovichAppointed by: Governor, State of Illinois
Charles E. RobinsonAppointed by: Mayor, City of Chicago
Alejandro SilvaAppointed by: Mayor, City of Chicago
Nicholas C. ZagottaAppointed by: Governor, State of Illinois
Frank Kruesi, President
www.transitchicago.com
1-888-YOUR CTA
Carole L. BrownChairman
Transit at a Crossroads
CTA Organization Chart . . . . . . . . . . . . . . . . . . . . . . . . . . . . . . . .1CTA Mission and Values . . . . . . . . . . . . . . . . . . . . . . . . . . . . . . .2Letter from the President . . . . . . . . . . . . . . . . . . . . . . . . . . . . . . .3Introduction . . . . . . . . . . . . . . . . . . . . . . . . . . . . . . . . . . . . . . . . . .7Accomplishments & Plans . . . . . . . . . . . . . . . . . . . . . . . . . . . . .82006 Operating Budget Performance
2006 Operating Budget Schedule . . . . . . . . . . . . . . . . . . . . . .302006 Operating Budget Performance Summary . . . . . . . . . . .31
President’s 2007 Proposed Operating BudgetPresident’s 2007 Proposed Operating Budget Schedule . . . .382007 Major Budget Assumptions . . . . . . . . . . . . . . . . . . . . . . .39President’s 2007 Proposed Operating Budget Summary . . . .40President’s 2007 Proposed Operating Budget Schedules Department Budget Schedule . . . . . . . . . . . . . . . . . . . . . . . . .48Department By Line Item Schedule . . . . . . . . . . . . . . . . . . . . .49Department Budgeted positions . . . . . . . . . . . . . . . . . . . . . . .50
President’s 2008 – 2009 Proposed Operating Financial PlanPresident’s 2008 – 2009 Proposed Operating Financial Plan Summary . . . . . . . . . . . .51President’s 2008 – 2009 Proposed Operating Financial Plan Schedule . . . . . . . . . . . .61
Business UnitsBusiness Unit - Overview . . . . . . . . . . . . . . . . . . . . . . . . . . . . .62Business Unit - Activities by Unit . . . . . . . . . . . . . . . . . . . . . . .63
President’s 2007 – 2011 Capital Improvement Plan & ProgramIntroduction . . . . . . . . . . . . . . . . . . . . . . . . . . . . . . . . . . . . . . . .73Sources of Funds . . . . . . . . . . . . . . . . . . . . . . . . . . . . . . . . . . .77Uses of Funds . . . . . . . . . . . . . . . . . . . . . . . . . . . . . . . . . . . . .80Detailed Capital Improvement Project Descriptions . . . . . . . .90
Appendices . . . . . . . . . . . . . . . . . . . . . . . . . . . . . . . . . . . . . . . . .96

1
Chicago Transit AuthorityOrganization Chart

Chicago Transit Authority
Our MissionWe deliver quality, affordable transit services that link people, jobs and communities.
Our ValuesWe will accomplish our mission with a diverse workforce that is:
Courteous — We will create a pleasant environment for ourselves and our customers.
Innovative — We will seek out and encourage employees who initiate change, improvement, learning and advancement of our goals.
Motivated — We will meet each task with spirit, enthusiasm and a sense of pride to be second to none.
Professional — We will provide transit service with the highest standards of quality and safety for our customers and ourselves.
Reliable — We will be dependable for our customers and fellow employees, and will maintain the highest standards of trust.
Results-Oriented — We will focus on getting the job done and will derive personal satisfaction from the service we provide.
Our CommitmentsWe will accomplish our mission by:
Setting clear goals, standards and priorities.
Communicating openly with customers and employees.
Helping all of our employees develop to their fullest potential through enhanced training and education.
Being accountable to fellow employees and customers.
Supporting employees so that they can serve customers.
Engaging employees in decisions that affect them and their work and creating a stronger sense of ownership among our employees.
2

Transit at a CrossroadsIn 2006, the Regional Transportation Authority (RTA), CTA, Metra andPace teamed up to launch the Moving Beyond Congestion project, aninitiative designed to build consensus in the region for improved andexpanded public transportation. Over 275 community organizations,businesses, labor unions and local governments have already cometogether as Partners for Transit to lend their voices to the dialogue.This positive step reflects a growing recognition that improving transitis essential to economic growth, which is increasingly threatened bycongestion. According to the independent Texas TransportationInstitute, Northeastern Illinois has gone from having the nation’sseventh worst traffic congestion in 1983 to second today, now costingresidents over $4.2 billion annually in lost productivity and wastedresources.
This is my tenth budget recommendation to the Chicago TransitBoard. Given the strong support our partners have expressed forMoving Beyond Congestion, I am more optimistic than ever thattransit will finally secure the resources necessary to thrive. At thesame time, I am cognizant of the reality that the mere survival, let
alone growth, of the existing transit network is in question if no action is taken to correct long-standing operating and capital funding shortfalls.
The symptoms of the problem are clear. Since the state last revisited funding for the day-to-dayoperations of CTA, Metra and Pace in 1983, CTA has grappled with a steep decline in inflation-adjusted funding levels. Between 1985 and 2004, CTA’s public funding for mainline bus and railoperations trailed inflation by more than one percent every year. These reductions have added up.If funding had just kept even with inflation since 1985, CTA cumulatively would have received $1.6billion more to operate its buses and trains.
CTA also faces a severe capital funding shortfall that threatens its ability to reach a state of goodrepair. In just the past two years, CTA’s capital budget has been slashed by over $400 million. Notonly has capital money been used to cover operating budget shortfalls, but new state capitalfunding for transit has also stopped with the expiration of Illinois FIRST. This state legislation, whichfunded transit, roads, and other infrastructure improvements, had provided as much as $176 millionannually for critical CTA capital projects. Capital funding shortfalls have resulted in deferred mainte-nance, delays in infrastructure improvements, and difficulty in planning, financing and implementingmulti-year projects. While Illinois FIRST funding for transit has ended, dedicated state funding forroads has continued to flow. This unbalanced policy does not exist at the federal level. When thefederal transportation program expires, Congress continues to appropriate funds for roads andtransit until a new program is authorized.
CTA is grateful for the support it does receive from the state. Indeed, the General Assemblyalready recognizes that a serious funding problem exists. The Mass Transit Committee of theIllinois House, established two years ago, affirmed many of the points CTA identified regardinginadequate funding levels and changing allocations over time. In 2005 and 2006, the GeneralAssembly provided an additional $54 million in operating grants to RTA. CTA received all of these
3
Letter from the President
4
funds in 2005 and half in 2006. With this funding, CTA rescinded cuts that would have eliminatedover 50 transit routes and consequently achieved its highest ridership since 1992.
While we wait for a long-term solution, we have worked to preserve service in an increasingly diffi-cult financial environment with escalating fuel, security, health care and benefit expenses. To doso, CTA has had to take various short-term, unsustainable measures with their own consequences.For example, over the past two years, CTA has delayed key infrastructure improvements bydiverting $60 million from capital projects to fill operating budget gaps – on top of not receiving over$350 million in state capital funding after Illinois FIRST expired. CTA has also increased operatingrevenues by raising cash fares twice, from $1.50 to $1.75 and then to $2.00, a 33-percent jumpsince 2003. While customers have remained with CTA so far, fare increases of this magnitudecannot continue indefinitely without driving people away from transit.
CTA is also always working to improve efficiency. Since 1997, CTA has pursued major efficiencyinitiatives that cumulatively have saved over $1 billion. Based on recommendations made througha recent independent review of CTA by AECOM Consult, CTA is taking further steps to be evenmore cost effective. In addition, after the initial bids for the Brown Line Capacity Expansion Projectdid not meet cost estimates, CTA reduced expenses by over $100 million by repackaging the bidsand modifying the construction plan without sacrificing essential station improvements forcustomers. This year, at the direction of the General Assembly, all paratransit operations in the six-county RTA service area have been consolidated under Pace to ensure a regional approach todelivering this important service.
For 2007, my budget recommendations reflect CTA’s ongoing efforts to work smarter, cut expensesand seek innovative revenue sources. But even with these efforts, $580.5 million is needed foroperations and to meet retiree pension and health care liabilities growing through an arbitrationaward and under state law. At present, only $470.3 million has been identified. But following thefunding marks RTA adopted for the CTA, my budget recommendation anticipates that new fundingsources will be identified in 2007 to maintain service. If no additional funding is obtained, CTA willbe required to take actions to balance its operating budget. RTA Chairman Jim Reilly hasexpressed confidence, however, that a solution will be found and I personally share his confidence.
Metra and Pace are also beginning to feel the pinch that CTA has experienced for many years. Weall understand how urgent it is to address the funding challenge. As Chairman Reilly said lastmonth, "Over the long term, the resources that we have on the operating side and the resourcesthat we have on the capital side just aren't adequate to keep the system that we have, let aloneexpand it … At the end of the day, if we don't have the resources we need, the average commuteris going to have fewer options. They'll either have fewer routes or they will have less service oneach route. And the system physically will at some point have to get smaller if we don't have themoney needed to maintain trains and buses…"
Noting that the $27 billion asset of regional transit infrastructure belongs to the people ofNortheastern Illinois, the RTA states that “together, we all need to decide on whether we are goingto invest in this asset or shrink it.”
Crafting an appropriate solution to the funding problem requires understanding its origins andconsequences. In 1983, state law established how revenues from a sales tax of one percent inCook County and a quarter of a percent in the collar counties would be used in conjunction withsupplementary state funds to support CTA, Metra and Pace operations. It also introduced a
Letter from the President

5
Letter from the President
recovery ratio requirement mandating that fares and other system-generated revenues cover atleast 50 percent of total regional operating expenses.
Although these key provisions of the law have not changed since 1983, they have made CTA lookvery different than two decades ago. Between 1985 and 1997, the declining purchasing power ofCTA’s public operating funding contributed to a vicious cycle of fare hikes, service reductions, andridership losses in the most transit-supportive part of the region. Several major cuts occurredbetween the late-1980s and mid-1990s. Between 1989 and 1991, fares increased 50 percent. Thedisinvestment was painfully obvious when I joined CTA in 1997: my first day on the job, we beganimplementing cuts that removed 10 percent of service from an already-downsized system. Withthese cuts, CTA operated nearly 400 fewer rush hour buses compared to 1983. Is it any surprisethat more than one out of every three CTA customers stopped riding?
I have worked with the Chicago Transit Board and CTA employees to first stabilize the organizationand then begin to reverse this decline. We have increased bus service, reopened and renovatedrail stations, rehabilitated rail lines, and improved system accessibility for customers with disabili-ties. As a result of these efforts, CTA has regained some 45 million of the over 200 million annualrides lost, an increase nearly equal to the annual transit ridership in greater St. Louis.
Despite this progress, the underlying funding structure that helped fuel CTA’s steep decline in thefirst place has not changed. By not addressing this operating funding problem for so long, and bynot renewing capital programs for transit, we risk reigniting another downward spiral. It is almost asif CTA is taken for granted – a system whose weekday ridership still exceeds the population of allbut four U.S. cities.
Contrast that with other parts of the country that did not have much transit but have since beenwilling to invest heavily in it. Over the past decade, places as diverse as Denver, Miami andPhoenix have implemented new revenue streams for bus and rail expansion and consequentlyachieved cumulative ridership gains of 20 to over 40 percent. With recovery ratios far lower thanthe 50 percent in metropolitan Chicago, public funding covers about 75 to 80 percent of operatingexpenses in those areas, contributing to dramatic ridership increases. There is a clear connectionbetween funding levels, service levels and ridership.
We now have a rare opportunity to change the course of transit in the Chicago region. As part ofthe Moving Beyond Congestion project, RTA is working with CTA and its sister agencies to developa comprehensive Strategic Regional Transportation Plan. I fully support the vision of this effort: “Aworld-class public transportation system that is convenient, affordable, reliable and safe, and that isthe keystone of the region’s growing business opportunities, thriving job market, clean air andlivable communities.”
A lot needs to be done to achieve this vision. The Situation Analysis Interim Report Summary ofthe Strategic Regional Transportation Plan observes, “Despite recent ridership gains, the regionhas yet to return to ridership levels achieved as recently as the 1980s, and ridership growth haslagged behind similar regions around the country. Over the past two decades, the collectivepurchasing power of the region’s transit agencies has declined, causing reduced service levels anddecreased ridership in traditional transit markets with a high return on investment. Opportunities toexpand transit exist in both new geographies and in these traditional markets.”

6
For its traffic relief benefits alone, transit is a worthwhile investment. The Texas TransportationInstitute estimates that the combined RTA system reduces delays by 94 million hours and savesthe region $1.6 billion in congestion costs each year. One fully-loaded articulated bus can take 90cars off the road; one train removes up to 1,000 cars. During the busiest hour of the morning peakperiod, CTA’s rail service accounts for 20 to more than 70 percent of travel along each of the majorhighway corridors leading into the Loop. Imagine the gridlock and parking problems if all of CTA’scustomers drove. Even people who usually do not ride transit can appreciate how it benefits theircommute.
With proper funding, CTA will advance more rapidly toward a state of good repair, accelerating therenovation of century-old rail lines, replacement of worn-out buses and trains, and refurbishment ofmaintenance facilities. Service frequency and hours of operation will expand to tap new markets,relieve overcrowding, and increase transit’s competitiveness with the automobile. CTA will alsocontinue pursuing ambitious initiatives, from technology that will tell customers when their bus iscoming, to direct service to the airports, to a Circle Line that would further link CTA and Metra.
Transit is at a crossroads. A healthy transit system curbs traffic congestion and pollution whileimproving mobility, economic competitiveness and the quality of life for everyone. With morefunding, transit will be able to do more and ridership will grow. By working together and addressingthe funding challenge on a regional, bipartisan basis, I am confident that we will choose the rightpath.
Letter from the President

7
IntroductionOne of the most significant developments overthe past year has been the way in which theCTA, RTA, Metra and Pace have cometogether and collaborated as never before forthe shared goal of improving and expandingtransit service in the region.
This unprecedented effort was prompted by amutual and growing concern about inadequateoperating and capital funding levels for transit.Separately, we provide services to variousmunicipalities and communities across theregion. Together we make up a transit networkthat provides mobility and economic opportu-nity for millions of residents of NortheasternIllinois. Although our services differ, our objec-tives are the same. And so are our challenges.Each agency struggles to operate efficientlyand manage costs. Our ridership is growing,but our revenues are not. For the CTA, a 23-year-old funding structure problem hinders our
ability to maintain existing service let aloneexpand to accommodate new customers.
We have joined forces with one another andwith an ever-increasing number of communityorganizations, businesses, labor unions andlocal governments to lend our ideas andvoices to the debate about the future of transitfor the region. We agree that 2007 is a deci-sion year that will determine whether ourtransit network grows and thrives, or whether itbegins to shrink.
So as we look to 2007, we do so with a senseof optimism for all that can be accomplished atthe CTA and for the region’s transit networkwith proper funding, but also with a sense ofconcern for what the transit network willbecome without new funding.
At the CTA, we took the cautiously optimisticapproach to building our budget. We plan tocontinue the efficiency measures that haveresulted in savings of over $1 billion since1997. We also intend to build on thecustomer-focused initiatives that have resultedin a successful reversal of declining ridership.After more than 20 years of losses, the CTAhas posted ridership gains in seven of the pasteight years and is on target for a ridershipincrease again in 2006.
Our capital needs are real, and growing.There are a number of important capital proj-ects already underway that will continue in2007, and more that will begin. But thereality is no matter how many stations werenovate, or buses we buy, or tracks werepair, there is always another importantproject that needs to be done and our capitalresources are dwindling.
As we embark on the uncertainty of 2007, weare proud of what we have accomplished atthe CTA. But we know that with the rightresources there is so much more we couldaccomplish.
Transit at a Crossroads
Red Line customers on the platform at the recently renovated Lake subway station.

Accomplishments and Plans
8
2006 AccomplishmentsAlthough visible improvements could be foundthroughout the CTA system – from newly reno-vated rail stations on the century old BrownLine, to rebuilt stations all along the Dan Ryanbranch of the Red Line, to new Purple Lineviaducts in Evanston and new, shorter busesto serve Hyde Park and the University ofChicago campus – the Pink Line became thenew color on the horizon and was arguably themost memorable and eye-catching innovationat the CTA in 2006.
The Chicago Transit Board invited localstudents from around the region to submitessays nominating a color for the new rail lineand explaining why public transit is important.More than 600 essays were submitted byChicagoland area students from kindergartenthrough eighth grade.
In June, the Pink Line made its debut as theCTA’s eighth rail line and the first new rail linesince the Orange Line opened in October1993. The new service provides a faster tripfor customers from the West Side and nearwest suburbs to the central business district.The Pink Line was introduced as part of apackage of research-based bus and rail serviceenhancements and represents a substantialinvestment in additional transit service for thecommunities it serves by providing moreservice, better connections and faster trips.
Serving 22 stations, Pink Line trains make allstops along the 54th/Cermak branch to Polkstation. At Polk, Pink Line trains cross over theEisenhower Expressway and travel north alongthe recently renovated connector track abovePaulina Street to the Green Line elevatedstructure along Lake Street. Trains thencontinue eastbound stopping at Ashland andClinton stations before proceeding to the Loopwhere they travel clockwise on the inner track,making stops at all elevated stations beforereturning to 54th/Cermak on the same routewestbound.
Most customers have experienced increasedand faster service between 54th/Cermak andthe Loop, saving up to 10 minutes on theirtransit time. Direct service to the Loop alsomeans enhanced connections to the Red,Orange, Brown and Green lines, Purple LineExpress service and Metra. In addition,customers still have the option of Blue Lineservice to the Dearborn Street subway duringmorning and evening weekday rush periods.
Although the color didn’t change, service onthe Forest Park branch of the Blue Line wasalso improved significantly. The frequency ofservice on the Forest Park branch increased,especially during weekday off-peak hours andweekends, and access to CTA and Pacebuses along the route was also improved.
A Pink Line train makes its inaugural run on theelevated tracks near Polk station.
City of Chicago Mayor Richard M. Daley is joined by Pink Lineessay winner Eleni Vrettos to launch the new Pink Line rail service.

Accomplishments and Plans
9
In the final piece of the improvement package,five new bus routes were created – threeexpress routes and two local routes – fourexisting bus routes were extended, androuting and schedule improvements weremade to four additional bus routes.
The service enhancements provide additionaltransit options that are designed to meet thegrowth in population and jobs throughout theWest Side and near west suburbs. Serviceimprovements such as these not only benefitcustomers, but also the communities in whichthey live and work, by increasing transitoptions for the region.
With the CTA already recording ridership gainin the first three months of service, it is clearthat these service enhancements helpedcontribute to continued ridership growth for theregion. Ridership levels are a critical measureof customer satisfaction. After 20 years ofdeclining ridership, CTA has clearly engi-neered a ridership turnaround and is on trackto have achieved ridership increases in eightof the past nine years.
Between 1995 and 2005, CTA’s ridership grewby 49.6 million annual unlinked rides. Thisincrease alone is more than the entire annualtransit ridership of such U.S. cities as Phoenix,Detroit, St. Louis, Cincinnati, Austin and San Antonio.
In 2006, to avoid service cuts, CTA raisedcash fares by 25 cents at the beginning of the
year. The increase was carefully designed toprovide the maximum revenue gain with theminimum ridership loss. The range of CTAfare media – unlimited ride passes, ChicagoCard and Chicago Card Plus – allowed themajority of customers to continue to travel onCTA for $1.75.
Prior to implementing the cash-fare increase,the Chicago Transit Board initiated a promo-tional fee-waiver period for Chicago Card andChicago Card Plus. To further increase theconvenience of the cards, the CTA began aTouch & Go pilot program to enable ChicagoCard customers to add value to and checkbalances on their Chicago Cards at a networkof 65 Currency Exchange locations throughoutthe service area. Previously, customers couldonly add value or check balances on ChicagoCards at farecard vending machines locatedprimarily at CTA rail stations. By increasingthe number of locations where customers mayeasily add value, the Chicago Card hasbecome an even more convenient and acces-sible option for customers, especially buscustomers who previously did not have thesame easy access to CTA vending machinesthat rail customers had.
Both Chicago Card and Chicago Card Plusare examples of CTA’s investment in systemenhancements that benefit customers. TheChicago Card streamlines CTA operations byreducing cash on the system, thereby helpingto reduce operating expenses, and increasesconvenience for customers, a combination thatsupports the CTA’s commitment to improvingefficiency in operations and providing a valu-able and beneficial product for customers. Byapplying technologies to improve the bus fleet,rail service and stations, internal operationsand fare media, CTA continues to improve thetransit experience for customers and improveits operational efficiency.
To further increase efficiencies, last year CTAengaged AECOM Consult to perform amanagement and operations review of CTA’sefficiency and business practices. The results
Touch & Go equipment at local Currency Exchange locations makes it more convenient for customers to add value to Chicago Cards.

Accomplishments and Plans
of that review acknowledged the fact thatthrough previous initiatives CTA had substan-tially improved service in recent years and atthe same time made great strides in reducingoperational costs. AECOM concluded “CTA iscost-effective relative to other major transitsystems.”
CTA staff continue to develop ways to main-tain a high level of service for customers andstill improve the efficiency of the agency’soperations, and support the recommendationsmade by AECOM to further capitalize onsavings. A number of the recommendations,however, require changes in union contractsor state law. For example, although CTA is inagreement with AECOM’s recommendationthat subcontracting would reduce expenses,the agency is currently prohibited fromsubcontracting many activities by the terms ofits collective bargaining agreements. The CTAstaff will continue to act on the recommenda-tions that are not restricted.
Investing in Rapid TransitContinued investment in the system is criticalto maintaining the current level of service andbeing able to improve service in the future.One such investment is currently underway onthe Brown Line. Construction began in 2004and continued to progress throughout 2006.The $530 million investment in the Brown Line
will improve transit for many customers whoare now often unable to board a Brown Linetrain during rush hour because of over-crowding, or who cannot use many of thestations along the line because they are notaccessible. The improvements to the line willalso benefit the community by helping todecrease traffic congestion in the area andfurther improving the reliability of service, anasset to any community.
When the capacity expansion project iscompleted at the end of 2009, CTA will be ableto add two more rail cars to Brown Line trainsduring rush hour and all stations on the linewill be accessible to customers with disabili-ties. Additional station enhancements includewider stairways, additional entrances andexits, more turnstiles to ease congestionduring busy hours, and upgrades to tractionpower equipment and the signal system toimprove the efficiency of train traffic.
The first two stations to be renovated,Kedzie and Rockwell, re-opened tocustomers for service in August.Enhancements include new glass stationhouses, new platforms, brighter lighting andaccessible features including ramps, tactileedging and accessible gates. A new auxil-iary entrance (formerly an exit only) at thewest end of the Kedzie station at SpauldingAvenue was also completed. Re-openingthe rebuilt Kedzie and Rockwell stations
10
The Paulina station on the Brown Line will be renovatedto make it ADA accessible and to berth eight-car trains.
Renovations at the Kedzie Brown Line station include the addition of an auxiliary entrance at Spaulding Avenue.

Accomplishments and Plans
equipment along the tracks, installing six newcrossing gates and circuitry where the BrownLine crosses at street level and rehabilitatingKimball Tower where signals control switchesand direct trains.
Operating between downtown and theNorthwest Side, the Brown Line was originallyconstructed in two phases, opening forservice in 1900 and 1907. The line is the thirdbusiest of CTA’s rail lines, serving more than66,000 customers each weekday, with 19stations from Kimball on the north to theMerchandise Mart.
CTA has also embarked on a track and signalrenewal project at Clark Junction, the busylocation where Brown, Red and Purple Linetrains converge just north of Belmont on thecity’s North Side. On a typical weekday,nearly 1,000 trains pass through the corridorwith approximately one train every 50 secondsduring rush periods. The upgrade to the 100-year-old junction will bring new signals andadditional connections between tracks to allowtrains to cross among all four tracks therebyimproving options for operating trains aroundconstruction, disabled trains or equipmentproblems.
Next year the Purple Express, Brown and RedLine trains will lose one of the four tracksthroughout the Clark Junction corridor due toconstruction at the Belmont and Fullertonstations. Because elevators will be installed atBelmont and Fullerton to make the stationsaccessible to customers with disabilities, thetracks along the platforms need to be realignedto allow room for elevators and new wider plat-forms to accommodate customers with disabili-ties and growing ridership. One of the fourtracks at both stations must be taken out ofservice so crews can realign the tracks andbuild wider platforms.
The operational improvements madethroughout Clark Junction will allow theBelmont and Fullerton stations to remain open
brings the total number of accessible CTA railstations to 74 out of 144, or 51 percent, andbuilds on CTA’s solid record of becoming anincreasingly accessible system. By the end of2006, two more stations on the Dan Ryanbranch of the Red Line will be made acces-sible — the 47th and 69th Street stations —bringing the total of accessible stations to 76.
The Kimball and Francisco stationstemporarily closed in September, for fourmonths and six months respectively. Therecent re-opening of the Kedzie and Rockwellstations allows customers who use thesestations as alternates to Kimball andFrancisco to see firsthand the types ofimprovements they can expect to see as aresult of CTA’s investment in the stations onthe Brown Line.
CTA has worked and continues to work withlocal elected officials and business ownersalong the line to minimize the impact to busi-nesses near temporarily closed stations. CTAis placing advertising cards on Brown Line railcars, local bus routes and the Brown Line website encouraging customers to continue tosupport businesses near temporarily closedstations.
Signal system upgrades and electrical substa-tion work from Kimball to Western are also apart of the Brown Line capacity expansionproject. The work involves installing signal
11
Updated project information is available to customers on theBrown Line web site at www.ctabrownline.com.
Accomplishments and Plans
12
throughout construction and help CTA tobetter manage rail service during three-trackoperation. Once CTA is satisfied that thenewly installed signal system is properlyconfigured to manage the volume of traintraffic and that operational staff are preparedto coordinate traffic through the reconfiguredjunction, three-track operation will begin, andcontinue until the Brown Line capacity expan-sion project is completed in 2009.
For CTA, providing rail service with 25 percentless track capacity will present significant chal-lenges. For customers it will mean slowerservice on the Red, Brown and Purple LineExpress trains as they travel through thecorridor bounded by the Brown Line Southportstation, the Red Line Addison station and theBrown Line Armitage station. Currently CTArail operations and planning staff are devel-oping a plan for service throughout thecorridor with the constraints of three-trackoperation, however, it is important to keep inmind that losing one track will increase traveltimes regardless of the adjustments that willbe made. Once the Brown Line constructionis completed, the new signal system in theClark Junction corridor will allow customers totravel through this busy corridor more quicklyand efficiently.
As construction continues on the North Side,the South Side will see the three-year rehabili-tation of the Dan Ryan branch of the Red Linewrap up by the end of 2006. This $283 millionproject is bringing more reliable and efficientrapid transit service to the South Side of thecity with the construction of two new substa-tions, upgrades to two other substations toboost power to the branch and the installationof new contact rail, all of which will enable theCTA to better serve the 45,000 customers whouse this branch each day.
Improving power reliability and the delivery ofthat power are the most significant aspects ofthe project. Since the Dan Ryan branch of theRed Line opened in 1969, the CTA has added
trains and increased service frequency to keepup with customer demand. In 1969, the RedLine ran six-car trains with rush hour intervalsat 5-7 minutes. Today, the Red Line runs eight-car trains with rush hour intervals at 3-5minutes.
Seven stations from Sox-35th to 87th are alsobeing upgraded to include new flooring,enhanced lighting, refurbished platformcanopies, new customer assistant kiosks andimproved signs. Eight escalators along thebranch have been replaced and new elevatorsare being installed at 47th and 69th, makingthose stations accessible to customers withdisabilities. Additional enhancements includeimproved bus connections, curb cuts,canopies over station entrances and improvedlighting on the approach to each station.
Rehabilitation work is also underway at theHoward station on the north end of the RedLine that will bring major overall improvementsto the facility and boost ongoing neighborhoodrevitalization efforts in the Howard Street area.The Howard station is a major transportationcenter serving transit customers on the CTA’sRed, Purple and Yellow Lines, seven CTA busroutes and two Pace bus routes.
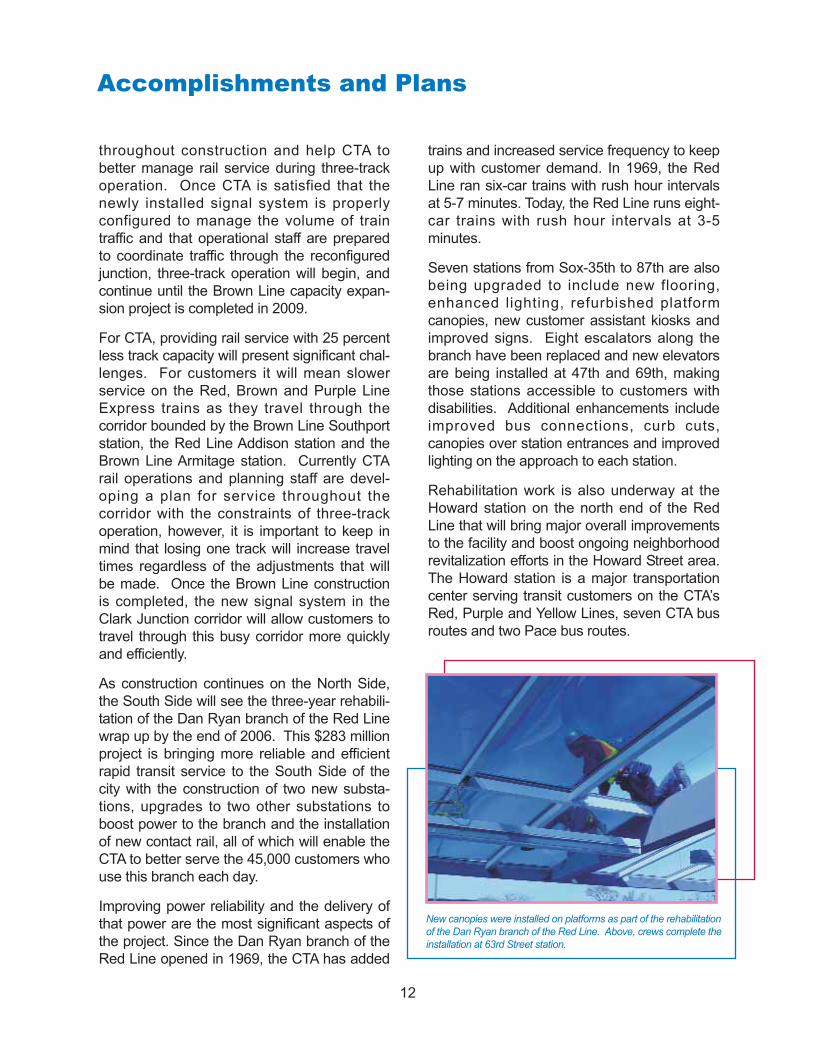
New canopies were installed on platforms as part of the rehabilitationof the Dan Ryan branch of the Red Line. Above, crews complete theinstallation at 63rd Street station.

Accomplishments and Plans
Purple Line trains had been forced to reducespeed when crossing the viaduct due to thedeterioration of the structure. A new steelviaduct structure is now in place which haseliminated the slow zone along that expanseof track, thereby improving travel times forPurple Line customers.
Following the $3.7 million replacement of theMain Street viaduct, similar work is currentlyunderway to replace the second of six bridgesalong the Purple Line slated for replacement.CTA is investing $3.3 million to replace the 98-year-old Church Street viaduct. Located oneblock north of the Purple Line Davis station,the existing viaduct at Church Street has dete-riorated over time with exposure to theelements. Due to its condition Purple Linetrains must reduce speed when crossing it.This fall, CTA will replace the concrete viaductwith a new steel structure. In addition toreplacing the viaduct, the project includes theinstallation of new abutments, retaining walls,foundations, and new waterproofing anddrainage systems. The project also calls forrail tie replacement, new landscaping andlighting enhancements under the bridge.
Plans for a new downtown transit station alsoadvanced in 2006. The Chicago Transit Boardentered into agreements with The MillsCorporation and the City of Chicago to financeand develop a transit center at 108 North State
CTA is investing $84.2 million to renovate andmake accessible the existing station houseand platform areas, and upgrade communica-tions, electrical and lighting systems. Thestation will also feature customer-friendlyamenities such as new benches, signs andbike racks, and new windbreaks and canopiesto protect customers during inclementweather. Also included in the project is therehabilitation of the existing Howard Streetviaduct and retail space on the north side ofHoward Street, and the creation of a newentrance at the south end of the station.
The new south entrance will provide a conven-ient, accessible path between the station plat-forms and the multi-story parking garage andbus terminal on the west side of the stationthat were completed in 2001 and 2002respectively. Additionally, new facilities will beconstructed on the second floor of the stationhouse for the Red Line rail operations andCTA maintenance departments. The project isscheduled to be complete in 2009 and thestation is required to be ADA accessible by2010.
Two of the nearly century-old viaducts thatsupport Purple Line tracks in Evanston alsoreceived much needed attention. Work toreplace the 95-year-old concrete viaductlocated over Main Street in downtownEvanston was completed at the end of 2005.
13
The new steel Church Street viaduct waits in the wingsbefore being rolled into place.
A rendering depicts a renovated Howard station, CTA’s major intermodal transportation center.

Accomplishments and Plans
years old and is past its useful life. Thesesystems ensure the safe operation and move-ment of trains and the appropriate speed anddistance between trains. Customers will expe-rience improved service as the new systemwill enhance CTA’s ability to coordinate trainmovements in the subway by allowing contin-uous speeds, and eliminate the need for trainsto stop and go as the current system requires.
CTA is working to replace approximately 20miles of the existing train control system fromthe Forest Park terminal of the Blue LineForest Park branch through the Dearbornsubway to the Jefferson Park station of theBlue Line O’Hare branch. Additionally, theproject will replace the traction power cablesand communication upgrades in the Dearbornand State Street subways that will benefit thenew transit station to be built at 108 N. State.
Managing multiple construction projectsrequires a focused commitment to the goalsand objectives of each one. In 2006, CTAreceived recertification of its InternationalStandardization Organization (ISO) 9001:2000registration which emphasizes the processthat creates a product or service. CTA is oneof only two transit agencies in the U.S. to beso certified.
Street, also known as Block 37, and newtunnel and track connections between the Redand Blue Line subway routes. Under thedevelopment agreement, when the stationopens the CTA would provide direct rail serviceto Midway and O’Hare Airports with opportuni-ties for service improvements to be phased inas funding becomes available.
The opportunity to build a station at Block 37 isa unique one for CTA, because it is the onlyvacant parcel between CTA’s Blue Line andRed Line subways. The location makespossible a track connection between theexisting subways that will enhance options forsubway operations. Connecting the Red andBlue lines will be the CTA’s first majortunneling project since the Dearborn subwayproject was completed in 1951. Since then,there have been two smaller subwaysconstructed – the Logan Square subway andthe O’Hare subway – both on the Blue Lineand both handled by the City of Chicago.
Construction is currently underway on a traincontrol and traction power upgrade project thatwill benefit the entire Blue Line, and includesthe signals needed to connect the Red andBlue Lines for the Block 37 project. Theexisting CTA train control and traction powerequipment along the Blue Line is more than 40
14
The new 30-foot Optima prototype bus against the backdrop of LakeMichigan and the skyline.
The new transit station at 108 N. State will have a tunnel toconnect the Red Line and Blue Line subways.
Accomplishments and Plans
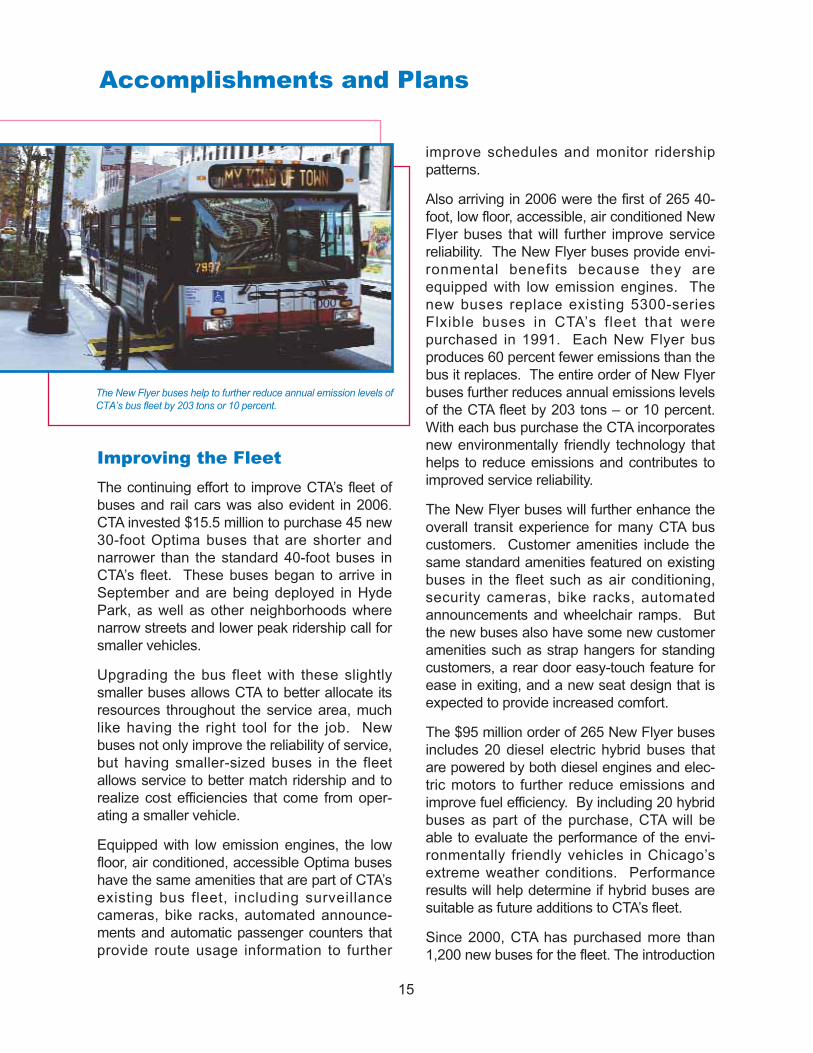
Improving the Fleet The continuing effort to improve CTA’s fleet ofbuses and rail cars was also evident in 2006.CTA invested $15.5 million to purchase 45 new30-foot Optima buses that are shorter andnarrower than the standard 40-foot buses inCTA’s fleet. These buses began to arrive inSeptember and are being deployed in HydePark, as well as other neighborhoods wherenarrow streets and lower peak ridership call forsmaller vehicles.
Upgrading the bus fleet with these slightlysmaller buses allows CTA to better allocate itsresources throughout the service area, muchlike having the right tool for the job. Newbuses not only improve the reliability of service,but having smaller-sized buses in the fleetallows service to better match ridership and torealize cost efficiencies that come from oper-ating a smaller vehicle.
Equipped with low emission engines, the lowfloor, air conditioned, accessible Optima buseshave the same amenities that are part of CTA’sexisting bus fleet, including surveillancecameras, bike racks, automated announce-ments and automatic passenger counters thatprovide route usage information to further
improve schedules and monitor ridershippatterns.
Also arriving in 2006 were the first of 265 40-foot, low floor, accessible, air conditioned NewFlyer buses that will further improve servicereliability. The New Flyer buses provide envi-ronmental benefits because they areequipped with low emission engines. Thenew buses replace existing 5300-seriesFlxible buses in CTA’s fleet that werepurchased in 1991. Each New Flyer busproduces 60 percent fewer emissions than thebus it replaces. The entire order of New Flyerbuses further reduces annual emissions levelsof the CTA fleet by 203 tons – or 10 percent.With each bus purchase the CTA incorporatesnew environmentally friendly technology thathelps to reduce emissions and contributes toimproved service reliability.
The New Flyer buses will further enhance theoverall transit experience for many CTA buscustomers. Customer amenities include thesame standard amenities featured on existingbuses in the fleet such as air conditioning,security cameras, bike racks, automatedannouncements and wheelchair ramps. Butthe new buses also have some new customeramenities such as strap hangers for standingcustomers, a rear door easy-touch feature forease in exiting, and a new seat design that isexpected to provide increased comfort.
The $95 million order of 265 New Flyer busesincludes 20 diesel electric hybrid buses thatare powered by both diesel engines and elec-tric motors to further reduce emissions andimprove fuel efficiency. By including 20 hybridbuses as part of the purchase, CTA will beable to evaluate the performance of the envi-ronmentally friendly vehicles in Chicago’sextreme weather conditions. Performanceresults will help determine if hybrid buses aresuitable as future additions to CTA’s fleet.
Since 2000, CTA has purchased more than1,200 new buses for the fleet. The introduction
15
The New Flyer buses help to further reduce annual emission levels ofCTA’s bus fleet by 203 tons or 10 percent.

16
Accomplishments and Plans
of particulate filters and ultra low sulfur dieselfuel along with the improved environmentalperformance of newer buses has helped CTAto reduce its bus fleet’s total 2005 annualemissions by 22 percent, or 564 tons, since1997. By converting to ultra low sulfur dieselfuel in 2003, the CTA is well ahead ofschedule in implementing the 2007 FederalEmission requirements for reduced particulatematter and carbon monoxide.
Significant progress was also made this yearto upgrade CTA’s aging rail fleet. In May, theChicago Transit Board approved a contractfor the manufacture and purchase of 406 newrail cars, with additional options that couldbring the total purchase to 706 cars. The totalcontract is not to exceed $933 million,however, CTA currently has funding for thebase order of 206 and an additional option inthe contract for 200 rail cars for a total of$577 million.
The rail cars will replace older rail cars, somemore than 30 years old, such as the 2200-series Budd cars that were purchased in1969-70 and the 2400-series Boeing-Vertolcars purchased in 1976-78. Upgradedfeatures such as security cameras and aisle-facing seating are included in the specifica-tions, as well as AC, or alternating current,traction motor propulsion.
The existing CTA fleet uses DC, or directcurrent, motors to drive trains. AC propulsionconverts the DC energy in the third (power)rail to alternatingcurrent for the tractionmotors. Converting to amore modern ACsystem will benefitcustomers by improvingreliability and reducethe expense of havingto maintain an outdatedDC system.
Aisle-facing seating will allow CTA to accom-modate more customers per rail car andprovide a more comfortable trip, a priority forthe second largest transit system in thecountry. The aisle-facing seating configurationadds six inches to the narrowest portion of theaisle which allows more room for customerscarrying backpacks, packages, luggage,strollers and bikes. In addition, it allows morespace for standing customers with moresupport poles and straps in the center of thecar and accommodates 40 seats so no seatsare lost as a result of the new reconfiguration.Aisle-facing seating also provides space for anadditional wheelchair position, increasing thetotal to two per car.
Delivery of prototype rail cars is expected in2008. Production of the base order of 206 isexpected to begin in 2009 with delivery begin-ning in 2010. CTA’s most recent purchase ofnew rail cars was in the 1990s when 3200-series cars were purchased for the opening ofthe Orange Line, and to replace older cars onthe Brown and Yellow Lines.
Security EnhancementsMuch of CTA’s investment in its fleet and facili-ties is quite visible to customers, however,when it comes to security enhancements theongoing effort to refine and enhance meas-ures and equipment is most evident behindthe scenes. Security cameras are an increas-ingly important component of enhancingsecurity on the system because they serve as
A preliminary schematic of CTA’s AC propulsion rail cars.

Accomplishments and Plans
a deterrent to crime and assist law enforce-ment in identifying perpetrators. They alsoprovide additional information to CTA opera-tions staff in the event of a service disruption.
CTA’s entire bus fleet has been equipped withsecurity cameras since 2003. CTA beganretrofitting buses with security cameras in 1998and new buses purchased since then have allcome equipped with cameras. The camerashelp to deter vandalism and graffiti, and assistlaw enforcement in investigating incidents andapprehending perpetrators. The new rail carswill come equipped with seven securitycameras per rail car.
In fall 2005, CTA announced a significant mile-stone with the completion of a key portion of itssystemwide fiber optic expansion. The newsystem allows CTA to connect securitycameras to its Control Center and to the City’s9-1-1 Center. The link between CTA’s ControlCenter and the City’s 9-1-1 Center is part of
the Office of Emergency ManagementCommunication’s larger Homeland Securitygrid that is designed to expand the use ofsurveillance cameras throughout Chicago.
Last fall, all 11 stations on the 54th/Cermakbranch had been networked. Today, 464security cameras at 27 stations are a part ofthe network. By the end of this year CTA willhave 1,200 cameras at 45 stations hooked upto the network, and those numbers willcontinue to increase to equip all 144 stationson the rail system as funding becomes avail-able.
CTA has been implementing its plan to installand network security cameras throughout itssystem over the past several years. All newrail stations, such as those recently renovatedon the 54th/Cermak branch and the priorrenovation of the Green Line, include fiberoptics to allow networking of securitycameras. In addition, the Blue Line fromO’Hare to Jackson, the Red Line fromHoward to Roosevelt and the Orange Linehave all undergone fiber optic upgrades. Newfiber optic installation is underway on theLoop elevated, Yellow and Purple Lines andas part of current rehabilitation projects on theDan Ryan branch of the Red Line, the BrownLine and as part of the Chicago Departmentof Transportation’s (CDOT) renovation of theState Street subway.
Fiber optic technology enhances communica-tion systems because it carries more informa-tion, more reliably, with clearer audio andvideo reception. In addition to transmittingvoice and data needs for phone services,public address systems and fare collection,fiber optic installation serves as the basis forexpanding the use of security cameras on thesystem.
In addition to the increased speed andcapacity of the CTA’s communication system,the fiber optic upgrade will save the CTA
17
RRyan, a yellow labrador retriever, is among three explosives-detectioncanine teams assigned to the Chicago Police Department's mass transitunit, which patrols the CTA. Like all dogs in the federal program, RRyanwas named after a victim of the 9/11 attacks. The first "R" in her namemeans that she was born in the 18th litter of the Transit SecurityAdministration's canine explosives-detection program.

18
Accomplishments and Plans
operating costs by eliminating the need tolease several communication lines from anoutside company. As a result, the CTA willown and operate all of its communicationslines for an expected savings of at least$500,000 annually.
Most recently, the Chicago Transit Boardapproved a contract to establish a pilot to testa mobile security network capable ofstreaming real-time video from buses directlyto emergency response vehicles, such asChicago Police Department PublicTransportation police cars, CTA vehicles andto the CTA’s Control Center. The mobile secu-rity network will be able to transmit images ofemergency situations on a CTA bus to emer-gency personnel so they can fully understandthe situation and develop an immediate andthorough response plan. The pilot is plannedfor 50 buses that operate along the #56Milwaukee and #62 Archer routes, 16 transitpolice cars, approximately four CTA firstresponder vehicles and some rail stations.
Local government agencies also are devel-oping wireless security networks using thesame type of transmitting devices that will beinstalled throughout their jurisdictions. Thispotential partnership can create an expandedinfrastructure of transmitting devices that canbe shared among the agencies, greatlyincreasing the networks capability for transmit-ting wireless images, without creating sepa-rate duplicative networks.
Technology and Customer ServiceBut the investment in technology goes beyondsecurity cameras. In fall 2005, CTA completedinstallation of the infrastructure necessary toenhance communication capability in the Redand Blue Line subway system. CTA investedin the technology to enhance its existing two-way radio system and improve subwaycommunication options for CTA, ChicagoPolice Department and Chicago FireDepartment/EMS personnel. In addition, thesystem also allows CTA to generate additionalrevenue by contracting use of the system towireless service providers for the benefit oftransit customers.
This past summer, the first commercial wire-less provider activated its service in the
Through a growing network CTA’s Control Center is able to bring up images from security cameras throughout the system.
Five rail routes serve elevated Loop customers in the city’s CentralBusiness District.

19
Accomplishments and Plans
subway tunnels. Today, only U.S. Cellularcustomers are able to use their wirelessdevices in the subway, however, CTA isworking to add additional service providers tothe system. As more Chicago-area wirelessservice providers contract with the CTA toprovide services, more customers will be ableto use their wireless devices throughout theCTA’s subway system.
Although the main purpose for the investmentwas to improve emergency communicationscapabilities in the subway, by minimallyincreasing the investment made to upgradethe subway communications infrastructure,CTA provided the opportunity for customers touse their wireless devices enhancing securityand convenience. In addition, CTA is able togenerate additional revenue through agree-ments with wireless service providers helpingto fill the gap in the operating budget due toinsufficient funding.
Technology is also being used to help predictthe arrival of CTA buses at bus stops. Thissummer CTA launched the Bus Tracker pilotwhich tracks CTA buses in real time andprovides estimated bus arrival times forcustomers. Global positioning satellite (GPS)technology is used to identify bus locationsand provides that information to buscustomers via a dedicated web site and a bus
shelter display. Knowing when a bus isexpected to arrive ultimately reduces waittimes, which enhances the overall bus travelexperience.
CTA is testing Bus Tracker on buses and one bus shelter along the #20 Madison bus route. To provide information tocustomers, CTA has developed a web site atwww.ctabustracker.com and installed a light-emitting diode (LED) display in the westboundbus shelter located on Madison at Jefferson.
The Bus Tracker web site provides a routemap with icons indicating the location anddirection of each bus currently in servicealong the route and estimated arrival times forbus stops along the route. Customers canchoose to activate an alarm that will alertthem when a bus is approaching their stop.
For customers at the test bus stop, the busshelter display provides an estimated arrivaltime for the route’s next two approachingbuses, in addition to the time and tempera-ture. Throughout the pilot, CTA will evaluatethe performance of the technology and how itfunctions within CTA’s operating environment.In addition, customer feedback regarding theweb site and on-site bus shelter informationwill be considered.
Bus Tracker is the customer notification phaseof bus location technology CTA has beendeveloping and implementing in recent years.The new technologies use real-time data tobetter monitor performance, make serviceadjustments when needed, respond to unex-pected incidents on the roadways and provideinformation on next bus arrival for moreconvenient and reliable public transportationsystem.
The $1.3 million pilot is scheduled to endDecember 2006. The results of the pilot andthe availability of funding will determinewhether the Bus Tracker system will beexpanded to additional routes.
The Bus Tracker pilot provides customers with estimatedarrival times of approaching buses on the #20 Madison route.

Accomplishments and Plans
Increasing ConvenienceWithout question, continued capital investmentin CTA’s fleet, facilities and technologies is crit-ical to enrich the transit environment andprovide customers with a system that is in astate of good repair. But throughout the year,a number of smaller scale improvements wereimplemented to make travel on CTA easierand more convenient for customers.
At the beginning of the year a new monthlyparking pilot program was introduced thatallows customers to reserve parking spaces atthree of CTA’s most heavily used Park & Ridelots near O’Hare and Midway Airports. Duringthe pilot, the CTA is making monthly parkingpermits available for 15 percent of the spacesat the Cumberland Park & Ride located at5800 N. Cumberland on the Blue Line nearO’Hare Airport, and the Midway and PulaskiPark & Ride lots, located at 4612 W. 59thStreet and 5106 S. Pulaski Road, respectively,on the Orange Line near Midway Airport.Customers who reserve a parking space canassure themselves a spot at the lots thatnormally fill up early.
A $43 permit reserves a parking space until 10a.m. daily. Customers are required to pay thedaily parking rate in addition to the $43 permitfee. After 10 a.m., the reservation is forfeitedfor the day and the reserved parking spacebecomes available to all customers enteringthe lot. The reserved spaces are locatedcloser to rail station entrances for addedcustomer convenience. The remainder of thespaces are filled on a first-come, first-servedbasis. The pilot has been well received bycustomers. The lot at Cumberland still hassome reserved spaces available, and theMidway and Pulaski lots currently have waitinglists for reserved spaces.
To improve navigation for bus customers,earlier this year CTA placed directional decalson bus stop signs. The one-inch by six-inch
vinyl decal is positioned underneath the busroute number on the sign and reads eithernorthbound, southbound, eastbound or west-bound to indicate the direction the bus travelsat that stop. On bus stop signs where the bustravels along diagonal streets, the directionalinformation indicates the predominant direc-tion of travel along the route.
More than 2,000 buses operate on 154 CTAbus routes with approximately 12,000 postedbus stops. Of those, more than 9,000 aresingle-route signs that list only one bus route.Decals were added to single-route signs only.Directional decals do not appear on bus stopsigns where there are multiple routes becausethe direction of travel for each route is indi-cated in the written description.
Another pilot program this year lowers the agefrom 17 to 13 when adult supervision isrequired for teenagers to bring bikes on boardCTA. Lowering the accompanied age require-ment is intended to provide additional opportu-
20
Directional decals on bus route signs help customers more easilynavigate CTA’s system.

21
Accomplishments and Plans
nities for teens to combine biking and publictransit to get around the city and suburbs.
CTA Bike & Ride rules allow two bicycles oneach rail car at all hours of operation, with theexception of morning and evening rush hours,and during special events such as July 3rdwhen customer loads are very heavy. Bikesare allowed on rail cars during all hours onweekends and folding bikes are allowed onCTA vehicles at all times.
All CTA buses are equipped with bike racksmounted on the front of the bus that carry twobicycles each and take as little as 30 secondsto load. Customers may use the racks anytime during service hours.
Program guidelines prohibit children under theage of 12 from boarding buses and trains withbicycles. Adult supervision continues to berequired for children from the age of 12 to 13when bringing a bicycle on the system. Forthose who want to pedal to a rail station andcomplete their commute by train, outdoorbicycle racks are available at 93 stations and75 stations have sheltered bike parking orindoor racks for enhanced security.
CTA and the CommunitySeveral station adoptions also contributed toimproving the transit experience forcustomers. The Chicago Cubs adopted theCTA’s Sheridan station on the Red Line. TheCubs commissioned Gallery 37 to create twopieces of art for the station that depict theculture of the Cubs and the surroundingneighborhood. The two pieces were createdby 26 students in the gallery’s innovativeCenter for the Arts eight-week summer artsprogram. The artwork hangs on the northand south walls in the station entry.
Artwork created by Chicago-area junior andsenior high school students now adorns theMidway station on the Orange Line thanksto Urban Gateways: Center for ArtsEducation. The artwork consists of 30pieces each painted on wood and mounteddirectly on the station’s orange ceilingbeams. The paintings follow a time-focusedtheme and include images of the Chicagoskyline, jazz performers, dancers and chil-dren next to clocks.
This year CTA lowered the age from 17 to 13 for children to beaccompanied by an adult when bringing bikes on to the system.
Midway station on the Orange Line features artwork created by local junior high students who participated in Urban Gateways “ Art Options” mentorship program.
Accomplishments and Plans
22
opportunity to enhance and revitalize theappearance of CTA rail stations by commis-sioning local artists to create murals, sculp-tures, mosaics, paintings or photographs.Currently, 23 CTA stations are under adoption.
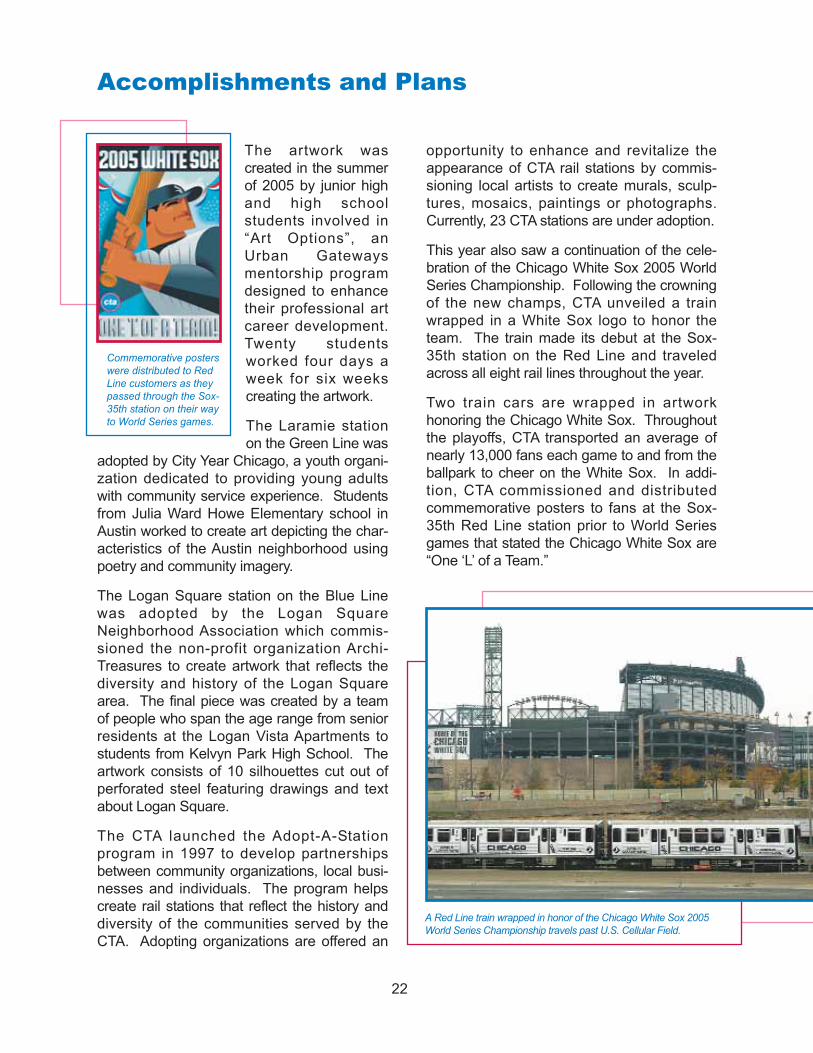
This year also saw a continuation of the cele-bration of the Chicago White Sox 2005 WorldSeries Championship. Following the crowningof the new champs, CTA unveiled a trainwrapped in a White Sox logo to honor theteam. The train made its debut at the Sox-35th station on the Red Line and traveledacross all eight rail lines throughout the year.
Two train cars are wrapped in artworkhonoring the Chicago White Sox. Throughoutthe playoffs, CTA transported an average ofnearly 13,000 fans each game to and from theballpark to cheer on the White Sox. In addi-tion, CTA commissioned and distributedcommemorative posters to fans at the Sox-35th Red Line station prior to World Seriesgames that stated the Chicago White Sox are“One ‘L’ of a Team.”
A Red Line train wrapped in honor of the Chicago White Sox 2005World Series Championship travels past U.S. Cellular Field.
The artwork wascreated in the summerof 2005 by junior highand high schoolstudents involved in“Art Options”, anUrban Gatewaysmentorship programdesigned to enhancetheir professional artcareer development.Twenty studentsworked four days aweek for six weekscreating the artwork.
The Laramie stationon the Green Line was
adopted by City Year Chicago, a youth organi-zation dedicated to providing young adultswith community service experience. Studentsfrom Julia Ward Howe Elementary school inAustin worked to create art depicting the char-acteristics of the Austin neighborhood usingpoetry and community imagery.
The Logan Square station on the Blue Linewas adopted by the Logan SquareNeighborhood Association which commis-sioned the non-profit organization Archi-Treasures to create artwork that reflects thediversity and history of the Logan Squarearea. The final piece was created by a teamof people who span the age range from seniorresidents at the Logan Vista Apartments tostudents from Kelvyn Park High School. Theartwork consists of 10 silhouettes cut out ofperforated steel featuring drawings and textabout Logan Square.
The CTA launched the Adopt-A-Stationprogram in 1997 to develop partnershipsbetween community organizations, local busi-nesses and individuals. The program helpscreate rail stations that reflect the history anddiversity of the communities served by theCTA. Adopting organizations are offered an
Commemorative posterswere distributed to RedLine customers as theypassed through the Sox-35th station on their wayto World Series games.

23
Accomplishments and Plans
2007 PlansNumerous initiatives are currently underway toimprove the fleet, facilities and service CTAprovides. Throughout 2007, customers willcontinue to see progress being made on all ofthese fronts. At the same time, the financialchallenges facing the CTA are greater thanever. In addition to higher fuel and materialscosts, in 2007 the CTA had to budget for anew labor contract in which the arbitrator’sruling increased wages without providing forefficiencies and cost savings to offset them, ashad been done in prior contracts. Althoughthe CTA considered it a priority, the arbitratoralso did not address growing health care costsand pension obligations. With a new directivefrom the Illinois General Assembly requiringthe CTA to fund the pension, there is signifi-cantly increased pressure on the budget.
Projects of the scope and magnitude neces-sary to maintain the second largest transitsystem in the country require a great deal ofsupport, and the CTA has received generoussupport from the City of Chicago in rehabili-tating its facilities. In 2007, CDOT (ChicagoDepartment of Transportation) will begin reno-vation work on the Grand station on the Red
Line. The renovation project involves thecomplete renovation of the mezzanine andplatform, and expansion of the subway station.
The public mezzanine area, which houses thestation, will be expanded, allowing for moreefficient travel through the station. In addition,the number of turnstiles will increase and theinstallation of new exit-only rotogates willaccommodate current and future ridershipneeds. The platform design theme follows thedesign motif incorporated at other Red Linesubway stations rehabilitated by CDOT –Lake, Chicago and Jackson – and includesglazed ceramic tile, vaulted ceiling panels andwalls featuring the cityscape.
Early next year, CDOT’s renovation of theJackson station on the Blue Line will becomplete. Crews began work on the $15.3million project in November 2005. Renovationwork includes rebuilding the station’s platformand mezzanine between Jackson and VanBuren, adding new granite floors, glazed blockwalls and a mosaic tile ceiling at the platformlevel.
The station will also feature a new fare arraylayout providing room for one new fare turn-stile for a total of six, and provisions havebeen made for two additional fareboxes duringspecial events. This will be the first Blue Linestation renovated by CDOT that will incorpo-rate a design theme that features glazed tilewalls with an abstract blue rail pattern relatedto the rail line. The design theme, similar toone developed for several recently renovatedRed Line subway stations, is intended topromote the identity of the stations and thetransit line and will be used in future Blue Linesubway renovation projects.
Also included are one new escalator from themezzanine to street level (which replaces thesoutheast staircase), one new escalator fromthe platform to the mezzanine, and engi-neered acoustical panels to reduce noise atthe platform level. New stair entrances and an
The Chicago Department of Transportation’s $16.9 million investmentin the reconstruction of the Red Line’s Jackson platform includes newlighting, acoustical panels and new street identifier signs.

24
Accomplishments and Plans
escalator canopy at street level will enhancestation identification on Dearborn Street. Sixdigital information screens offering CTAservice information will also be installed—twoat mezzanine level and four on the platform.
Since 1997, CDOT has completed 15 proj-ects to make improvements to CTA infrastruc-ture, turning them into welcoming gatewaysinto the city. CDOT’s investment in reno-vating stations allows CTA the opportunity touse its capital funds for improvements else-where on the system.
Since 1989, the City of Chicago has invested$828.5 million in CTA infrastructure improve-ments. These include renovations to the plat-form at the Jackson station on the Red Lineand reconstruction of the Red Line platformbetween Adams and Van Buren completed in2004, as well as rehabilitation of the under-ground transfer tunnel that provides apedway connection between the Red andBlue Line platforms at Jackson completed in2003. Additional projects include theRoosevelt Connector project, which wascompleted in December 2002, the renovatedChicago Avenue station on the Red Line thatwas completed in 2001 and the elevatedLibrary-State/Van Buren station that wascompleted in 1997.
Plans to renovate the Red Line’s Wilsonstation will continue to develop throughout2007. The station was originally constructed in1900 and the design phase of rehabilitatingthe Wilson station is currently underway.Customers using this station will experiencethe benefit of modern amenities whilepreserving the station’s historic architecturalfeatures. The station will be fully accessible topeople with disabilities and offer upgradedcustomer amenities, such as a new platform,signage, overhead heaters and an elevator.
Although renovation of existing infrastructure isa major focus, plans continue to move forward
to extend the current system. In 2006, theChicago Transit Board approved a contract tobegin Alternatives Analysis studies forextending the Red Line to 130th Street,extending the Orange Line to Ford City andextending the Yellow Line to WestfieldShoppingtown Old Orchard. The AlternativesAnalysis process for the three proposed railextensions is expected to begin in early 2007.
Extending the Red Line from its existing southterminal at 95th Street to a new terminal at130th would streamline bus-to-rail connec-tions for 13 CTA bus routes and six Paceroutes, and would also connect with the SouthShore commuter rail line.
Extending the Orange Line to Ford City wouldcomplete the original Orange Line plan toprovide improved access to downtown fromthe far southwest side and from the centralcity to the strong employment corridor alongSouth Cicero Avenue.
Extending the Yellow Line would provideservice to major destinations such asWestfield Shoppingtown Old Orchard, CookCounty Courthouse, and adjacent office and
A Visitor Pass machine is conveniently located at the Blue Line station atO'Hare for CTA customers to include public transit as part of their travel.
Accomplishments and Plans
retail developments currently just beyond thereach of the existing terminal. Expandingservice would strengthen the reverse-commute flow along both the Yellow and RedLines, and make better use of CTA’s existingservice capacity.
The Alternatives Analysis is currentlyunderway for the proposed Circle Line andwill continue through fall 2007. The proposedline would connect nearly all of the city’smajor employment and special event destina-tions with CTA and Metra rail lines. Thiswould make rail service more attractive to alltransit customers and reduce travel times.The Circle Line project is designed to provideconvenient shortcuts for CTA and Metracustomers making crosstown trips, while alsoimproving access to the periphery ofChicago’s central area.
Alternatives Analysis studies are designed toidentify the preferred form of transit for theareas, routes, station locations, preliminaryridership estimates, constructability reviewsand risk assessments, operating and capitalcost estimates, and implementation sched-ules. Alternatives Analysis studies are alsothe first planning step in the Federal TransitAdministration’s New Starts process for the
purpose of pursuing federal funding. The FTANew Starts program requires conceptualtransit project proposals to proceed through aformal process of planning, design andconstruction and consists of five formal steps:Alternatives Analysis, Environmental ImpactStatement, Preliminary Engineering, FinalDesign and Construction.
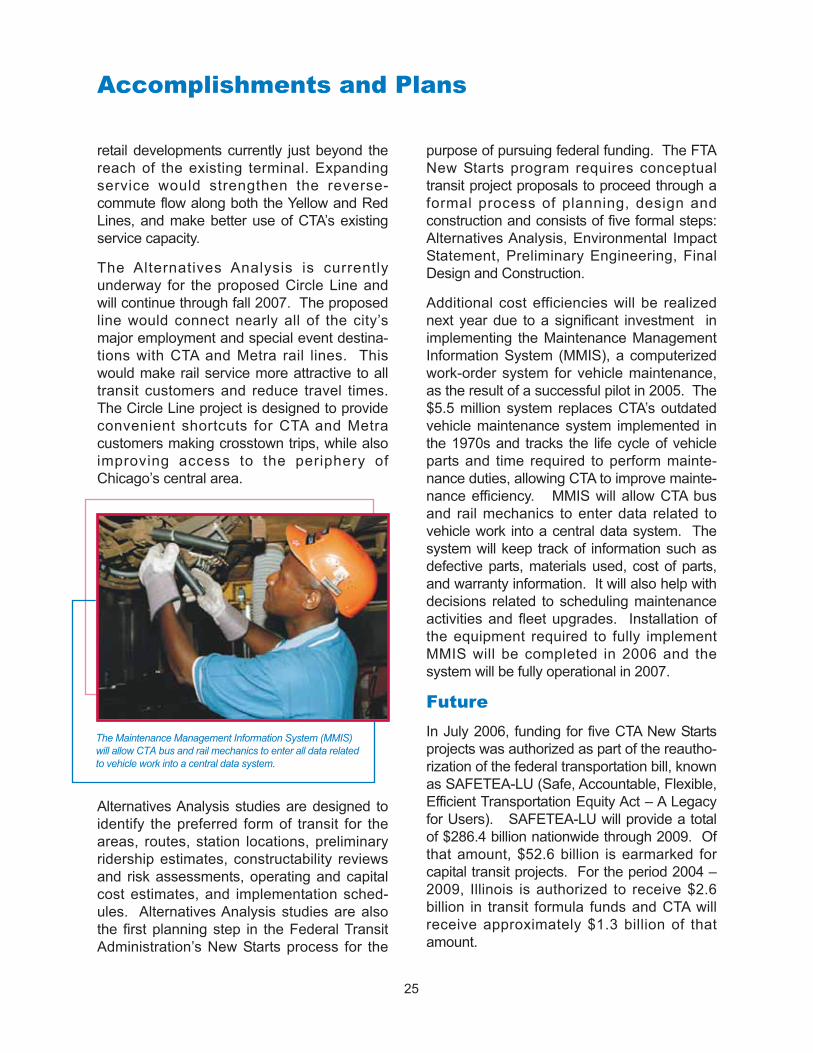
Additional cost efficiencies will be realizednext year due to a significant investment inimplementing the Maintenance ManagementInformation System (MMIS), a computerizedwork-order system for vehicle maintenance,as the result of a successful pilot in 2005. The$5.5 million system replaces CTA’s outdatedvehicle maintenance system implemented inthe 1970s and tracks the life cycle of vehicleparts and time required to perform mainte-nance duties, allowing CTA to improve mainte-nance efficiency. MMIS will allow CTA busand rail mechanics to enter data related tovehicle work into a central data system. Thesystem will keep track of information such asdefective parts, materials used, cost of parts,and warranty information. It will also help withdecisions related to scheduling maintenanceactivities and fleet upgrades. Installation ofthe equipment required to fully implementMMIS will be completed in 2006 and thesystem will be fully operational in 2007.
FutureIn July 2006, funding for five CTA New Startsprojects was authorized as part of the reautho-rization of the federal transportation bill, knownas SAFETEA-LU (Safe, Accountable, Flexible,Efficient Transportation Equity Act – A Legacyfor Users). SAFETEA-LU will provide a totalof $286.4 billion nationwide through 2009. Ofthat amount, $52.6 billion is earmarked forcapital transit projects. For the period 2004 –2009, Illinois is authorized to receive $2.6billion in transit formula funds and CTA willreceive approximately $1.3 billion of thatamount.
The Maintenance Management Information System (MMIS) will allow CTA bus and rail mechanics to enter all data related to vehicle work into a central data system.
25

26
Accomplishments and Plans
In order to secure the federal funding availableunder SAFETEA-LU, CTA must secure anadequate level of non-federal matching funds.Securing CTA’s formula funds for 2006 through2009 – not including New Starts grants – willrequire more than $200 million in non-federalmatching funds. From 2000 through 2004, asignificant portion of the region’s matchingfunds came from Illinois FIRST legislationwhich expired on June 30, 2004, leavingtransit agencies in Illinois without an adequatesource of non-federal matching funds. CTA isworking with the Regional TransportationAuthority (RTA) and the Illinois Legislature toenact a replacement of Illinois FIRST andensure that the Chicagoland region willreceive all of the federal transit funds appropri-ated. Major CTA capital improvements suchas the rebuild of the 54th/Cermak branch ofthe Blue Line, the purchase of new buses,current work on the rehabilitation of the DanRyan branch of Red Line and expandingcapacity on the Brown Line, would not havebeen possible without the matching fundsprovided by the state’s Illinois FIRST program.
Recently CTA conducted an extensive exami-nation of the its assets and infrastructure,including rail stations, tracks and support facili-ties and determined that an $8 billion capitalinvestment is needed in the next five years inorder to allow the CTA to get to a state of goodrepair. Including all planned rail line exten-sions would increase the figure to more than$10 billion.
Of the projected $8 billion need, CTA staff hasidentified about $2.2 billion that could be avail-able through federal funding or CTA-issuedbonds, leaving a potential unfunded need at$5.8 billion. A decision on an anticipated statecapital program could help narrow the gap.
Projects include replacing and rehabbingaging buses and trains to improve reliabilityand customer comfort; retrofitting rail cars withcameras to enhance customer safety and
system security; rebuilding train stations toincrease circulation and accessibility;expanding the new Bus Tracker program toprovide arrival information for all bus lines;upgrading the public address system to offertimely and clear information during servicedisruptions; upgrading signal and communica-tions system to improve system reliability; andextending the Red, Orange and Yellow Lines.
CTA’s previous capital assessment identified$5.1 billion of needed projects. The updated$8 billion figure resulted from a rigorous 18-month assessment that the CTA started toprepare for a successor capital program toIllinois FIRST. Also contributing was a direc-tive from the Illinois legislature to the StateAuditor General to review CTA’s operationsand management, including its capitalprogram. The result is the CTA’s mostcomprehensive needs assessment in nearly10 years.
The right capital investments can decreaseoperating costs, increase reliability andimprove overall service quality. With recordgas prices making public transit an increas-
Capital funding allowed CTA to renovate the station, trackstructure and platform at Central Park station as part of thesuccessful rebuild of the 54th/Cermak branch.

Accomplishments and Plans
ingly attractive option, it is important to under-stand the big picture so that CTA, its customersand all those who take an interest in CTA activi-ties can see what level of service is possiblewith a solid investment and, alternatively, whatis likely without one.
The CTA’s long-standing capital goal is to reachwhat is known in the transit industry as a “Stateof Good Repair.” It requires that equipmentand facilities are upgraded and replaced in atimely manner and that service managementsystems should be modern and reliable.
Although CTA constantly invests in improve-ments to its fleet and facilities, the fact remainsthat some of the infrastructure and facilities aremore than 100 years old, and all of it is agingyear after year. To achieve and maintain astate of good repair requires continued invest-
ment. CTA operates on a 24/7 basis with aheavy and growing daily demand. Timelymaintenance and replacement of agingassets is necessary to keep trains and busesrunning, to keep facilities safe and efficient, toincorporate technologies that will improveservice for customers, and to control futurecosts.
With sufficient resources, CTA and its partnertransit agencies can rapidly transition from astruggle to maintain services to a new era ofunprecedented ridership increases andcustomer satishfaction.
Additional funding can put transit on a moreequal footing with driving for local andregional travel. Linking multiple destinationswith frequent service during both the peakand off-peak periods is essential to posi-tioning transit as a genuinely competitivetravel option. Being able to "go anywhere,anytime" using transit makes it feasible forhouseholds to strength their finances byreducing dependence on auto use and evenauto ownership.
In recent years the CTA has made significantprogress in its capital program thanks tofederal funding and the state’s last capitalprogram, Illinois FIRST, which provided theCTA with more than $800 million in invest-ment between 2000 and 2004 and enabled itto leverage federal funding. As a result, theCTA increased the investment in its capitalprogram from 19 percent of the fundingneeded to get to a state of good repair in1999 to nearly 60 percent by 2004.
Recent investments include the renovation ofthe 54th/Cermak branch of the Blue Line andthe Dan Ryan branch of the Red Line; thepurchase of more than 1,100 new buses thatare air conditioned and accessible to peoplewith disabilities; the refurbishment of nearly1,200 rail cars; the replacement of 15 miles ofdouble track, 40 miles of cable and 27 milesof rail; renovation of 30 rail stations, installa-
An elevated train travels above the Loop as runners compete in the LaSalle Bank Chicago Marathon.
27

28
Accomplishments and Plans
tion of new elevators and escalators, andstructural projects such as Harrison Curve andthe Paulina Connector that have enabledservice improvements.
Despite the recent success in securingfunding, the reality is that too few funds havebeen spread too thinly over too many needsfor too long. Maintaining infrastructure as oldand vast as CTA’s is a challenge that requiresdedicated funding.
And, while it is vital to secure capital funding, itis also imperative to secure dedicated oper-ating funding for both system growth andexisting service. Without sufficient operatingfunding, the CTA will be unable to operate letalone continue to provide an attractive level ofservice for existing and new customers.
Investments CTA has already made toupgrade its rail system are now playing asignificant role in the strength of the City ofChicago’s bid to host the 2016 OlympicGames. The Garfield and 51st Street stationson the Green Line and the Garfield station onthe Red Line provide service to the proposedsite of the City’s Olympic Stadium atWashington Park. This year the $283 millionrenovation of the Dan Ryan branch of the Redline will be completed and the $406 millionrebuild of the Green Line was completed in1996. In addition to having public transitalready in place to serve the proposed venue,Chicago is able to boast a strong and wellestablished public transit network to accom-modate the millions of spectators and athletesfrom around the world who would call Chicagohome throughout the Olympic games.
The CTA is committed to serving itscustomers. As we move ahead into 2007 andbeyond, we will continue to look for the mostefficient operating methods and call upon theresourcefulness of staff to help reduce costsand increase revenue. Our focus remains onmaintaining and continually improving the levelof service currently provided to our customers.
The region we serve is one of the mostdynamic in the country, and we will worktogether to provide service that is on time,clean, safe and friendly for everyone whotravels on the CTA system.
“Moving Beyond Congestion”, the allianceformed by the RTA, CTA, Metra and Pace hasidentified 2007 as the year of decision that willdetermine whether we modernize our transitnetwork or we shrink it.
The transit agencies have all joined togetherto build a regional consensus for significantimprovement and expansion of transit that willpay large dividends for years to come inincreased economic activity, less road conges-tion and increased consumer savings from ourtransit network.
We are confident that by working together theright decisions will be made on behalf oftransit and on behalf of the people ofNortheastern Illinois who rely on public transitor benefit from its existence.
An ‘L’ train travels on elevated tracks over throngs of White Sox fanstaking part in the parade and celebration of the World SeriesChampionship.
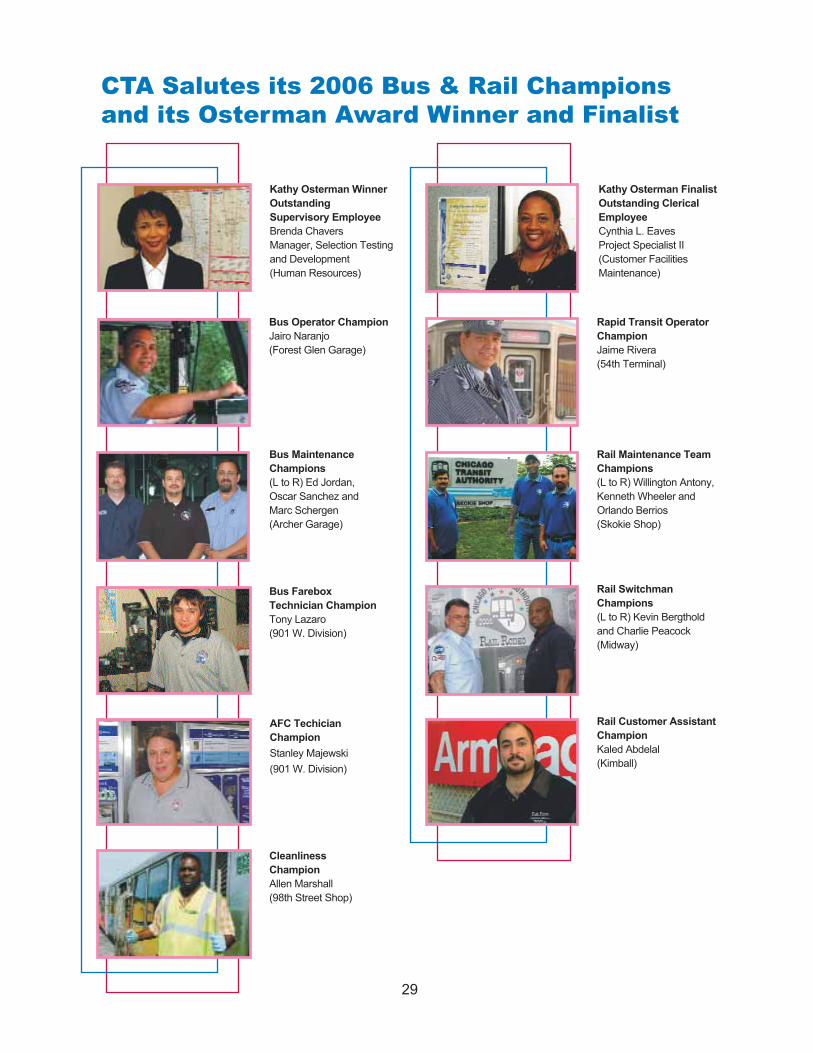
29
CTA Salutes its 2006 Bus & Rail Champions and its Osterman Award Winner and Finalist
AFC TechicianChampionStanley Majewski(901 W. Division)
Bus MaintenanceChampions(L to R) Ed Jordan,Oscar Sanchez and Marc Schergen(Archer Garage)
Bus Operator ChampionJairo Naranjo(Forest Glen Garage)
Rapid Transit OperatorChampionJaime Rivera(54th Terminal)
Rail Customer AssistantChampionKaled Abdelal(Kimball)
Rail SwitchmanChampions(L to R) Kevin Bergthold and Charlie Peacock (Midway)
Rail Maintenance TeamChampions(L to R) Willington Antony,Kenneth Wheeler andOrlando Berrios (Skokie Shop)
CleanlinessChampionAllen Marshall (98th Street Shop)
Bus Farebox Technician ChampionTony Lazaro(901 W. Division)
Kathy Osterman WinnerOutstanding Supervisory EmployeeBrenda ChaversManager, Selection Testingand Development (Human Resources)
Kathy Osterman FinalistOutstanding ClericalEmployee Cynthia L. EavesProject Specialist II(Customer FacilitiesMaintenance)

2006 Operating Budget
CourteousWe will create a pleasant environment for our customers and ourselves.

(In Thousands) 2006 2006 (Unfav)/Fav (Unfav)/FavBudget Forecast Variance % Variance
Operating Expenses
Labor $ 748,922 $ 769,163 $ (20,241) (2.7) %Material 67,088 75,337 (8,249) (12.3) %Fuel 48,000 55,003 (7,003) (14.6) %Power 24,526 21,582 2,944 12.0 %Provision for Injuries and Damages 33,000 53,000 (20,000) (60.6) %Purchase of Security Services 35,335 31,000 4,335 12.3 %Purchase of Paratransit 29,582 27,369 2,213 7.5 %
Other Expenses
Utilities 17,542 20,891 (3,350) (19.1) % Advertising and Promotion 4,935 2,331 2,604 52.8 % Contractual Services 36,993 36,597 396 1.1 % Leases and Rentals 2,420 2,032 387 16.0 % Travel, Training, Seminars, and Dues 3,211 2,956 259 8.1 % Warranty and Other Credits (20,932) (21,121) 189 (0.9) % General Expenses 6,063 6,059 3 0.1 %Total Other Expenses 50,232 49,744 488 1.0 %
Total Operating Expenses $ 1,036,685 $ 1,082,198 $ (45,513) (4.4) %
System Generated Revenue
Fares and Passes $ 426,522 $ 463,808 $ 37,286 8.7 %Reduced Fare Subsidy 30,590 32,000 1,410 4.6 %Advertising, Charter & Concessions 24,800 24,771 (29) (0.1) %Investment Income 4,944 11,018 6,074 122.9 %Statutory Required Contributions 5,000 5,000 0 0.0 %All Other Revenue 20,773 21,545 772 3.7 %
Total System Generated Revenue $ 512,629 $ 558,142 $ 45,513 8.9 %
Public Funding Required for Operations $ 524,056 $ 524,056 $ 0 0.0 %
IDOT Grant 27,126 27,126 0 0.0 %Capital Offset 41,166 41,166 0 0.0 %Public Funding Available through RTA 455,764 455,764 0 0.0 %
Total Funding $ 524,056 $ 524,056 $ 0 0.0 %
Recovery Ratio * 52.98% 54.76% 1.78 3.4 %
Required Recovery Ratio 53.00% 53.00% - - %
Fund Balance $ - $ - $ - $ -
2006 Operating Budget Schedule
*Recovery ratio is calculated by dividing System Generated Revenues over Operating Expense. The calculation includes, In-kind revenues and expenses for security provided by the City of Chicago, excludes security expense and includes some grant revenues.
30

2006 Operating Budget Performance Summary
31
The Chicago Metropolitan region’s economy added over 100,000 jobs to the local market during the first eight months of 2006, pushing the employment rate to 95.3 percent in June compared to 94 percent at the end of 2005. Retail sales were strong as evidenced by the sales tax revenues through June that showed year-over-year increases of 7.8 percent in the City of Chicago, 6.4 percent in suburban Cook County and 7.6 percent in the Collar Counties. Passenger travel at the airports experienced an increase of over one percent at O’Hare and over 12 percent at Midway. The Gross Domestic Product (GDP) growth for the country was 5.6 percent in the first quarter and 2.6 percent in the second quarter. These economic factors provided an environment that helped to foster ridership and revenue growth for the CTA. Rising fuel and commodity prices contributed to a significant increase in CTA’s operating expenses. U.S. crude oil prices increased from $49.37 per barrel on December 31, 2005 to $77.05 on August 7, 2006 – a 56.1 percent increase in seven months. The rise in energy prices led to increases in the Consumer Price Index (CPI). For the first seven months of 2006, the U.S. city average CPI rate was 3.9 percent. The Producer Price Index rose 6.9 percent for the same period. These factors influenced the Federal Reserve Board to increase the Federal Funds rate from 4.25 percent at the end of 2005 to the current rate of 5.25 percent. During 2006, CTA experienced some high points as well as some fiscal challenges. In July, the labor contracts for the largest two unions, representing 85 percent of the organized labor
workforce, were settled through arbitration. The arbitration award provided for a 10.1 percent increase in wages over the three-year period ending December 31, 2006. The arbitration award exceeded amounts estimated in the budget for the three year period by $27 million, but failed to address healthcare and pension, two large and growing components of CTA’s operating budget. On May 4, 2006, the Illinois General
Assembly approved a bill requiring CTA, beginning in 2009, to achieve a 90 percent funded ratio for its employee pension plan by the end of 2058. It is estimated that this will require an additional $176 million annually in funding to the pension plan; which is equal to 37 percent of CTA’s 2006 public funding through RTA.
Producer Price Index
5.36.2
7.3 6.9
0
2
4
6
8
10
2003 2004 2005 2006
Perc
ent
Source: www.bls.govJanuary - July
Chicago Metropolitan Region Employment
4.0 4.0 4.0 4.04.0
3.8
3.7 3.73.7 3.7
3.50
3.60
3.70
3.80
3.90
4.00
4.10
2002 2003 2004 2005 Aug. YTD2006
Mill
ions
Source: Illinois Department of Employment Security
Eligible Workforce Employed

2006 Operating Budget Performance Summary
32
In 2005, CTA hired AECOM Consult to identify short-term and long-term cost reduction opportunities throughout 18 functional areas. As a result of its review, AECOM developed 246 specific recommendations representing an annual savings of approximately $159 million. The
majority of these recommendations relate to CTA efficiencies and business improvement opportunities focusing on employee productivity, information systems utilization, streamlining contracting practices and better customer service. Of the $159 million in projected savings, approximately $111 million require changes in CTA’s collective bargaining agreements or legislation. The CTA Board directed staff to include $5.0 million of savings from
the implementation of AECOM recommendations in the 2006 operating budget. To date, the CTA has implemented and/or closed/consolidated 93 of the AECOM recommendations, encompassing nearly $47.0 million in expected savings or additional revenue generation in 2007. As the CTA works with Metra, Pace and the RTA to increase transit funding for the region, it has had to stretch current resources to fund operations. In 2006, CTA reluctantly transferred $41.0 million of capital funds to support operating costs. However, the practice of diverting capital funds ultimately puts the capital program at risk, escalating the future cost of capital programs and increasing operating costs in the long run. The following sections discuss CTA’s performance during 2006. RIDERSHIP CTA continued to experience ridership growth in 2006. Improved service, route realignments, fare restructuring, higher gas prices and an improved Chicago regional economy were all contributing factors in this robust growth. Ridership for 2006, including rail-to-rail crossovers, is forecast at 497.4 million trips. This forecast is 7.8 million trips, or 1.6 percent higher than the 2006 budget, and 5.0 million trips, or 1.0 percent higher than the 2005 actual ridership. This ridership gain was realized despite the loss of 1.2 million paratransit trips due to transitioning this service to Pace on July 1. Although overall ridership increased, CTA saw a ridership loss on the bus system, which was offset by strong ridership on the rail system. The decline in ridership on the bus system is attributed in part to the implementation of CTA’s new fare strategy that focused
The 2006 budget and financial results include the utilization of $41.0 million of capital funds to support operations.
CTA Annual Ridership
466.7479.6 485.3
474.9 475.0492.4 497.4
484.8
350
400
450
500
550
1999 2000 2001 2002 2003 2004 2005 2006Forecast
Ridership includes rail-to-rail transfers
Rid
ersh
ip (M
illion
s)
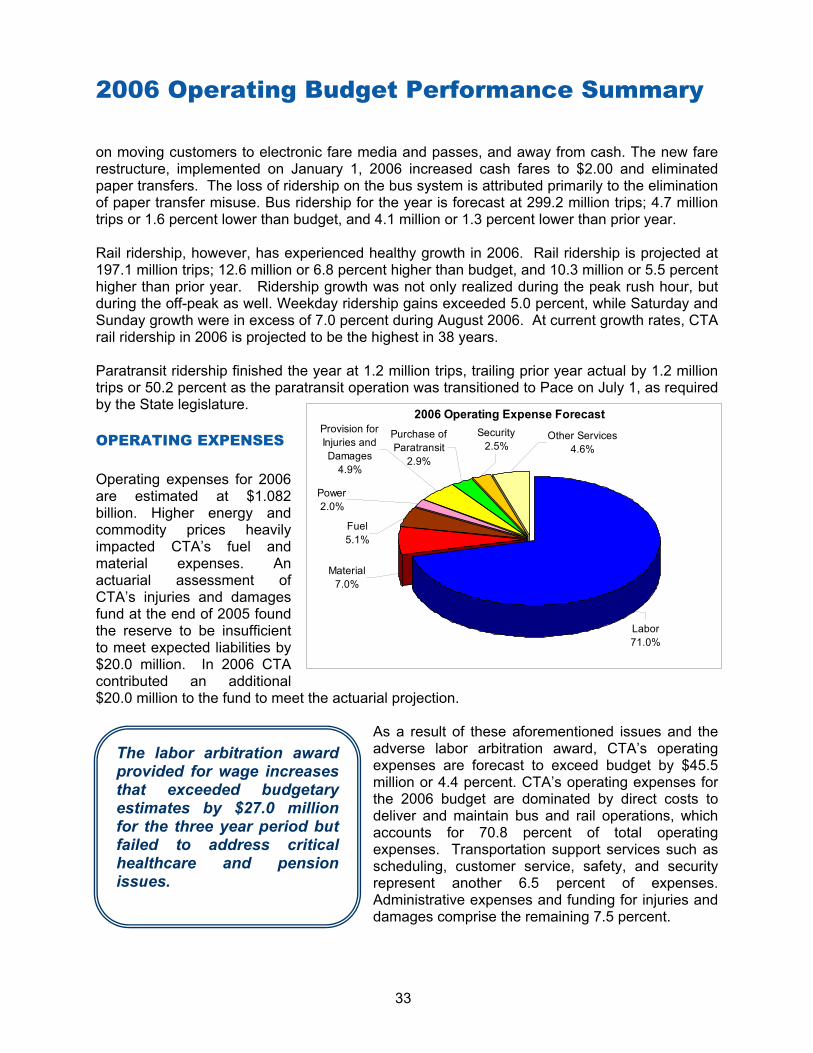
2006 Operating Budget Performance Summary
33
on moving customers to electronic fare media and passes, and away from cash. The new fare restructure, implemented on January 1, 2006 increased cash fares to $2.00 and eliminated paper transfers. The loss of ridership on the bus system is attributed primarily to the elimination of paper transfer misuse. Bus ridership for the year is forecast at 299.2 million trips; 4.7 million trips or 1.6 percent lower than budget, and 4.1 million or 1.3 percent lower than prior year. Rail ridership, however, has experienced healthy growth in 2006. Rail ridership is projected at 197.1 million trips; 12.6 million or 6.8 percent higher than budget, and 10.3 million or 5.5 percent higher than prior year. Ridership growth was not only realized during the peak rush hour, but during the off-peak as well. Weekday ridership gains exceeded 5.0 percent, while Saturday and Sunday growth were in excess of 7.0 percent during August 2006. At current growth rates, CTA rail ridership in 2006 is projected to be the highest in 38 years. Paratransit ridership finished the year at 1.2 million trips, trailing prior year actual by 1.2 million trips or 50.2 percent as the paratransit operation was transitioned to Pace on July 1, as required by the State legislature. OPERATING EXPENSES Operating expenses for 2006 are estimated at $1.082 billion. Higher energy and commodity prices heavily impacted CTA’s fuel and material expenses. An actuarial assessment of CTA’s injuries and damages fund at the end of 2005 found the reserve to be insufficient to meet expected liabilities by $20.0 million. In 2006 CTA contributed an additional $20.0 million to the fund to meet the actuarial projection.
As a result of these aforementioned issues and the adverse labor arbitration award, CTA’s operating expenses are forecast to exceed budget by $45.5 million or 4.4 percent. CTA’s operating expenses for the 2006 budget are dominated by direct costs to deliver and maintain bus and rail operations, which accounts for 70.8 percent of total operating expenses. Transportation support services such as scheduling, customer service, safety, and security represent another 6.5 percent of expenses. Administrative expenses and funding for injuries and damages comprise the remaining 7.5 percent.
2006 Operating Expense Forecast
Fuel5.1%
Material7.0%
Other Services4.6%
Power2.0%
Security2.5%
Provision for Injuries and Damages
4.9%
Purchase of Paratransit
2.9%
Labor71.0%
The labor arbitration award provided for wage increases that exceeded budgetary estimates by $27.0 million for the three year period but failed to address critical healthcare and pension issues.

2006 Operating Budget Performance Summary
34
Labor expense is projected at $769.2 million, which is $20.2 million or 2.7 percent higher than budget. As explained earlier, labor expense was adversely impacted by the arbitration award. Wage rate increases under this award, when applied to all union employees, exceed amounts provided in the budget for the three year period by $27.0 million and $20.0 million annually thereafter. For the three-year period starting January 1, 2004 and ending December 31, 2006, wage rates increased by 10.1 percent. Benefits (excluding paid time off) provided to CTA employees equal approximately 27 percent of CTA’s labor costs. Rising commodity and energy prices spurred price increases on building materials, vehicle replacement parts and other materials CTA uses in day-to-day system maintenance. Material expense is forecast at $75.3 million, which is $8.2 million higher than budget. Higher energy prices have been one of the primary cost drivers of CTA’s operating expense
increases. Fuel for revenue equipment is forecast at $55.0 million for 2006, which is $7.0 million or 14.6 percent more than budget and $9.2 million or 20.1 percent more than 2005. Consumption is forecast at 24.2 million gallons and is slightly higher than budget. The 2006 budget assumed an average price of $2.00 per gallon. Fuel prices are estimated to end the
year at a net average price of $2.27 per gallon. This price is net of gains achieved from the fuel hedge initiative. The fuel hedge program provided approximately $2.0 million in savings during 2006. Since the inception of the fuel hedge initiative in 2003, the CTA has realized over $10.0 million dollars in savings. Electric power for the rail system is forecast at $21.6 million, which is below budget by $2.9 million or 12.0 percent. The power expense is below budget partially due to a warmer than average winter. Provision for injuries and damages represents expenses for claims and litigation for incidents that occur on CTA property or with CTA vehicles. The 2006 forecast for this category is $53.0 million. This exceeds budget by $20.0 million as the CTA took advantage of strong fare box revenues to cover the unfunded liability reported by the actuary at the end of 2005. According to the 2005 actuarial report, the damage reserve fund was under funded by approximately $20.0 million based on projected liability of all claims against the CTA. Based on funding the reserve at the amount estimated by the actuaries during 2006, CTA expects this expense to be lower in future years.
CTA's Average Cost of Diesel Fuel Price per Gallon
$0.00
$0.50
$1.00
$1.50
$2.00
$2.50
1995 1996 1997 1998 1999 2000 2001 2002 2003 2004 2005 YTD2006
Since its inception in 2003, CTA’s fuel hedge initiative has saved the agency over $10.0 million dollars.
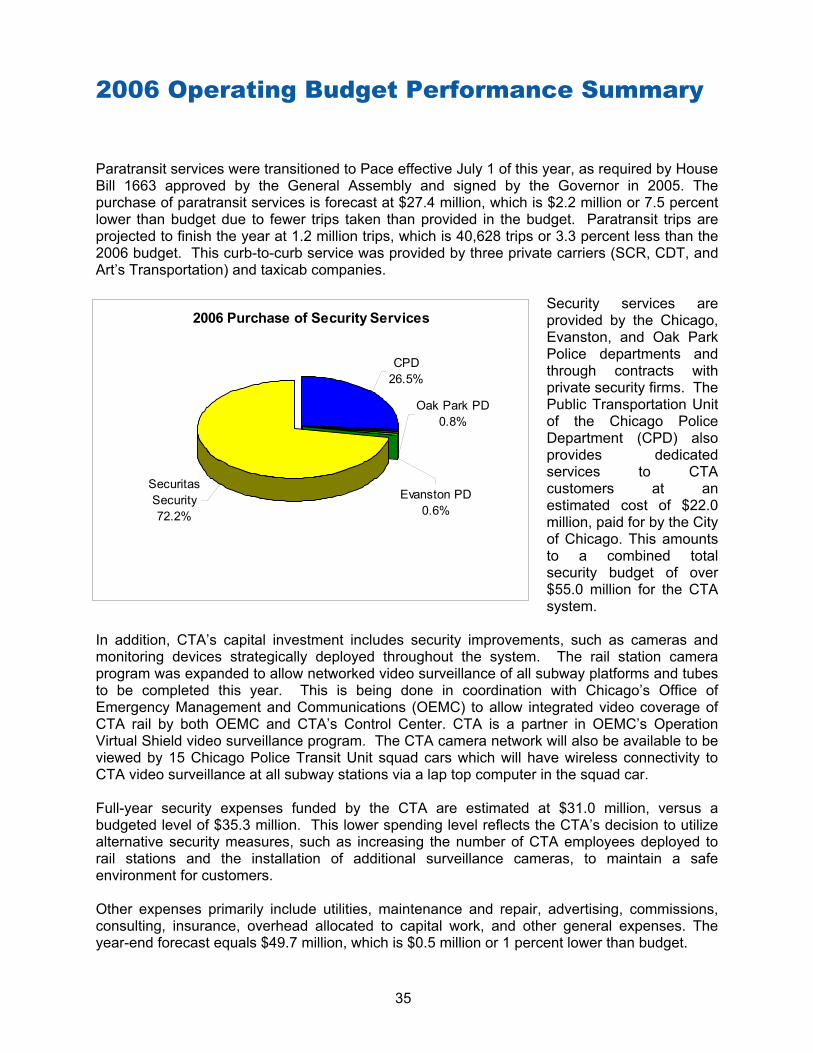
2006 Operating Budget Performance Summary
35
Paratransit services were transitioned to Pace effective July 1 of this year, as required by House Bill 1663 approved by the General Assembly and signed by the Governor in 2005. The purchase of paratransit services is forecast at $27.4 million, which is $2.2 million or 7.5 percent lower than budget due to fewer trips taken than provided in the budget. Paratransit trips are projected to finish the year at 1.2 million trips, which is 40,628 trips or 3.3 percent less than the 2006 budget. This curb-to-curb service was provided by three private carriers (SCR, CDT, and Art’s Transportation) and taxicab companies.
Security services are provided by the Chicago, Evanston, and Oak Park Police departments and through contracts with private security firms. The Public Transportation Unit of the Chicago Police Department (CPD) also provides dedicated services to CTA customers at an estimated cost of $22.0 million, paid for by the City of Chicago. This amounts to a combined total security budget of over $55.0 million for the CTA system.
In addition, CTA’s capital investment includes security improvements, such as cameras and monitoring devices strategically deployed throughout the system. The rail station camera program was expanded to allow networked video surveillance of all subway platforms and tubes to be completed this year. This is being done in coordination with Chicago’s Office of Emergency Management and Communications (OEMC) to allow integrated video coverage of CTA rail by both OEMC and CTA’s Control Center. CTA is a partner in OEMC’s Operation Virtual Shield video surveillance program. The CTA camera network will also be available to be viewed by 15 Chicago Police Transit Unit squad cars which will have wireless connectivity to CTA video surveillance at all subway stations via a lap top computer in the squad car. Full-year security expenses funded by the CTA are estimated at $31.0 million, versus a budgeted level of $35.3 million. This lower spending level reflects the CTA’s decision to utilize alternative security measures, such as increasing the number of CTA employees deployed to rail stations and the installation of additional surveillance cameras, to maintain a safe environment for customers. Other expenses primarily include utilities, maintenance and repair, advertising, commissions, consulting, insurance, overhead allocated to capital work, and other general expenses. The year-end forecast equals $49.7 million, which is $0.5 million or 1 percent lower than budget.
2006 Purchase of Security Services
CPD26.5%
Securitas Security72.2%
Oak Park PD0.8%
Evanston PD0.6%

2006 Operating Budget Performance Summary
36
OPERATING REVENUES System-generated revenues are projected at $558.1 million and compare favorably to budget by $45.5 million or 8.9 percent. All revenue categories are projected to finish the year ahead of or on par with budget. CTA’s new fare strategy was a big success in 2006. Revenues from fares are forecast at $463.8 million. This is $37.3 million or 8.7 percent higher than budget principally due to the fare plan implemented in January and higher ridership. The average fare including cross platform trips is projected at $0.93 reflecting increased system cash and transit card fares on the rail system, as well as customers migrating to passes for convenience but using them less frequently. The elimination of paper transfer abuse also contributed to the higher average fare. Reduced fare subsidy is the State of Illinois’ reimbursement to Service Boards for discounted fares to the elderly, people with disabilities, and student customers. Revenue from reduced fare reimbursement is projected at $32.0 million and is $1.4 million more than budget due to CTA’s higher share of the funding as a result of ridership. Advertising, charter, and concessions revenues in 2006 are projected to be $24.8 million, which is equal to budget. Investment income is estimated at $11.0 million, which is $6.1 million or 122.9 percent higher than budget. This is primarily due to higher investment rates resulting from Federal Reserve Board rate increases. Since the end of last year, the Federal Reserve has increased the Federal Funds rate to 5.25 percent. The CTA benchmarks its investments against the 90-day treasury rates. In December 2005, the 90-day treasury rate was 3.89 percent. This rate has since increased to 4.96 percent. Statutory required contributions of $5.0 million are on par with budget. The RTA Act requires the City of Chicago and Cook County to contribute $3.0 million and $2.0 million, respectively, in cash towards CTA operations each year. Other revenues are projected at $21.5 million, $0.7 million higher than budget. This is due to higher rental and parking revenue.
2006 Operating Revenue Forecast
Fares & Passes83.1%
Investment Income2.0% All Other Revenue
3.9%Advertising, Charter &
Concessions4.4%
Statutory Required Contribution
0.9%
Reduced Fare Subsidy
5.7%

2006 Operating Budget Performance Summary
37
Public funding received through the RTA was $524.1 million and mirrored the budget. This funding is composed of sales tax and discretionary funding from the RTA, a grant from IDOT to fund paratransit, and $41.2 million in capital funding. The CTA projects a balanced budget for 2006 as required by the RTA Act. The recovery ratio, which measures the percentage of operating expense CTA funds from internally generated revenues, is estimated to be 54.8 percent and exceeds the required system-recovery ratio of 53.0 percent. This is due to the higher proportion of system-generated revenues relative to operating expenses.

President’s 2007 Proposed Operating Budget
InnovativeWe will seek out and encourageemployees who initiate change, improvement, learning andadvancement of our goals.

President's 2007 Proposed Operating Budget Schedule
(In Thousands)2005 2006 2006 2007
Actual Budget Forecast ProposedOperating ExpensesLabor $ 714,336 $ 748,922 $ 769,163 $ 850,332Material 71,366 67,088 75,337 77,894Fuel 45,788 48,000 55,003 61,233Power 22,909 24,526 21,582 28,057Provision for Injuries and Damages 31,500 33,000 53,000 25,000Purchase of Security Services 31,221 35,335 31,000 35,334Purchase of Paratransit 53,257 29,582 27,369 -
Other ExpensesUtilities 20,975 17,542 20,891 23,992Advertising and Promotions 2,757 4,935 2,331 3,023Contractual Services 37,257 36,993 36,597 38,765Leases and Rentals 1,621 2,420 2,032 2,042Travel, Training, Seminars, and Dues 2,867 3,211 2,956 3,111Warranty and Other Credits (20,523) (20,932) (21,121) (21,781)General Expenses 6,115 6,063 6,059 6,150
Total Other expenses 51,069 50,232 49,744 55,301
Total Operating Expenses $ 1,021,446 $ 1,036,685 $ 1,082,198 $ 1,133,151
System Generated RevenueFares and Passes $ 417,424 $ 426,522 $ 463,808 $ 468,334Reduced Fare Subsidy 31,961 30,590 32,000 32,000Advertising, Charter & Concessions 23,963 24,800 24,771 24,990Investment Income 5,432 4,944 11,018 12,120Statutory Required Contributions 5,000 5,000 5,000 5,000All Other Revenue 42,024 20,773 21,545 10,250
Total System Generated Revenue $ 525,804 $ 512,629 $ 558,142 $ 552,694
Public Funding Required for Operations $ 495,642 $ 524,056 $ 524,056 $ 580,457IDOT Grant 54,252 27,126 27,126 - Capital Offset - 41,166 41,166 - Public Funding Available through RTA 441,632 455,764 455,764 470,349Additional Public Funding - - - 110,108
Total Funding $ 495,884 $ 524,056 $ 524,056 $ 580,457
Recovery Ratio* 54.07% 52.98% 54.76% 52.03%
Required Recovery Ratio 52.90% 53.00% 53.00% 52.00%
Fund Balance $ 242 $ - $ - $ -
*Recovery ratio is calculated by dividing System Generated Revenues over Operating Expense. The calculation includes, In-kind revenues and expenses for security provided by the City of Chicago, excludes security expense and includes some grant revenues.
38

2007 Major Budget Assumptions
39
2006
Budget 2007
Estimated Change%
Change Justification FARE REVENUE Avg. fare per trip $0.87 $0.93 $0.06 6.9% Ridership (000’s) 489,625 505,944 16,319 3.3% Fare & Pass Revenue (000’s) $426,522 $468,334 $41,812 9.8%
Higher average fare and growth in ridership
EXPENSES
Avg. fuel price per gallon $2.00 $2.50 $0.50 25.0% Commodity price increase Gallons consumed (000’s) 24,000 24,493 493 2.1% Service enhancements Power for Revenue Equipment $24,526 $28,057 $3,531 14.4%
Expiration of ten-year power rate freeze in Illinois
Material $67,088 $77,894 $10,806 16.1% Commodity price increases LABOR Scheduled Transit Operators (STO) positions 5,592 5,605 13 0.2%
Total positions 10,873 10,907 34 0.3%
Service & Security enhancements
SALES TAX FUNDING TO RTA
$600,000
$650,000
$700,000
$750,000
$800,000
($ in 000's)
2.80%
3.00%
3.20%
3.40%
3.60%
3.80%
Total Sales Tax $654,988 $675,629 $700,395 $722,808$745,937
Annual % Change 3.15% 3.67% 3.20% 3.20%
Actual 2003
Actual 2004
Actual 2005
Forecast 2006
Budget 2007
CTA OPERATING FUNDING (SALES TAX & RTA DISCRETIONARY FUNDS)
($ in 000's)
$420,000
$430,000
$440,000
$450,000
$460,000
$470,000
$480,000
-3.00%
-1.50%
0.00%
1.50%
3.00%
4.50%
Total Sales Tax $453,488 $441,632 $441,632 $455,764 $470,349
Annual % Change -2.61% 0.00% 3.20% 3.20%
Actual 2003
Actual 2004
Actual 2005
Forecast 2006
Budget 2007
Sales tax, the primary source of funding for public transit, is closely tied to the economic health of the region.
Regardless of the health of the sales tax revenues in the region, CTA relies on discretionary funding for over one-third of its annual public funding from RTA.

President’s 2007 Proposed Operating Budget Summary
40
OVERVIEW The 2007 proposed operating budget maintains fares and provides for the same level of bus and rail service currently available to CTA customers throughout the service area. The budget is predicated on a stable economy and employment growth in the region. Such an economic environment will facilitate continued ridership and revenue growth in 2007.
The CTA’s operating budget is affected by the overall health of the economy, as well as by key economic factors such as employment, retail sales, inflation, interest rates and energy prices. The consensus Gross Domestic Product (GDP) growth rate is forecast at 3.0 percent for 2007. Overall inflation growth, measured by the Consumer Price Index (CPI), is forecast at 2.5 percent. Increasing inflation is driven by both higher energy costs and productivity gains.
While contingent upon national and international events that can impact growth and economic stability, the Federal Reserve is expected to continue its efforts to manage inflation by increasing the Federal Funds Rate in 2007. According to the U.S. Department of Labor, for the second time in 2006, Illinois ranked first in number of jobs gained among all 50 states in July. The Chicago Metropolitan region showed the largest unemployment declines of any metro region in the state, and August 2006 unemployment rates were the lowest in eight years. The City of Chicago’s unemployment rate also dropped two percentage points, from 7.5 percent in July 2005 to 5.5 percent in July 2006. The greatest risk to this year’s budget is the amount of public funding available for operations. Since 1983, the CTA has faced a structural deficit as a result of the flawed regional transit funding formula. Consequently, over time the CTA has reduced administrative staff and utilized technology to decrease operating expenses. CTA has also raised fares, implemented service cuts, leveraged assets and used capital funds to support the operating budget and meet the RTA’s recovery ratio mandate. Given recent tax law changes and congestion levels in the region, some of these tactics are no longer viable options for meeting the funding challenge facing the CTA. The CTA has also reached the point in its capital program where additional transfers to the operating budget would undermine CTA’s ability to maintain and improve its capital infrastructure. Since 2005, the CTA’s capital funding has declined by $352 million because Illinois FIRST has not been reauthorized. During the same period, the CTA has been forced to transfer over $70.0 million of unmatched capital funds to support operations. These transfers have resulted in the deferral of capital projects and increased operating and capital costs for the
City of Chicago Annual Average Unemployment Rate
0.0%
2.0%
4.0%
6.0%
8.0%
10.0%
2000 2001 2002 2003 2004 2005 2006
Source: Illinois Department of Employment Security
Month of July
Illinois ranked first in job growth among all 50 states in July 2006 according to the U.S. Department of Labor.

President’s 2007 Proposed Operating Budget Summary
41
CTA Fare Media by Type Usage Trend
0%
10%
20%
30%
40%
50%
60%
70%
80%
90%
100%
Other 6.4% 6.4% 6.4% 6.4%
30-day Passes 2.9% 3.0% 2.9% 3.6%
Passes, exlcuding 30-day 23.8% 27.3% 31.1% 45.5%
Reduced Fare Cash/Transfer Cards 23.8% 27.3% 31.1% 45.5%
Reduced Fare Transit Card 5.7% 5.7% 5.4% 7.6%
Cash/Transfer Cards 20.0% 19.5% 19.5% 5.0%
Chicago Card 1.0% 3.6% 6.1% 12.9%
Transit Cards 32.8% 27.2% 21.6% 17.3%
2003 2004 2005 2006
Note: System Totals do not include Parat ransit ridership. Rail ridership represents stat ion entries only--rail-to-rail t ransfers are not included. 2006 data is year-to-date through July.
CTA. With $5.8 billion in unfunded capital needs over the next five years, it would be imprudent for CTA to continue transferring limited capital funds to balance its operating budget as envisioned in the last year’s 2008-2009 financial plan. As part of the focus for 2007, CTA will continue to implement the recommendations made in the 2005 AECOM Consulting report. CTA expects to complete the extraboard pilot at a CTA bus garage, procurement card initiative, real estate revenue optimization project, as well as other initiatives that do not require legislative or contractual changes to labor agreements. As previously stated, of the estimated $159 million in cost savings identified by AECOM, approximately $111 million would require changes in CTA’s collective bargaining agreements or legislation before they could be implemented. In the meantime, the CTA is engaged in the RTA’s strategic planning effort to increase operating and capital investments in the Northeastern Illinois transit system and expects those efforts to be successful next spring. Without a new public funding framework or other financing strategies sufficient to eliminate the current structural deficit, the 2007 operating budget projects a funding shortfall of $110.1 million as a result of the labor arbitration award, inflation, increasing energy costs and additional pension and retiree healthcare obligation costs. If sufficient funding is not secured, CTA would be required to drastically cut operating expenses some time in 2007 in order to achieve a balanced budget and meet RTA’s required recovery ratio. RIDERSHIP The CTA estimates system ridership will grow to 505.9 million trips in 2007, including rail-to-rail transfers. This is an increase of 16.3 million trips or 3.3 percent over the 2006 budget. The projected ridership increase is driven by enhanced service design and delivery, an improved economic environment, higher fuel prices, and changing demographics. Bus ridership is estimated at 301.6 million rides in 2007, an increase of 2.4 million or 0.8 percent over the 2006 forecast, but a 2.3 million decrease from the 2006 budget. Rail ridership, including rail-to-rail
transfers, is estimated at 204.4 million rides, an increase of 7.3 million or 3.7 percent over 2006 forecast and an increase of 19.9 million or 10.8 percent over the 2006 budget. Through July 2006, Chicago Card and Chicago Card Plus fare media usage has doubled since 2005 and now account for 12.9 percent of CTA’s total rides. CTA’s goal is to further increase Chicago Card and Chicago Card Plus market penetration in 2007 in order to increase operating efficiencies. Pass usage

President’s 2007 Proposed Operating Budget Summary
42
has increased 84 percent in recent years, increasing from 26.7 percent in 2003 to 49.1 percent in 2006. OPERATING EXPENSES The 2007 proposed operating budget is $1.133 billion, which is $50.9 million or 4.7 percent higher than the 2006 forecast and $96.5 million or 9.3 percent more than the 2006 budget. This increase is driven by higher labor expenses, due in large part to the 2006 interest arbitration decision. The arbitrator awarded a cumulative employee wage increase of over 10.1 percent for the three-year period from 2004 through 2006. The budget also reflects projected increases in CTA’s energy costs for revenue service. The increase will result from both higher fuel prices and the expiration of a statewide electricity rate freeze at the start of 2007. Labor Labor expenses are approximately 75 percent of CTA’s total operating budget. The 2007 labor cost reflects increased wages due to the union interest arbitration decision, higher benefit costs, bus and rail maintenance staffing support for the West Side and West Suburban service improvements, and increased staffing for security operations. Labor costs are projected at $850.3 million for 2007. Labor expenses are $81.2 million higher than 2006 forecast and $101.4 million higher than 2006 budget. In 2006, the Illinois General Assembly passed legislation, signed by the Governor, requiring CTA to achieve a 90 percent funded ratio for the pension plan by the end of 2058. The pension plan is currently under funded due to the structural funding deficit and collective bargaining process required by Illinois statute which constrained the CTA’s ability to require additional contributions from employees. As a result, CTA’s 2007 operating labor budget anticipates additional pension and retiree healthcare contributions from both CTA and its employees to help address the legislative mandate. The remaining labor increase over forecast is due principally to higher wages and higher benefit costs as a result of the labor arbitration award and West Side Service improvements. CTA’s current labor contract expires at the end of December 2006 and an additional wage increase is expected. Material Material costs are projected at $77.9 million in 2007, which is $2.6 million higher than the 2006 forecast. Material costs increased markedly in 2006 due to inflationary pressure on commodity prices. To help manage these costs, the CTA is implementing the Maintenance Management Information System (MMIS), which will track the life cycle of vehicle parts, warranties and vehicle maintenance data. This will enable the CTA to track and improve internal management of vehicle maintenance and result in efficiencies in fleet maintenance.

President’s 2007 Proposed Operating Budget Summary
43
Fuel Fuel prices remain volatile; reaching historic highs in 2006. The U.S. Energy Information Administration has forecast that crude oil prices will average around $70 a barrel for most of 2007. With fuel price volatility expected to continue in 2007, the CTA has hedged most of its diesel fuel consumption to ensure some degree of budget stability. The average price per gallon is budgeted at $2.50, with an estimated annual consumption of 24.5 million gallons. This results in a fuel budget of $61.2 million, which is $6.2 million or 11.3 percent over 2006 forecast and $13.2 million or 27.6 percent over 2006 budget. Power
The cost of electric power for revenue equipment is estimated at $28.1 million, which is 14.4 percent higher than the 2006 budget of $24.5 million a 30 percent increase over the 2006 forecast of $21.6 million. The higher power costs reflect the end of a decade-long rate freeze in Illinois starting in January of 2007. While some protections may remain in place for consumers, commercial rates could
increase as much as 30 percent or more in the near term. Provision for Injuries and Damages In 2006, CTA utilized increased fare revenues to fully fund the reserve for injuries and damages as projected by the 2005 actuarial analysis. The higher funding level in 2006 allowed CTA to decrease the annual funding for 2007. The resulting estimated funding for injuries and damages in 2007 is $25.0 million, reflecting a decrease of $8.0 million from the 2006 budget and $28.0 million from the 2006 forecast. Purchase of Security Services CTA expense for the purchase of security services includes 24-hour patrol services provided by the Chicago, Evanston, and Oak Park Police departments, as well as contract guard and K-9 (canine) security. Purchase of security services expense is estimated at $35.3 million for 2007, which mirrors the 2006 budget but is $4.3 million higher than 2006 forecast. In addition to the services contracted by the CTA, the City of Chicago provides $22.0 million of Chicago Police Department (CPD) services at no charge to the CTA.
Fuel and Power as Percentage of Operating Costs
4.0%
6.0%
8.0%
10.0%
2001 2002 2003 2004 2005 2006 2007Forcast Budget
The 10-year freeze on electric power rates expires in 2006 and electricity rates may increase by 30% to 100% in Illinois.

President’s 2007 Proposed Operating Budget Summary
44
2007 Other Expenses
Contractual Services
50%
Advertising and Promotions
4%
Utilities31%
General Expenses
8%
Travel, Training, Seminars, and
Dues4%
Leases and Rentals
3%
Note: Warranty and Other Credits are not included.
In addition to the Securitas canine units, CTA recently received dogs from the Transit Security Administration’s Explosive Detection Canine Team Program. The dogs are paired with handlers from the CPD Public Transportation Section to search for possible explosives and respond to reports of unattended or suspicious items. The CTA is also investing capital funds to expand its security camera program in rail stations and on rail cars with the 2008 rail car procurement. In 1998, CTA introduced security cameras on CTA buses. Cameras are an increasingly important component of enhanced security, serving as a deterrent to crime on the system and assisting law enforcement in identifying perpetrators. Cameras also provide additional information to CTA staff in the event of a service disruption. CTA's security cameras are networked to the Control Center and the City of Chicago’s Office of Emergency Management and Communication 911 Center. The CTA has also enhanced safety through completion of a wireless infrastructure project, improving CTA, police and fire radio communication in the subway as well as allowing cellular telephone usage. The system enhances the CTA’s existing two-way radio system and improves redundant subway communication options for CTA, Chicago Police Department and Chicago Fire Department / EMS personnel. The system also allows customers to use their cell phones, e-mail, wireless internet, paging and text messaging throughout the CTA’s 22-mile subway system. Purchase of Paratransit Services In 2006, regional paratransit services were consolidated under the Pace Suburban Bus Service Board as a result of legislation by the State of Illinois in 2005. Other Expenses Other expenses are budgeted at $55.3 million, an increase of $5.1 million or 10.1 percent over the 2006 budget. This category includes but is not limited to utilities for CTA facilities, advertising and marketing expenses, equipment and software maintenance, accounting, engineering, legal and other consulting services, banking fees, and commissions for the sale of fare media products. The increase in other expenses for 2007 primarily reflects inflation for utilities and higher pass commissions for 1-day and 7-day passes.

President’s 2007 Proposed Operating Budget Summary
45
Service Cuts The proposed budget assumes that a new funding source for transit will be identified in 2007 to meet the funding requirements of this budget. Without this new funding source, CTA will be forced to cut service. CTA faces a $110.1 million operating funding shortfall in 2007 including anticipated retiree healthcare and pension funding. Without additional operating funding, CTA could close the $110.1 million gap by implementing $165.0 million in service cuts. These service cuts would reduce ridership and result in $55.0 million in lost revenue, bringing the net savings to CTA to $110.1 million. This level of service cuts is equivalent to over a 30 percent reduction in service and a 14.5 percent reduction in the total operating budget for 2007 and would cause a loss of ridership estimated at 54.7 million trips. These cuts would have a significant negative impact on CTA’s customers, employees, and a region whose economy depends on affordable, accessible transportation. OPERATING REVENUES The CTA has two main categories of revenue: system-generated revenues and public funding. System-generated revenues include fares and passes, reduced fare reimbursement, advertising, investment income, statutorily-required cash contributions, and other miscellaneous revenues such as parking income. System-generated revenue is projected at $552.7 million, representing a growth rate of 7.8 percent or $40.1 million over the 2006 budget. The growth in system-generated revenue is due to continued ridership growth and the fare changes implemented in 2006, including the elimination of cash transfers. Public funding primarily includes monies received through the RTA from a regional sales tax and the State of Illinois public transportation match. In 2007, public funding through these sources will total $470.3 million. However, the public funding need is budgeted at $580.5 million to support operations and the increased retiree and pension funding, leaving a shortfall of $110.1 million. This budget assumes a new transit funding source is found in mid-2007 to plug the gap. Fares and Passes Revenue from fares and passes is projected at $468.3 million in 2007. This represents a growth of $41.8 million or 9.8 percent over the 2006 budget. The growth in fare and pass revenues is tied to increased ridership and a higher average fare per trip resulting in part from the implementation of a $0.25 cash fare increase system-wide and a $0.25 rail transit card fare increase in 2006. Revenue from sale of passes through June of 2006 is $21.0 million or 33
2007
Fares and Passes 468,334$ Reduced Fare Subsidy 32,000 Advertising, Charter and Concessions 24,990 Investment Income 12,120 Statutory Required Contributions 5,000 All Other Revenue 10,250
Total Revenue 552,694$
Total System Generated Revenue (in thousands)

President’s 2007 Proposed Operating Budget Summary
46
percent higher than budget, as customers find passes to be a more cost-effective and convenient method to pay for trips. The CTA has also seen a higher average fare for trips paid with passes in 2006, from $0.67 in 2005 to $0.78 per trip in 2006. Reduced Fare Subsidy The CTA provides approximately 69.0 million reduced fare trips to qualified student, disabled, and elderly customers each year. The Reduced Fare Reimbursement from the State of Illinois is budgeted at $32.0 million. This is based on an annual appropriation of $37.3 million by the Illinois General Assembly for the region allocated by the RTA to CTA, Metra and Pace based on their share of reduced fare ridership and lost revenue. This annual appropriation has not been increased since originally authorized in 1989. In fact, the annual appropriation has been reduced from $43.0 million in 1990. Advertising, Charter, and Concessions Advertising, charter, and concessions revenue includes advertisements on buses, trains, and stations, as well as income from concessions. In 2006, CTA expanded advertising on the system by adding turnstile sleeves to the suite of products available to advertisers. In 2007, revenues for this category are estimated at just under $25.0 million. This is up slightly from 2006 due to increased revenues from concessions and advertising contracts. Investment Income Under its new chairman, the Federal Reserve Board continually increased the Federal Funds Rate in 2006. As of June 2006, the Federal Funds Rate was at 5.25 percent from a low of 1.0 percent at the end of 2003. The 90-day treasury rates are forecast to edge up slightly in 2007 as the Federal Reserve continues to increase short term rates as a hedge against inflation. Higher interest rates and higher cash balances will increase CTA’s 2007 investment income to $12.1 million. Statutory Required Contributions Statutorily required cash contributions are budgeted at $5.0 million, on par with the 2006 budget. The RTA Act requires the City of Chicago and County of Cook to annually contribute $3.0 million and $2.0 million, respectively, towards CTA operations. These required cash
Advertising, Charter and Concessions Revenue
Vehicle & Platform Ads
81%
Special Contract Guarantees
5%
Vending machines
1%
Concessions6%
Pay Phones1%
Bill Boards6%

President’s 2007 Proposed Operating Budget Summary
47
contributions are in addition to other cash and in-kind contributions from the City of Chicago and the County of Cook each year. The Chicago Police Department - Mass Transit Unit provides more than $22.0 million of security services to CTA while Cook County provides $3.5 million in in-kind service through the Implement Sheriff Work Alternative Program (SWAP). SWAP utilizes Cook County prisoners to provide manual labor for clean up of bus turnarounds and garages. All Other Revenues Revenues in this category include operating grants from the Federal Transit Administration (FTA), parking charges, rental revenue, third-party contractor reimbursements and filming fees. Other revenues are projected at $10.2 million in 2007, $10.5 million less than the $20.8 million budgeted for 2006. The decline in other revenue stems from the elimination of operating grant funding from the Federal Transit Administration (FTA) for paratransit services that were transitioned to Pace in 2006. Public Funding Public funding available for operations represents the funding mark issued by the RTA, based upon the State of Illinois Office of Management and Budget and the RTA’s own regional revenue expectations. All of the public funding for operations received by the CTA, Metra, and Pace is funneled through RTA and currently comes through two principal sources: the RTA Sales Tax and the Public Transportation Fund appropriated by the State of Illinois. The RTA Sales Tax is the primary source of CTA public funding. The CTA receives 100 percent of the RTA Sales Tax collected in the City of Chicago and 30 percent of the sales tax collected in suburban Cook County after the RTA retains 15 percent of the sales tax revenue and distributes the remaining 85 percent to the Service Boards. For 2007, the public funding need is $580.5 million. With a base RTA public funding mark of $470.3 million, $110.1 million in additional transit funding is needed to support operations. Based on the inclusion of the new transit funding, CTA projects cash flow generated from revenues to be sufficient to pay for expenditures. In order to help move the region beyond congestion, additional funding is needed to prevent further service cuts, fare increases, or the additional diversion of capital funds to balance the operating budget. Recovery Ratio As calculated by the RTA, the recovery ratio requires CTA’s system-generated revenues to cover at least 52.0 percent of projected expenses for 2007. The proposed operating budget estimates the recovery ratio at 52.03 percent. This estimate takes into account allowable exclusions of passenger security and in-kind police services provided by the Chicago Police Department and the same level of grant funded revenues included in the 2006 budget.
All Other Revenue (in thousands) 2007Rentals 2,100$ Student Permit Revenue 400 Parking Lot Revenue-Rail 2,200 Miscellaneous Revenues 1,050 Sale of Scrap Material 500 Grant Non-Capital Revenue 4,000
Total All Other Revenue 10,250$

President's 2007 Proposed Operating BudgetDepartment Budget Schedule(In Thousands)
2005 Actual 2006 Budget 2006 Forecast 2007 BudgetCTA Board $ 1,112 $ 1,169 $ 1,176 $ 1,213Office of the President 940 896 941 975
Security & System Safety 34,478 39,103 34,502 39,954Office of Inspector General 1,799 2,092 1,940 2,178General Counsel 12,904 15,003 14,231 16,001
TRANSIT OPERATIONSEVP Transit Operations 856 904 1,070 991
CONTROL CENTER 6,605 7,457 6,942 9,022SERVICE & RELIABILITY OPERATIONS - - - 119
BUS OPERATIONSVP Bus Operations 323 321 351 358Bus Operations Oversight 699 704 729 843Bus Service Management 13,248 14,721 13,556 15,334Scheduled Transit Operations - Bus 267,131 281,855 304,100 302,593Bus Garages 150,031 148,161 168,239 177,806Bus Heavy Maintenance 30,886 38,148 31,997 37,282Engineering & Technical Services - Bus 1,962 1,971 2,475 2,564
Total Bus Operations 464,281 485,881 521,446 536,779RAIL OPERATIONS
VP Rail Operations 352 350 362 366Rail Operations Capital Oversight 942 1,201 881 1,124Rail Terminals 58,174 58,895 60,430 64,994Scheduled Transit Operations - Rail 83,501 87,223 89,246 91,931Rail Heavy Maintenance 8,100 10,662 6,704 9,562Rail Car Appearance 10,100 10,872 11,008 11,904Engineering & Technical Services - Rail 2,519 3,214 3,061 3,461
Total Rail Operations 163,688 172,417 171,693 183,342PLANNING 5,602 6,150 5,879 6,614TRAINING & CUSTOMER SERVICE
VP Training & Customer Service 246 243 248 262Customer Service 1,135 1,562 1,528 1,846ADA Compliance 166 255 193 287Training & Instruction 10,648 11,665 11,722 14,380Paratransit Operations* 54,251 30,120 28,102 -
Total Training & Customer Service 66,446 43,845 41,793 16,775Total Transit Operations 707,478 716,653 748,823 753,644
CONSTRUCTION, ENGINEERING & FACILITIES MAINTENANCEEVP Construction, Engineering & Facilities Maintenance 1,798 1,701 1,793 1,862CONSTRUCTION 2,428 2,873 4,309 5,413ENGINEERING 63,991 74,747 64,015 82,347FACILITIES MAINTENANCE 70,697 69,630 70,690 72,305
Total Construction, Engineering & Facilities Maintenance 138,914 148,952 140,808 161,927
MANAGEMENT & PERFORMANCEEVP Management & Performance 538 528 504 492
PROPERTY & REAL ESTATE ASSET MANAGEMENT 4,599 5,874 4,434 5,478GOVERNMENT AND COMMUNITY RELATIONS & AFFIRMATIVE ACTION 2,486 3,022 2,516 3,156
COMMUNICATIONS & MARKETING 8,460 10,604 8,291 9,342FINANCE
Sr VP Finance/Treasurer 19,083 16,841 20,419 21,344Finance/Comptroller 3,207 3,742 3,503 4,126Capital Investment 934 1,196 907 1,286
Total Finance 23,224 21,779 24,829 26,756HUMAN RESOURCES 5,451 5,724 5,538 6,298EMPLOYEE RELATIONS 2,236 2,397 2,295 2,612TECHNOLOGY MANAGEMENT 34,945 36,032 34,417 39,915PURCHASING/WAREHOUSING 20,743 21,800 21,077 23,109
Total Management & Performance 102,682 107,760 103,901 117,157Non - Departmental 21,139 5,057 35,877 40,102TOTAL CTA $ 1,021,446 $ 1,036,685 $ 1,082,198 $ 1,133,151
* Note: Effective July 1, 2006, Paratransit Operations was transferred to PACE.
48
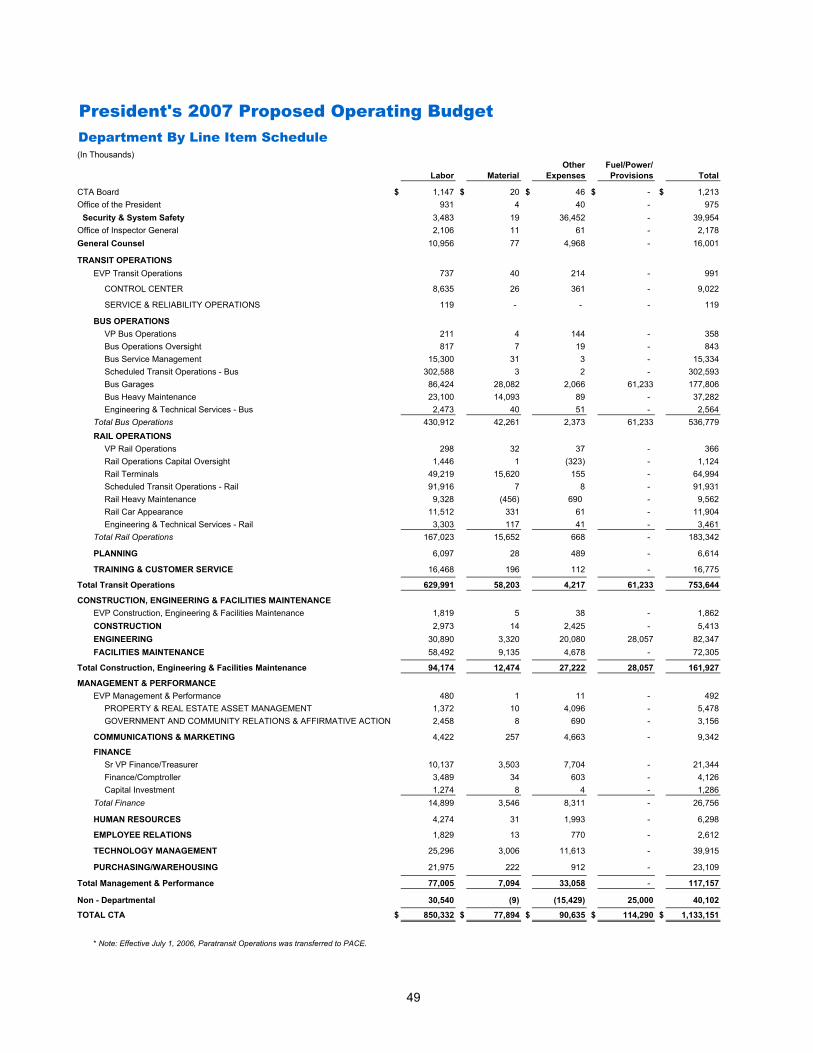
President's 2007 Proposed Operating BudgetDepartment By Line Item Schedule(In Thousands)
Other Fuel/Power/Labor Material Expenses Provisions Total
CTA Board $ 1,147 $ 20 $ 46 $ - $ 1,213Office of the President 931 4 40 - 975
Security & System Safety 3,483 19 36,452 - 39,954Office of Inspector General 2,106 11 61 - 2,178General Counsel 10,956 77 4,968 - 16,001
TRANSIT OPERATIONSEVP Transit Operations 737 40 214 - 991
CONTROL CENTER 8,635 26 361 - 9,022
SERVICE & RELIABILITY OPERATIONS 119 - - - 119
BUS OPERATIONSVP Bus Operations 211 4 144 - 358Bus Operations Oversight 817 7 19 - 843Bus Service Management 15,300 31 3 - 15,334Scheduled Transit Operations - Bus 302,588 3 2 - 302,593Bus Garages 86,424 28,082 2,066 61,233 177,806Bus Heavy Maintenance 23,100 14,093 89 - 37,282Engineering & Technical Services - Bus 2,473 40 51 - 2,564
Total Bus Operations 430,912 42,261 2,373 61,233 536,779RAIL OPERATIONS
VP Rail Operations 298 32 37 - 366Rail Operations Capital Oversight 1,446 1 (323) - 1,124Rail Terminals 49,219 15,620 155 - 64,994Scheduled Transit Operations - Rail 91,916 7 8 - 91,931Rail Heavy Maintenance 9,328 (456) 690 - 9,562Rail Car Appearance 11,512 331 61 - 11,904Engineering & Technical Services - Rail 3,303 117 41 - 3,461
Total Rail Operations 167,023 15,652 668 - 183,342
PLANNING 6,097 28 489 - 6,614
TRAINING & CUSTOMER SERVICE 16,468 196 112 - 16,775
Total Transit Operations 629,991 58,203 4,217 61,233 753,644
CONSTRUCTION, ENGINEERING & FACILITIES MAINTENANCEEVP Construction, Engineering & Facilities Maintenance 1,819 5 38 - 1,862CONSTRUCTION 2,973 14 2,425 - 5,413ENGINEERING 30,890 3,320 20,080 28,057 82,347FACILITIES MAINTENANCE 58,492 9,135 4,678 - 72,305
Total Construction, Engineering & Facilities Maintenance 94,174 12,474 27,222 28,057 161,927
MANAGEMENT & PERFORMANCEEVP Management & Performance 480 1 11 - 492
PROPERTY & REAL ESTATE ASSET MANAGEMENT 1,372 10 4,096 - 5,478GOVERNMENT AND COMMUNITY RELATIONS & AFFIRMATIVE ACTION 2,458 8 690 - 3,156
COMMUNICATIONS & MARKETING 4,422 257 4,663 - 9,342
FINANCESr VP Finance/Treasurer 10,137 3,503 7,704 - 21,344Finance/Comptroller 3,489 34 603 - 4,126Capital Investment 1,274 8 4 - 1,286
Total Finance 14,899 3,546 8,311 - 26,756
HUMAN RESOURCES 4,274 31 1,993 - 6,298
EMPLOYEE RELATIONS 1,829 13 770 - 2,612
TECHNOLOGY MANAGEMENT 25,296 3,006 11,613 - 39,915
PURCHASING/WAREHOUSING 21,975 222 912 - 23,109
Total Management & Performance 77,005 7,094 33,058 - 117,157
Non - Departmental 30,540 (9) (15,429) 25,000 40,102
TOTAL CTA $ 850,332 $ 77,894 $ 90,635 $ 114,290 $ 1,133,151
* Note: Effective July 1, 2006, Paratransit Operations was transferred to PACE.
49

President's 2007 Proposed Operating BudgetDepartment Budgeted Positions
2005 2006 2007Budgeted Budgeted BudgetedPositions Positions Positions
CTA Board 14 14 14 Office of the President 6 6 6
Security & System Safety 29 27 37 Office of Inspector General 17 17 17 General Counsel 108 108 108
TRANSIT OPERATIONSEVP Transit Operations 6 5 5
CONTROL CENTER 78 80 80
SERVICE & RELIABILITY OPERATIONS - 2 2
BUS OPERATIONSVP Bus Operations 1 1 1 Bus Operations Oversight 8 7 7 Bus Service Management 166 177 177 Scheduled Transit Operations - Bus 4,297 4,297 4,274 Bus Garages 1,054 1,041 1,041 Bus Heavy Maintenance 358 358 358 Engineering & Technical Services - Bus 32 32 32
Total Bus Operations 5,916 5,913 5,890
RAIL OPERATIONSVP Rail Operations 2 2 2 Rail Operations Capital Oversight 15 17 17 Rail Terminals 560 554 554 Scheduled Transit Operations - Rail 1,295 1,295 1,331 Rail Heavy Maintenance 216 217 229 Rail Car Appearance 174 172 174 Engineering & Technical Services - Rail 36 35 35
Total Rail Operations 2,298 2,292 2,342 PLANNING 63 62 62 TRAINING & CUSTOMER SERVICE* 177 185 185
Total Transit Operations 8,538 8,539 8,566
CONSTRUCTION, ENGINEERING & FACILITIES MAINTENANCEEVP Construction, Engineering & Facilities Maintenance 3 3 3 CONSTRUCTION 47 51 51 ENGINEERING 461 448 455 FACILITIES MAINTENANCE 804 798 797
Total Construction, Engineering & Facilities Maintenance 1,315 1,300 1,306
MANAGEMENT & PERFORMANCEEVP Management & Performance 3 3 3
PROPERTY & REAL ESTATE ASSET MANAGEMENT - 12 12 GOVERNMENT AND COMMUNITY RELATIONS & AFFIRMATIVE ACTION 26 26 26
COMMUNICATIONS & MARKETING 44 49 49
FINANCESr VP Finance/Treasurer 133 127 121 Finance/Comptroller 47 45 43 Capital Investment 28 28 27
Total Finance 208 200 191 HUMAN RESOURCES 38 39 39 EMPLOYEE RELATIONS 19 19 19
TECHNOLOGY MANAGEMENT 242 252 252
PURCHASING/WAREHOUSING 266 262 262
Total Management & Performance 846 862 853
TOTAL CTA 10,873 10,873 10,907
Bus STO Positions 4,297 4,297 4,274 Rail STO Positions 1,295 1,295 1,331
TOTAL CTA WITHOUT STO 5,281 5,281 5,302
Pension 15 15 15
* Note: Effective July 1, 2006, Paratransit Operations was transferred to PACE.
50

President’s 2008-2009 Proposed OperatingFinancial Plan
MotivatedWe will meet each task with spirit,enthusiasm and a sense of pride to be second to none.

President’s 2008 – 2009 Proposed Operating Financial Plan Summary
51
0.0
0.5
1.0
1.5
2.0
2.5
3.0
3.5
4.0
4.5
5.0
Per
cent
1996
1997
1998
1999
2000
2001
2002
2003
2004
2005
2006
2007
2008
2009
GDP Annual Growth Rates
Source: Bureau of Economic Analysis, 2006 - 2009 GDP based on forecasts released by the Congressional Budget Office.
FINANCIAL PLAN The 2008-2009 Financial Plan assumes sustained economic growth and moderate inflation. CTA still faces much uncertainty regarding the quality and level of service it will be able to provide to the public due to the lack of adequate public funding in the region. According to the Texas Transportation Institute’s 2005 Urban Mobility report, the Chicago area has the second worst traffic congestion in the nation. The CTA has joined forces with Metra, Pace and RTA to bring attention to the need for more transit funding to grow the transit network and reduce congestion. The Financial Plan assumes increased state and federal support for transit in Northeastern Illinois as the means of mitigating congestion and effectively supporting regional economic development. Similar to the 2007 operating budget, a central element of the 2008-2009 Financial Plan concerns increased funding for operations and capital infrastructure in the system. The need for increased operational funding is significantly impacted by the growing unfunded liabilities of the CTA employee Pension Plan. Years of insufficient funding coupled with rising healthcare costs for retirees have led to the erosion of pension assets. The operating funding shortfalls during this financial plan period are a result of the structural deficit caused by the 1983 regional transit funding formula and from additional pension and retiree healthcare obligations recently imposed by the State of Illinois. The combined effects of the funding formula and State required pension funding obligations on CTA is significant to the business operations of CTA. Without additional public funding in 2008 and 2009, the CTA faces a funding gap of $170 million and $271 million, respectively, in order to balance the operating needs and meet the pension obligations imposed by the State. The cost reductions necessary to close this gap can only be achieved by levels of bus and rail services cuts that would render the current system ineffective and complete gridlock unavoidable. Without additional funding, CTA will be faced with the prospect of cutting service by 50 percent in 2008 and 2009, leaving a skeleton of a system to serve the needs of the communities in the service area. Due to rising energy prices and the Federal Reserve’s primary focus on controlling inflation, the Congressional Budget Office (CBO) estimates 2008 and 2009 GDP growth at 3.1 and 3.2 percent, respectively. The growth in the U.S. economy has slowed in 2006, and is expected to maintain moderate growth from 2007 through 2009. While employment levels and productivity have remained strong, rising interest rates and global energy prices have already dampened economic growth. Energy prices continue to make

President’s 2008 – 2009 Proposed Operating Financial Plan Summary
52
inflation a primary risk to the U.S. economy. Furthermore, efforts by the Federal Reserve to maintain low levels of inflation through raising short-term interest rates has slowed the housing market, a strong point in the economy in recent years. The CBO forecasts inflation growth to be 2.2 percent for both 2008 and 2009 as measured by the Consumer Price Index (CPI). Standard and Poor’s Economic Outlook forecasts core inflation at 2.1 percent for 2008 and 2.0 percent for 2009. The CBO predicts stable national unemployment levels at 4.9 percent for 2008 and 5.0 percent for 2009 through 2016. Employment in the State of Illinois, the Chicago metropolitan region and the City of Chicago remains positive for the plan period. Improvements in the labor market coupled with service enhancements and high energy prices are expected to increase CTA’s ridership as more people use public transportation for work and leisure trips. OPERATING EXPENSES The 2008 and 2009 estimated operating expenses are $1.216 billion and $1.342 billion, respectively. The significant increases in 2008 and 2009 are due to an anticipated increase in retiree healthcare and pension funding during the plan period. Other contributing factors to the increases in operating expenses are due to rising wages, benefits and higher energy costs. This increased retiree healthcare and pension funding is a result of State of Illinois legislation. Beginning in 2009, Senate Bill (SB) 1977 requires the CTA and its employees to start funding its employee pension plan monthly with amounts sufficient to achieve a 90 percent funded ratio by the end of 2058.
The CTA Pension Plan (the “Plan”), authorized by the Illinois Pension Code, is a defined-benefit pension plan providing retirement, disability and healthcare benefits to all eligible CTA employees. The Plan was created in 1949 by an agreement between the CTA and the Amalgamated Transit Union (ATU). The benefits paid from the Plan and the contributions made to the Plan are determined through collective bargaining as required by State statute. As of January 1, 2006, the
CTA Pension Plan is underfunded by $2.3 billion. The Plan had assets of just under $1.2 billion and liabilities of $3.5 billion, for a 34.4 percent funded ratio. This compares to a 39.4 percent funded ratio as of January 1, 2005.
Retirement Plan for Chicago Transit Authority EmployeesProjected Funded Ratios
0%
10%
20%
30%
40%
50%
2006 2007 2008 2009 2010 2011 2012 2013
Year Source: Gabriel Roeder Smith & Company

President’s 2008 – 2009 Proposed Operating Financial Plan Summary
53
The decline in Plan assets is the result of inadequate contributions and increasing retiree healthcare costs. The lack of adequate pension contributions is a consequence of declining public funding for CTA since 1983. The Plan’s actuary projects that the assets will be depleted by 2013 without significantly increased contributions by CTA and its employees, and changes to the funding structure and benefit levels. Despite CTA’s best efforts to seek design changes through negotiation, the interest arbitration decision of 2006 resulted in no changes to the Plan and left CTA without the tools needed to address the pension shortfall through increased contributions and additional benefit design changes for employees and retirees. The pension fund is the responsibility of the Plan, nevertheless, CTA employees and retirees would be affected by the Plan’s inability to meet its obligations under collective bargaining agreements. The CTA currently has approximately 20,000 participants in the employee pension plan, including over 10,000 active employees, over 7,000 retirees, 900 people receiving disability allowances and 750 surviving spouses. The plan is not protected by the Federal Employee Retirement Income Security Act (ERISA) and not covered by the Pension Benefit Guaranty Corp (PBGC). Therefore bankruptcy of the plan would be devastating to employees, retirees and their dependants. The Financial Plan outlines the impact of these scenarios on operations and the impact on our service levels to CTA customers. Labor Labor expenses, which constitute approximately three-fourths of CTA total expenses, include the cost of wages, health care, dental, pension, workers compensation and payroll taxes for social security, or Federal Insurance Contributions Act (FICA). Labor expenses are projected to increase to $915.6 million in 2008 and to $1.038 billion in 2009. The significant increases in 2008 and 2009 are for retiree healthcare and pension obligations. Labor costs in 2008 increase by 7.7 percent over 2007 and by 13.3 percent from 2008 to 2009 due to higher costs for wages and benefits. Where possible, the CTA has negotiated lower healthcare costs through joint-purchasing agreements, such as its prescription drugs and PPO healthcare alliance with City agencies starting in 2004. CTA will also seek additional cost sharing through labor negotiations. Again in 2006, CTA joined with sister agencies in the City of Chicago to seek higher discount rates for its PPO healthcare program. The CTA continues to emphasize cost reductions through productivity gains, including implementing AECOM recommendations. Many of these productivity gains recommended by AECOM, however, require changes to collective bargaining agreements prior to implementation.
U.S. CPI for All Urban Consumers
0.0%
0.5%
1.0%
1.5%
2.0%
2.5%
3.0%
3.5%
4.0%
1996 1997 1998 1999 2000 2001 2002 2003 2004 2005 2006 2007 2008 2009
Source: Bureau of Labor Statistics, 2006 - 2009 CPI are based on forecasts released by the Congressional Budget Office.

President’s 2008 – 2009 Proposed Operating Financial Plan Summary
54
Material Materials are used to maintain the CTA bus and rail fleet, rail tracks, facilities, stations and fare revenue equipment. The CTA has continually sought to contain materials costs through streamlining its supply chain and reengineering sole-sourced materials. The agency also anticipates additional efficiencies in material acquisition through implementation of the new Maintenance Management Information System (MMIS). The MMIS system will track the life cycle of vehicle parts, warranties and vehicle repair information. However, inflationary pressure in 2006 and 2007, particularly in the energy sector, has increased materials costs significantly for CTA. CTA projects material expenses to increase from $77.9 million in 2007 to $79.0 million in 2008, a 1.4 percent increase; and an additional 1.3 percent in 2009 to $80.0 million. Fuel and Power Due to rising demand and limited resources, energy prices are expected to remain high. The U.S. Energy Information Association has forecast world energy consumption to grow by 71.5 percent between 2003 and 2030, largely due to demand from emerging economies. The increased demand, combined with limited extraction and refinery capacity, is expected to impact CTA’s energy budgets in 2008 and 2009.
CTA's Average Cost of Diesel Fuel Price per Gallon
$0.00
$0.50
$1.00
$1.50
$2.00
$2.50
$3.00
$3.50
1998 1999 2000 2001 2002 2003 2004 2005 2006 Forecast
2007Budget
2008Plan
2009Plan
For 2008 and 2009, the CTA has proposed a budget of $2.94 per gallon for an annual consumption of 24.5 million gallons per year. This equates to $72.0 million in annual fuel expenses. The increase for 2008 and 2009 over 2007 is $10.8 million, more than triple the cost of fuel compared to 2002, when CTA’s fuel expense equaled $20.1 million. Likewise, energy analysts predict that electricity demand will increase along with natural gas prices. In the newly deregulated electricity market in Illinois, the CTA projects a 30 percent increase in rates in 2007 from the 2006 forecast. For this reason, the CTA has budgeted $29.0 million for power in 2008 and $30.0 million in 2009, compared to $24.5 million budgeted in 2006 and $28.1 million budgeted for 2007.

President’s 2008 – 2009 Proposed Operating Financial Plan Summary
55
Provision for Injuries and Damages Funding for injuries and damages expenses are expected to rise slightly to $28.0 million in 2008 and 2009 compared to $25.0 million in 2007 due to inflation. Purchase of Security Services Providing safe transit service to customers remains a key part of the CTA security strategy for the 2008-2009 proposed plan periods. CTA’s security network includes security guards and guard dog coverage in addition to services provided by the Chicago, Evanston and Oak Park Police Departments. For the proposed plan years, CTA forecasts security expenses will increase by 2.5 percent to $36.2 million in 2008 and to $37.1 million in 2009. Compared to 2001, CTA’s allocation for security services for 2008 and 2009 will increase by 61 percent and 65 percent respectively due to a heightened security environment. Transit agencies have found it increasingly challenging to operate following September 11, 2001 and attacks on the Madrid, London and Mumbai transit systems. CTA continues to invest in technology-based security solutions to enhance safety. In addition to guard services, security cameras in rail stations are linked to the City of Chicago’s 911 center and CTA’s Control Center provide critical enhancements to the security network. Purchase of Paratransit Services The CTA has no expenditures in the proposed budget for purchase of paratransit services for 2008 and 2009. Effective July 1, 2006, state legislation consolidated regional paratransit services under Pace. However, the lack of dedicated public funding for paratransit services may divert limited public funding resources away from the CTA, increasing CTA’s deficit. Other Expenses Other expenses include utilities, advertising, equipment and software maintenance, accounting, engineering, legal and other consulting services, banking fees and commissions. Other expenses are projected to increase modestly from $55.3 million budgeted for 2007 to $56.0 million for 2008 and $57.0 million in 2009, an increase of 1.3 percent in 2008 and 1.8 percent in 2009. OPERATING REVENUE Operating revenues are comprised of system-generated revenues and public funding which are estimated at $1.216 billion for 2008 and $1.342 billion for 2009. System-generated revenues include fares and passes along with other internally generated revenues, while public funding through the RTA includes a portion of sales tax collections and State match on sales tax
CTA’s allocation for security services for 2009 is 65% higher than 2001 due to the heightened security environment for transportation systems.
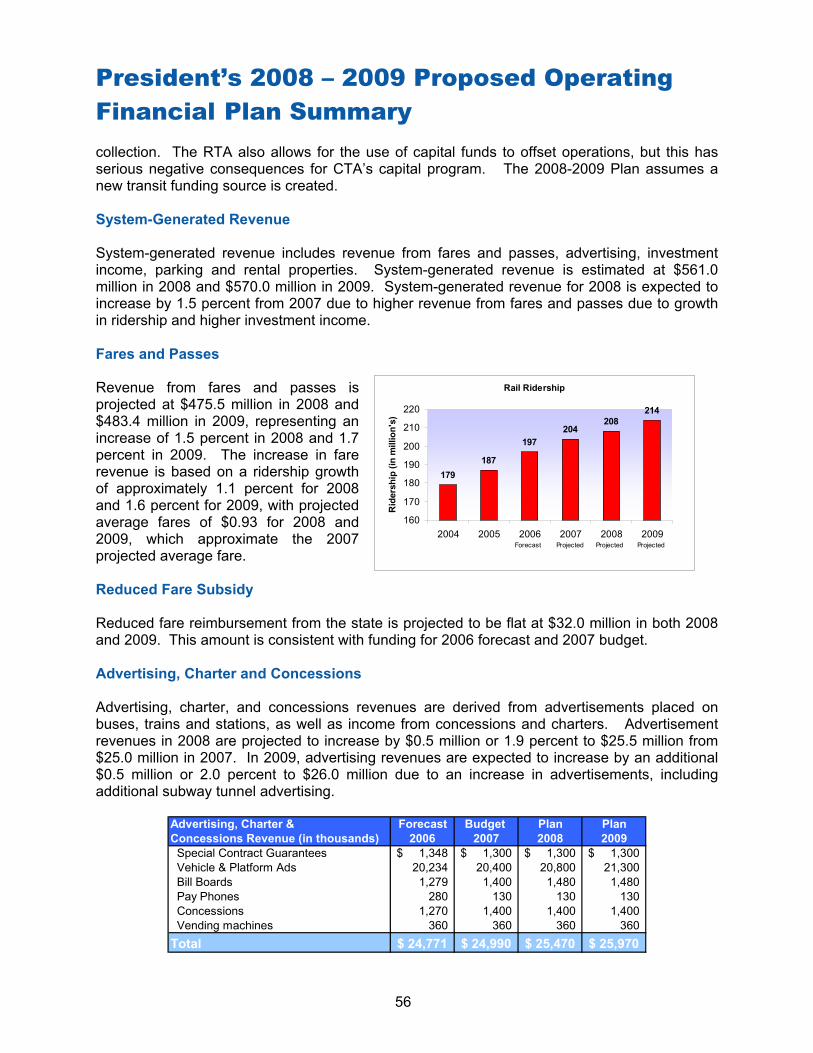
President’s 2008 – 2009 Proposed Operating Financial Plan Summary
56
collection. The RTA also allows for the use of capital funds to offset operations, but this has serious negative consequences for CTA’s capital program. The 2008-2009 Plan assumes a new transit funding source is created. System-Generated Revenue System-generated revenue includes revenue from fares and passes, advertising, investment income, parking and rental properties. System-generated revenue is estimated at $561.0 million in 2008 and $570.0 million in 2009. System-generated revenue for 2008 is expected to increase by 1.5 percent from 2007 due to higher revenue from fares and passes due to growth in ridership and higher investment income. Fares and Passes Revenue from fares and passes is projected at $475.5 million in 2008 and $483.4 million in 2009, representing an increase of 1.5 percent in 2008 and 1.7 percent in 2009. The increase in fare revenue is based on a ridership growth of approximately 1.1 percent for 2008 and 1.6 percent for 2009, with projected average fares of $0.93 for 2008 and 2009, which approximate the 2007 projected average fare. Reduced Fare Subsidy Reduced fare reimbursement from the state is projected to be flat at $32.0 million in both 2008 and 2009. This amount is consistent with funding for 2006 forecast and 2007 budget. Advertising, Charter and Concessions Advertising, charter, and concessions revenues are derived from advertisements placed on buses, trains and stations, as well as income from concessions and charters. Advertisement revenues in 2008 are projected to increase by $0.5 million or 1.9 percent to $25.5 million from $25.0 million in 2007. In 2009, advertising revenues are expected to increase by an additional $0.5 million or 2.0 percent to $26.0 million due to an increase in advertisements, including additional subway tunnel advertising.
Advertising, Charter & Forecast Budget Plan PlanConcessions Revenue (in thousands) 2006 2007 2008 2009 Special Contract Guarantees 1,348$ 1,300$ 1,300$ 1,300$ Vehicle & Platform Ads 20,234 20,400 20,800 21,300 Bill Boards 1,279 1,400 1,480 1,480 Pay Phones 280 130 130 130 Concessions 1,270 1,400 1,400 1,400 Vending machines 360 360 360 360 Total 24,771$ 24,990$ 25,470$ 25,970$
Rail Ridership
179187
197204
208214
160
170
180
190
200
210
220
2004 2005 2006 2007 2008 2009
Rid
ersh
ip (i
n m
illio
n's)
Forecast Projected ProjectedProjected
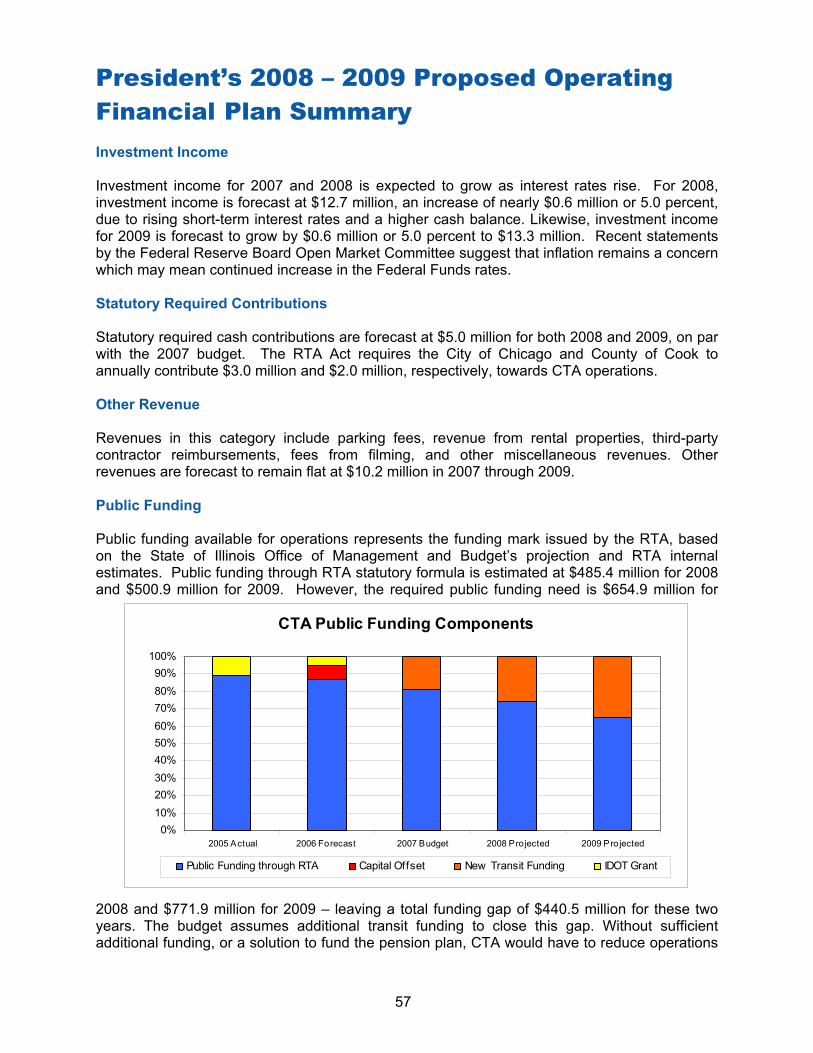
President’s 2008 – 2009 Proposed Operating Financial Plan Summary
57
CTA Public Funding Components
0%10%20%30%40%50%60%70%80%90%
100%
2005 Actual 2006 Forecast 2007 Budget 2008 Pro jected 2009 Pro jected
Public Funding through RTA Capital Offset New Transit Funding IDOT Grant
Investment Income Investment income for 2007 and 2008 is expected to grow as interest rates rise. For 2008, investment income is forecast at $12.7 million, an increase of nearly $0.6 million or 5.0 percent, due to rising short-term interest rates and a higher cash balance. Likewise, investment income for 2009 is forecast to grow by $0.6 million or 5.0 percent to $13.3 million. Recent statements by the Federal Reserve Board Open Market Committee suggest that inflation remains a concern which may mean continued increase in the Federal Funds rates. Statutory Required Contributions Statutory required cash contributions are forecast at $5.0 million for both 2008 and 2009, on par with the 2007 budget. The RTA Act requires the City of Chicago and County of Cook to annually contribute $3.0 million and $2.0 million, respectively, towards CTA operations. Other Revenue Revenues in this category include parking fees, revenue from rental properties, third-party contractor reimbursements, fees from filming, and other miscellaneous revenues. Other revenues are forecast to remain flat at $10.2 million in 2007 through 2009. Public Funding Public funding available for operations represents the funding mark issued by the RTA, based on the State of Illinois Office of Management and Budget’s projection and RTA internal estimates. Public funding through RTA statutory formula is estimated at $485.4 million for 2008 and $500.9 million for 2009. However, the required public funding need is $654.9 million for
2008 and $771.9 million for 2009 – leaving a total funding gap of $440.5 million for these two years. The budget assumes additional transit funding to close this gap. Without sufficient additional funding, or a solution to fund the pension plan, CTA would have to reduce operations

President’s 2008 – 2009 Proposed Operating Financial Plan Summary
58
significantly. Bus and rail service cuts would be roughly equivalent to $235.3 million in 2008 and $377.5 million in 2009; this would be the equivalent of a 50 percent reduction in service. In addition to funding gaps, use of capital funds to offset the budget also creates a negative cycle of disrepair. In prior years, the financial plan diverted capital funds to preventative maintenance for operating use. The increased level of unfunded capital need and higher operating funding gaps make additional capital diversions to support the operating budget imprudent since it would negatively impact CTA’s goal to bring the system to a state of good repair and result in increased costs for operations and capital projects. Recovery Ratio The RTA Act requires the region to fund 50 percent of its expenses through revenues generated by the RTA and the three service boards. The recovery ratio measures the percentage of expenses that a service board must pay for using revenues it generates. System-generated revenues, operating expenses and certain statutory exclusions are used in the calculation. In addition to in-kind services, the RTA exempted all security expenses beginning in 2005 and starting in 2006 RTA included some grant-funded revenues in the recovery ratio calculation. The RTA assigns each Service Board a recovery ratio when it issues the funding marks as required by the Act. The budgets submitted by each service board must be balanced and meet the required recovery ratio to obtain RTA approval. The CTA’s estimated recovery ratio in 2008 and 2009 are 49.18 percent and 45.22 percent, respectively. This is below the required recovery ratio of 52.0 percent set by RTA, and the 50.0 percent recovery ratio required of the region by the RTA Act. As with transit funding generally, the region needs to evaluate the effect of current recovery ratio mandate on its ability to effectively use enhanced neighborhood public transit services to fight congestion, improve air quality and increase regional economic competitiveness.
The recovery ratio has significant policy implications on the delivery of CTA services. CTA’s operating expenses are growing due a variety of external factors, including increases in health insurance and fuel costs, as well as state legislation passed in 2006 regarding pension contributions. To meet the recovery ratio requirement, CTA has few options but to reduce expenses through service cuts or raise system-generated revenues by increasing fares. Both of these choices hurt customers and are counter-productive towards the larger goals of increasing ridership and reducing traffic congestion.
The regional recovery ratio rate of 50 percent has remained fixed since the RTA Act was last modified over thirty years ago. Despite significant ridership increases since 1997, the transit system is much smaller today than when the requirement was established – primarily due to bus service reductions, fares that have increased above the rate of inflation, and resulting ridership losses. The recovery ratio requirement tends to disproportionately impact bus services. Buses typically have higher operating costs (but lower capital costs) than rail: One operator of a fully-loaded 40-foot bus can transport 60 to 70 people, while one operator of a fully-loaded 8-car train can transport 1,000 people.
CTA, Metra and Pace together have a higher system-generated recovery ratio than nearly every other major metropolitan region in the United States, even accounting for differences in the methodology used to calculate the ratio. A comparison to some regions where ridership and service levels are rapidly increasing suggests that metropolitan Chicago’s 50-percent mandated

President’s 2008 – 2009 Proposed Operating Financial Plan Summary
59
ratio may be constraining growth opportunities here. While other regions have strived to increase cost-efficiency, they have prioritized ridership growth and new revenues to support transit over a specific economic measure such as the recovery ratio. Over the past decade, places as diverse as Denver, Miami and Phoenix have achieved ridership gains of 20 to over 40 percent by substantially expanding bus and rail services. Their recovery ratios range from 20 to 25 percent.
Recovery Ratio - Large Metropolitan Regions (2004)
0%
10%
20%
30%
40%
50%
60%
Atlanta
Baltim
ore
Boston
Clevela
ndDall
as
Denve
r
Honolu
lu
Housto
n
Las V
egas
Los A
ngele
sMiam
i
Milwau
kee
Minnea
polis
New Je
rsey
New Y
ork
Philad
elphia
Phoen
ix
Pittsbu
rgh
Portlan
d
Salt La
ke C
ity
San D
iego
San Fran
cisco
Seattle
St Lou
is
Was
hingto
n
Metropolitan Region
Rec
over
y R
atio
50% mandated recovery ratio for RTA services
Notes: Metropolitan regions may include multiple transit providers serving both urban and suburban areas. Data for other regions comes from the 2004 National Transit Database. The RTA recovery ratio calculation includes other system-generated revenues (such as advertising and investment income) in addition to fares.
In addition, nearly every other major metropolitan region in the United States is providing significantly higher levels of public funding per transit trip than in Northeastern Illinois. Based on 2004 data, the average public funding per trip was less than $1.00 for CTA and just over $1.20 for the Chicago region as a whole. With the exception of New York, public funding for other systems typically ranges from $1.25 to $4.00 per boarding. In terms of day-to-day service, CTA’s lower public funding per trip may result in overcrowded vehicles or less frequent service even when demand for transit exists. Anything that makes transit less convenient makes it more likely that people will choose other transportation options.

President’s 2008 – 2009 Proposed Operating Financial Plan Summary
60
Public Funding per Boarding - Large Metropolitan Regions (2004)
$0.00
$0.50
$1.00
$1.50
$2.00
$2.50
$3.00
$3.50
$4.00
$4.50
Atlanta
Baltim
ore
Boston
Clevela
ndDall
as
Denve
r
Honolu
lu
Housto
n
Las V
egas
Los A
ngele
sMiam
i
Milwau
kee
Minnea
polis
New Je
rsey
New Y
ork
Philad
elphia
Phoen
ix
Pittsbu
rgh
Portlan
d
Salt La
ke C
ity
San D
iego
San Fran
cisco
Seattle
St Lou
is
Washin
gton
Metropolitan Region
Publ
ic F
undi
ng p
er B
oard
ing
RTA public funding per boarding - $1.21
Notes: Metropolitan regions may include multiple transit providers serving both urban and suburban areas. Data for other regions comes from the 2004 National Transit Database. Data for Chicago and other metropolitan regions include public funding for paratransit trips, which is typically is much higher than for fixed-route trips.
Accounting Notes The CTA’s ongoing operations are accounted for on a proprietary fund basis. Operations are financed and operated similar to a private business, where the intent is that the costs of providing services to the public should be recovered through user charges. The full accrual method of accounting is used, recording revenues when earned and expenses when incurred. During 2003, the CTA issued debt to finance the renovation of the Cermak (Douglas) Branch of the Blue Line. This debt is backed by a Full Funding Grant Agreement (FFGA) with the FTA. In 2006, CTA redeemed all debt issued to finance the renovation of the Cermak (Douglas) Branch of the Blue Line. In 2004, the CTA issued the 2004 Bonds totaling $250.0 million. The proceeds of the 2004 Bonds will be used to pay for or reimburse the CTA for prior expenditures relating to a portion of the capital improvement. The 2004 Bonds were secured solely via Federal Transit Administration 5307 Urbanized Area Formula funds.

President's 2008-2009 Proposed Operating Financial Plan Schedule
(In Thousands)
2005 2006 2006 2007 2008 2009Actual Budget Forecast Proposed Proposed Proposed
Operating Expenses
Labor $ 714,336 $ 748,922 $ 769,163 $ 850,332 $ 915,648 $ 1,037,780Material 71,366 67,088 75,337 77,894 79,000 80,000Fuel 45,788 48,000 55,003 61,233 72,000 72,000Power 22,909 24,526 21,582 28,057 29,000 30,000Provision for Injuries and Damages 31,500 33,000 53,000 25,000 28,000 28,000Purchase of Security Services 31,221 35,335 31,000 35,334 36,217 37,123Purchase of Paratransit 53,257 29,582 27,369 - - -
Other Expenses
Utilities 20,975 17,542 20,891 23,992 24,691 25,691Advertising and Promotions 2,757 4,935 2,331 3,023 3,023 3,023Contractual Services 37,257 36,993 36,597 38,765 38,765 38,765Leases and Rentals 1,621 2,420 2,032 2,042 2,042 2,042Travel, Training, Seminars, and Dues 2,867 3,211 2,956 3,111 3,111 3,111Warranty and Other Credits (20,523) (20,932) (21,121) (21,781) (21,781) (21,781)General Expenses 6,115 6,063 6,059 6,150 6,150 6,150
Total Other Expenses 51,069 50,232 49,744 55,301 56,000 57,000
Total Operating Expenses $ 1,021,446 $ 1,036,685 $ 1,082,198 $ 1,133,151 $ 1,215,865 $ 1,341,903
System Generated Revenue
Fares and Passes $ 417,424 $ 426,522 $ 463,808 $ 468,334 $ 475,524 $ 483,398Reduced Fare Subsidy 31,961 30,590 32,000 32,000 32,000 32,000Advertising, Charter & Concessions 23,963 24,800 24,771 24,990 25,470 25,970Investment Income 5,432 4,944 11,018 12,120 12,726 13,362Statutory Required Contributions 5,000 5,000 5,000 5,000 5,000 5,000All Other Revenue 42,024 20,773 21,545 10,250 10,250 10,250
Total System Generated Revenue $ 525,804 $ 512,629 $ 558,142 $ 552,694 $ 560,970 $ 569,980
Public Funding Required for Operations $ 495,642 $ 524,056 $ 524,056 $ 580,457 $ 654,895 $ 771,923
IDOT Grant 54,252 27,126 27,126 - - - Capital Offset - 41,166 41,166 - - - Public Funding Available through RTA 441,632 455,764 455,764 470,349 485,400 500,933Additional Public Funding - - - 110,108 169,495 270,990
Total Funding $ 495,884 $ 524,056 $ 524,056 $ 580,457 $ 654,895 $ 771,923
Recovery Ratio* 54.07% 52.98% 54.76% 52.03% 49.18% 45.22%
Required Recovery Ratio 52.90% 53.00% 53.00% 52.00% 52.00% 52.00%
Fund Balance $ 242 $ - $ - $ - $ - $ -
*Recovery ratio is calculated by dividing System Generated Revenues over Operating Expense. The calculation includes, In-kind revenues and expenses for security provided by the City of Chicago, excludes security expense and includes some grant revenues.
61
Results-OrientedWe will focus on getting the job doneand will derive personal satisfactionfrom the service we provide.
Business Units

Business Units - Overview
62
Distribution of Expenses by Function - 2007 Budget - ($000's)
Construction, Engineering, and Facilities Maintenance
Safety & Security
Customer Support
Bus Operations
Administration
Vehicle Maintenance
Operations
$476,94742.1%
OperationsSupport
$72,161
6.4%
Maintenance
$448,95139.6%
Administration
$135,09211.9%
Rail Operations
Total$1,133,151
Operations SupportCustomer Support - $14,310 Safety & Security - $57,851 Administration
Operations
Rail Operations - $129,569
Maintenance Construction, Engineering, and Facilities Maintenance - $164,665Vehicle Maintenance - $284,286
Bus Operations - $347,378
Administration - $65,092 Injuries and Damages and Other - $70,000
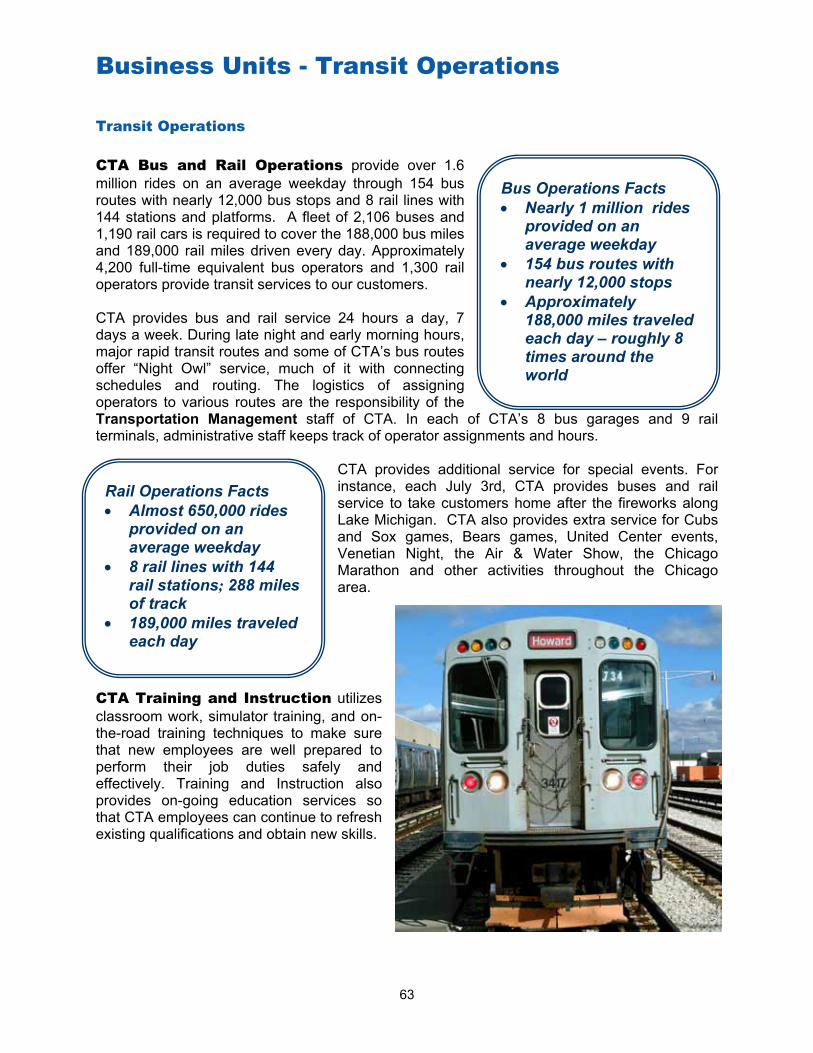
Business Units - Transit Operations
63
Rail Operations Facts • Almost 650,000 rides
provided on an average weekday
• 8 rail lines with 144 rail stations; 288 miles of track
• 189,000 miles traveled each day
Bus Operations Facts • Nearly 1 million rides
provided on an average weekday
• 154 bus routes with nearly 12,000 stops
• Approximately 188,000 miles traveled each day – roughly 8 times around the world
Transit Operations CTA Bus and Rail Operations provide over 1.6 million rides on an average weekday through 154 bus routes with nearly 12,000 bus stops and 8 rail lines with 144 stations and platforms. A fleet of 2,106 buses and 1,190 rail cars is required to cover the 188,000 bus miles and 189,000 rail miles driven every day. Approximately 4,200 full-time equivalent bus operators and 1,300 rail operators provide transit services to our customers. CTA provides bus and rail service 24 hours a day, 7 days a week. During late night and early morning hours, major rapid transit routes and some of CTA’s bus routes offer “Night Owl” service, much of it with connecting schedules and routing. The logistics of assigning operators to various routes are the responsibility of the Transportation Management staff of CTA. In each of CTA’s 8 bus garages and 9 rail terminals, administrative staff keeps track of operator assignments and hours.
CTA provides additional service for special events. For instance, each July 3rd, CTA provides buses and rail service to take customers home after the fireworks along Lake Michigan. CTA also provides extra service for Cubs and Sox games, Bears games, United Center events, Venetian Night, the Air & Water Show, the Chicago Marathon and other activities throughout the Chicago area.
CTA Training and Instruction utilizes classroom work, simulator training, and on-the-road training techniques to make sure that new employees are well prepared to perform their job duties safely and effectively. Training and Instruction also provides on-going education services so that CTA employees can continue to refresh existing qualifications and obtain new skills.

Business Units - Maintenance
64
Vehicle Maintenance Vehicle Maintenance plays a vital role in the CTA’s mission to provide CTA customers with on-time, clean, safe, and friendly transit services. Behind the scenes, skilled employees perform preventative and corrective maintenance tasks in accordance with CTA’s maintenance program. This maintenance program is required by the Urban Mass Transportation Act. When major repairs or component overhauls are needed, buses and trains are serviced at CTA’s heavy maintenance facilities or private contractors. Technological advances in CTA vehicles have resulted in more reliable service, more effective crime prevention and detection, and more accurate and timely information for our customers. These technologies include the following:
• Newer buses contain additional security cameras and “black box” data recorders • Automated Vehicle Location (AVL) and Automated Vehicle Annunciation System (AVAS)
are the foundation for service monitoring, next-bus information, and destination signs • Automatic Vehicle Monitoring (AVM) which provides early warning of potential
maintenance needs • Automated Passenger Counter (APC) to provide more accurate information on
passenger loads and customers’ travel patterns The new technologies have also made maintenance of CTA vehicles more labor-intensive. A team of highly-skilled maintenance technicians is paramount for maintaining these technically sophisticated vehicles. Bus Maintenance Facts The CTA bus fleet is comprised of 2,106 vehicles. Every day the maintenance staff fuel and service approximately 1,800 buses. To ensure that CTA operates safe and reliable vehicles, Bus Quality Control performs more than 16,000 quality control inspections per year. Preventative maintenance inspections are performed every 4,000 miles for a total of over 17,000 inspections per year. Bus interiors are swept and cleaned daily, and exteriors are normally washed every day. Buses are thoroughly cleaned approximately 20 times per year. Other bus maintenance activities include repair or replace 125 bus radios and 75 public address systems per month. Maintain more than 18,000 wheels and tires and reline approximately 1,900 brakes per year. Last year, 94 buses were overhauled and 141 buses were cycled through the paint shop for full repaint or minor touch-ups. Each year, over 14,000 sub-components are rebuilt.

Business Units - Maintenance
65
Rail Maintenance Facts The CTA rail fleet contains 1,190 rail cars comprised of 4 model series dating from 1970. All rail cars required for service are swept and cleaned each night. Interior cleaning is also performed on a regular basis. In-depth inspections are performed on the rail cars each year which encompass all major systems and components including the removal and inspection of the truck assembly. Quarter and mid-life rail car overhauls are performed every 6-7 and 12-14 years, respectively. For 2007, 120 of the 2200 and 2400 series railcars are scheduled to receive a life extending overhaul. Summer/Winter tune-ups: Each season 96 de-icers are rebuilt, tune-ups are performed on 4 diesel rail track snow plows, 4,700 sleet scrapers are fabricated, and 225 rail car HVAC units overhauled. Other shop maintenance includes the rebuild of 2,500 brake parts, 350 hydraulic power control units and motors. Annually, more than 1,500 wheel profiles are performed, 600 traction motors rebuilt and 34,000 traction motor carbon brushes replaced. Each year nearly 900 wheel assemblies and 200 trucks are repaired or rebuilt, 50 control groups, 350 line breakers, 165 reversers, 135 batteries, and 1,800 trolley shoes are rebuilt.
GoalsManage and maintain expanded bus fleet using existing resources.Maintain equipment per CTA Maintenance Plan.Improve vehicle reliability (increase mileage between road calls and vehicle Perform timely vehicle replacement or overhaul with minimal service disruption.Expand use of technology to upgrade data reliability .Fully implement Maintenance Management Information System.Achieve Key Performance Indicators.
Warehouse Operations is responsible for distributing parts and materials to all maintenance facilities. The main warehouse is strategically located at the center of the CTA network and replenishes all CTA stockrooms. Annually, over one million inventory transactions are performed, valued at approximately $70 million. In addition to planning and control of maintenance material, Warehouse Operations is also responsible for retaining CTA records.

Business Units - Maintenance
66
Construction, Engineering and Facilities Maintenance
Construction, Engineering and Facilities Maintenance play a significant role in the operations of the CTA. These groups are responsible for the system-wide inspection, construction, maintenance and repair of all CTA facilities and infrastructure. The Construction group is responsible for implementing major capital construction in conformance with the CTA Quality Manual, ISO9001 standards and grantor agency requirements. The CTA is one of only three transit agencies in the US to be ISO certified. The Engineering group is responsible for the design of all CTA capital
projects as well as maintenance of the rail infrastructure including 288 miles of track, 87.5 miles of elevated structure and 12 rail yards. The Facilities Maintenance employees work around the clock, 365 days a year, maintaining, 144 rail stations, 9 rail terminals, 8 bus garages, 108 elevators, 148 escalators and over 5 million square feet of CTA property in more than 450 buildings. Capital Construction is responsible for implementing major capital construction projects on time and on budget. CTA’s capital construction projects are managed in conformance with the CTA Quality Manual, ISO 9001 standards and grantor agency regulations and requirements. Since 2003, CTA’s Construction division has been registered to ISO 9001:2000. This is a significant achievement as CTA is one of only three transit agencies in the US to be certified. Capital Construction is also responsible for overseeing program management and construction management services used by CTA in order to assist in the monitoring and controlling of multiple construction projects. The department is also responsible for developing and implementing uniform procedures and processes that assist in the design, construction and administration of the Capital Program. The recent $482 million Blue Line (Douglas) Rehabilitation Project, the $282 million Red Line (Dan Ryan) Rehabilitation project and numerous smaller projects have been completed on-time and on budget. In 2007, Capital Construction will oversee approximately $250 million in new projects and more than $1.3 billion over the next five years. Engineering is responsible for the design of CTA capital projects, including facilities, track signal, structure, and power conversion and distribution systems. Engineering oversee the system-wide maintenance of rail infrastructure.
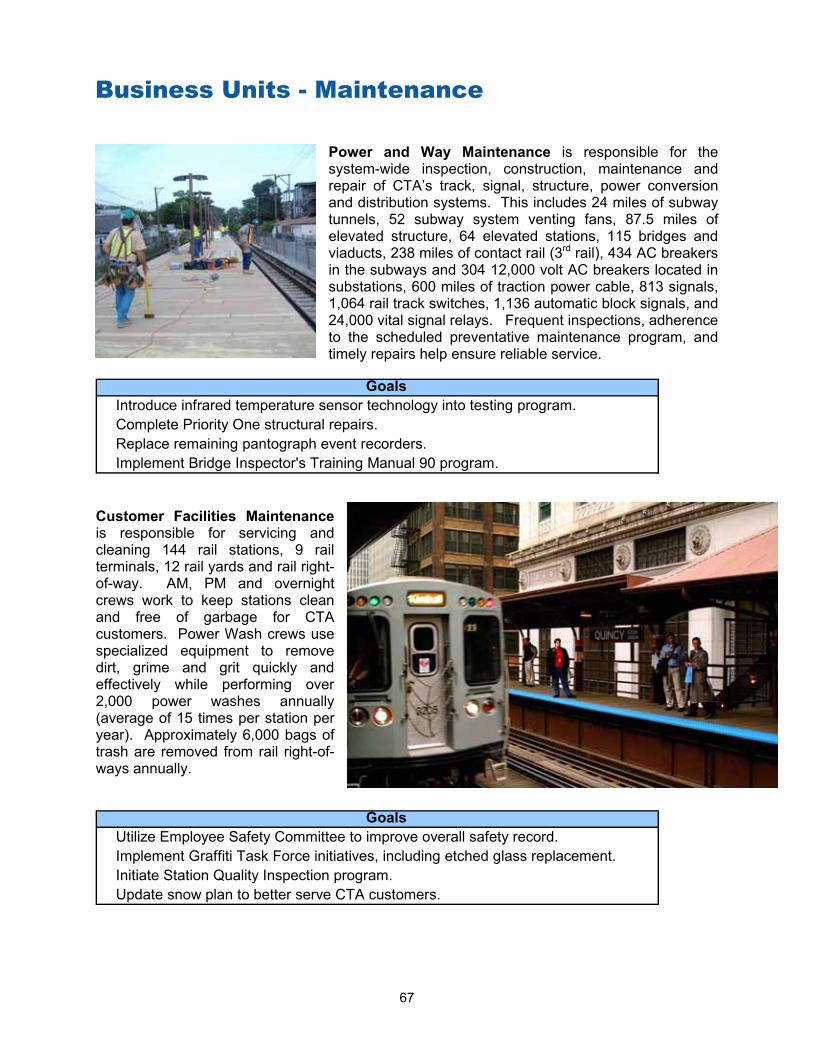
Business Units - Maintenance
67
Power and Way Maintenance is responsible for the system-wide inspection, construction, maintenance and repair of CTA’s track, signal, structure, power conversion and distribution systems. This includes 24 miles of subway tunnels, 52 subway system venting fans, 87.5 miles of elevated structure, 64 elevated stations, 115 bridges and viaducts, 238 miles of contact rail (3rd rail), 434 AC breakers in the subways and 304 12,000 volt AC breakers located in substations, 600 miles of traction power cable, 813 signals, 1,064 rail track switches, 1,136 automatic block signals, and 24,000 vital signal relays. Frequent inspections, adherence to the scheduled preventative maintenance program, and timely repairs help ensure reliable service.
Goals
Introduce infrared temperature sensor technology into testing program.Complete Priority One structural repairs.Replace remaining pantograph event recorders.Implement Bridge Inspector's Training Manual 90 program.
Customer Facilities Maintenance is responsible for servicing and cleaning 144 rail stations, 9 rail terminals, 12 rail yards and rail right-of-way. AM, PM and overnight crews work to keep stations clean and free of garbage for CTA customers. Power Wash crews use specialized equipment to remove dirt, grime and grit quickly and effectively while performing over 2,000 power washes annually (average of 15 times per station per year). Approximately 6,000 bags of trash are removed from rail right-of-ways annually.
GoalsUtilize Employee Safety Committee to improve overall safety record.Implement Graffiti Task Force initiatives, including etched glass replacement.Initiate Station Quality Inspection program.Update snow plan to better serve CTA customers.

Business Units - Maintenance
68
System Maintenance is responsible for servicing and maintaining all the space owned, operated and leased by CTA. This includes maintenance of all heating, ventilation and air conditioning systems, an extensive sewer network with over 1,300 manholes, over 2,000 heater elements on rail platforms, and over 60 subway exhaust fans. Crews replace more than 7,000 air filters annually, and are responsible for the preparation and painting of all CTA properties and signs, as well as the installation, repair, and maintenance of all ceramic and quarry floors and wall tiles. Crews inspect, install, and repair all electrical components and electrical controls on the system including over 50,000 light fixtures. Other System Maintenance activities include repair and maintenance of all hoists and jacks, 200 bus shelters, 148 escalators, 108 elevators, 12,000 bus stop signs, and 112 bus turnarounds. They are also responsible for coordinating snow removal at CTA properties, station entrances, bus stops and turnarounds.
GoalsExpand ratio of preventative maintenance to corrective work activity.Increase employee training to ensure competencies with varying equipment.Continue progress toward 5-year goal of reducing Injury on Duty by 20 percent.
System Maintenance Support is responsible for the repair and maintenance of approximately 600 non-revenue vehicles. The non-revenue vehicle fleet includes both highway vehicles such as emergency response vehicles, sedans, trailers, and trucks; and other rubber-tired equipment such as forklifts, electric carts, snowplows and yard cranes. In addition, System Maintenance Support handles emergency response for non-functioning buses and derailed trains.
GoalsContinue CTA Green Initiatives: reduction of air pollution, recycling, energy Expand number of fueling stations with alternative fuel pumps.Complete integration of automated fuel data with vehicle maintenance system.Develop a comprehensive GPS plan for security, operational and maintenance

Business Units – Operations Support
69
Safety and Security The safety and security of CTA’s customers, employees and properties is of principal importance. Security Services has the triple mission of investigating incidents, facility security, and performance control. Activities range from preparation of security assessments and plans, compliance with national and regional security requirements, performance of quality reviews of rail and bus safety guidelines, and collection and reporting of security statistics. CTA operations are monitored in its Control Center. The CTA Control Center uses data communication, radios, GPS monitoring, and other systems to obtain real-time information on service and incidents throughout the CTA system. The Control Center operates 24 hours per day, 7 days a week. The Security department works with the Chicago Police Department, the Emergency Communications Center, the Department of Homeland Security, and many other organizations to provide a secure environment for customers and employees. Many layers of security have been built in to minimize security threats including monitoring and performing periodic investigations of CTA facilities. The CTA has achieved significant milestones in safety and security including the completion of a key portion of fiber optic expansion that provides for security cameras along portions of the Blue Line. Additional expansions are planned for other areas within the rail system. By the end of 2006, approximately 1,200 cameras will be operational at 45 stations. These cameras will be linked to the City of Chicago 911 Emergency Communications Center. CTA’s entire bus fleet is already equipped with security cameras. Security, however, is not a one-group function at the CTA, but a process that extends across departmental lines. As such, Security Services has engaged cross-departmental committees to discuss strategies for enhanced security measures. Systems Safety works to prevent accidents involving both employees and customers. Safety analysts examine facilities for potential safety hazards. They also investigate incidents and implement measures to prevent recurrence of similar events. All new capital projects are reviewed and monitored by safety engineers to make sure that they comply with CTA safety standards. With oversight from DuPont Safety Resources, the CTA has developed a charter team with five sub-committees to focus efforts to investigate accidents, understand the nature and causes of these incidents, implement and communicate processes to prevent future accidents, and provide detailed reports on overall safety performance.

Business Units - Operations Support
70
Customer Outreach and Support Customer interaction is imperative for the CTA to operate effectively. The CTA routinely provides customers with information regarding new initiatives and service-related events. Feedback from our customers helps us to better match service levels with demand. Communications & Marketing provides information to customers, the general public and the news media regarding CTA service and initiatives. Through maps, brochures, flyers, news releases and a cable television show, the department works with other CTA departments to design and create materials that promote CTA service and encourage ridership. The Department also operates programs to increase ridership, such as the New Resident and University Pass programs. Government and Community Relations communicates initiatives to elected officials, customers, community organizations, and CTA’s sister agencies. The department’s outreach include providing information and obtaining feedback on major capital projects, sponsoring service-enhancement workshops, working with senior citizen groups through the City of Chicago – Department of Aging, and participating in neighborhood festivals and parades.
Customer Service responds to customer’s phone inquiries, e-mails and letters, and solicits feedback from customers through market research and surveys. Accessible transit service is a major concern for the CTA and is handled through compliance with ADA requirements and through customer interaction. Planning and Scheduling is responsible for the design, implementation and evaluation of service through an intensive data-driven process. Strategic Planning performs market research to
determine both the short-term and long-term needs of the CTA. Data Services and Technology Development oversees data collection and management. This vital task is accomplished using computer programs that integrate automated data collected from buses and rail stations. Service Planning uses data from many sources and, in particular, information that is collected through our smart buses to produce a cohesive service network designed to match CTA service with customer demand. Changing traffic generators and travel patterns require oversight of the network to ensure the system adapts to new opportunities and challenges. Express buses, including the ratio of express to local service, illustrates an example of changing riding patterns and the need for creativity in service design. Schedules uses information from Service Planning and feedback from Bus and Rail Operations to develop and fine tune the schedules used on every bus route and rail line in the system. Special schedules are produced as needed for extraordinary circumstances such as planned construction projects or major special events. Facilities Development ensures that scheduled services have the needed on-street infrastructure in place to support operations. This division also coordinates fare equipment in rail stations, locations of bus turnarounds, shelter placement and bus route signage and oversees programs such as Arts in Transit.

Business Units - Administration
71
Administration Administration is an integral part of CTA’s operations. Because CTA’s funding is limited, every effort must be made to ensure our resources are utilized wisely. The annual budget process evaluates CTA’s financial environment and current business processes to prioritize corporate goals and ensure efficient resource allocations. Finance must effectively manage CTA’s limited resources to maximize operational efficiency. The Accounting department ensures all transactions are properly paid and recorded and coordinates all audits and reporting of monthly financial results. Treasury collects and invests all revenue. The Finance department ensures that resources are allocated and used effectively. Capital Investment identifies and targets critical capital funding for projects crucial to maintaining and enhancing CTA’s facilities and vehicle fleets. Typically, Capital Investment evaluates and develops long-term plans focusing on initiatives to expand service, renew assets, replace fleet, and bring the system to a state of good repair. Employee Relations functions to ensure labor-management effectiveness and to maintain a high level of employee satisfaction. This includes ensuring compliance with FTA and CTA drug and alcohol policies and programs. Employee Relations also administers labor contracts and grievances. Technology Management provides and maintains the systems the CTA requires to offer a quality transit service. Continual enhancements are required to ensure that updated technology allows CTA to perform at a high level. Human Resources assist in recruiting and managing benefits and services to insure the well being of the workforce. To continue to deliver high-quality transit service, it is essential the CTA hire, train and retain talented individuals. General Counsel represents CTA in all legal disputes and provides advice regarding CTA’s issues and transactions. The office of the General Counsel has focused on streamlining processes and provides advice regarding compliance with applicable laws and regulations. The department also handles all accident and workers compensation claims. Purchasing processes over 10,000 contracts on an annual basis and works to ensure that CTA secures the best prices for the needed goods and services. Property and Real Estate Asset Management is responsible for the management of the CTA Headquarters building at 567 W. Lake, the CTA Control Center building at 120 Racine, and for the management of all properties leased by the CTA. This division also provides an extensive mail delivery system for all CTA locations. The Office of Inspector General is responsible for conducting all internal audits at the CTA and for investigating allegations of employee or vendor misconduct. Through these activities, the OIG ensures efficiency and effectiveness in the administration of CTA programs, promotes best practices, and instills integrity in CTA operations.
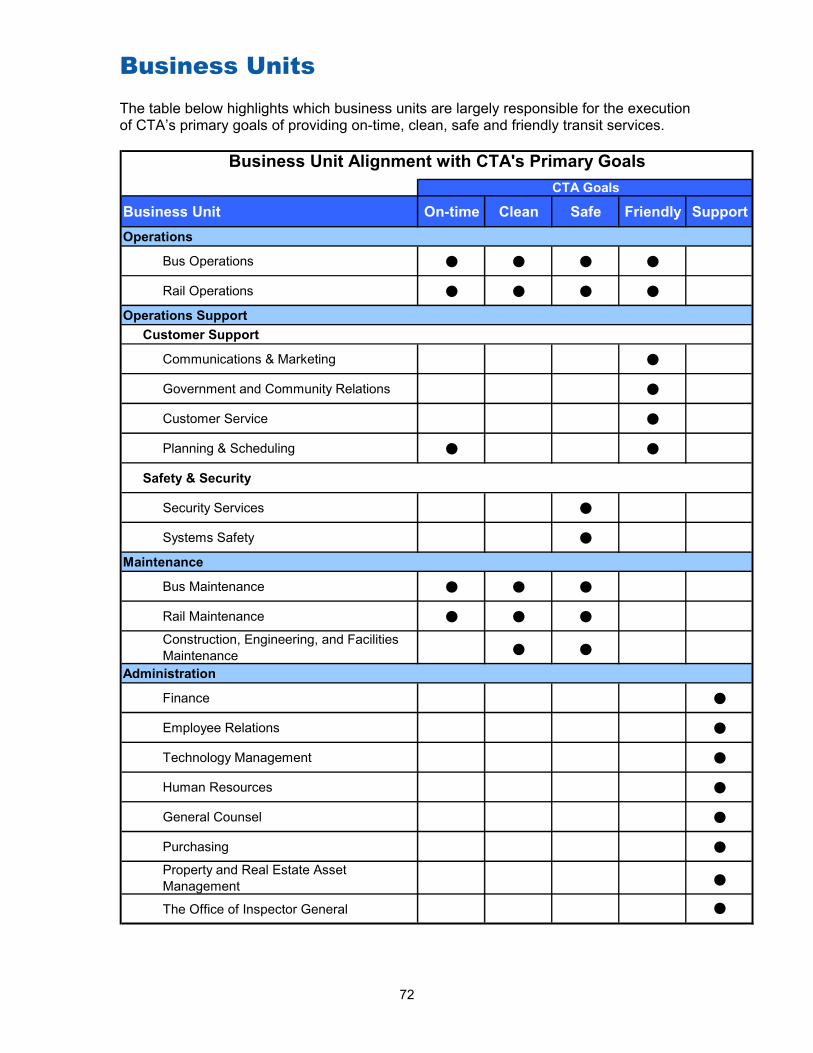
Business Units
72
The table below highlights which business units are largely responsible for the execution of CTA’s primary goals of providing on-time, clean, safe and friendly transit services.
Business Unit On-time Clean Safe Friendly SupportOperations
Bus Operations ● ● ● ●Rail Operations ● ● ● ●
Operations SupportCustomer Support
Communications & Marketing ●Government and Community Relations ●Customer Service ●Planning & Scheduling ● ●
Safety & Security
Security Services ●Systems Safety ●
Maintenance
Bus Maintenance ● ● ●Rail Maintenance ● ● ●Construction, Engineering, and Facilities Maintenance ● ●
Administration
Finance ●Employee Relations ●Technology Management ●Human Resources ●General Counsel ●Purchasing ●Property and Real Estate Asset Management ●The Office of Inspector General ●
Business Unit Alignment with CTA's Primary GoalsCTA Goals

ReliableWe will be dependable for ourcustomers and fellow employees,and will maintain the higheststandards of trust.
President’s 2007-2011 Proposed Capital Improvement Plan and Program

President’s 2007-2011 Proposed Capital Improvement Program
73
Introduction This proposed 2007-2011 Capital Improvement Program (CIP) identifies and targets available capital funds toward key capital renewal and improvement needs of CTA’s system. Substantial and consistent investment in capital infrastructure has a significant positive effect on CTA’s operating budget. Capital infrastructure in a state of good repair leads to reduced maintenance costs, greater operating efficiency and improved customer satisfaction. The program is funded from three sources:
• Federal Transit Administration (FTA) • Regional Transportation Authority (RTA) • Capital Bonds (CTA)
These sources provide funding to cover projects contained in the typical CTA five-year capital program. The Illinois FIRST program provided nearly $200 million per year in the past. Non federal funding over the next five years will be reduced dramatically, to about one tenth the level in the 2002-2006 program. Until a successor to this state funding is approved, CTA’s and other regional transit capital funding will be severely diminished. Without a successor to Illinois FIRST, the only non-federal capital funds will be RTA discretionary funds. This proposed CIP totals $2.7 billion, with $1 billion programmed for vital system expansion, including completion of the Brown Line Capacity Expansion project; and $1.7 billion in projects to renew CTA assets, replace the fleet, and bring the system to a state of good repair. To alleviate a shortfall in CTA’s operating budget, the 2006 capital program diverted $41.2 million in preventive maintenance to operating, resulting in the deferral of critical capital projects. This amount is in addition to capital funds diverted in previous years. The proposed program does not divert scarce capital funds to balance the operating budget. If CTA were to divert approximately $65 million in capital funds to operating in 2007, critical projects to overhaul aging rail cars and buses would be delayed or cancelled. In 2005, the Illinois legislature took initial steps to provide additional operating funds for CTA with a $54.3 million grant. The legislature has demonstrated that it recognizes the need to provide additional funding for transit in the region. Regardless of future funding made available by the Illinois General Assembly, additional capital funds will not be diverted to the operating budget. CTA must continue to maintain and improve its capital infrastructure. The funding identified in this CIP will only partially meet CTA’s needs to bring its system to a state of good repair. An additional estimated $5.8 billion remains unfunded during the five year period of this CIP. As the Illinois legislature looks at providing additional capital funding to the Chicago region, CTA has taken a thorough and systematic look at the additional funding needed to reach a state of good repair. Vital projects affecting quality of service such as replacement of subway lighting and ventilation systems, viaduct renewal, track and track bed renewal, and station upgrades remain unfunded. As long as such projects remain unfunded, customers will experience slow zones and service delays as well as lower overall service quality. In addition, to meet the needs of future growth in the region, CTA needs $4.2 billion for expansion projects such as Circle Line, Airport Express, the Ogden Transitway, and the Red, Orange, and Yellow Line extensions. It is critically important for CTA to maintain its existing bus and rail system. It is equally important to improve the connectivity and usefulness of the system by adding

President’s 2007-2011 Proposed Capital Improvement Program
74
strategic connections and line extensions. As the bus and rail system operates more efficiently, the population of the entire Chicago region will benefit. CTA State of Good Repair Standards CTA’s goal is not merely to replace equipment and facilities in-kind, but to replace existing systems, where appropriate, with current, modern technology. CTA has based its State of Good Repair estimates on the following industry replacement and rehabilitation standards: • Buses should be rehabbed at six years and replaced at twelve years. • Railcars should be rehabbed at quarter- and mid-life intervals, and replaced at 25
years. • Rail stations should be comfortable and secure, and replaced or rehabbed at 40 years. • Rail lines should be free of slow zones, and should have reliable signal systems. • Maintenance facilities should be replaced at 40 years (or 70 years if rehabbed). • Service management systems should be modern and reliable. Until CTA reaches a State of Good Repair, it will continue to face slow zones, periodic service interruptions, and increased operating and maintenance costs due to deferring capital projects. Meeting and maintaining these standards improves the comfort and reliability of the services CTA provides its customers, and reduces operating and maintenance costs for CTA. Prudent investment strategies address both visible signs of system aging such as station roofs in disrepair, and less visible signs such as leaking tunnels and overburdened power and communication systems. The CIP strives to maintain a balance between investment to upgrade existing infrastructure and responding to service needs that are visible to our customers. Given the advanced age of many CTA assets and the limited resources available for capital needs, the proposed projects are crucial in balancing the maintenance and providing for needed strategic service expansion. However, given the current constraints on capital funding, it is harder to achieve this balance each year. As additional non-federal funding is made available in future years, achieving this goal will become possible.
Efficient Use of Available Capital Funding When Congress enacted TEA-21 in 1998, the Illinois General Assembly responded, enacting Illinois FIRST in 1999 to provide adequate non-federal matching funds. CTA’s goal was to obligate 80 percent and spend 50 percent of the funds available between 2000 and 2004. CTA exceeded both goals, with 81.5 percent of these funds obligated and 64.2 percent of the funds spent as of December 31, 2004. CTA projects a similar goal for additional capital funds in the 2007-2011 CIP. Unfunded Capital Need In 2005, the Illinois State Auditor General was directed to review CTA’s operations and management, including its capital program. In addition, CTA has been engaged in a rigorous
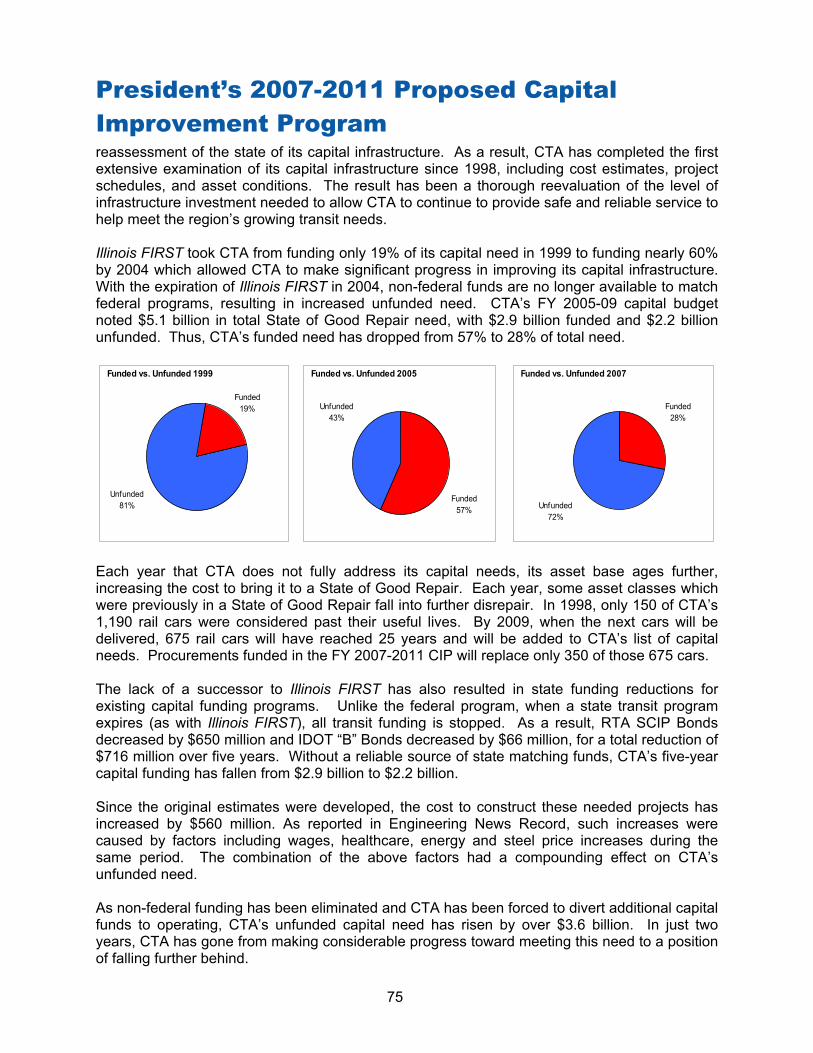
President’s 2007-2011 Proposed Capital Improvement Program
75
reassessment of the state of its capital infrastructure. As a result, CTA has completed the first extensive examination of its capital infrastructure since 1998, including cost estimates, project schedules, and asset conditions. The result has been a thorough reevaluation of the level of infrastructure investment needed to allow CTA to continue to provide safe and reliable service to help meet the region’s growing transit needs. Illinois FIRST took CTA from funding only 19% of its capital need in 1999 to funding nearly 60% by 2004 which allowed CTA to make significant progress in improving its capital infrastructure. With the expiration of Illinois FIRST in 2004, non-federal funds are no longer available to match federal programs, resulting in increased unfunded need. CTA’s FY 2005-09 capital budget noted $5.1 billion in total State of Good Repair need, with $2.9 billion funded and $2.2 billion unfunded. Thus, CTA’s funded need has dropped from 57% to 28% of total need.
Each year that CTA does not fully address its capital needs, its asset base ages further, increasing the cost to bring it to a State of Good Repair. Each year, some asset classes which were previously in a State of Good Repair fall into further disrepair. In 1998, only 150 of CTA’s 1,190 rail cars were considered past their useful lives. By 2009, when the next cars will be delivered, 675 rail cars will have reached 25 years and will be added to CTA’s list of capital needs. Procurements funded in the FY 2007-2011 CIP will replace only 350 of those 675 cars. The lack of a successor to Illinois FIRST has also resulted in state funding reductions for existing capital funding programs. Unlike the federal program, when a state transit program expires (as with Illinois FIRST), all transit funding is stopped. As a result, RTA SCIP Bonds decreased by $650 million and IDOT “B” Bonds decreased by $66 million, for a total reduction of $716 million over five years. Without a reliable source of state matching funds, CTA’s five-year capital funding has fallen from $2.9 billion to $2.2 billion. Since the original estimates were developed, the cost to construct these needed projects has increased by $560 million. As reported in Engineering News Record, such increases were caused by factors including wages, healthcare, energy and steel price increases during the same period. The combination of the above factors had a compounding effect on CTA’s unfunded need. As non-federal funding has been eliminated and CTA has been forced to divert additional capital funds to operating, CTA’s unfunded capital need has risen by over $3.6 billion. In just two years, CTA has gone from making considerable progress toward meeting this need to a position of falling further behind.
Funded vs. Unfunded 1999
Unfunded81%
Funded19%
Funded vs. Unfunded 2005
Funded57%
Unfunded43%
Funded vs. Unfunded 2007
Unfunded72%
Funded28%

President’s 2007-2011 Proposed Capital Improvement Program
76
Capital Grant Program Administration Over the past five years, CTA’s Capital Improvement Program has totaled nearly $3 billion. Capital projects involve long lead times for planning, design and engineering before construction actually begins. As a result, CTA and other transit agencies must build up large reserves of capital funds for ongoing projects. To accelerate capital projects and reduce capital funding accumulations, federal rules permit the use of “pre-award authority;” that is, CTA can award contracts and obligate funds prior to grant approval and receipt of federal funds. Neither the RTA nor IDOT permits the use of “pre-award authority” to award contracts prior to receipt of funds. This practice forces CTA and the other service boards to amass all funding necessary for a large capital project before awarding the contract and obligating funds. The application of federal rules in this situation would make this process more efficient by accelerating capital projects and reducing capital funding accumulation. In addition, CTA uses capital bond programming to ensure additional flexibility in managing project programming and project cash need. Continued use of the grant anticipation bonds is anticipated in 2007, 2008, and 2010. Operating Budget Impact of Capital Program Projects Much of CTA’s investment in capital projects has a positive impact on the operating budget. For example, overhaul of rail cars at mid-life and quarter-life intervals results in lower overall maintenance costs. Parts and components replaced in a systematic campaign would otherwise be replaced on a fail-in-service basis with a corresponding higher cost and a lower fleet reliability due to increased visits to the maintenance shop. Purchase of replacement buses provides both a more reliable fleet and reduces failure based maintenance. In addition, newer buses operate with significantly lower emissions, helping to prevent air pollution in the region.

President’s 2007-2011 Proposed Capital Improvement Program
77
Sources of Funds The funding levels used in preparing the proposed 2007-2011 CIP reflect the capital resources available to CTA through the Regional Transportation Authority (RTA). These include $2.1 billion from the Federal Transit Administration (FTA), $102 million from the RTA, and $425 million from CTA Bonds. Approximately $920 million of federal funds are “New Start” funds, only a portion of which are guaranteed at this time. Total projected available funding is $2.7 billion. A summary of this funding is presented in the following figure. The federal funds reflect the passage of SAFETEA-LU, reauthorizing federal funding through 2009. The table on the following page details the funding sources supporting this program.
Preliminary FY 2007-2011 Capital Improvement Program Funding Sources
(thousands of dollars)
5309 Rail$485,851
5309 New Start $920,062
5339 Alternatives
Analyses $14,100
5307 Formula $710,224
CTA Bond$425,000
Transfer Capital $101,765
Total = $2.7 Billion

President’s 2007-2011 Proposed Capital Improvement Program
78
NEW FUNDS 2007 2008 2009 2010 2011 TOTAL
Sec.3 (5309) Fixed Guideway 87,745$ 92,915$ 96,987$ 101,791$ 106,412$ 485,851$ Sec.3 (5309) New Start 64,954$ 95,550$ 220,749$ 269,405$ 269,405$ 920,062$ Sec. (5339) Alternatives Analyses 14,100$ -$ -$ -$ -$ 14,100$ Sec.9 (5307) Formula 122,545$ 133,087$ 141,728$ 151,636$ 161,227$ 710,224$
Total Federal 289,344$ 321,553$ 459,464$ 522,832$ 537,044$ 2,130,237$
CTA Bonds 125,000$ 150,000$ -$ 150,000$ -$ 425,000$ Transfer Capital 20,353$ 20,353$ 20,353$ 20,353$ 20,353$ 101,765$
Total Local 145,353$ 170,353$ 20,353$ 170,353$ 20,353$ 526,765$
Total Available Funds 434,697$ 491,906$ 479,817$ 693,185$ 557,397$ 2,657,002$
FY 2007- 2011 CIP FIVE YEAR PROGRAM MARKSCHICAGO TRANSIT AUTHORITY
(thousands of dollars)
Enactment of Federal Transit Funding On July 29, 2005 Congress approved the Safe, Accountable, Flexible, Efficient Transportation Equity Act: A Legacy for Users (SAFETEA-LU). President George W. Bush signed the act on August 10, 2005. The new federal transit and highway bill authorized $286.4 billion nationwide through 2009, including $52.6 billion for transit. The bill will make available over $1.5 billion in transit formula funds for the Chicago region over four years. SAFETEA-LU includes continued funding for the Brown Line Capacity Expansion Project and will complete the federal funding commitment to the recently completed Blue Line Cermak (Douglas) Branch Reconstruction Project. A Renewed State Capital Program is Essential The federal funds available under SAFETEA-LU will require approximately $220 million in non-federal matching funds to fully utilize the federal formula funds. Additional funds will also be required to match federal New Starts funds for new lines and extensions to existing lines. With the expiration of Illinois FIRST in 2004, non-federal funds are no longer available to match these federal programs, except for the Brown Line Capacity Expansion Project, which is fully funded. In rating a New Start project, FTA considers the level of commitment of local funds prior to entering into a Full Funding Agreement. Without a reliable source of non federal capital funding, CTA is not likely to receive a favorable rating, necessary for federal funding. The loss of these non-federal funds has resulted in the delay of several critical infrastructure investments. Projects slowed or delayed include: bus midlife overhauls, bus replacements, railcar midlife overhauls, rail car replacement, signal upgrades, rail track and tie replacement, and rehabilitation of elevators and escalators. In the past, these funds have provided the required non-federal match to access federal funds. This reduction has also seriously impacted CTA’s ability to reach a state of good repair on its capital infrastructure.

President’s 2007-2011 Proposed Capital Improvement Program
79
The federal transportation program is regularly re-authorized and even when an authorization expires, Congress continues to appropriate funds until a new program is created. Like the federal program, state road funds continue to be appropriated by the legislature. Unlike the federal program, when a state transit program expires (as with Illinois FIRST), all transit funding is stopped. This start and stop approach makes it much more difficult to plan and implement transit capital projects. Most transit projects are, by their nature, multi-year projects which require multi-year commitments of funds. The Downward Spiral of Disinvestment
Thanks to Illinois FIRST, TEA 21, and the new SAFETEA-LU, CTA made progress in rebuilding its infrastructure and preventing further system deterioration. CTA must continue to maintain and upgrade its capital assets to preclude movement toward a state of disinvestment. Disinvestment is characterized by lagging capital investment resulting in system disintegration and trip delays which lead to deteriorating service quality. Consequently, customers leave the system and the financial base begins to erode. This spiral, once engaged, is difficult to reverse. Significant progress towards a state of good repair was made under Illinois FIRST and TEA-21. The passage of SAFETEA-LU provides the base for continued progress. A successor to Illinois FIRST will maintain CTA’s forward movement towards a state of good repair. It will also ensure that the region is realigned with the federal transit program and continue the momentum that existed under TEA-21 and Illinois FIRST. Consistent, reliable capital funding is essential to prevent future disinvestment. The following graph illustrates capital funding available over the last ten years and projects future capital program funding without a successor to Illinois FIRST. The use of CTA bonding prevents the CIP from decreasing even further in the next five years.
CTA Capital Funding 1998-2011
Without Additional Non-Federal Funding($'s in millions)
238.1 235.9409.5 375.8
552.0640.9
785.7645.3
417.8 434.7 491.9 479.8
693.2557.4
0100200300400500600700800900
1998 1999 2000 2001 2002 2003 2004 2005 2006 2007 2008 2009 2010 2011

President’s 2007-2011 Proposed Capital Improvement Program
80
Uses of Funds - CIP Goals and Objectives With the RTA capital program marks as a foundation, CTA has developed a program of capital projects for the 2007–2011 Capital Improvement Program. CTA’s proposed capital budget continues to work towards the goals and objectives outlined in the 2006-2010 CIP:
• Fund procurement and replacement of vehicles as needed. Replace CTA’s bus and rail fleets, and provide safe and reliable transportation to CTA customers.
• Support enhanced security throughout CTA facilities and systems. Focus on
safety and security needs for customers, employees and the community.
• Continue New Starts projects intended to rehabilitate deteriorated rail infrastructure and expand capacity to accommodate growth in ridership [e.g. through the Brown Line capacity expansion project]. Rebuild the system, starting with the segments of CTA’s rail system most in need to improve system reliability.
• Renew CTA’s rail right-of-way (ROW). Eliminate ROW slow zones that increase travel times. Work to place CTA’s rail system in a state of good repair and increase the reliability of CTA service.
• Upgrade maintenance facilities and provide necessary equipment to keep CTA’s
buses and trains running effectively. Sustain the momentum reflected in CTA’s growth in ridership and customer satisfaction.
As gas prices and congestion in the Chicago area have reached record levels, public transit becomes an even more attractive option to the traveling public. Investment in vital public infrastructure projects provides jobs, creates and supports economic growth, and helps ensure the future vitality of the region. Even for people who never use public transportation, relieving congestion becomes an important goal. As ridership continues to increase, capital infrastructure becomes increasingly important to providing high quality transit services. The 2007-2011 capital program provides some of the funding necessary to address CTA’s customers’ concerns over the next five years. CTA will be able to meet the CIP goals and objectives when additional non-federal funding is provided by the Illinois General Assembly.

President’s 2007-2011 Proposed Capital Improvement Program
81
Uses of Funds – Program Summary The following figure shows the proposed 2007-2011 Capital Improvement Program by general categories of asset improved or replaced. The table on the following page lists each project in the proposed program. A detailed description of each project can be found following this narrative in the section headed Detail Capital Improvement Program Project Descriptions.
Proposed FY 2007-2011Capital Improvement Program
(thousands of dollars)
Rail System Projects
$1,761,491
Bus System Projects
$267,702
Systemwide Projects
$627,809
Total = $2.7 Billion
Sixteen projects comprise CTA’s proposed 2007-2011 capital program. Each project is evaluated in an annual review process based on CTA’s customers’ needs. Evaluation criteria include customer and employee safety, impact on system reliability, reductions to travel time, increased customer comfort and convenience, system security, compliance with regulations and community impact. Rail system projects are allocated a significantly larger proportion of CTA’s capital program funding due to the need to maintain an exclusive right-of-way and the fact that CTA buses operate on streets maintained by other units of government. The capital projects for 2007-2011 and beyond are intended to address CTA’s most pressing needs for the bus and rail system, customer facilities and system-wide support network, as constrained by the level of projected funding.
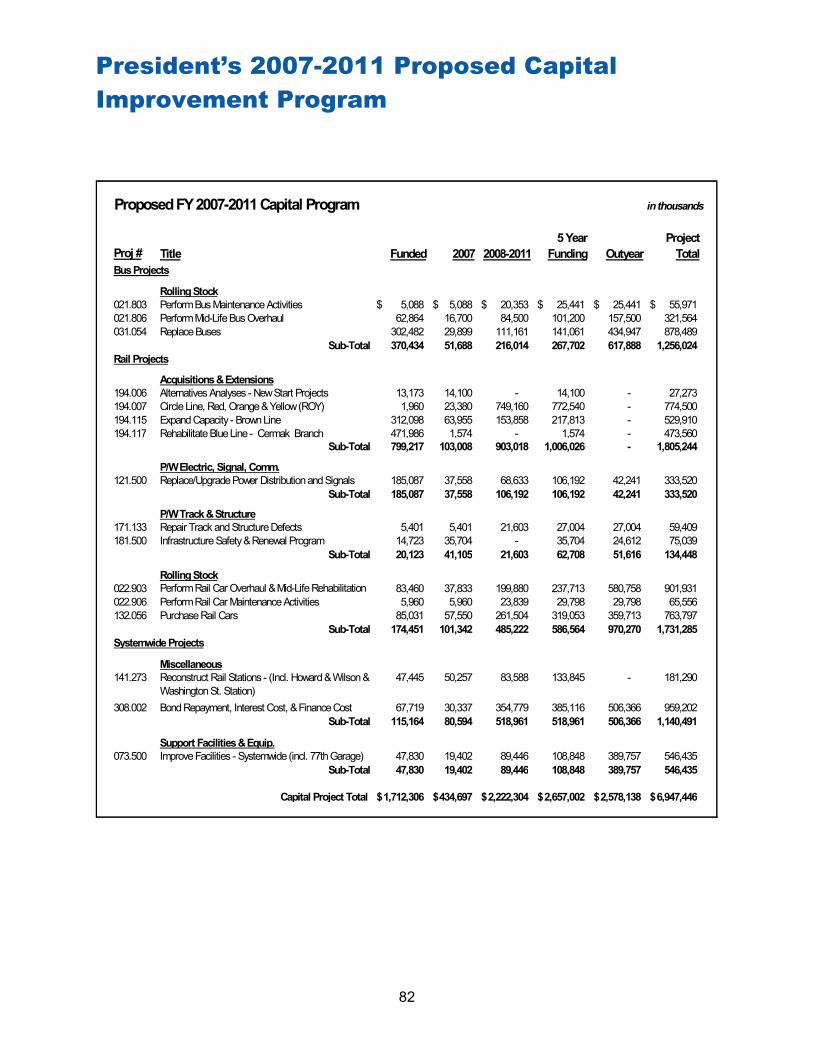
President’s 2007-2011 Proposed Capital Improvement Program
82
Proposed FY 2007-2011 Capital Program in thousands
5 Year ProjectProj # Title Funded 2007 2008-2011 Funding Outyear TotalBus Projects
Rolling Stock021.803 Perform Bus Maintenance Activities 5,088$ 5,088$ 20,353$ 25,441$ 25,441$ 55,971$ 021.806 Perform Mid-Life Bus Overhaul 62,864 16,700 84,500 101,200 157,500 321,564 031.054 Replace Buses 302,482 29,899 111,161 141,061 434,947 878,489
Sub-Total 370,434 51,688 216,014 267,702 617,888 1,256,024 Rail Projects
Acquisitions & Extensions194.006 Alternatives Analyses - New Start Projects 13,173 14,100 - 14,100 - 27,273 194.007 Circle Line, Red, Orange & Yellow (ROY) 1,960 23,380 749,160 772,540 - 774,500 194.115 Expand Capacity - Brown Line 312,098 63,955 153,858 217,813 - 529,910 194.117 Rehabilitate Blue Line - Cermak Branch 471,986 1,574 - 1,574 - 473,560
Sub-Total 799,217 103,008 903,018 1,006,026 - 1,805,244
P/W Electric, Signal, Comm.121.500 Replace/Upgrade Power Distribution and Signals 185,087 37,558 68,633 106,192 42,241 333,520
Sub-Total 185,087 37,558 106,192 106,192 42,241 333,520
P/W Track & Structure171.133 Repair Track and Structure Defects 5,401 5,401 21,603 27,004 27,004 59,409 181.500 Infrastructure Safety & Renewal Program 14,723 35,704 - 35,704 24,612 75,039
Sub-Total 20,123 41,105 21,603 62,708 51,616 134,448
Rolling Stock022.903 Perform Rail Car Overhaul & Mid-Life Rehabilitation 83,460 37,833 199,880 237,713 580,758 901,931 022.906 Perform Rail Car Maintenance Activities 5,960 5,960 23,839 29,798 29,798 65,556 132.056 Purchase Rail Cars 85,031 57,550 261,504 319,053 359,713 763,797
Sub-Total 174,451 101,342 485,222 586,564 970,270 1,731,285 Systemwide Projects
Miscellaneous141.273 Reconstruct Rail Stations - (Incl. Howard & Wilson &
Washington St. Station)47,445 50,257 83,588 133,845 - 181,290
308.002 Bond Repayment, Interest Cost, & Finance Cost 67,719 30,337 354,779 385,116 506,366 959,202 Sub-Total 115,164 80,594 518,961 518,961 506,366 1,140,491
Support Facilities & Equip.073.500 Improve Facilities - Systemwide (incl. 77th Garage) 47,830 19,402 89,446 108,848 389,757 546,435
Sub-Total 47,830 19,402 89,446 108,848 389,757 546,435
Capital Project Total 1,712,306$ 434,697$ 2,222,304$ 2,657,002$ 2,578,138$ 6,947,446$

President’s 2007-2011 Proposed Capital Improvement Program
83
CTA will receive forty five new 30’ buses by the end of 2006. These fully accessible and air conditioned buses represent a new initiative to better serve CTA customers, operating in areas where it is not practical to operate a traditional 40’ bus.
The Bus System CTA operates a fleet of approximately 2,100 buses, which make over 24,400 weekday trips on 154 routes, providing almost one million rides on a typical weekday. Each customer who boards a bus at one of 11,846 bus stops located throughout CTA’s service area expects reliable service that is on time, clean, safe and friendly. The backbone of the bus system is the bus fleet. The system’s success depends on CTA’s ability to renew, maintain and operate its bus fleet. Bus Rolling Stock
Providing new buses reinforces CTA’s commitment to quality bus service. Through September 2006, CTA received 229 buses as part of a base order of 265 New Flyer buses. These full size coaches are air-conditioned and fully accessible; they represent the base segment of an order of up to over 1,000 replacement buses. The entire CTA bus fleet is ADA accessible and air-conditioned. Over the next five years, CTA plans to spend over $141 million on additional purchases of low-floor, fully accessible, air-conditioned buses. These new buses will replace models that entered service in 1991 and
1995, to increase comfort and reliability for thousands of CTA customers. CTA is replacing some of the traditional 40 foot buses in the fleet with heavy duty 30 foot buses. These smaller buses add flexibility for service in areas with narrow streets or extensive on-street parking. The neighborhoods surrounding Hyde Park (University of Chicago) served by routes 170, 171 and 172 are typical of the type of communities CTA can better serve with these smaller vehicles. The bus vehicle overhaul program continues to improve service through regular replacement of major mechanical components subject to extensive wear. Under the bus vehicle overhaul program, CTA will invest $126 million over five years, aimed at reducing operating costs and improving service. Unscheduled maintenance - required by the failure of a bus in service - disrupts operations, inconveniences customers and increases operating costs. Bus mid-life overhaul activities are programmed for $16.7 million in 2007 and $84.5 million during the period 2008-2011. With overhauls, the fleet will benefit with increased reliability and fewer instances of expensive breakdown based repair. Other customer-focused improvements to CTA’s existing buses are on the capital agenda. CTA recently completed the installation and activation of a new state-of-the-art automated announcement system on the bus fleet at a cost of $22.3 million. CTA’s installation of this system is the largest implementation of its kind in the United States. This system provides automated bus stop announcements on CTA buses and electronic signs that display upcoming stops. During stops, the system announces the route and destination of the bus. This new technology makes CTA buses friendlier for customers, especially those who are visually or

President’s 2007-2011 Proposed Capital Improvement Program
84
CTA has 406 Railcars currently on order. These vehicles are scheduled for delivery in 2009 and 2010. They will feature AC-propulsion systems, rider-friendly system map displays, security cameras, and mechanisms to ensure a level boarding from platform to car.
hearing impaired and those who are unfamiliar with a given route. The project also included the installation of automatic passenger counters on 435 buses. The system uses global positioning satellite technology to indicate where customers board and alight buses and the number of customers on board buses at any given point on a route. Automatic passenger counters will assist the CTA in determining how best to improve service to meet customer needs. To effectively manage service delivery and provide reliable information to customers, CTA must have vehicle location information available to operations personnel in real time. The Computer-Aided Dispatch/Automatic Vehicle Location (CAD/AVL) pilot is a $1.3 million effort targeting this goal. Three immediate objectives are: testing the feasibility of real-time data communications between pilot buses, the Control Center and supervisor vehicles; evaluating centralized control and dispatch functions utilizing real-time data; and demonstrating the integration of a customer information application supplying bus arrival predictions via the Internet and at one bus stop. Focusing on the #20 Madison bus route, this pilot leverages the on-board “smart bus” technology that was installed in support of the Automatic Voice Annunciation System (AVAS). At the pilot’s conclusion in 2007, CTA will evaluate program results and develop recommendations regarding a system-wide roll-out which will require significant capital resources. As a result of an unwavering commitment to the environment while providing affordable service to our customers, CTA has taken a number of pro-active steps beyond minimal federal requirements to reduce emissions of its bus fleet. CTA began using Ultra Low Sulfur Diesel (ULSD) as part of its ongoing commitment to reduce fleet emissions in March 2003, well before federal mandated requirements. CTA became the first major user of ULSD in the Midwest, thereby pioneering use of the cleaner fuel by other diesel fleets. Using ULSD in every CTA bus reduces overall emissions by about 10%. In addition CTA uses Clean Diesel Technology, a combination of Exhaust Gas Recirculation (EGR) engines and post-combustion after-treatment (e.g., Particulate Filters), to reduce Particulate Matter, Hydrocarbons and Carbon Monoxides up to 90%, with reductions in Oxides of Nitrogen in the 5% to 15% range. Currently, 284 CTA buses have the combination EGR engines and Particulate Filters installed. Other initiatives include: the purchase of 20 hybrid diesel-electric buses to be placed in service in 2007; idle restriction programming to reduce emissions during layovers; and reduced cold start emissions by installing engine starting assist units in over 200 buses. The Rail System CTA’s rail system consists of approximately 1,190 rail cars, traveling over 287.8 miles of track, making approximately 2,600 train trips on eight routes and 144 stations on a typical weekday. The rail system provides 649,000 trips each weekday; customers depend on CTA’s rail system to deliver them to their destinations quickly and safely. To meet customer expectations, CTA must
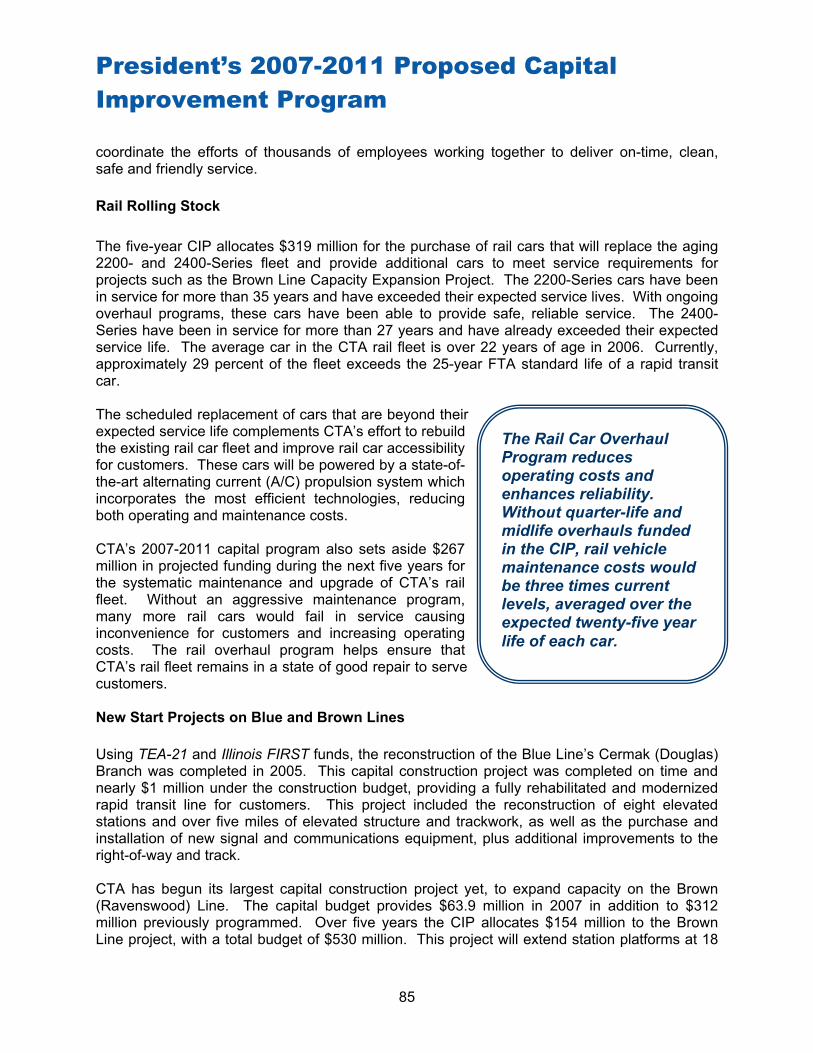
President’s 2007-2011 Proposed Capital Improvement Program
85
The Rail Car Overhaul Program reduces operating costs and enhances reliability. Without quarter-life and midlife overhauls funded in the CIP, rail vehicle maintenance costs would be three times current levels, averaged over the expected twenty-five year life of each car.
coordinate the efforts of thousands of employees working together to deliver on-time, clean, safe and friendly service.
Rail Rolling Stock The five-year CIP allocates $319 million for the purchase of rail cars that will replace the aging 2200- and 2400-Series fleet and provide additional cars to meet service requirements for projects such as the Brown Line Capacity Expansion Project. The 2200-Series cars have been in service for more than 35 years and have exceeded their expected service lives. With ongoing overhaul programs, these cars have been able to provide safe, reliable service. The 2400-Series have been in service for more than 27 years and have already exceeded their expected service life. The average car in the CTA rail fleet is over 22 years of age in 2006. Currently, approximately 29 percent of the fleet exceeds the 25-year FTA standard life of a rapid transit car. The scheduled replacement of cars that are beyond their expected service life complements CTA’s effort to rebuild the existing rail car fleet and improve rail car accessibility for customers. These cars will be powered by a state-of-the-art alternating current (A/C) propulsion system which incorporates the most efficient technologies, reducing both operating and maintenance costs. CTA’s 2007-2011 capital program also sets aside $267 million in projected funding during the next five years for the systematic maintenance and upgrade of CTA’s rail fleet. Without an aggressive maintenance program, many more rail cars would fail in service causing inconvenience for customers and increasing operating costs. The rail overhaul program helps ensure that CTA’s rail fleet remains in a state of good repair to serve customers. New Start Projects on Blue and Brown Lines Using TEA-21 and Illinois FIRST funds, the reconstruction of the Blue Line’s Cermak (Douglas) Branch was completed in 2005. This capital construction project was completed on time and nearly $1 million under the construction budget, providing a fully rehabilitated and modernized rapid transit line for customers. This project included the reconstruction of eight elevated stations and over five miles of elevated structure and trackwork, as well as the purchase and installation of new signal and communications equipment, plus additional improvements to the right-of-way and track. CTA has begun its largest capital construction project yet, to expand capacity on the Brown (Ravenswood) Line. The capital budget provides $63.9 million in 2007 in addition to $312 million previously programmed. Over five years the CIP allocates $154 million to the Brown Line project, with a total budget of $530 million. This project will extend station platforms at 18

President’s 2007-2011 Proposed Capital Improvement Program
86
CTA’s infrastructure continues to age – parts are more than 100 years old 1892-1920 Elevated rail system Archer and 77th Street Garages, South Shop and West Shops 1940-1960 State and Dearborn Subways, Blue Line-Congress Branch, North Park and Forest Glen Garages 1969-1970 Red Line-Dan Ryan Branch, Blue Line-O’Hare Branch (to Jefferson Park) 1983-1984 Blue Line-O’Hare Branch (to O’Hare) 1993 Orange Line to Midway
stations to accommodate eight-car trains and increase capacity by up to 33 percent. Sixteen stations will be reconstructed, of which 12 will have elevators installed to provide improved station accessibility for all customers. The four at-grade stations will be made accessible through the use of ramps. Signal, electrical and communications upgrades will also be performed. To facilitate construction, Clark Junction is being rehabilitated at the same time. Clark Junction is located where the Brown, Purple and Red Line trains merge, just north of Belmont station. The rehabilitation effort consists of replacing sections of track, installing special track work, and upgrading traction power, communications and signal systems. The Clark Junction upgrade will provide operational flexibility to allow customers continued access to stations while they are under construction.
Construction is well underway, with two stations (Rockwell and Kedzie) reopening in September 2006, after rehabilitation. All of the stations are under contract. At Fullerton and Belmont stations, the most complex station rehabilitations on the Brown Line, structural work is proceeding to create new track and platforms. Signal Systems and Traction Power Train movement through the Loop is controlled by a signal territory including both Tower 12 and Tower 18, which are slated for upgrade. The Loop signals project is programmed to receive funding during the five year CIP to upgrade the train control and track interlocking on this busy part of the CTA rail system with modern equipment, providing increased reliability for customers. As part of this initiative, train control will be enhanced on both the Lake Street and Wells Street bridges reducing
delay during seasonal bridge lifts and improving service and operational
flexibility on the Green, Brown, Orange, Purple, and Pink Lines. Continuation of signal upgrade and replacement for the Blue Line is also funded in the five-year CIP. This project, which began in 2006, will replace the entire signal system in the Dearborn

President’s 2007-2011 Proposed Capital Improvement Program
87
CTA New Starts Authorized in SAFETEA – LU Circle Line/Ogden Red Line Extension Orange Line Extension Yellow Line Extension
Subway, on the Congress (Forest Park) Branch and on a portion of the O’Hare Branch. Funding of $65.1 million is included in the CIP for Blue Line signals. These upgrades, which are now underway, will replace systems that are beyond their useful life, some of which were installed during the initial subway system construction during the 1950s. CTA customers will benefit from smoother train operation, reduced travel times and greater reliability.
Other Major Rail Initiatives In addition to the improvements realized through the reconstruction of the Brown Line project, $5.4 million has been budgeted in 2007 to improve and upgrade CTA’s rail system infrastructure. The Church viaduct on the Evanston Purple Line is being reconstructed in 2006. Design of the remaining Evanston viaducts has also been funded, as well as preliminary design for two stations: Main and Dempster. Footwalks at trackside, used by maintenance staff and by customers in case of emergencies, will be replaced or renewed. Right-of-way, ties, track and structure will be replaced throughout the system based on continuous assessment of vital assets, thereby reducing slow zones and maintaining heightened service standards. The structural steel elements used to support CTA’s elevated track will be rehabilitated in locations throughout the system. An additional $35.7 million is budgeted during 2007-2011 to continue systematic rehabilitation of CTA right-of-way. Expansions SAFETEA-LU authorized several system extensions and enhancements for CTA. The Circle Line project will connect all CTA and Metra rail lines in Chicago. The 6.6 miles of new elevated and subway tracks and eleven new or rebuilt stations will enable CTA to operate a new crosstown route, significantly reducing travel times between CTA and Metra stations throughout the city and region. The first phase of this project, the reconstruction of the Paulina connector between the Green and Blue Lines, has been completed and alternatives analysis has begun on the remaining phases. The Ogden Avenue Transitway project is the subject of another CTA Alternatives Analysis study. Also authorized in SAFETEA-LU are potential extensions of the Yellow Line to Old Orchard, the Red Line south to 130th Street, and the Orange Line to the Ford City Shopping Center. The federally required planning and alternatives analyses for these projects began in 2006. The alternatives analyses process will examine a range of potential alternatives, including, but not limited to rail extensions. At the conclusion of the Alternatives Analysis process, a “locally preferred alternative” will be selected. Federal approval is necessary before a project can advance to final design and construction. FTA rates each project based on well-established criteria to asses the relative merits of each project. CTA’s projects compete with other projects across the country for scarce federal New Start funding. Federal funds for “New Starts” are appropriated separately from formula funds and are provided on a competitive basis.

President’s 2007-2011 Proposed Capital Improvement Program
88
CTA Bond Program Authorized and Let 2004 $250 million Authorized 2005 $275 million Proposed 2007 $125 million 2008 $150 million 2010 $150 million
Systemwide Improvements
System Security Enhancements
The events of September 11, 2001 affected CTA’s security strategy. Security assessments have identified priority investments needed to harden the system against terrorist threats. Many projects, including improved station access, sightlines and lighting as well as security cameras, reflect a commitment to safety and security for customers and employees. Using funds provided by the Department of Homeland Security as well as other grant funds, CTA has implemented a number of security projects. Eleven cameras have been installed at stations along the Pink Line (formerly the 54th/Cermak branch of the Blue Line), the first of over 2,000 new cameras to be installed over the next two years, to increase safety and security for riders. An ongoing fiber optic installation project is upgrading the communications backbone throughout the rail system. Subway stations are also being outfitted with cameras to provide a comprehensive view of the transit system to the CTA Control Center, and through redundant fiber optic links, to the Chicago’s 9-1-1 Center. CTA’s new rail cars will also be equipped with enhanced security features, including digital video cameras and recorders. Train control systems, communications infrastructure and access control, funded in the five-year program, contribute to a safe environment for all. However, much remains unfunded and CTA will continue to pursue additional funding to meet these critical needs. Cellular phone service in CTA subways was launched in August 2006. Installation of antenna and transmitters has made signals available underground. This project also provided an upgrade to CTA control and security communications for train operation and customer safety. Facility Improvements
CTA will spend $19.4 million on facility improvements in 2007 including upgrades to rail stations and various support facilities throughout the system. A total of $108 million has been allocated in the five-year program to construct or improve CTA support facilities. The 2007–2011 CIP includes funding for 28 neighborhood rail station rehabilitations. Eight stations were upgraded as part of the Blue Line Cermak (Douglas) branch project (now the Pink Line). All are in the Pilsen, Little Village or Lawndale neighborhoods. Eighteen stations are funded for reconstruction during the Brown Line capacity expansion project, located in neighborhoods from Albany Park to the Loop. Funding in the 2007-2011 CIP will complete the reconstruction of Howard station on the Red Line as a vital intermodal transfer point between buses and trains. On August 16, 2006, CTA reopened two stations at Kedzie and Rockwell on the Brown Line branch which had been under construction for several months. In addition, CTA has budgeted up to $133.8 million during 2007-2011 in reconstructing of Howard, Wilson, and Washington

President’s 2007-2011 Proposed Capital Improvement Program
89
Street Stations on the Red Line. CTA will make significant progress in increasing rail station accessibility during this CIP. Currently, over 50 percent of CTA rail stations are accessible (74 of 144). At the completion of the 2007-2011 CIP, 64 percent of stations will have ADA accessibility (92 of 144), providing additional travel options for CTA customers. Looking Ahead CTA is dedicated to providing on-time, clean, safe and friendly service, but much remains to be done to bring CTA’s system to a state of good repair. The 2007-2011 Capital Improvement Program projects $2.7 billion will be available over the next five years, but that will only be the first step. Completely rebuilding CTA’s system means addressing a considerable funding shortfall resulting in unfunded capital needs. CTA unfunded need is estimated at $5.8 billion. Strategic investment is needed in rail car replacement, traction power system modernization, right-of-way, viaduct renewal, escalators and elevators in rail stations, and upgrade of critical communications systems. Population growth continues to prime local economic growth, but brings traffic congestion, transportation gridlock and the need for transit service expansion. Potential future expansion projects such as Circle Line, Ogden Avenue and Orange, Red and Yellow Line extensions will be predicated on additional capital funding through federal and non-federal sources. CTA supports the RTA’s vision to bridge the funding gap to bring its existing system and infrastructure to a state of good repair and to improve the efficiency of the system by adding critical connections and line extensions. 2007 represents the second year of federal funding under SAFETEA-LU and forms the basis for replacing the expired Illinois FIRST program. Thanks to the strong support of Mayor Richard M. Daley, Governor Rod R. Blagojevich, House Speaker J. Dennis Hastert, the Illinois Congressional delegation and the Illinois General Assembly, these capital funding programs have helped advance CTA’s efforts to rehabilitate rail lines, to renew CTA’s bus fleet, and to incorporate or expand vehicle overhaul programs. The expiration of Illinois FIRST has highlighted the need for additional non-federal matching funds to support the CTA capital program. These non-federal funds are a vital part of the funding needed to continue investment in the region’s public transportation infrastructure. With every dollar of new capital funding obtained, with every capital dollar well spent, and with each project completed, CTA comes closer to realizing its goal of providing high quality service for its customers. When one of the New Flyer buses stops to pick up customers, or a fully overhauled 2600-Series rail car pulls into a newly-rebuilt station, CTA customers experience the results of a vital capital program, experiencing first hand CTA’s mission of providing quality, affordable transit services that link people, jobs and communities.

President’s 2007-2011 Proposed Capital Improvement Program
90
Detail Capital Improvement Project Descriptions 021.803 Perform Bus Maintenance Activities Funding will provide labor and material to support the repair of buses. Maintenance costs will stabilize as more buses are cycled through the campaign based Overhaul Program. CTA has embarked on an aggressive Bus Maintenance Program to schedule replacement of parts nearing the end of their useful life before they fail. By investing in a program centered on the timely overhaul and replacement of buses CTA will improve the comfort, quality and reliability of its service while reducing operating expenses. As more buses are cycled through the program, unscheduled maintenance on buses will be significantly reduced. 021.806 Perform Mid-Life Bus Overhaul Funding will provide for the continuation of the Mid-Life Overhaul of CTA buses. Buses placed into service in 1999-2004 will be overhauled and returned to a state of good repair. CTA has embarked on an aggressive Overhaul Program to schedule replacement of parts nearing the end of their useful life before they fail. Most of this effort will center on the Mid-Life Overhaul of buses in their fifth to seventh year. This program will have many benefits. By investing in an Overhaul Program centered on the timely overhaul and replacement of buses, CTA will improve the comfort, quality, and reliability of its service while reducing operating expenses. As more buses are cycled through the Mid-Life Overhaul Program, unscheduled maintenance on buses will be significantly reduced. 022.903 Perform Rail Car Overhaul & Mid-Life Rehabilitation Funding will provide for an ongoing overhaul program. Maintenance costs will stabilize as more rail cars are cycled through the preventive maintenance program. The 2600 Series cars are scheduled for a “C” quarter life overhaul and the 3200 Series cars are projected to receive a “D” or midlife overhaul. Funding is provided for completion of the life extending overhaul program for the 2200 and 2400 series cars so that the service life of these cars can be extended for a period of five to nine years. CTA has embarked on an aggressive Rail Overhaul Program to schedule replacement of parts nearing the end of their useful life before they fail. Examples of items to be replaced are control groups, air conditioning units, and truck assemblies including traction motors, brake calipers, and axle assemblies. This effort will center on "C" level overhaul at 6 and 18 years, and a mid-life ("D" level) overhaul at 12 to 13 years. By performing these scheduled maintenance activities and replacing rail cars at the appropriate time, generally at 25 years of age, CTA will improve the comfort, quality, and service reliability of the rail cars while reducing operating maintenance costs. As more rail cars are cycled through the overhaul program, unscheduled maintenance will be significantly reduced.

President’s 2007-2011 Proposed Capital Improvement Program
91
022.906 Perform Rail Car Maintenance Activities Funding will provide for the ongoing repair of rail cars. Maintenance costs will stabilize as more rail cars are cycled through the preventive maintenance overhaul program. CTA has embarked on an aggressive rail preventative maintenance program to schedule replacement of parts nearing the end of their useful life before they fail. This effort will center on campaign based component replacement. By performing these maintenance activities and replacing rail cars at the appropriate time, generally at 25 years of age, CTA will improve the comfort, quality and service reliability of the rail cars while reducing operating maintenance costs. As more rail cars are cycled through the overhaul program, unscheduled maintenance will be significantly reduced. 031.054 Replace Buses Purchase and place into service fully accessible, air conditioned buses, including spare parts inventories. Flxible and TMC buses manufactured in 1991 are still in service and will be replaced. These buses have reached their industry standard retirement age of 12 years. Continued operation of these overage buses imposes unnecessarily high maintenance and operating costs on the CTA and reduces service reliability for our customers. All of the new buses will be air conditioned and fully accessible. 073.500 Improve Facilities - Systemwide Upgrade and improve facilities systemwide. This program will fund the rehabilitation of CTA facilities where building components have defects needing repair and requiring security enhancements. These facilities must be kept in a good state of repair in order to allow efficient performance of maintenance duties on CTA rolling stock and right-of-way, and to serve the needs of CTA's customers. This project also includes payments for the 567 W. Lake building, which replaced the Merchandise Mart as the Transit Authority's headquarters. A significant number of rail stations and bus turnarounds have not been improved or enhanced in many years and are in need of upgrades that will improve appearance and give customers a greater sense of security and confidence in using the system. Many roofs are nearing or are at the end of their service life and require replacement in order to avoid safety hazards and to prevent damage to building interiors and roof structures. Various escalators and elevators throughout the system are beyond their service life, require continual maintenance work, and need to be replaced. Other escalators and elevators are in poor condition and need to be rehabilitated.

President’s 2007-2011 Proposed Capital Improvement Program
92
121.500 Replace/Upgrade Power Distribution and Signals Replace and upgrade power distribution, substations and associated facilities. Replace and upgrade Loop signals and interlockings, various signal equipment systemwide and Blue Line signals including the Dearborn subway, the Congress branch, and a portion of the O'Hare branch. Replacement and upgrading of the signal and power distribution system must be accomplished in order to provide continued safe operation. Replacing this power distribution system will decrease the possibility of power shutdowns and service disruptions, and will eliminate slow zones. Antiquated substations facilities are susceptible to failure that results in a disruption in service. This project will also replace Loop signals and interlockings system, and signal equipment systemwide. The block signal equipment system in the Dearborn subway and the Congress branch is over 40 years old, and parts of the O'Hare branch are beyond their expected service life. Maintenance is difficult and increasingly expensive because of lack of spare parts. 132.056 Purchase Rail Cars Replace the 2200 and 2400 series rapid transit cars and purchase cars to meet expanded service needs. The replacement of the 2200 and 2400 Series rail cars are necessary due to the age and deteriorated condition of these cars. The 2200 Series rail cars have been in service for over 35 years, which is well beyond their 25-year design life, and the 2400 Series have been in service over 27 years. The deteriorated condition of these vehicles is evidenced in the form of increased service failures and longer repair, downtime which results in decreased availability for service. Replacement of these rail cars will provide the CTA with modern updated vehicles that will decrease maintenance and operating costs while enhancing customer comfort. The new cars will have sliding doors wide enough to accommodate wheelchairs. The number of cars to be purchased will be determined on the basis of bid prices for the rail car procurement and future schedule and maintenance requirements. 141.273 Reconstruct Rail Stations The scope of this project is to reconstruct several rail stations. Howard Station on the Red Line is continuing major reconstruction; this project includes rehabilitation of the bus terminal and parking lot. Funding is provided to continue construction of Washington Street Station connecting the State Street subway and the Dearborn subway. Wilson Station is also funded to complete design and for beginning of construction during the five year CIP. Howard and Wilson Stations were constructed in the late 1920's and have average weekday ridership entries of approximately 5,400 and 5,000 respectively. Due to the age, usage and structural condition of these stations, replacement or rehabilitation are required in order to maintain acceptable levels of service. This project also includes funding for the reconstruction of Washington Street Station and to support the multi-modal transportation station under construction at 108 North State Street. Upon completion, these stations will be fully ADA Compliant.

President’s 2007-2011 Proposed Capital Improvement Program
93
171.133 Repair Track and Structure Defects Correct deficiencies in CTA's extensive track system and structures through systematic inspection and rehabilitation or replacement of substandard structural elements. Defective track and structure must be repaired in order to maintain safe and reliable service. As elements are identified, requiring immediate repair or replacement, field forces are dispatched to the site to repair or replace the component. 181.500 Infrastructure Safety & Renewal Program Systematically replace ties and fasteners on the Brown (Ravenswood) Line, Red (North Main) Line, and State Street Subway, which need to be replaced. Additionally, this project will upgrade track components from Addison to O'Hare on the Blue Line and will renew rail, track, structure and related elements at locations to be determined by inspection. Some of the existing track components and ties, as well as many of the right-of-way elements are at least 30 years old and have exceeded their useful life and are in need of replacement. This continuing program replaces components and reduces the need to impose slow zones due to their deteriorating condition. When completed, train speed can be increased and reliability will be greatly improved. In addition, right-of-way improvements will provide greater access to maintenance personnel and as an emergency evacuation walkway for customers. 194.006 Alternatives Analyses – New Start Projects Provide for federal New Start Alternatives Analyses and for sub-regional service improvement studies. Alternatives Analyses will examine extending the Red Line from its existing south terminal at 95th Street to a new terminal at 130th Street to streamline bus-to-rail connections for 13 CTA bus routes, six Pace routes, and the South Shore commuter rail line; extending the Orange Line to Ford City to provide improved access to downtown from the far southwest side and from the central city to the strong employment corridor along South Cicero Avenue; and extending the Yellow Line to provide service to major destinations such as Old Orchard Mall, Cook County Courthouse, and adjacent office and retail developments. Expanding service would strengthen the reverse-commute flow along both the Yellow and Red Lines, and make better use of CTA's existing service capacity. The four sub-regional service improvement studies will focus on the far South Side and South Suburbs, Southwest Side and Southwest Suburbs, Northwest Side and Northwest Suburbs, and Central service area. These studies will serve as comprehensive, scientific studies including reviews of major traffic generators, other transit connections, and demographic and development patterns. The studies will examine all of the transit options available and a locally preferred alternative will be determined. These transit projects will help CTA continue to meet the dynamic needs of a growing and interdependent region.
President’s 2007-2011 Proposed Capital Improvement Program
94
194.007 Circle Line, Red, Orange & Yellow (ROY) Provide for the next New Start projects, expanding the existing CTA Rail System. The CTA serves Chicago and 40 suburbs. As the nation's second largest transit operator, the CTA provides nearly 1.6 million rides on an average weekday and over 80 percent of all transit trips in the six-county region. The proposed CTA rail expansion/extensions for FY 2007-2011 will enable the organization to link and expand rail services around Chicago and the surrounding suburban communities. Expansions include extending the Red Line from 95th Street station to 130th Street; extending the Orange Line from Midway Airport to Ford City Mall; and extending the Yellow Line from Skokie Station to Old Orchard Mall. Also proposed for New Start funding is the Circle Line, which will link CTA's rail lines to Metra rail lines. The expansions will enhance services that will link people, communities and neighborhoods to job areas within the Northeastern Illinois region. The Ogden Avenue Transitway project will extend from central Chicago to North Riverside Park shopping center, with an emphasis on local access. 194.115 Expand Capacity - Brown Line Expand the customer capacity of the Brown (Ravenswood) Line from Kimball Terminal to Tower 18 in the Loop. The elevated portion of the Ravenswood route was constructed between 1893 and 1910 from Belmont to Campbell, and extended at grade to its present terminal in the 1910's. It includes 19 stations, and serves approximately 66,000 customers each weekday. Ridership has increased 79% since 1983, and rush hour trains are crush-loaded. The line's market area continues to redevelop and potential customers are being discouraged from using the Brown Line due to crowded conditions. All other CTA lines operate eight-car trains, but the Brown Line is limited to six-car trains due to station platform length. Lengthening all platforms to accommodate eight-car trains and selected track, signal and yard improvements will substantially increase capacity of the line. Station alterations will provide ADA accessibility. 194.117 Rehabilitate Blue Line - Cermak Branch Provide for the reconstruction of the 54th/Cermak Branch from 54th/Cermak in Cicero through the incline connection to the Congress Branch. Rehabilitation of the 54th/Cermak Branch of the Blue Line was accomplished in three phases. Phase I replaced the deteriorated iron structure with concrete bents and cross girders. Stations were reconstructed as the track structure was being built. Six stations were replaced in coordination with bent replacement. Phase II of the project involved rehabilitating the existing structure, track and construction of column bases and foundations on the north section of the elevated structure from Loomis Incline to Wood Street. Phase III consisted of improvements to the ballasted section of the 54th/Cermak Branch from Kildare to 54th Avenue. Project completion was in January 2005. Although construction is complete, funding continues in 2007 to complete federal obligations as outlined in the New Start Full Funding Grant Agreement.

President’s 2007-2011 Proposed Capital Improvement Program
95
308.002 Bond Repayment, Interest Costs, & Finance Costs Provide for debt service and the cost of issuance of bonds, notes and other indebtedness incurred by CTA. This project is funded with federal formula funds and non-federal match. This element will provide for interest costs associated with financing the Bond series issued in 2004. Additional bonds have been authorized to be issued in subsequent years. These bonds are anticipated to support construction of Howard Station, purchase of fareboxes, purchase of replacement rail cars, purchase of replacement buses, and various capital improvement projects. These transit projects will help CTA continue to meet the dynamic needs of a growing and interdependent region.

Professional
Appendices
We will provide transit servicewith the highest standards ofquality and safety for ourcustomers and ourselves.

Appendices
Table of Contents
Section 1 History of the Agency ……………………………………...………
96
Section 2 Transit Facts ………………………………………………..……….
99
Section 3 A. Moving Beyond Congestion…………………………………... B. Why Fund Transit? ……………………………………………...
100 101
Section 4 Operating Funding Summary …………………………………….
105
Section 5 Debt Administration ………………………………………….…….
111
Section 6 Annual Budget Process …………………………………………...
116
Section 7 Accounting System and Financial Controls ……….................
119
Section 8 Financial Policy……..……………………………………………….
123
Section 9 Economic Indicators…………..……………………………………
126
Section 10 Operating Statistics – System ……………………………………
128
Section 11 Operating Statistics – Bus ………………………………………..
129
Section 12 Operating Statistics – Heavy Rail ……………………………..…
130
Section 13 Operating Statistics – Paratransit ……………………...………..
131
Section 14 Comparative Ridership Reporting ……………………...……….
132
Section 15 Comparative Performance Analysis – Bus …………………....
133
Section 16 Comparative Performance Analysis – Rail ……….………...….
134
Section 17 CTA Fare Structure ………………………………….…….…….....
135
Section 18 Comparative Fare Structure ………………………………..…….
136
Section 19 Financial Data .……………………………………..……………….
137
Section 20 Acronyms ….…………………………………………….………….. 138
Section 21 Glossary ………………………………………………….………….. 139

1 History of the Agency
96
1922
1911
The Chicago and South Side Rapid Transit Company opened on June 6, bringing elevated train service to Chicago.
At the turn of the century, four separate transit railroads operated in Chicago. The first trains, powered by steam, were quickly converted to electricity.
1892
1882
1859
The beginning of public transit in Chicago; early service was horse-drawn.
The Chicago City Railway obtained rights to operate San Francisco-style cable cars.
Elevated trains were built along available right-of-ways often above alleys and less heavily used streets. The Loop ‘L’ opened connecting rapid transit lines serving the north, south and west sides of Chicago.
The rapid transit companies formed a cost-saving trust.
On February 1, five streetcar companies united under a single management: the Chicago Surface Lines. At its peak, the Chicago Surface Lines operated along 1,100 miles of tracks; it was the largest and most heavily used streetcar system in the world.
Buses were first used in Chicago with the creation of the Chicago Motor Bus Company. Bus use was limited to Chicago’s boulevards and parks.
1897
1914
1917
The Chicago Motor Coach Company succeeded the Chicago Motor Bus Company.
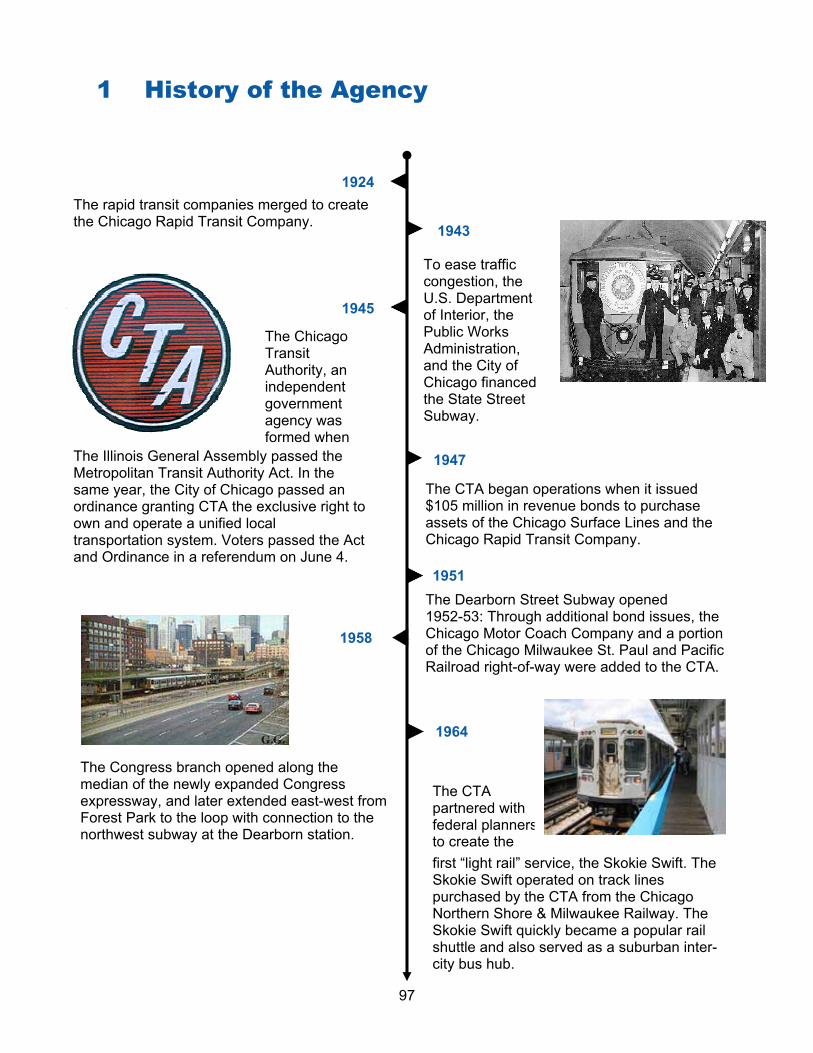
1 History of the Agency
97
The CTA partnered with federal planners to create the first “light rail” service, the Skokie Swift. The Skokie Swift operated on track lines purchased by the CTA from the Chicago Northern Shore & Milwaukee Railway. The Skokie Swift quickly became a popular rail shuttle and also served as a suburban inter-city bus hub.
1964
1958
1947
The Chicago Transit Authority, an independent government agency was formed when
The Illinois General Assembly passed the Metropolitan Transit Authority Act. In the same year, the City of Chicago passed an ordinance granting CTA the exclusive right to own and operate a unified local transportation system. Voters passed the Act and Ordinance in a referendum on June 4.
1945
To ease traffic congestion, the U.S. Department of Interior, the Public Works Administration, and the City of Chicago financed the State Street Subway.
1943
1924The rapid transit companies merged to create the Chicago Rapid Transit Company.
The CTA began operations when it issued $105 million in revenue bonds to purchase assets of the Chicago Surface Lines and the Chicago Rapid Transit Company.
1951The Dearborn Street Subway opened 1952-53: Through additional bond issues, the Chicago Motor Coach Company and a portion of the Chicago Milwaukee St. Paul and Pacific Railroad right-of-way were added to the CTA.
The Congress branch opened along the median of the newly expanded Congress expressway, and later extended east-west from Forest Park to the loop with connection to the northwest subway at the Dearborn station.

1 History of the Agency
98
2006
1996
1993
The CTA responded to changing demographics during the 1970s by expanding the northwest subway from Logan Square to Jefferson Park, and then along the Kennedy Expressway median to River (Mannheim) Road. Finally, the northwest transit extension was completed at O’Hare airport with a station within the airport terminal.
1984
1974
By the early ‘70s the popularity of car travel and declining ridership3 levels threatened the fiscal stability of the three public transportation agencies. The Illinois General Assembly then created the Regional Transportation Authority (RTA) as a fiscal and policy oversight agency committed to providing an efficient and effective public transportation system. Today, the RTA continues to provide annual fiscal oversight to CTA, Metra and Pace.
The Dan Ryan branch, formerly linked to the Englewood and Jackson Park Lines was linked with the Howard Line. The Lake to Englewood-Jackson Park lines were moved from the Howard branch to the loop elevated connection. Also, elevated loop connections were made more convenient with the Merchandise Mart station. The Midway “Orange” line was completed, linking the downtown elevated Loop to the Southwest side airport and providing improved transportation to the area.
CTA introduced the new Pink Line as part of a package of bus & rail service improvements for the West Side and Western suburbs. The Pink Line provides more frequent service and improved travel times between the 54th/Cermak station and the Loop. CTA introduced new and improved bus service with 2 new local bus routes, 3 new express routes and 8 enhanced bus routes.
The CTA celebrated the re-opening of the rehabilitated Green Line, improving the service to customers on the West and South sides of Chicago.

2 Transit Facts
99
Creation of CTA • The CTA was created by state legislation and began operating on October 1, 1947, after
acquiring the properties of the Chicago Rapid Transit Company and the Chicago Surface Lines. On October 1, 1952, the CTA became the sole operator of City of Chicago transit when it purchased the Chicago Motor Coach System.
CTA Governance • The CTA’s governing arm is the Chicago Transit Board, which consists of seven members.
The Mayor of Chicago appoints four board members, subject to the approval by the City Council and the Governor. The Governor, subject to the approval of the State Senate and the Mayor of Chicago, appoints three board members.
• In 1974, the Regional Transportation Authority (RTA) was created by state legislation. The
RTA serves as CTA’s fiscal oversight agency. Service Area & Population • 220 square miles of Chicago and 40 nearby suburbs • The service area has 3.8 million people Ridership • Over 497 million trips projected for 2006 and more than 505 million trips projected for 2007 • Approximately 1.6 million trips per weekday Bus Service • 2,106 buses travel 154 routes • Routes cover 2,529 miles, with approximately 11,846 bus stops Rail Service • 1,190 rail cars travel over eight routes • CTA Rail serves 288 miles of track, including yard track Paratransit Service • CTA transferred all paratransit service to Pace in July 2006 • Paratransit service was contracted out to three carriers and taxicab companies to provide
door-to-door service for riders with disabilities • CTA provided 1.2 million paratransit trips during the first six months of 2006

3A Moving Beyond Congestion - RTA Transit Strategic Planning / Funding Initiative
100
Northeastern Illinois is at a crossroads. Congestion is a severe threat to the region’s economy and quality of life for its residents. In recognition of this issue, the Regional Transportation Authority, Chicago Transit Authority, Metra and Pace partnered to launch the Moving Beyond Congestion Project (MBC) on July 25, 2006. MBC is a comprehensive regional planning effort emphasizing the crucial role of transit in the region’s transportation network. Through MBC, the Service Boards and RTA will engage various transit stakeholders in our region. As of this writing, MBC has attracted more than 230 Partners for Transit, including community organizations, businesses, labor unions and representatives of state, regional and local governments.
While public transportation is a proven solution to congestion, regional funding has not kept pace with demand or been properly adjusted to reflect current cost pressures. Total RTA system ridership has grown from 529 million unlinked trips in 1997 to 570 million unlinked trips in 2005, while fuel, labor and other expenses have risen significantly. In order to meet both demand and higher costs, the Service Boards had to utilize $102 million from their capital budgets to fund day-to-day operations in 2006. The result is less investment in our infrastructure to support projected ridership growth. Operating costs are already rising due to deferred maintenance and the transit system is at risk of suffering from reliability problems in the future. Increased transit funding is the only option that represents a sustainable solution to the chronic problem of underinvestment in Northeastern Illinois’ transit network. Initial steps in the strategic planning process
include assessing the current system, analyzing scenarios and determining the resources required to upgrade the system. When completed, MBC will provide a long-term strategic plan for transit in Northeastern Illinois. More importantly, the program will allow stakeholders to articulate a shared vision for the region’s future. What Are the Options? There is more than one way address the chronic operating budget shortfalls faced by CTA, Metra and Pace, but we must live with the consequences of our actions. Action Consequences Increase funding. • Reduced congestion and higher productivity.
• Livable communities, improved air quality and better mobility. Reduce service and raise fares.
• Increased congestion and decreased productivity. • Decreased mobility for Northeastern Illinois’ most vulnerable residents.
Utilize capital funds for operations.
• Increased operating expenses and less service reliability. • A shrinking transit system.
Program Purpose The MBC vision and goals are based on the practical needs of those living in Northeastern Illinois. The vision may evolve further based on public feedback. Vision A world-class public transportation system that is convenient, affordable, reliable and safe, and that is the keystone of the region's growing business opportunities, thriving job market, clean air and livable communities. Goals 1. Provide Transportation Options 2. Ensure Financial Viability 3. Enhance Livability and Economic Vitality 4. Demonstrate Value

3B Why Fund Transit?
101
“Our nation has entered a new era in the history of transportation, an era in which one of our most cherished freedoms – the basic freedom of mobility – has been challenged.”
Norman Y. Mineta, Former Secretary U.S. Department of Transportation Metro Magazine, November-December 2001
During the one-hour morning peak, CTA carries approximately 73 percent of commuters traveling along the North Lake Shore Corridor.
As the RTA, CTA, Metra and Pace engage regional stakeholders through the Moving Beyond Congestion Program, it is important to recognize the benefits of transit. Public transportation is critical to guaranteeing mobility for all citizens, reducing congestion, improving public health and ensuring that Chicago area residents can live, work and play in safe and secure communities. The need for public transportation is greater than ever as the Chicago region continues to grow. However our current situation, in which transit is under-funded and congestion and air pollution are persistent problems, is not sustainable. The Importance of Mobility Mobility is crucial. The ability to get from “point A” to “point B” is a key factor in access to employment, medical care and other life essentials. While two-thirds of CTA riders use public
transportation by choice, we must recognize that many in the Chicago area either cannot afford to own a private vehicle or are unable to operate one. According to the Bureau of Labor Statistics, the average Chicago household spends more
than $7,500 per year to own and maintain a vehicle. That is a difficult burden for more than 950 thousand people in the RTA service area, 81 percent of whom reside in Cook County, that are living below the poverty level. In addition, driving can become more difficult as people age, making alternate forms of transportation essential. A lack of transportation options can lead to isolation, health problems and generally detracts from the quality of life. For example, over 50 percent of senior citizens that don’t drive report staying home on a given day partially because of a lack of transportation. In comparison to senior citizens that drive, non-drivers over 65 make:
• 15 percent fewer trips to the doctor. • 59 percent fewer shopping trips and restaurant visits. • 65 percent fewer trips for social, family and religious activities.
Providing on-time, safe and convenient public transportation ensures that members of the 28.8 percent of Chicago households that do not have an automobile can continue to reach jobs, utilize healthcare services and travel to other destinations in order to live full and productive lives. The Cost of Congestion Funding public transportation improves mobility for all citizens, but it also provides the best alternative to congested roadways. Roadways in large urban communities are subject to congestion during seven hours of every day and on average commuters waste eight full working days annually due to traffic delays. Congestion costs the Chicago region $4.2 billion dollars and the average driver almost $1,000 per year.

3B Why Fund Transit?
102
Travel Delays and the Cost of Congestion
$0
$2,000
$4,000
$6,000
$8,000
$10,000
$12,000
NationalAverage - Very
Large Areas
Los Angeles-Long Beach-
Santa Ana, CA
New York-Newark, NY-NJ,
CT
Chicago, IL-IN San Fransisco-Oakland, CA
Boston, MA-NH-RI
Source: Texas Transportation Institute 2005 Urban Mobility Report
Con
gest
ion
Cos
t
-
100
200
300
400
500
600
700
Travel Delays (H
ours)
Congestion Cost ($ million) Travel Delays (000,000 hours)
Percentage of Emissions Generated by Public Transportation vs. Private Vehicles
P ublic transit is estimated to be more than twice as efficient as private cars and nearly three times more efficient than SUVs and light trucks per
passenger mile traveled.
100% 100% 100% 100%
8%
55%52%
5%
0%
20%
40%
60%
80%
100%
120%
VOCs CO NOX CO2
Source: Conserving Energy and Preserving the Environment: The Role of Public Transportation
% Private Vehicles % Public Transit
It is no surprise that public transportation benefits transit riders by helping them avoid congestion and reduce personal transportation expenses. However, public transit also reduces traffic for drivers using congested corridors and surrounding roads. For example, a CTA bus can remove up to 90 cars and a CTA train can remove up to 1,000 vehicles from congested roadways. By reducing congestion, the entire RTA system currently saves the region $1.6 billion annually.
These benefits could only be increased with additional funding and public policies geared towards encouraging public transit use. According to the National Cooperative Highway Research Program, a 10 percent reduction in area roadway congestion would result in approximately $1.2 billion in higher business productivity. The Importance of a Clean Environment Beyond the economic costs of congestion, crowded roadways result in higher pollution levels and health problems. According to the American Public Transportation Association, “Over 140 million Americans, 25 percent of whom have children, live, work and play in areas where air quality does not meet national standards.” This includes residents of Northeastern Illinois, which is currently classified as a moderate non-attainment area for ozone (smog) and a non-attainment area for fine particulate matter (soot). Harmful emissions from motor vehicles can account for up to 51 percent of air pollutants in non-attainment areas. In fact, mobility and travel accounts for more pollution than any other activity, including industrial production. Public transportation generates substantially less pollution than traveling by car, sport utility vehicle or light truck. For example, transit produces 45% less carbon dioxide (CO2), a greenhouse gas, than traveling by private vehicle. Reducing green house gas emissions can lessen the projected effects of climate change, which include more extreme heat waves

3B Why Fund Transit?
103
Illinois emits 224.7 million metric tons of greenhouse gases annually; these emissions are exceeded by only five other U.S. states.
CTA Bus Fleet Emissions and Vehicle Count
0
500
1000
1500
2000
2500
1999 2000 2001 2002 2003 2004 2005 2006(Estimated)
Number of Buses Total Emissions (Tons)
and diminished air quality. This makes public transportation essential to Illinois, where 37 percent of carbon dioxide output comes from the oil consumed by cars and trucks. CTA is always in search of opportunities to further reduce the environmental impact of transit in Chicago and therefore has taken a number of proactive steps that exceed federal requirements to reduce fleet engine emissions. As a
result, CTA bus fleet emissions have decreased by 28.1 percent since 1999, even as the bus fleet has grown by 11.3 percent. The travel options we chose do not just affect the environment on a global level. Both drivers and non-drivers suffer the consequences of air pollution. Carbon monoxide (CO), for example, is a poisonous gas that hinders the body’s ability to carry oxygen and can interfere with learning. Volatile organic compounds (VOCs) and nitrogen oxides (NOx) combine with sunlight to create the smog that can exacerbate respiratory illnesses and damage lung tissues. The effects of pollution on Chicago area residents are clear. The asthma hospitalization rate in Chicago is almost twice the national average, and rates are even higher in the City’s most congested areas. The Safety and Security of Our Communities A strong public transportation infrastructure is essential to responding to both community emergencies and national disasters. On September 11, 2001, public transportation helped safely transport citizens from New York City, Washington, D.C. and the center of other cities that were evacuated in response to terrorist attacks on American soil, while also bringing first responders and essential equipment to disaster sites. More recently, public transportation has been used to respond to natural disasters. CTA provided transportation assistance to Hurricane Katrina victims evacuated to the City of Chicago from New Orleans and Mississippi in 2005. CTA routinely provides warming and cooling buses for the safety of area residents who, due to fires and other emergencies, need shelter from extreme temperatures. Public transit is also critical to America’s efforts to move towards energy independence. At current ridership levels, public transportation saves the equivalent of 46.7 million barrels of oil per year. If Americans begin using public transportation for only seven percent of their daily travel needs, the United States could cut its oil imports from Saudi Arabia by roughly 50 percent.

3B Why Fund Transit?
104
The Bottom Line Building our way out of congestion is not an option. The Chicago region is served by more interstate highways than any other metropolitan area in the United States, yet according to the Texas Transportation Institute Travel Time Index, it is the second most congested in the country. Adding more highway capacity does not address the mobility issues faced by residents without access to a private vehicle and evidence suggests that highway expansion induces increased traffic, worsening air pollution levels. Increased emphasis on public transit gives us another option. Investing in public transportation and encouraging its use can increase mobility of Chicago area residents while reducing air pollution and supporting healthy and economically viable communities. More funding and an increased emphasis on the use of public transportation is the key to strengthening Chicagoland communities.
The Benefits of Public Transportation For the World
Reduced Effects of Climate Change
Transit generates almost half the CO2 emissions per passenger mile as traveling by private vehicle.
For the Nation Reduced Dependence on Foreign Oil
At current ridership levels, public transportation saves the equivalent of one month’s oil imports from Saudi Arabia.
For Chicagoland Reduced Congestion
CTA, Metra and Pace save more than 94 million hours in congestion delays annually.
For You Reduced Personal Expenses
Individuals can save almost 40 percent on the cost of transit cards by participating in the RTA/CTA Transit Benefit Program.

4 Operating Funding Summary
105
CTA’s total estimated revenue for 2007 is $1.133 billion. There are two major categories of operating revenue for CTA: system-generated revenue through fares and other sources and public funding through the Regional Transportation Authority (RTA). System-generated revenue is projected at $552.7 million for 2007 and public funding need is projected at $580.5 million. The following table represents 2007 estimated revenue by source.
Total CTA Revenue - All sources (in thousands) 2007Fares and Passes 468,334$ Reduced Fare Subsidy 32,000 Advertising, Charter and Concessions 24,990 Investment Income 12,120 Statutory Required Contributions 5,000 All Other Revenue 10,250 Public Funding through RTA 470,349 New Transit Funding 110,108
Total Revenue 1,133,151$
CTA 2007 Operating Revenue Forecast
All Other Revenue0.9%
Advertising, Charter & Concessions
2.2%
Statutory Required Contribution
0.4%
Investment Income1.1%
Reduced Fare Subsidy
2.8%
Fares & Passes41.3%
New Transit Funding9.7%
Public Funding41.5%
The following is a description of sources of both system-generated revenues and public funding for CTA.

4 Operating Funding Summary
106
SYSTEM-GENERATED REVENUE CTA’s system-generated revenue is forecast at $552.7 million for 2007. CTA’s system-generated revenue is based on sale of fares and passes, advertising, investment income, statutory required contribution from local governments by provision of the Regional Transportation Authority Act, and subsidies for reduced fare riders per 1989 legislation. Fares and Passes Revenue from fares and passes is forecast at $468.3 million in 2007 is the largest portion of system-generated revenue. CTA’s revenue from fare and passes includes cash fares, full fare and reduced fare farecards, and Chicago Card and Chicago Card Plus fares. In addition, CTA also sells 30-day full-fare and reduced fare passes, along with 7-day passes and 1-day passes. Additional pass revenue is from CTA’s U-Pass for local university students, sale of visitor passes, and METRA link-up passenger revenue. Reduced Fare Subsidy (RFS) This funding represents reimbursement of revenues lost by the service boards due to providing reduced fares to student, elderly and disabled riders, as mandated by State law. The funding is subject to the terms of the grant agreement, state statute (20 ILCS 2705) and annual state appropriation. Reimbursement amounts are allocated to the service boards based on reduced fare passenger trips taken during the grant year. Reduced fare subsidy is forecast at $32.0 million in 2007. Advertising, Charter and Concessions Under Advertising, Charter and Concessions is revenue from Special Contract Guarantees, which are agreements for additional transportation service with the University of Chicago and the Chicago Cubs. Vehicle and platform ads is the primary source of this revenue with revenue forecast at $20.4 million for 2007 for advertisement on buses, rail cars, and rail stations.
Concession revenue is generated from 76 concessions within CTA’s 144 rail stations. Concessions are forecast to generate $1.4 million in 2007. Billboards on CTA property generate an additional $1.4 million, while pay phones and vending machines at CTA facilities generate nearly $0.5 million annually.
Advertising, Charter & Budget Concessions Revenue (000's) 2007 Special Contract Guarantees 1,300$ Vehicle & Platform Ads 20,400 Bill Boards 1,400 Pay Phones 130 Concessions 1,400 Vending machines 360
Total 24,990$

4 Operating Funding Summary
107
Investment Income CTA’s interest income is earned from cash balances. CTA anticipates investment income at $12.1 million for 2007. This compares to investment income of $3.0 million in 2003 and $3.1 million in 2004 due increases in short-term interest rates. Federal Funds rates have increased from a low of 1.00 percent in June of 2003 to 5.25 percent as of June 29, 2006. Statutory Required Contributions The RTA Act requires the City of Chicago and County of Cook to annually contribute $3.0 million and $2.0 million, respectively, towards CTA operations annually. All Other Revenue Revenues in this category include operating grants from the Federal Transit Administration (FTA), parking charges, rental revenue, third-party contractor reimbursements and filming fees. CTA’s rental revenue is from lease of CTA property, including 55 storefronts adjacent to CTA rail stations.
CTA’s parking revenue is forecast at $2.2 million for 2007. This is more than double 2004 revenue of $949,000 due to the increase in parking fees in 2005 to $2.00 from $1.50 and $1.75, the addition of new Park and Rides lots off of the O’Hare Blue line at Harlem and Green Line at the Garfield station and expanded under the ‘L parking agreements across the city. The CTA currently has 18
Park & Ride lots with a total of 6,289 parking spaces. In addition, CTA began a pilot project in 2006 allowing customers to buy permits at the busiest parking lots at $43.00 per month, which is expected to generate an additional $50,000 in revenue.
CTA All Other RevenueTotal 2007 (000's)=$10,240
Student Permit Revenue
4%
Grant non-Capital
Revenue 40%
Sale of Scrap Material
5% Miscellaneous Revenues
10%
Parking Lot Revenue-Rail
21%
Rentals20%
Statutory Required Contributions (000's)
2007
Contributions - City of Chicago 3,000$ Contributions -Cook County 2,000
Total 5,000$
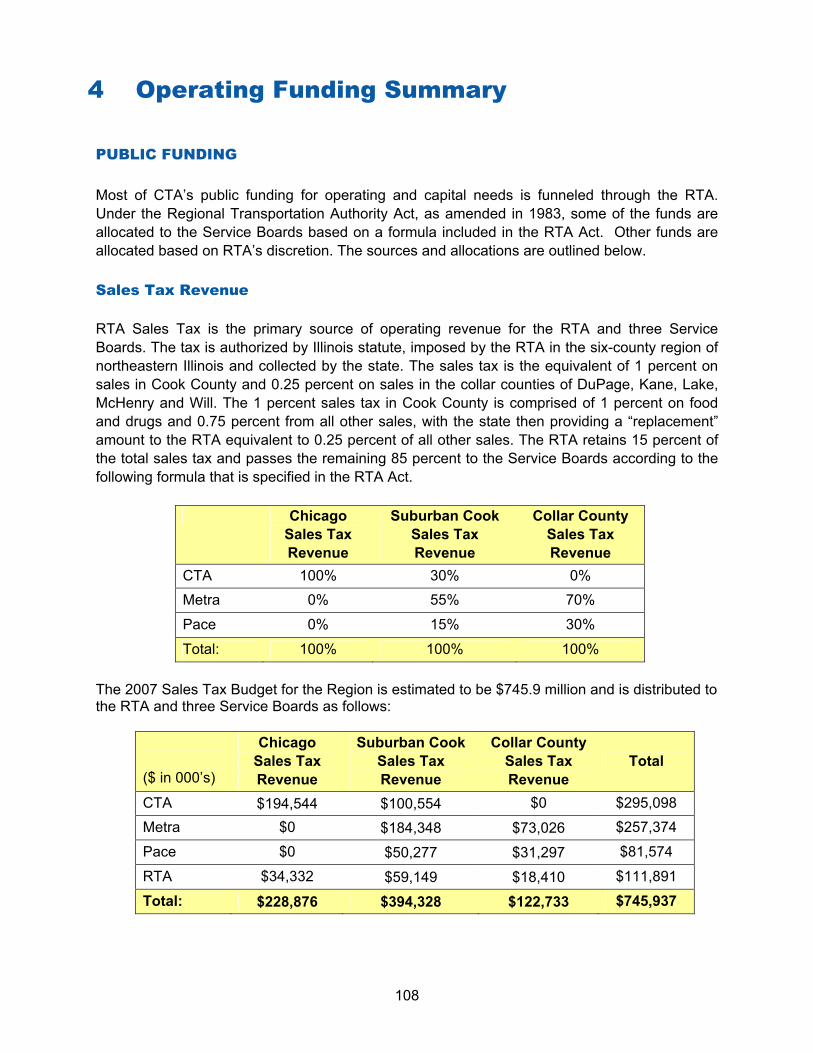
4 Operating Funding Summary
108
PUBLIC FUNDING Most of CTA’s public funding for operating and capital needs is funneled through the RTA. Under the Regional Transportation Authority Act, as amended in 1983, some of the funds are allocated to the Service Boards based on a formula included in the RTA Act. Other funds are allocated based on RTA’s discretion. The sources and allocations are outlined below. Sales Tax Revenue RTA Sales Tax is the primary source of operating revenue for the RTA and three Service Boards. The tax is authorized by Illinois statute, imposed by the RTA in the six-county region of northeastern Illinois and collected by the state. The sales tax is the equivalent of 1 percent on sales in Cook County and 0.25 percent on sales in the collar counties of DuPage, Kane, Lake, McHenry and Will. The 1 percent sales tax in Cook County is comprised of 1 percent on food and drugs and 0.75 percent from all other sales, with the state then providing a “replacement” amount to the RTA equivalent to 0.25 percent of all other sales. The RTA retains 15 percent of the total sales tax and passes the remaining 85 percent to the Service Boards according to the following formula that is specified in the RTA Act.
Chicago Sales Tax Revenue
Suburban Cook Sales Tax Revenue
Collar County Sales Tax Revenue
CTA 100% 30% 0% Metra 0% 55% 70%
Pace 0% 15% 30%
Total: 100% 100% 100% The 2007 Sales Tax Budget for the Region is estimated to be $745.9 million and is distributed to the RTA and three Service Boards as follows:
($ in 000’s)
Chicago Sales Tax Revenue
Suburban Cook Sales Tax Revenue
Collar County Sales Tax Revenue
Total
CTA $194,544 $100,554 $0 $295,098 Metra $0 $184,348 $73,026 $257,374
Pace $0 $50,277 $31,297 $81,574
RTA $34,332 $59,149 $18,410 $111,891
Total: $228,876 $394,328 $122,733 $745,937

4 Operating Funding Summary
109
In addition, RTA may distribute at its discretion any funds remaining from the initial allocation of the 15 percent sales tax distribution that is in excess of RTA’s funding needs. Federal Assistance (Federal Transit Administration) RTA is the region's recipient of federal assistance, which previously included both operating and capital funds. FTA eliminated operating assistance to CTA in 1998.
Public Transportation Funds As authorized by the RTA Act, the Illinois State Treasurer transfers from the State General Revenue Fund an amount equal to 25 percent of RTA sales tax collections (or gasoline or parking taxes, if imposed by the RTA). The Treasurer transfers this amount to a special fund, called the “Public Transportation Fund” (PTF), and then remits it to the RTA on a monthly basis. Remittance requires an annual appropriation made by the State of Illinois. In addition, the RTA must certify to the Governor, State Comptroller and Mayor of the City of Chicago that the RTA has adopted a budget and financial plan in conformance with the requirements of the RTA Act. The RTA uses these funds at its discretion to fund the service board needs, RTA operations, debt service and capital investment. RTA's 2007 Budget includes $186.5 million in PTF funds. State Assistance The RTA Act provides supplemental State funding in the forms of additional state assistance and additional financial assistance (collectively, “State Assistance”) to the RTA in connection with its issuance of Strategic Capital Improvement Program (SCIP) bonds. The funding equals debt service amounts paid to bondholders of the Strategic Capital Improvement Bonds issued by RTA, plus any debt service savings from the issuance of refunding or advanced refunding SCIP bonds, less the amount of interest earned by the RTA on the proceeds of SCIP bonds. The RTA Act limits the amount of State Assistance available to the RTA to the lessor of the debt service or $55.0 million. Remittance requires an annual appropriation made by the State of Illinois. IDOT Grant The FY 2006 state budget provided $54.3 million from the state's General Revenue Fund to the Illinois Department of Transportation (IDOT). IDOT provided a grant to the RTA for $54.3 million "for the funding of the Americans with Disabilities Act of 1990 (ADA) paratransit services and for other costs and services." In 2005, RTA appropriated the full amount of this grant to CTA. In 2006, RTA appropriated half of this grant to CTA amounting to $27.1 million and the remaining grant amount to Pace. In July 2006, CTA transferred Paratransit services to Pace. Therefore, in 2007, CTA will not receive the IDOT grant.

4 Operating Funding Summary
110
New Transit Funding In order to help move the region beyond congestion, additional funding is needed to prevent further service cuts, fare increases, or the additional diversion of capital funds to balance the operating budget. CTA requires $110.1 million in additional public funding from RTA to support operations and the state-mandated pension contributions. Operating Funding Allocation (Based on 2006 Budget, $ in 000’s)
Note: In 2007, CTA will not receive the IDOT grant.
5 Debt Administration
111
DEBT MANAGEMENT POLICY GUIDELINES On October 14, 2004, the Chicago Transit Board approved an ordinance adopting Debt Management Policy Guidelines (the “Debt Policy”). The Debt Policy serves as a management tool to ensure that the CTA a) identifies transactions that utilize debt in the most efficient manner; and b) provides for full and timely repayment of all borrowings. Additionally, the Debt Policy outlines a means of a) achieving the lowest possible cost of capital within prudent risk parameters; and b) ensuring ongoing access to the capital markets. The Debt Policy applies to all short and long term bonds and notes, other long-term lease obligations, and interest rate exchanges. The Debt Policy does not cover commodity hedging, leveraged leases, long-term operating leases, short-term leases and bank obligation transactions. The general debt issuance guidelines outlined in the Debt Policy are summarized below. Use of Debt It is CTA’s preference to use a pay-as-you-go funding mechanism for all capital projects. As such, CTA explores use of available cash to fund all or part of a particular capital improvement project and other long-term financial needs before proposing the use of leverage. However, the CTA recognizes that the size, scope and timing of particular projects in its capital improvement plan, cash flow sufficiency and capital market opportunities may necessitate the use of debt. The Debt Policy allows for the issuance of either long-term or short-term debt. The financing purpose would determine the type of debt the CTA would use. • Short-Term Debt Obligations: Short-term debt may be used by the CTA as a cash
management tool to provide interim financing or to bridge temporary cash flow deficits within a fiscal year. Currently, the CTA has no outstanding short-term debt obligations.
• Long-Term Debt Obligations: The Debt Policy prohibits the use of long-term debt to fund
operations. However, long-term bonds are deemed appropriate to finance essential capital activities and certain management initiatives. The CTA may also use long-term lease obligations to finance or refinance capital equipment. Prior to entering into any lease financing, the Authority will evaluate 1) the useful life of assets financed, 2) terms and conditions of the lease and 3) budgetary, debt capacity and tax implications.
Credit Ratings The Debt Policy recognizes the need for a credit rating strategy focused on achieving the best economic value for CTA. A major goal of CTA’s debt program is to attain a proper balance between minimizing borrowing costs and maximizing financial flexibility. Currently, CTA’s outstanding bond issues are assigned an A2 credit rating from Moody’s Investor Services. Debt Limitations Attaining a proper balance between minimizing borrowing and maximizing financial flexibility is a key goal of the CTA debt program. The CTA is not subject to statutory debt limitations for capital investment. However, the Debt Policy does limit the aggregate amount of CTA’s unhedged variable rate debt at a maximum of 20% of all outstanding long-term debt obligations.

5 Debt Administration
112
Other Provisions CTA may secure credit enhancement in the form of municipal bond insurance or a letter / line of credit for all or a portion of each bond issue. The Debt Policy also allows the Authority to issue debt on a taxable or tax-exempt basis and to use interest rate exchange agreements when they will 1) reduce the expected interest rate costs, 2) hedge fluctuations in interest rates or 3) gain efficiency in structuring and restructuring debt. CURRENT DEBT Long-term debt includes capital lease obligations and bonds payable, as described below: Lease/Leaseback Agreements
The CTA has entered into several economically defeased lease and leaseback agreements in fiscal years 1995 through 2003. These agreements were entered into with various third parties and pertain to certain assets of the CTA, including rail lines and equipment, rail cars, facilities, buses and qualified technology equipment. Under the lease/leaseback financings, the CTA entered into a long-term lease for applicable assets with trusts established by equity investors which trusts concurrently leased the respective assets back to CTA under sublease agreements. Each sublease contains a fixed date and a fixed price purchase option that allows the CTA, at its option, to purchase the assets back from the lessor. As of December 31, 2005, the total obligations due under the lease agreements which have been economically defeased were approximately $1.7 billion. Other Capital Leases On March 31, 2003, the Public Building Commission of Chicago (the “PBC”) issued $119,020,000 of Building Revenue Bonds, Series 2003 (Chicago Transit Authority) (the “PBC Bonds”). The interest on the PBC Bonds is 5.00% - 5.25%. The PBC used the proceeds of these bonds, among other things, to acquire the site for and construct a 12-story office building, which the PBC leased to the CTA for a 20-year term to be used as its headquarters. Rent payments due to the PBC from the CTA under the lease are general obligations of the CTA payable from any lawfully available funds. Upon satisfaction of all of the obligations of the CTA under the lease and payment, or provision for payment, of the PBC Bonds in full, the PBC will transfer title of the leased premises to the CTA. CTA is obligated to pay to the Trustee on behalf of the PBC on or before February 15 of each year in which the headquarters lease is in effect, rent which equals the debt service on the PBC bonds due through and including September 1 of that calendar year. The source of funds for PBC lease payments is primarily FTA grant funds. The total rent due to PBC over the life of the lease is $195,948,208.
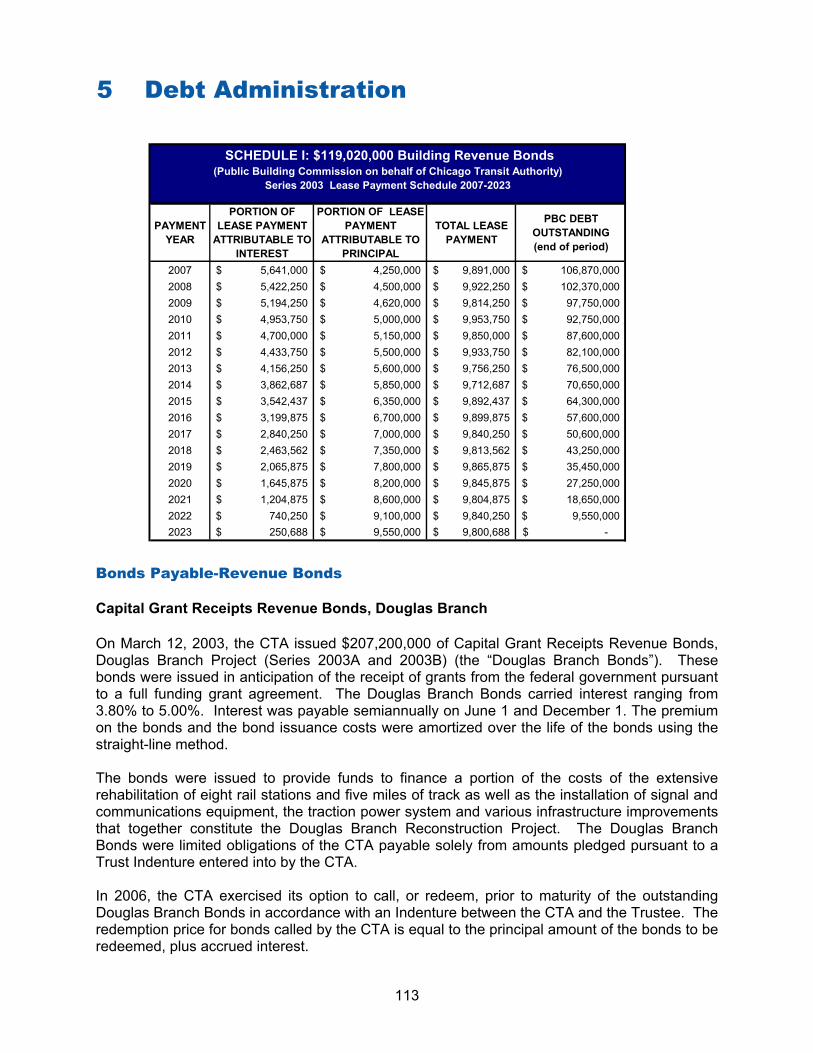
5 Debt Administration
113
PAYMENT YEAR
PORTION OF LEASE PAYMENT
ATTRIBUTABLE TO INTEREST
PORTION OF LEASE PAYMENT
ATTRIBUTABLE TO PRINCIPAL
TOTAL LEASE PAYMENT
PBC DEBT OUTSTANDING (end of period)
2007 5,641,000$ 4,250,000$ 9,891,000$ 106,870,000$ 2008 5,422,250$ 4,500,000$ 9,922,250$ 102,370,000$ 2009 5,194,250$ 4,620,000$ 9,814,250$ 97,750,000$ 2010 4,953,750$ 5,000,000$ 9,953,750$ 92,750,000$ 2011 4,700,000$ 5,150,000$ 9,850,000$ 87,600,000$ 2012 4,433,750$ 5,500,000$ 9,933,750$ 82,100,000$ 2013 4,156,250$ 5,600,000$ 9,756,250$ 76,500,000$ 2014 3,862,687$ 5,850,000$ 9,712,687$ 70,650,000$ 2015 3,542,437$ 6,350,000$ 9,892,437$ 64,300,000$ 2016 3,199,875$ 6,700,000$ 9,899,875$ 57,600,000$ 2017 2,840,250$ 7,000,000$ 9,840,250$ 50,600,000$ 2018 2,463,562$ 7,350,000$ 9,813,562$ 43,250,000$ 2019 2,065,875$ 7,800,000$ 9,865,875$ 35,450,000$ 2020 1,645,875$ 8,200,000$ 9,845,875$ 27,250,000$ 2021 1,204,875$ 8,600,000$ 9,804,875$ 18,650,000$ 2022 740,250$ 9,100,000$ 9,840,250$ 9,550,000$ 2023 250,688$ 9,550,000$ 9,800,688$ -$
SCHEDULE I: $119,020,000 Building Revenue Bonds (Public Building Commission on behalf of Chicago Transit Authority)
Series 2003 Lease Payment Schedule 2007-2023
Bonds Payable-Revenue Bonds Capital Grant Receipts Revenue Bonds, Douglas Branch On March 12, 2003, the CTA issued $207,200,000 of Capital Grant Receipts Revenue Bonds, Douglas Branch Project (Series 2003A and 2003B) (the “Douglas Branch Bonds”). These bonds were issued in anticipation of the receipt of grants from the federal government pursuant to a full funding grant agreement. The Douglas Branch Bonds carried interest ranging from 3.80% to 5.00%. Interest was payable semiannually on June 1 and December 1. The premium on the bonds and the bond issuance costs were amortized over the life of the bonds using the straight-line method. The bonds were issued to provide funds to finance a portion of the costs of the extensive rehabilitation of eight rail stations and five miles of track as well as the installation of signal and communications equipment, the traction power system and various infrastructure improvements that together constitute the Douglas Branch Reconstruction Project. The Douglas Branch Bonds were limited obligations of the CTA payable solely from amounts pledged pursuant to a Trust Indenture entered into by the CTA. In 2006, the CTA exercised its option to call, or redeem, prior to maturity of the outstanding Douglas Branch Bonds in accordance with an Indenture between the CTA and the Trustee. The redemption price for bonds called by the CTA is equal to the principal amount of the bonds to be redeemed, plus accrued interest.

5 Debt Administration
114
Capital Grant Receipts Revenue Bonds, Series 2004A and 2004B On October 20, 2004, CTA issued Capital Grant Receipts Revenue Bonds, Series 2004A and 2004B, (Federal Transit Administration Section 5307 Formula Funds), (together referred to as the “2004 Bonds”). Par value of the 2004 Bonds was $250,000,000, with $150,000,000 in Series 2004A and $100,000,000 in Series 2004B. The 2004 Bonds are solely secured via Federal Transit Administration 5307 Urbanized Area Formula funds. The proceeds of the 2004 Bonds will be used to pay for, or reimburse the CTA for prior expenditures relating to a portion of certain capital improvement projects identified by the CTA (the “2004 Projects”). These capital improvements must be approved by the CTA Board, the RTA and included in the CTA Capital Plan. The 2004 Projects include infrastructure improvements including facility rehabilitation, rail station reconstruction, replace/upgrade track, structure and signal systems, communication infrastructure improvement and replace bus and rail fleet. The 2004 Projects may be substituted from time to time, provided there are funds in the 2004 Project Account of the Construction fund. The 2004 Bonds bear interest ranging from 3.60% to 5.25%. Interest payments for the 2004 Bonds are payable June 1 and December 1 of each year. Principal payments began June 1, 2006 (see Schedule II). Subject to market conditions, CTA may enter into one or more Qualified Swap Agreements. The 2004 Bonds are not eligible for early redemption, except under certain extraordinary circumstances. The source of grant receipts available to CTA to pay principal and interest on the 2004 Bonds is its annual share of Section 5307 Formula Funds; subject to a prior pledge applied to the funding requirements of the Douglas Branch Bonds through 2006. As of October 1, 2006, $232,295,000 of the 2004 Bonds were outstanding.
PAYMENT YEAR
INTEREST PAYMENT
PRINCIPAL PAYMENT TOTAL DEBT SERVICE DEBT OUTSTANDING
(end of period)
2007 11,461,900$ 18,410,000$ 29,871,900$ 213,885,000$ 2008 10,542,825$ 19,335,000$ 29,877,825$ 194,550,000$ 2009 9,562,569$ 20,250,000$ 29,812,569$ 174,300,000$ 2010 8,492,781$ 21,295,000$ 29,787,781$ 153,005,000$ 2011 7,367,856$ 22,390,000$ 29,757,856$ 130,615,000$ 2012 6,173,231$ 23,545,000$ 29,718,231$ 107,070,000$ 2013 4,904,700$ 24,780,000$ 29,684,700$ 82,290,000$ 2014 3,602,494$ 26,085,000$ 29,687,494$ 56,205,000$ 2015 2,231,906$ 27,385,000$ 29,616,906$ 28,820,000$ 2016 756,525$ 28,820,000$ 29,576,525$ -$
Schedule II: $250,200,000 Capital Grant Receipts Revenue Bonds (Federal Transit Administration 5307 Formula Funds)
Series 2004A and Series 2004B Total Debt Service 2007-2016

5 Debt Administration
115
A summary of combined CTA lease and debt service obligations follows in Schedule III.
PAYMENT YEAR 2003 PBC LEASE 2004 BONDS TOTAL ANNUAL DEBT
SERVICE2007 9,891,000$ 29,871,900$ 39,762,900$ 2008 9,922,250$ 29,877,825$ 39,800,075$ 2009 9,814,250$ 29,812,569$ 39,626,819$ 2010 9,953,750$ 29,787,781$ 39,741,531$ 2011 9,850,000$ 29,757,856$ 39,607,856$ 2012 9,933,750$ 29,718,231$ 39,651,981$ 2013 9,756,250$ 29,684,700$ 39,440,950$ 2014 9,712,687$ 29,687,494$ 39,400,181$ 2015 9,892,437$ 29,616,906$ 39,509,343$ 2016 9,899,875$ 29,576,525$ 39,476,400$ 2017 9,840,250$ 9,840,250$ 2018 9,813,562$ 9,813,562$ 2019 9,865,875$ 9,865,875$ 2020 9,845,875$ 9,845,875$ 2021 9,804,875$ 9,804,875$ 2022 9,840,250$ 9,840,250$ 2023 9,800,688$ 9,800,688$
Schedule III: CTA TOTAL ANNUAL LEASE / DEBT SCHEDULE 2007-2023

6 Annual Budget Process
116
The Budget & Financial Plan Process The RTA Act requires the RTA Board to adopt a consolidated annual budget and two-year financial plan. The budgetary process contains three phases: budget development, budget adoption, and budget execution and administration.
Budget Development June 15
Budget development begins each year in the middle of June with the Budget Call from the RTA. The Budget Call outlines the required budget information for the RTA, and provides economic assumptions for the region. The RTA's sales tax forecast is based on the most recent sales tax revenue estimate provided by the State Bureau of the Budget (BOB). The BOB is required to submit to the Regional Transportation Authority by July 1 of each year an estimate of Sales Tax Revenues to be received by the CTA for the next fiscal year. The RTA uses this estimate and the sales tax growth rates to prepare the annual budget funding Marks and to estimate sales tax for the two years of the financial plan.

6 Annual Budget Process
117
Budget Adoption August 15
By the middle of August, CTA is required to submit a macro-level budget and a two-year financial plan to the RTA.
September 15 The RTA Board is required by the RTA Act to set operating funding "Marks" for the three Service Boards by September 14. The Marks include estimates of available operating funding for the budget and financial plan and a required recovery ratio (the ratio or percentage of operating expenses that must be recovered from system-generated revenue) for the budget. Upon issuance of the budget Marks, CTA revises its expenses and revenues to conform to the Marks.
October 12 Budget released to the public. The statute requires documents be available for public inspection 21 days prior to the public hearing.
November 8 Public Hearing is held to receive comments from the public.
November 14 CTA presents the budget to the Cook County Board after the Public Hearing but prior to the CTA adoption of the budget as required by the RTA Act.
November 14 The CTA Board incorporates any changes and adopts the budget and two-year financial plan.
November 15 December 15
The RTA Act requires CTA by November 15 to submit to RTA its detailed budget and financial plan that conforms to the Budget Marks set by the RTA on September 15. The RTA Board adopts the proposed budget and plan upon the approval of nine of the RTA's thirteen directors.
RTA Statutory Requirements for Budget Approval The RTA Board adopts the proposed budget and plan upon the approval of nine of the RTA's thirteen directors. If the budget meets the RTA’s six criteria identified in the RTA Act outlined below, then the RTA is required to adopt the budget by December 31. If the RTA Board does not approve the budget, the RTA Board cannot release any discretionary funds for the periods covered by the budget and financial plan except the proceeds of sales taxes due by the statutory formula to the CTA until the budget conforms to the criteria specified in the act.
The six criteria for budget and plan approval per RTA Act are:
1. Balanced Budget: The budget and plan show a balance between (A) anticipated
revenues from all sources including operating subsidies and (B) the costs of providing the services specified and of funding any operating deficits or encumbrances incurred in prior periods, including provision for payment when due of principal and interest of

6 Annual Budget Process
118
outstanding indebtedness. 2. Cash Flow: The budget and plan show cash balances including the proceeds of any
anticipated cash flow borrowing sufficient to pay with reasonable promptness all costs and expenses incurred.
3. Recovery Ratio: The budget and plan provide for a level of fares or charges and operating or administrative costs for the public transportation provided by or subject to the system generated revenue recovery ratio.
4. Assumptions: The budget and plan are based upon and employ assumptions and projections which are reasonable and prudent.
5. Financial Practices: The budget and plan have been prepared in accordance with sound financial practices as determined by the RTA board.
6. Other Requirements: The budget and plan meet such other financial, budgetary, or fiscal requirements that the RTA board may by rule or regulation establish.
Budget Execution & Administration After the proposed budget and financial plan are adopted, the budget execution and administration phase begins. Detailed budgets of revenues and expenses calendarized for the 12 months of the budget year are forwarded to the RTA. CTA’s actual monthly financial performance is measured against the monthly budget and reported to the RTA Board. Amendment Process As CTA monitors actual performance, changes may be required to the budget. The RTA might revise its sales tax forecast, which could result in less public funding for the CTA. This in turn would require reduced spending to meet the revised funding Mark and Recovery Ratio. When the RTA amends a revenue estimate because of changes in economic conditions, governmental funding, a new program, or other reasons, CTA has 30 days to revise its budget to reflect these changes. Depending on the amendment, the proposed changes may be presented to one or more committees of the RTA Board for approval. The RTA’s Finance Committee, however, must approve all amendments before they are recommended to the RTA Board for approval. The budget may also be amended if CTA is significantly out of compliance with the budget for a particular quarter based upon its financial condition and results of operations. The RTA Board, by a vote of nine members, may require CTA to submit a revised financial plan and budget, which show that the Marks will be met in a time period of less than four quarters. If the RTA Board determines that the revised budget is not in compliance with the Marks, the RTA will not release discretionary funds. RTA discretionary funds include monies from The Public Transportation Fund (PTF), discretionary sales tax and other state funding. If the Authority submits a revised financial plan and budget which show the Marks will be met within a four quarter period, then the RTA Board shall continue to release funds.
7 Accounting System & Financial Controls
119
ORGANIZATION OVERVIEW The Chicago Transit Authority (CTA) was formed in 1945 pursuant to the Metropolitan Transportation Authority Act passed by the Illinois Legislature. The CTA was established as an independent governmental agency (an Illinois municipal corporation) “separate and apart from all other government agencies” to consolidate Chicago’s public and private mass transit carriers. The City Council of the City of Chicago has granted the CTA the exclusive right to operate a transportation system for the transportation of passengers within the City of Chicago. The Regional Transportation Authority Act provides for the funding of public transportation in the six-county region of Northeastern Illinois. The Act established a regional oversight board (Regional Transportation Authority (RTA)) and designated three service boards (Chicago Transit Authority, Commuter Rail Board and Suburban Bus Board). The Act requires, among other things, that the RTA approve the annual budget of the CTA, that the CTA obtain agreement from local governmental units to provide an annual monetary contribution of at least $5,000,000 for public transportation and that the CTA (collectively with the other service boards) finance at least 50% of their operating costs, excluding depreciation and certain other items, from system-generated sources. Financial Reporting Entity In conformance with Governmental Accounting Standards Board standards, the CTA includes in its financial statements all funds over which the Chicago Transit Board exercises oversight responsibility. Oversight responsibility is defined to include the following considerations: selection of governing authority, designation of management, ability to significantly influence operations, accountability for fiscal matters, the scope of an organization’s public service and/or special financing relationships. Based on the above criteria, the fund established for the employees’ pension plan has been determined not to be part of the reporting entity. The fund is a legal entity separate and distinct from the CTA. The fund is administered by its own oversight committee, of which the CTA appoints half the members, and over which the CTA has no direct authority. Accordingly, the accounts of the fund are not included in CTA’s financial statements. Based upon the criteria set forth by GASB, the CTA is not considered a component unit of the RTA because the CTA maintains separate management, exercises control over all operations, and is fiscally independent from the RTA. Because governing authority of the CTA is entrusted to the Chicago Transit Board comprised of four members appointed by the Mayor of the City of Chicago and three members appointed by the Governor of the State of Illinois, the CTA is not financially accountable to the RTA and is not included as a component unit in the RTA’s financial statements, but is combined in proforma statements with the RTA as statutorily required. BUDGET AND BUDGETARY BASIS OF ACCOUNTING The CTA is required under Section 4.01 of the Regional Transportation Authority Act to submit for approval an annual budget to the RTA by November 15 prior to the commencement of each

7 Accounting System & Financial Controls
120
fiscal year. The budget is prepared on a basis consistent with generally accepted accounting principles, except for the exclusion of certain income and expenses. For 2005 and 2004, these amounts include provision for injuries and damage in excess of budget, depreciation expense, pension expense in excess of pension contributions, revenue from leasing transactions, interest income and expense from sale/leaseback transactions, and capital contributions. The Act requires that expenditures for operations and maintenance in excess of budget cannot be made without approval of the Chicago Transit Board. All annual appropriations lapse at fiscal year-end. The RTA, in accordance with the RTA Act, has approved for budgetary basis presentation the CTA's recognition of the amount of the injury and damage reserve and pension contribution, in the approved annual budget. Provisions in excess of the approved annual budget that are unfunded are excluded from the recovery ratio calculation. The RTA funds the budgets of the service boards rather than the actual operating expenses in excess of system-generated revenue. Favorable variances from budget remain as operating assistance to the CTA. The RTA approves the proposed budget based on a number of criteria: • That the budget is in balance with regard to anticipated revenues from all sources, including
operating subsidies and the costs of providing services and funding operating deficits; • That the budget provides for sufficient cash balances to pay, with reasonable promptness,
costs and expenses when due; • That the budget provides for the CTA to meet its required system-generated revenue
recovery ratio; and • That the budget is reasonable and prepared in accordance with sound financial practices
and complies with such other RTA requirements as the RTA Board of Directors may establish.
The RTA monitors the CTA's performance against the budget on a quarterly basis. If, in the judgment of the RTA, this performance is not substantially in accordance with the CTA's budget for such period, the RTA shall so advise the CTA and the CTA must, within the period specified by the RTA, submit a revised budget to bring the CTA into compliance with the budgetary requirements listed above. FINANCIAL REPORTING Overview The CTA’s financial statements are prepared in conformity with accounting principles generally accepted in the United States of America (GAAP). The Governmental Accounting Standards Board (GASB) is the accepted standard-setting body for establishing governmental accounting and reporting principles. The CTA applies Financial Accounting Standards Board pronouncements (FASBs) and Accounting Principles Board opinions (APBs) issued on or before November 30, 1989, unless those pronouncements conflict with or contradict GASB pronouncements, in which case, GASB prevails, and all of the GASB pronouncements issued subsequently.

7 Accounting System & Financial Controls
121
Basis of Presentation The operations of the CTA are accounted for on a proprietary (enterprise) fund basis. This basis is used when operations are financed and operated in a manner similar to private business enterprises, where the intent of the governing body is that the costs of providing services to the general public on a continuing basis be financed or recovered primarily through user charges, and the periodic determination of revenues earned, costs incurred, and change in net assets is appropriate. Fiscal year The operating cycle of the CTA is based on the calendar year. Prior to 1995, the CTA operated on a 52-week fiscal year composed of four quarters of “four week, four week, and five week” periods. Periodically, a 53-week fiscal year was required to keep the fiscal year aligned with the calendar. INTERNAL CONTROLS Overview CTA management is responsible for establishing and maintaining an internal control system designed to ensure that the assets of the CTA are protected from loss, theft or misuse and to ensure that adequate accounting data are compiled to allow for the preparation of financial statements in conformity with generally accepted accounting principles. The internal control system is designed to provide reasonable, but not absolute, assurance that these objectives are met. The concept of reasonable assurance recognizes that the cost of internal control should not exceed the benefits likely to be derived; and that the evaluation of cost and benefits requires estimates and judgments by management. All internal control evaluations occur within the above framework. The CTA’s internal accounting controls are reasonable under the existing budgetary constraints and adequately safeguard assets and provide reasonable assurance of proper recording of all financial transactions. Single Audit As a recipient of federal, state and RTA financial assistance, the CTA is responsible for ensuring that an adequate internal control system is in place to ensure compliance with applicable laws and regulations related to those programs. This internal control system is subject to periodic evaluation by management and the internal audit staff of the CTA, as well as external auditors. As a part of the CTA’s single audit, tests are made to determine the adequacy of the internal control system, including that portion related to federal financial assistance programs, as well as to determine that the CTA has complied with applicable laws and regulations. The results of the CTA’s single audit for the fiscal year ended December 31, 2005, provided no instances of
7 Accounting System & Financial Controls
122
material weaknesses in the internal control system or violations of applicable laws and regulations. Budgeting Controls In addition, the CTA maintains budgetary controls to ensure compliance with legal provisions embodied in the annual budget appropriated by the Chicago Transit Board and approved by the Regional Transportation Authority. The level of budgetary control (that is, the level at which expenditures cannot legally exceed the appropriated amount) is established for total operating expenses. The CTA also maintains a position control system, which requires that every job, which is not part of scheduled transit operations, be budgeted on an annual basis.

8 Financial Policy
123
FINANCIAL PLANNING POLICIES Financial planning policies incorporate both short and long-term strategies focused on the principles of a balanced budget. These policies ensure proper resource allocation and the continued financial viability of the organization. These policies are reviewed on an annual basis as part of the budget process to ensure continued relevance to the organization’s short and long-term goals and objectives. The policies support: A Balanced Budget The budget reflects the short term goals of the agency. Following development, adoption and implementation of the annual budget, the CTA continually monitors actual monthly financial performance against the budget. Each month CTA performs a detailed line-by-line analysis of revenues and expenses to determine operating variances. This includes reviewing position headcount, analyzing material and other expenses, examining revenue scenarios for potential shortfalls, applying seasonality spread in relation to business activities, and conducting continuous audits to ensure a balanced budget. Where potential year-end variances to budget are projected, CTA uses various strategies to manage the variance in order to ensure a balanced budget. A monthly financial performance report is produced and reported to the CTA and RTA boards for their review. The RTA statute requires CTA to have a balanced budget each year. As such, CTA takes care in the development of its budget to ensure that assumptions and estimates used to develop the budget are reasonable. CTA analyzes data from recent years and develops forecasts that are built on actual expense trends. CTA also researches market trends and consultants’ studies that could impact fuel and healthcare expenses. All expenses match available revenues at the time of the budget, including system-generated revenue, public funding, and other revenue.
Long-Range Planning The CTA also develops a longer range plan for the period beyond the current budget and two-year financial plan. This 10-year plan assesses the implications of current and proposed budget and policy priorities and financial assumptions. Additionally, external economic studies, demographics and traffic patterns are used to estimate the future transit needs of the Chicago metropolitan area, as well as to establish the future system requirements of the CTA. Current infrastructure needs, as well as system growth needs, are developed, prioritized and incorporated in the long-term plan. Each year, CTA conducts internal and external audits to test the adequacy of the CTA’s internal control system. Where weaknesses are identified, CTA takes immediate action to correct such weaknesses to ensure a sound internal control system.
Capital Investment Planning CTA continuously maintains an inventory and assessment of the condition of all major capital assets. A detailed 5-year capital program prioritizes the short term capital needs in order to bring the system to a state of good repair and maximize customer benefits in the regional transit

8 Financial Policy
124
system. A 20-year capital program condition and assessment report provides a broader list of CTA’s capital investment needs. REVENUE POLICIES A clear understanding of CTA revenue sources is essential to maintaining a balanced budget and providing quality service to customers. CTA has policies in place designed to address: Revenue Diversification CTA’s revenue diversification policy allows the agency to manage potential fluctuations in individual revenue streams. CTA encourages its organizational units to submit additional revenue ideas for consideration. The CTA has embarked upon numerous alternative revenue enhancements, such as vending machines and ATMs on the system, wireless communications in the subway tunnels, and parking under the elevated right-of-way. Additionally, creative financing transactions have produced millions of dollars over the past few years for the CTA. The CTA continues to find ways to enhance system advertising, charter, and concession revenues, as well as revenue from investments. Use of One-Time Revenues Extraordinary revenues from the sale of surplus assets provide one-time benefits to the CTA. These additional revenues are used to fund expense items that are non-recurring. EXPENDITURE POLICIES Prudent expenditure planning, monitoring and accountability are key elements of fiscal stability. As such, the CTA maintains policies with respect to: Debt Capacity, Issuance and Management These policies serve as a management tool to ensure CTA a) may utilize leverage as part of its overall funding strategy to speed up investment in the system, b) utilizes debt in the most efficient and effective manner to fund operating and capital improvement programs, and c) makes full and timely repayment of all borrowings. Additionally, the policy provides broad guidelines to ensure that the agency 1) achieves the lowest possible cost of capital within prudent risk parameters, 2) secures ongoing access to the capital markets and 3) authorizes the appropriate amount, type and structure of debt for various financing situations. Reserve Accounts To protect against temporary revenue shortfalls or unpredicted one-time expenditures, the RTA maintains a fund balance to provide funding to the service boards. These reserve amounts can be used for potentially large one-time expenditures.

8 Financial Policy
125
Expenditure Accountability Every month, CTA compares its operating and capital performance to budget. Any deviations from budget are reviewed and corrective measures are implemented by appropriate organizational units. Each unit is responsible for maintaining budget compliance. Actual capital expenditures to budget are also reviewed monthly and adjustments to capital projects spending are made accordingly.
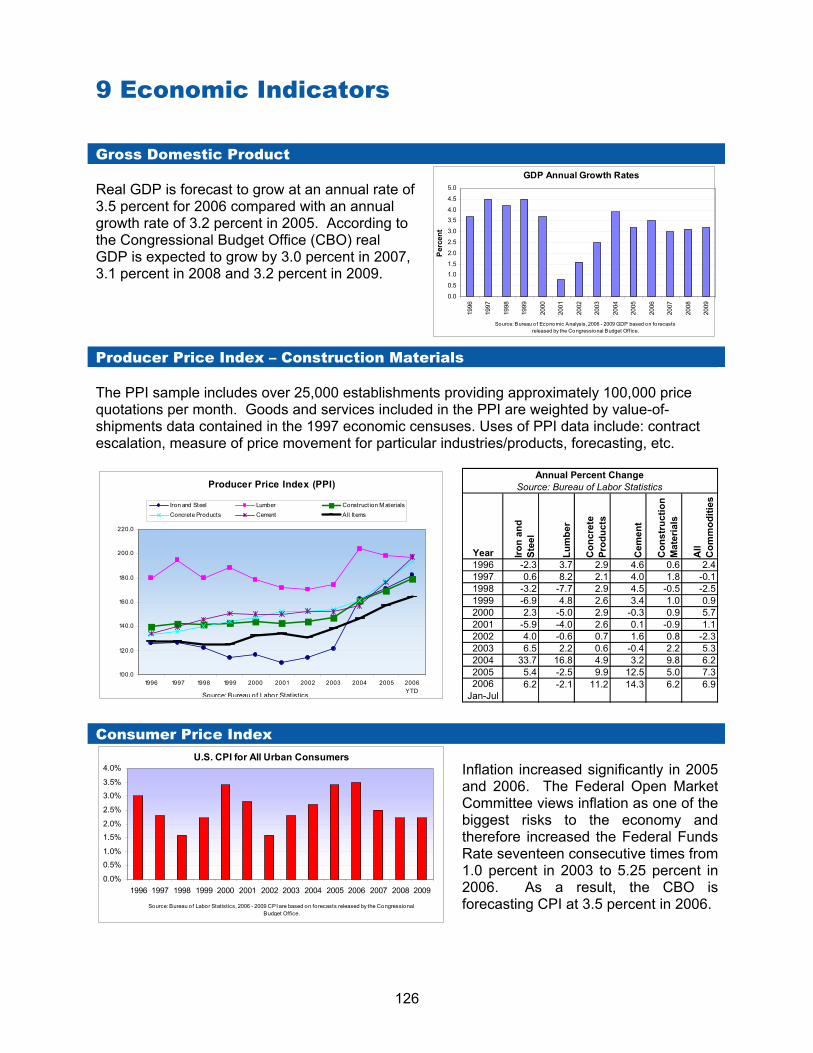
9 Economic Indicators
126
Gross Domestic Product Real GDP is forecast to grow at an annual rate of 3.5 percent for 2006 compared with an annual growth rate of 3.2 percent in 2005. According to the Congressional Budget Office (CBO) real GDP is expected to grow by 3.0 percent in 2007, 3.1 percent in 2008 and 3.2 percent in 2009.
GDP Annual Growth Rates
0.0
0.5
1.01.5
2.0
2.5
3.0
3.54.0
4.5
5.0
1996
1997
1998
1999
2000
2001
2002
2003
2004
2005
2006
2007
2008
2009
Per
cent
Source: Bureau of Economic Analysis, 2006 - 2009 GDP based on fo recasts released by the Congressional Budget Office.
Producer Price Index – Construction Materials The PPI sample includes over 25,000 establishments providing approximately 100,000 price quotations per month. Goods and services included in the PPI are weighted by value-of-shipments data contained in the 1997 economic censuses. Uses of PPI data include: contract escalation, measure of price movement for particular industries/products, forecasting, etc.
Producer Price Index (PPI)
100.0
120.0
140.0
160.0
180.0
200.0
220.0
1996 1997 1998 1999 2000 2001 2002 2003 2004 2005 2006YTD
Iron and Steel Lumber Construct ion M aterialsConcrete Products Cement All Items
Source: Bureau of Labor Statistics
Year Iron
and
Stee
l
Lum
ber
Con
cret
e Pr
oduc
ts
Cem
ent
Con
stru
ctio
n M
ater
ials
All
Com
mod
ities
1996 -2.3 3.7 2.9 4.6 0.6 2.41997 0.6 8.2 2.1 4.0 1.8 -0.11998 -3.2 -7.7 2.9 4.5 -0.5 -2.51999 -6.9 4.8 2.6 3.4 1.0 0.92000 2.3 -5.0 2.9 -0.3 0.9 5.72001 -5.9 -4.0 2.6 0.1 -0.9 1.12002 4.0 -0.6 0.7 1.6 0.8 -2.32003 6.5 2.2 0.6 -0.4 2.2 5.32004 33.7 16.8 4.9 3.2 9.8 6.22005 5.4 -2.5 9.9 12.5 5.0 7.32006
Jan-Jul6.2 -2.1 11.2 14.3 6.2 6.9
Annual Percent Change Source: Bureau of Labor Statistics
Consumer Price Index U.S. CPI for All Urban Consumers
0.0%
0.5%
1.0%
1.5%
2.0%
2.5%
3.0%
3.5%
4.0%
1996 1997 1998 1999 2000 2001 2002 2003 2004 2005 2006 2007 2008 2009
Source: Bureau of Labor Statistics, 2006 - 2009 CPI are based on forecasts released by the Congressional Budget Office.
Inflation increased significantly in 2005 and 2006. The Federal Open Market Committee views inflation as one of the biggest risks to the economy and therefore increased the Federal Funds Rate seventeen consecutive times from 1.0 percent in 2003 to 5.25 percent in 2006. As a result, the CBO is forecasting CPI at 3.5 percent in 2006.

9 Economic Indicators
127
Retail Sales Retail sales have increased every year for the past ten years. Sales are expected to decline slightly in 2007 due to high oil prices and higher interest rates.
U.S. Retail Sales, Excluding Food Services
$0.0$0.5$1.0$1.5$2.0$2.5$3.0$3.5$4.0
1996 1997 1998 1999 2000 2001 2002 2003 2004 2005 2006Jan-Jun
$ in
Mill
ions
Source: U.S. Census Bureau
Federal Funds Rate Federal Funds Year-end Rates
5.50%
5.25%
1.75%
1.00%
4.75%
6.50%
2.25%
4.25%
5.25%
0.00%
1.00%
2.00%
3.00%
4.00%
5.00%
6.00%
7.00%
1996 1997 1998 1999 2000 2001 2002 2003 2004 2005 2006
Source: Federal Reserve Bank
The Federal Open Market Committee ended its rate increases in August 2006 holding the Federal Funds rate at 5.25 percent. In the statement released after the August meeting the Committee remarked that they believe previous increases will begin to take effect, but still view inflation as a significant risk and plan to monitor it closely. Rates will increase again if inflation continues to remain high.
Non-Farm Payroll Chicago area non-farm payroll hit a four-year low in 2005 with an average of 3.75 million employees. Employment growth in 2006 has improved with an average of 3.80 million employees on payrolls for the seven month period between January and July.
Chicago Metropolitan Division Annual Non-Farm Payroll
3,799.1
3,756.9
3,749.9
3,802.5
3,909.9
3,861.63,887.3
3,650
3,700
3,750
3,800
3,850
3,900
3,950
2000 2001 2002 2003 2004 2005 2006 Jan-Jul
Num
ber E
mpl
oyed
(in
Thou
sand
s)
Source: Bureau o f Labor Statistics
U.S. Oil Prices per Barrel
Oil prices have increased significantly since 2003 when the price hit a low of $21.43 per barrel in May. In July 2006 U.S. oil prices reached $66.57 per barrel. Increasing oil and energy prices have put a strain on the economy in recent months with GDP growth slowing to a moderate 2.9 percent in the second quarter of 2006.
U. S . Oi l P r i c e s pe r Ba r r e l
$ 20.00
$ 30.00
$ 40.00
$ 50.00
$ 60.00
$ 70.00
$ 80.00
M ay-03 Sep-03 Jan-04 M ay-04 Sep-04 Jan-05 M ay-05 Sep-05 Jan-06 M ay-06
Source: Energy Information Administration

10 Operating Statistics - System
2003 2004 2005 2006 2007CHARACTERISTICS Actual Actual Actual Forecast* Budget
RidershipAvg. Daily Weekday 1,437,416 1,425,790 1,481,695 1,584,461 1,602,846 Avg. Daily Saturday 855,742 869,631 899,161 951,417 972,359 Avg. Daily Sunday 569,843 582,201 621,450 653,059 651,842 System Wide Ridership 474,880,528 474,951,456 492,404,000 497,435,612 505,944,371
ExpenseTop Operator Rate 23.01$ 23.70$ 24.47$ 25.33$ 25.33$ Capital Expenditures 484,061,897$ 457,699,068$ 402,951,311$ 579,300,000$ 434,697,359$
RevenueAverage Fare per Trip (fare box only) 0.78$ 0.85$ 0.85$ 0.93$ 0.93$ Public Funding per Trip (NTD) 0.96$ 0.93$ 1.01$ 1.05$ 1.15$
Safety (Reported & Blind)Bus Accidents per 100,000 Miles 5.69 5.78 6.29 6.20 6.00Rail Accidents per 100,000 Miles 0.10 0.17 0.13 0.12 0.11
* 2003-2005 Statistics for Avg. Daily Ridership do not include rail-to-rail transfers. 2006 Avg. Daily Ridership is based on July 2006 YTD actualavg. daily ridership. These totals include paratranit avg. daily ridership; paratransit service ended in July 2006. Paratransit daily averages for 2006 were as follows: Avg. Daily Weekday 6,705; Avg. Daily Saturday 3,060; Avg. Daily Sunday 3,296.
Safety - Bus Accidents per 100,000 Miles
5.30
5.40
5.50
5.60
5.70
5.80
5.90
6.00
6.10
6.20
6.30
6.40
2003 2004 2005 2006 2007
Safety - Rail Accidents per 100,000 Miles
0.00
0.10
0.20
2003 2004 2005 2006 2007
128

11 Operating Statistics - Bus
2003 2004 2005 2006 2007CHARACTERISTICS Actual Actual Actual Forecast Budget
ExpensesScheduled Transportation Expense 235,954,371$ 271,533,889$ 267,131,081$ 304,100,168$ 302,592,829$ Garage Maintenance Expense 76,969,340$ 86,637,790$ 83,458,941$ 90,688,983$ 93,183,222$ Support Expense 30,488,366$ 22,309,490$ 20,784,554$ 22,547,106$ 23,389,416$ Heavy Maintenance Expense 34,579,458$ 34,245,369$ 30,886,169$ 31,997,002$ 37,281,734$ Fuel Expense 24,476,713$ 30,093,000$ 45,788,000$ 55,003,000$ 61,233,000$ Other Expenses 3,243,439$ 18,992,225$ 16,232,068$ 17,109,474$ 19,099,256$ Total Operating Expense - Bus 405,711,687$ 463,811,763$ 464,280,813$ 521,445,733$ 536,779,457$
MilesAnnual Vehicle Revenue Miles 66,377,934 66,572,049 66,811,532 68,576,000 68,308,125
TripsAnnual Unlinked Trips 291,804,434 294,030,775 303,244,000 299,166,975 301,560,311
VehiclesAnnual Vehicle Revenue Hours 6,619,108 6,782,813 6,748,105 7,033,113 7,049,004 Vehicles Operated in Max. Service 1,719 1,735 1,704 1,797 1,797 Vehicles Owned by CTA (at Fall Fleet Assignment) 1,991 2,017 2,033 2,106 2,106 Average Age of Vehicles 9.5 8.9 9.4 9.2 9.4
Annual Vehicle Revenue Hours - Bus
1,000,000
1,500,000
2,000,000
2,500,000
3,000,000
3,500,000
4,000,000
4,500,000
5,000,000
5,500,000
6,000,000
6,500,000
7,000,000
7,500,000
2003 2004 2005 2006 2007
129

12 Operating Statistics - Heavy Rail
2003 2004 2005 2006 2007CHARACTERISTICS Actual Actual Actual Forecast Budget
ExpensesScheduled Transportation Expense 78,237,717$ 76,698,270$ 83,501,031$ 89,246,131$ 91,931,229$ Terminal Maintenance Expense 33,894,785$ 31,292,618$ 33,100,142$ 34,921,815$ 38,099,247$ Support Expense 24,436,235$ 23,558,206$ 25,140,426$ 25,508,346$ 26,894,995$ Heavy Maintenance Expense 7,173,311$ 6,393,109$ 8,100,342$ 6,704,444$ 9,562,008$ Rail Car Appearance Expense 9,976,353$ 10,009,807$ 10,099,645$ 11,008,373$ 11,903,703$ Other Expenses 4,048,481$ 3,820,149$ 3,813,647$ 4,304,269$ 4,951,307$ Total Operating Expense - Rail 157,766,882$ 151,772,159$ 163,755,233$ 171,693,378$ 183,342,489$ Power Expense 21,058,000$ 21,640,000$ 22,909,000$ 21,582,000$ 28,057,000$
MilesAnnual Rail Car Revenue Miles 63,555,565 64,328,206 68,920,555 68,424,000 69,152,239
TripsAnnual Unlinked Trips (NTD) 181,135,094 178,716,456 186,759,000 197,072,637 204,384,060
VehiclesAnnual Train Revenue Hours 683,197 634,134 665,240 647,850 713,323 Vehicles Operated in Max. Service 996 978 984 1,022 1,022 Vehicles Owned by CTA (at Fall Fleet Assignment) 1,190 1,190 1,190 1,190 1,190 Average Age of Vehicles 20.0 21.0 22.0 23.0 24.0
Annual Train Hours - Heavy Rail
-50,000
100,000150,000200,000250,000300,000350,000400,000450,000500,000550,000600,000650,000700,000750,000
2003 2004 2005 2006 2007
130

13 Operating Statistics - Paratransit
2003 2004 2005 2006 2007CHARACTERISTICS Actual Actual Actual Forecast Budget*
Contracted Paratransit ExpenseParatransit Services 36,271,512$ 42,034,969$ 44,927,845$ 23,585,089$ -$ TAP Services 6,078,814$ 6,964,715$ 8,329,052$ 3,783,554$ -$ Total Paratransit Expense 42,350,326$ 48,999,684$ 53,256,897$ 27,368,643$ -$ Average Cost per Trip 21.81$ 22.23$ 22.18$ 22.88$ -$
TripsParatransit Trips 1,478,859 1,682,689 1,770,000 905,000 - Taxi Trips 462,619 521,311 631,000 291,000 - Total Trips 1,941,478 2,204,000 2,401,000 1,196,000 0
Average Cost per TripParatransit Trips 24.53$ 24.98$ 25.38$ 26.06$ -$ Taxi Trips 13.14$ 13.36$ 13.20$ 13.00$ -$
Mainline ServiceBus Routes Offering Lift Service (2) 131 148 150 154 154ADA Accessible Stations 66 72 72 76 82
*Pace took over Paratransit service in July of 2006
(2) In 2005, the CTA bus system became 100% ADA accessible.
Paratransit Average Cost per Trip
24.53
24.98
25.38
26.06
$24.00
$25.00
$26.00
2003 2004 2005 2006
131

14 Comparative Ridership Reporting SYSTEM RIDERSHIP STATISTICS
RIDERSHIP - Excluding Rail-to-Rail Transfers
2003 2004 2005 2006 2007CHARACTERISTICS Actual Actual Actual Forecast Budget
RidershipBus 291,804,434 294,031,000 303,244,000 299,166,975 301,560,311 Rail 150,319,580 148,312,000 154,987,000 163,968,927 170,052,174 Paratransit 1,941,000 2,204,000 2,401,000 1,196,000 -System Wide Ridership 444,065,014 444,547,000 460,632,000 464,331,902 471,612,485
RIDERSHIP - Reported to NTD
2003 2004 2005 2006 2007CHARACTERISTICS Actual Actual Actual Forecast Budget
RidershipBus 291,804,434 294,031,000 303,244,000 299,166,975 301,560,311 Rail 181,135,094 178,716,456 186,759,000 197,072,637 204,384,060 Paratransit 1,941,000 2,204,000 2,401,000 1,196,000 -System Wide Ridership 474,880,528 474,951,456 492,404,000 497,435,612 505,944,371
In 2006 CTA adopted National Transit Database (NTD) reporting guidlines for its financial reporting. Summarized below isa comparison of ridership reported without cross-platform transfers and ridership reported to the Federal TransitAdministration (FTA) in the NTD report. The ridership reported to the FTA is approximately 17 percent higher than what isreported to the RTA. This is because the ridership reports use different methodologies. Prior to 2006 the reportssubmitted to RTA did not include non-paid rail-to-rail transfers that are not captured by the fare equipment. For the NTD,these "cross-platform" transfers are estimated using methodologies consistent with FTA's specifications. To estimatecross-platform transfers CTA uses a passenger intercept survey that reviews the customer's trip pattern. Cross-platformtransfers typically average 17 percent of all rail boardings, and represent over 100,000 rides each weekday and 30 millionrides annually. Only NTD reports are acceptable for official counts of system ridership for purposes of allocating federalformula grants, as well as for comparisons of transit agency ridership.
410420430440450460470480490500510
In M
illio
ns
2003 2004 2005 2006 2007
Ridership Reporting Comparison - Financial Statement vs. NTD
Financial Statement - Ridership NTD - Ridership
132

15 Comparative Performance Analysis - Bus
BUS
PERFORMANCE MEASURES CTA WMATA MBTA LACMTA NYCT SEPTAService Efficiency
Operating Exp./Vehicle Rev. Mile 10.06$ 10.17$ 10.22$ 8.67$ 16.19$ 9.98$ Operating Exp./Vehicle Rev. Hour 98.74$ 114.42$ 110.82$ 108.06$ 128.10$ 103.49$ Maint. Employees/Million Veh. Rev. Miles 16.78 20.78 19.41 16.84 28.26 20.93
Cost EffectivenessOperating Exp./Passenger Mile 0.85$ 0.91$ 0.88$ 0.56$ 1.07$ 0.74$ Operating Exp./Unlinked Trip 2.28$ 2.71$ 2.15$ 2.17$ 1.88$ 2.14$ Administrative Exp./Vehicle Rev. Hour 10.71$ 14.02$ 17.54$ 22.45$ 14.82$ 18.47$
Service EffectivenessUnlinked Trips/Vehicle Rev. Mile 4.42 3.75 4.76 4.00 8.62 4.67Unlinked Trips/Vehicle Rev. Hour 43.35 42.22 51.63 49.81 68.17 48.44
Data obtained from 2004 "Transit Profiles - The Thirty Largest Agencies" published by the National Transit Database Program.
Comparison Group
Operating Exp./Vehicle Rev. Mile
$0
$2
$4
$6
$8
$10
$12
$14
$16
$18
CTA WMATA MBTA LACMTA NYCT SEPTA
Operating Exp./Passenger Mile
$-
$0.20
$0.40
$0.60
$0.80
$1.00
$1.20
CTA WMATA MBTA LACMTA NYCT SEPTA
Operating Exp./Vehicle Rev. Hour
$0
$20
$40
$60
$80
$100
$120
$140
CTA WMATA MBTA LACMTA NYCT SEPTA
Operating Exp./Unlinked Trip
$-
$0.50
$1.00
$1.50
$2.00
$2.50
$3.00
CTA WMATA MBTA LACMTA NYCT SEPTA
Service Efficiency
Cost Effectiveness
133

16 Comparative Performance Analysis - Rail
PERFORMANCE MEASURES CTA WMATA MBTA LACMTA NYCT SEPTAService Efficiency
Operating Exp./Vehicle Rev. Mile 6.22$ 9.03$ 10.15$ 12.19$ 7.47$ 7.65$ Operating Exp./Vehicle Rev. Hour 115.96$ 227.25$ 223.28$ 276.11$ 136.42$ 149.66$ Maint. Employees/Million Vehicle Rev. Mile 9.88 17.62 17.20 22.90 15.22 21.92
Cost EffectivenessOperating Exp./Passenger Mile 0.37$ 0.35$ 0.37$ 0.43$ 0.30$ 0.32$ Operating Exp./Unlinked Trip 2.24$ 2.10$ 1.36$ 2.13$ 1.44$ 1.42$ Administrative Exp./Vehicle Rev. Hour 18.44$ 29.54$ 49.31$ 65.30$ 16.77$ 19.77$
Service EffectivenessUnlinked Trips/Vehicle Rev. Mile 2.78 4.31 7.46 5.72 5.18 5.37Unlinked Trips/Vehicle Rev. Hour 51.83 108.39 164.14 129.48 94.66 105.14
Data obtained from 2004 "Transit Profiles - The Thirty Largest Agencies" published by the National Transit Database Program.
Comparison Group
Operating Exp./Vehicle Rev. Mile
$0
$2
$4
$6
$8
$10
$12
$14
CTA WMATA MBTA LACMTA NYCT SEPTA
Operating Exp./Passenger Mile
$-
$0.05
$0.10
$0.15
$0.20
$0.25
$0.30
$0.35
$0.40
$0.45
$0.50
CTA WMATA MBTA LACMTA NYCT SEPTA
Operating Exp./Vehicle Rev. Hour
$0
$50
$100
$150
$200
$250
$300
CTA WMATA MBTA LACMTA NYCT SEPTA
Operating Exp./Unlinked Trip
$-
$0.50
$1.00
$1.50
$2.00
$2.50
CTA WMATA MBTA LACMTA NYCT SEPTA
Service Efficiency
Cost Effectiveness
134

17 CTA Fare Structure
Fares effective January 1, 2006BUS
Bus Regular Fare Bus Reduced Fare
Cash $2.00 $1.00Transit Card $1.75 $0.85Chicago Card $1.75 -Transit Card Transfer (1) $0.25 $0.151-Day Pass $5.00 -1-Day Visitor Pass $5.00 -2-Day Visitor Pass $9.00 -3-Day Visitor Pass $12.00 -5-Day Visitor Pass $18.00 -7-Day Pass $20.00 -30-Day Pass $75.00 $35.00
RAILRail Regular Fare Rail Reduced Fare
Cash $2.00 $1.00Transit Card $2.00 $0.85Chicago Card $1.75 -Transit Card Transfer (1) $0.25 $0.151-Day Pass $5.00 -1-Day Visitor Pass $5.00 -2-Day Visitor Pass $9.00 -3-Day Visitor Pass $12.00 -5-Day Visitor Pass $18.00 -7-Day Pass $20.00 -30-Day Pass $75.00 $35.00
(1) A transfer allows two additional rides within two hours of issuance and is not allowed with a cash fare.
135

18 Comparative Fare Structure
Full Cash Express Full Cash Senior/Disable ParatransitCITY (SYSTEM) Bus Fare Bus Fare Rail Fare Fare Base Fare
CHICAGO (CTA) $2.00 - $2.00 $0.85 $1.75
NEW YORK CITY (NYCTA) $2.00 $5.00 $2.00 $1.00 $2.00
PHILADELPHIA (SEPTA) $2.00 - $2.00 (1) $0.00 - $0.75/2.00
(2) $3.50
ATLANTA (MARTA) $1.75 - $1.75 $0.85 $3.50
SAN FRANCISCO (MUNI/BART) $1.50 - ZB $1.40-$7.35
(3) $0.50 ZB $1.00 -$6.75 (4)
WASHINGTON D.C. (WMATA) $1.25 $3.00 ZB $1.35 -
$3.90$0.60, Half-price
Rail $2.50-$6.50 (4)
LOS ANGELES (LACMTA) $1.25 - $1.25 $0.45 ZB $1.50 -
$2.70 (4)
BOSTON (MBTA) $0.90 - $1.55 $2.20 - $3.45 ZB $0.90 - $3.00
$0.25 -$0.75 (Bus) $0.35 Rail $1.50 - $4.50
(1) SEPTA: Subway Fare is $2.00, Regional Rail Fares range from $3.00 - $7.00 and have peak/off-peak rates.
(2) SEPTA: Fares vary depending on mode and hours traveled. Full-fare during peak hours, discount for off-peak hours.
(3) MUNI/BART: 25c off Muni adult fare for Bart-to-Muni transfer; BART has a mileage-based formula for fares.
(4) BART/WMATA/LACMTA: Paratransit fares are zone-based on distance.
CTA Historical Full Cash Full Cash Transfer Reduced Reduced Fare Fare Structure Bus Fare Rail Fare Charge* Fare Transfer Charge
2001 $1.50 $1.50 $0.30 $0.75 $0.15
2002 $1.50 $1.50 $0.30 $0.75 $0.15
2003 $1.50 $1.50 $0.30 $0.75 $0.15
2004 $1.75 $1.75 $0.25 $0.85 $0.15
2005 $1.75 $1.75 $0.25 $0.85 $0.15
2006 $2.00 $2.00 $0.25 $0.85 $0.15
2007 $2.00 $2.00 $0.25 $0.85 $0.15
* Since 1/1/06, transfers only available to customers using Chicago Card and Transit Cards. Transfers are not available to customers using cash.
136
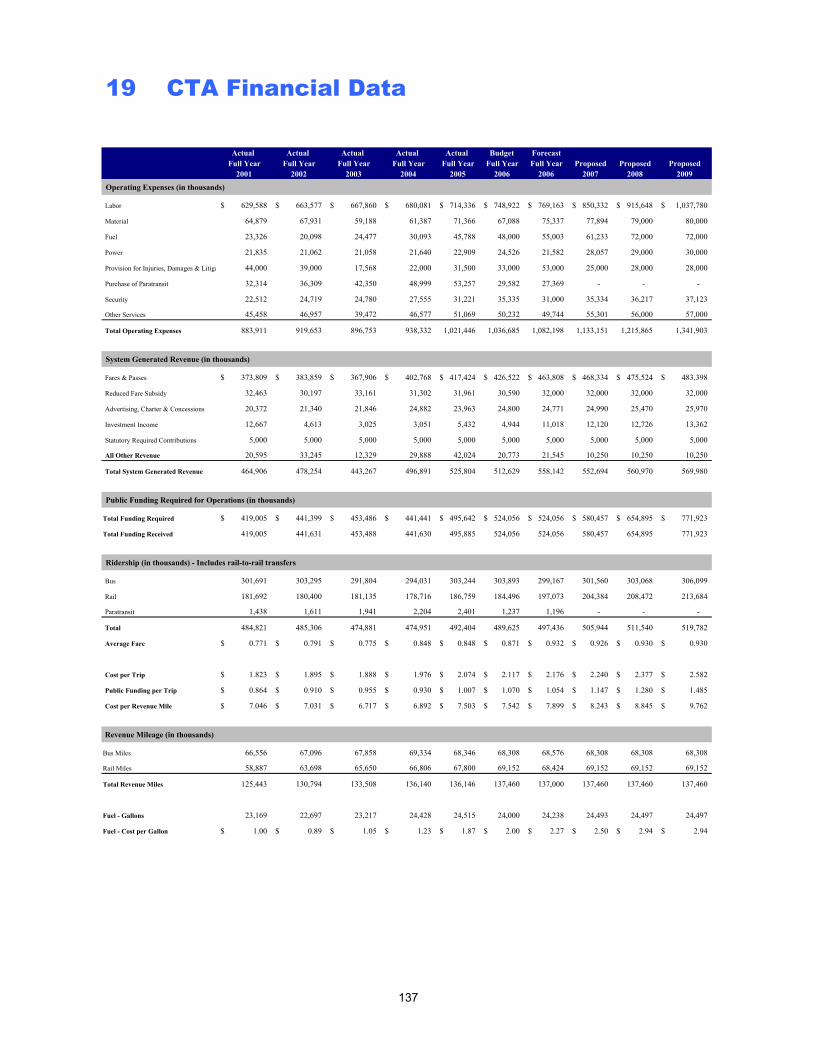
19 CTA Financial Data
Actual Actual Actual Actual Actual Budget ForecastFull Year Full Year Full Year Full Year Full Year Full Year Full Year Proposed Proposed Proposed
2001 2002 2003 2004 2005 2006 2006 2007 2008 2009
Operating Expenses (in thousands)
Labor 629,588$ 663,577$ 667,860$ 680,081$ 714,336$ 748,922$ 769,163$ 850,332$ 915,648$ 1,037,780$
Material 64,879 67,931 59,188 61,387 71,366 67,088 75,337 77,894 79,000 80,000
Fuel 23,326 20,098 24,477 30,093 45,788 48,000 55,003 61,233 72,000 72,000
Power 21,835 21,062 21,058 21,640 22,909 24,526 21,582 28,057 29,000 30,000
Provision for Injuries, Damages & Litiga 44,000 39,000 17,568 22,000 31,500 33,000 53,000 25,000 28,000 28,000
Purchase of Paratransit 32,314 36,309 42,350 48,999 53,257 29,582 27,369 - - -
Security 22,512 24,719 24,780 27,555 31,221 35,335 31,000 35,334 36,217 37,123
Other Services 45,458 46,957 39,472 46,577 51,069 50,232 49,744 55,301 56,000 57,000
Total Operating Expenses 883,911 919,653 896,753 938,332 1,021,446 1,036,685 1,082,198 1,133,151 1,215,865 1,341,903
System Generated Revenue (in thousands)
Fares & Passes 373,809$ 383,859$ 367,906$ 402,768$ 417,424$ 426,522$ 463,808$ 468,334$ 475,524$ 483,398$
Reduced Fare Subsidy 32,463 30,197 33,161 31,302 31,961 30,590 32,000 32,000 32,000 32,000
Advertising, Charter & Concessions 20,372 21,340 21,846 24,882 23,963 24,800 24,771 24,990 25,470 25,970
Investment Income 12,667 4,613 3,025 3,051 5,432 4,944 11,018 12,120 12,726 13,362
Statutory Required Contributions 5,000 5,000 5,000 5,000 5,000 5,000 5,000 5,000 5,000 5,000
All Other Revenue 20,595 33,245 12,329 29,888 42,024 20,773 21,545 10,250 10,250 10,250
Total System Generated Revenue 464,906 478,254 443,267 496,891 525,804 512,629 558,142 552,694 560,970 569,980
Public Funding Required for Operations (in thousands)
Total Funding Required 419,005$ 441,399$ 453,486$ 441,441$ 495,642$ 524,056$ 524,056$ 580,457$ 654,895$ 771,923$
Total Funding Received 419,005 441,631 453,488 441,630 495,885 524,056 524,056 580,457 654,895 771,923
Ridership (in thousands) - Includes rail-to-rail transfers
Bus 301,691 303,295 291,804 294,031 303,244 303,893 299,167 301,560 303,068 306,099
Rail 181,692 180,400 181,135 178,716 186,759 184,496 197,073 204,384 208,472 213,684
Paratransit 1,438 1,611 1,941 2,204 2,401 1,237 1,196 - - -
Total 484,821 485,306 474,881 474,951 492,404 489,625 497,436 505,944 511,540 519,782
Average Fare 0.771$ 0.791$ 0.775$ 0.848$ 0.848$ 0.871$ 0.932$ 0.926$ 0.930$ 0.930$
Cost per Trip 1.823$ 1.895$ 1.888$ 1.976$ 2.074$ 2.117$ 2.176$ 2.240$ 2.377$ 2.582$
Public Funding per Trip 0.864$ 0.910$ 0.955$ 0.930$ 1.007$ 1.070$ 1.054$ 1.147$ 1.280$ 1.485$
Cost per Revenue Mile 7.046$ 7.031$ 6.717$ 6.892$ 7.503$ 7.542$ 7.899$ 8.243$ 8.845$ 9.762$
Revenue Mileage (in thousands)
Bus Miles 66,556 67,096 67,858 69,334 68,346 68,308 68,576 68,308 68,308 68,308
Rail Miles 58,887 63,698 65,650 66,806 67,800 69,152 68,424 69,152 69,152 69,152
Total Revenue Miles 125,443 130,794 133,508 136,140 136,146 137,460 137,000 137,460 137,460 137,460
Fuel - Gallons 23,169 22,697 23,217 24,428 24,515 24,000 24,238 24,493 24,497 24,497
Fuel - Cost per Gallon 1.00$ 0.89$ 1.05$ 1.23$ 1.87$ 2.00$ 2.27$ 2.50$ 2.94$ 2.94$
137

20 Acronyms
138
AC Alternating Current ADA Americans with Disabilities Act AFC Automated Fare Collection APC Automatic Passenger Counter AVAS Automated Voice Annunciation System CATS Chicago Area Transportation Study CBO Congressional Budget Office CDOT Chicago Department of Transportation CIP Capital Improvement Program CPD Chicago Police Department CPI Consumer Price Index CTA Chicago Transit Authority DBE Disadvantaged Business Enterprise DC Direct Current EIA Energy Information Administration ePMO Enterprise Program Management Office ERISA Employee Retirement Income Security Act ERP Enterprise Resource Planning FAA Federal Aviation Administration FFGA Full Funding Grant Agreement FTA Federal Transit Administration FY Fiscal Year GDP Gross Domestic Product IDOT Illinois Department of Transportation MBC Moving Beyond Congestion MMIS Maintenance Management Information System NABI North American Bus Industries NTD National Transit Database PBC Public Building Commission of Chicago PPA/AV Platform Public Address/Audio Visual RTA Regional Transportation Authority SAFETEA-LU Safe, Accountable, Flexible, Efficient Transportation
Equity Act: A Legacy for Users SCADA Supervisory Control And Data Acquisition SCIP Strategic Capital Improvement Program SGR State of Good Repair STO Scheduled Transit Operations TEA-21 Transportation Equity Act - 21st Century TCVM Transit Card Vending Machines TTI Texas Transportation Institute

21 Glossary
139
Accessible As defined by FTA, a site, building, facility, or portion thereof that
complies with defined standards and that can be approached, entered, and used by persons with disabilities.
Accrual Basis A method of accounting in which revenues are reported in the fiscal period it is earned, regardless of when it is received, and expenses are deducted in the fiscal period they are incurred, whether they are paid or not.
ADA The Americans with Disabilities Act of 1990. This federal act requires many changes to ensure that people with disabilities have access to jobs, public accommodations, telecommunications, and public services, including public transit. Examples of these changes includes mandating that all new buses and rail lines be wheel chair accessible, and that alternative transportation be provided to customers unable to access the transit system.
AFC Automated fare collection system.
Articulated Bus A high capacity passenger bus that flexes in the middle.
Bond An interest-bearing promise to pay a specified sum of money on a specified date.
Capital Budget A formal plan of action for a specified time period for purchases of fixed assets using capital grants.
Capital Expense Expenditures that acquire, improve, or extend the useful life of any item with an expected life of three or more years and a value of more than $5,000, e.g. rolling stock, track and structure, support facilities and equipment, and stations and passenger equipment. It can also include the costs associated with the long-term maintenance of these assets such as bus overhaul programs, rail overhaul programs, and preventative maintenance. Also referred to as a capital improvement.
Capital Grant Funds received from a grantor funding agencies used to finance construction, renovation, and major repairs or the purchase of machinery, equipment, buildings or land.
Chicago Card A stored-value farecard that has an imbedded microchip that can be read to register fares by the fare equipment when touched to the touchpad on the front of rail station turnstiles and bus fareboxes on all CTA routes and Pace buses. Value is added with cash at CTA vending machines or off-site Touch-n-Go devices.

21 Glossary
140
Chicago Card Plus A farecard with its balance maintained in an online account rather than stored on the card itself. Value is added with credit cards or through electronic transit benefit deductions only. The card also features online reloading — customer accounts automatically reload each time their account value falls below the pre-selected reload amounts.
Collar Counties The five counties that surround Cook County as identified in the RTA Act. Collar counties include Will, Kane, DuPage, Lake, and McHenry.
Corridor A defined study area considered for significant transportation projects such as highway improvements, bus transitways, rail lines, or bikeways (e.g. Dan Ryan corridor, Western Avenue corridor).
CPI Consumer Price Index. A statistical description of price levels provided by the U.S. Department of Labor. The index is used as a measure of the increase in the cost of living (i.e. economic inflation).
Deferred Operating Assistance
Operating funds remaining from a prior year as a result of a budget surplus that can be used to cover shortfalls or capital expenditures in future years. Spending is allowed only after RTA budgetary approval.
Demand Response A type of transit service where an individual passenger can request transportation from a specific location to another specific location at a certain time (in contrast to fixed-route service).
Depreciation An accounting term that recognizes the loss in value of a tangible fixed asset over time attributable to deterioration, obsolescence, and impending retirement. Applies particularly to physical assets like vehicles, equipment and structures.
Discretionary Funds Funds that the RTA allocates, at its discretion, to the Service Boards. These funds include Public Transportation Funds and a portion of the 15 percent of the RTA Sales Tax.
ERISA
The Employee Retirement Income Security Act of 1974. ERISA is a federal law that sets minimum standards for most voluntarily established pension and health plans in private industry to provide protection for individuals in these plans.
Fare The amount charged to passengers for bus, rail and paratransit services.
Farebox Equipment used for the collection of bus fares.
Farecard Electronic fare media used for payment of fares.
FICA
Federal Insurance Contributions Act. Social Security payroll taxes are collected under authority of FICA.

21 Glossary
141
Financial Plan In addition to an annual budget, the Regional Transportation Authority Act, amended in 1983, requires that all transit agencies prepare a financial plan encompassing the two years subsequent to the budget year. This provides a three-year projection of expenses, revenues, and public funding requirements.
Fiscal Year A fiscal year is a 12-month period used for calculating annual financial reports in organizations. CTA’s fiscal year is synonymous with the calendar year and begins on January 1 and ends on December 31.
Fixed-Route Service Buses that operate according to fixed schedules and routes (in contrast to demand-response service).
FTA Federal Transit Administration. The FTA is the federal agency which provides financial and planning assistance to help plan, build, and operate rail, bus and paratransit systems through grant programs.
Full Funding Grant Agreement (FFGA)
Grant agreements authorized under federal transit law that establish the terms and conditions for federal financial participation in a New Starts project. The FFGA defines the project; sets the maximum amount of Federal new starts funding for a project; covers the period of time for completion of the project; and facilitates efficient management of the project in accordance with applicable federal statutes, regulations, and policy.
Fund Balance The excess of funding over deficit for a given period of time. Refers to the unreserved/undesignated funds. Annual budget surpluses (or deficits) generally add to (or subtract) from the fund balance.
Funding (Budget) Marks The Regional Transportation Authority Act, as amended in 1983, calls for RTA to advise each of its Service Boards by September 15th of the public funding to be available for the following year, as well as the required recovery ratio.
GDP Gross Domestic Product. A measure of economic activity, it is the amount of goods and services produced in the United States in a year. It is calculated by adding together the market values of all of the final goods and services produced in a year and reported by the Bureau of Economic Analysis.
Headway The time span between service vehicles (bus or rail) on specified routes. Also called service frequency.
Heavy Rail An electric railway with the capacity for a heavy volume of traffic. Heavy rail is characterized by high-speed passenger rail cars and trains operating on fixed rails in separate rights-of-way from which all other vehicular and foot traffic is excluded.

21 Glossary
142
Illinois FIRST Illinois Fund for Infrastructure, Roads, Schools and Transit. Illinois FIRST is a five-year public works improvement program that allocated capital funds between FY 2000 through FY 2004.
Infrastructure Capital assets that make up CTA’s transportation system, including maintenance facilities, rail track, signals, stations, elevated structures, and power substations.
In-Kind Services Refers to services provided at no cost to the CTA. For example, the City of Chicago provides dedicated security forces to the CTA at no cost to the CTA.
Intermodal Transportation by more than one mode (bus, train, etc) during a single journey.
Labor Base Labor expense for time actually worked. It excludes holidays, sick time, and vacation time.
Labor Load The cost of fringe benefits. The burden includes group health insurance, paid time off, FICA, workers compensation, and retirement obligations.
Metra The Commuter Rail Division of the RTA responsible for the day-to-day operation of the region’s long-distance commuter rail transit service (with the exception of those services provided by the CTA). Metra was created in 1983 by an amendment to the RTA Act.
Moving Beyond Congestion (MBC)
A joint project launched in 2006 by the Regional Transit Authority, CTA, Metra and Pace to address the operating and capital funding challenges for the region, ensure financial viability and accountability and to meet the region’s growing and changing transportation needs.
National Transit Database
The Federal Transit Administration's (FTA's) primary national database for statistics on the transit industry.
New Starts The Federal Transit Administration’s (FTA) discretionary program that is the federal government’s primary financial resource for supporting locally-planned, implemented, and operated transit "guideway" capital investments.
Non-Operating Funds Expenses funded with capital grants.
Non-Revenue Vehicle Vehicles that do not carry fare-paying passengers used to support transit operations.
Off Peak Periods Non rush-hour time periods.
Operating Budget Annual revenues and expenses forecast to maintain operations.
21 Glossary
143
Operating Expenses Costs associated with the day-to-day operation of the delivery of service for a transit agency. Examples of operating expenses include labor, material, fuel, power, security, and professional services.
Operating Revenues Revenues generated from user fees or other activities directly related to operations such as advertising, concessions, parking, and investment income, etc.
Owl Service Service that is provided continuously between midnight and 5 a.m. Owl Service is provided only on routes that run 24-hour service.
Pace The Suburban Bus Division of the RTA responsible for all non-rail suburban public transit service (with the exception of those services provided by the CTA). Pace was created in 1983 by an amendment to the RTA Act.
Paratransit Service Demand-response service utilizing wheelchair-accessible vans and small buses to provide pre-arranged trips to and from specific locations within the service area to certified participants in the program. Paratransit includes demand-response transportation services, subscription bus services and shared-ride taxis.
Passenger Miles The cumulative sum of the distances traveled by passengers.
Peak Periods Rush-hour time periods, typically defined as 6:00 a.m. through 9:00 a.m., and 3:00 p.m. through 6:00 p.m., Monday through Friday.
Platform Time The period of time in which a transit vehicle is in operation. Platform time contains time that buses are in revenue service and time required to support revenue service, for example time from a garage to the beginning of a route.
Positive Budget Variance
Calculated as the difference between a service board’s budgeted and actual deficit, a positive budget variance results when the actual deficit is less than the budgeted deficit. Since the RTA funds the budgeted deficit, a positive budget variance represents available funds for the service boards.
Producer Price Index
A family of indexes from the Bureau of Labor Statistics (BLS) that measures the average change over time in the prices received by domestic producers of goods and services.
Public Funding Funding received from the RTA or other government agencies.
Public Transportation Funds (PTF)
Funds transferred from the State of Illinois General Fund into the Public Transportation Fund in an amount equal to 25 percent of RTA Sales Tax collected. All funds deposited are allocated to RTA to be used as its discretion for the benefit of the Service Boards.

21 Glossary
144
Purchase of Paratransit Service
The amount of money paid to contractors who provide transportation to certified participants in the ADA paratransit service program.
Recovery Ratio The ratio is calculated as system- generated revenues as allowed by the RTA Act. This ratio is calculated for each of the Service Boards and for the RTA region as a whole. The RTA Act mandates that the RTA region must attain an annual recovery ratio of at least 50 percent.
Reduced Fares Discounted fare for children age 7 – 11, grade school and high school students (with CTA ID), seniors 65 and older (with RTA ID), and riders with disabilities (with RTA ID) except paratransit riders.
Reduced Fare Reimbursement
Reimbursements from the State of Illinois are made to the Service Boards for the difference between standard fares and the reduced fares charged to students, the elderly and the disabled.
Revenue Bond A certificate of debt issued by an organization in order to raise revenue. It guarantees payment of the original investment plus interest by a specified date. Debt service payment is secured by a specific revenue source.
Revenue Equipment Includes vehicles that carry fare-paying passengers, and equipment used for the collection of fares.
Ride A trip taken by passengers on the bus or rail system.
Ridership (Unlinked Passenger Trips)
Each passenger counted each time that person boards a vehicle.
Rolling Stock Public transportation vehicles, including rail cars and buses.
RTA Regional Transit Authority. The RTA is the financial oversight and regional planning body for the three public transit operators in northeastern Illinois: the Chicago Transit Authority (CTA), Metra commuter rail and Pace suburban bus.
Run Rail or bus operator's assigned period(s) of work on a given day.
SAFETEA-LU
Safe, Accountable, Flexible, Efficient Transportation Equity Act: A Legacy for Users (SAFETEA-LU). Federal transit and highway bill signed into act on August 10, 2005 authorizing $286.4 billion nationwide through 2009, including $52.6 billion for transit.
Senate Bill (SB) 1977 Illinois Senate Bill that stipulates that CTA must make annual contributions to the CTA Pension Fund to achieve a 90 percent funded ratio by the end of 2058 beginning January 1, 2009.

21 Glossary
145
Service Board CTA, Metra commuter rail, and Pace suburban bus system, as referred to by the Regional Transportation Authority Act
Slow Zone Sections of track where trains must reduce speed in order to safely operate rail service.
Special Service A transportation service, as defined by the FTA, specifically designed to serve the needs of persons who, by reason of disability, are unable to use mass transit systems designated for the use of the general public.
SPTO Scheduled part-time operators. Part-time STO personnel who are restricted to a maximum of 30 hours of work per week and who receive a lower pay rate than full-time operators.
STO Scheduled transit operations. This classification includes bus operators, motormen, conductors, and customer assistants.
System Generated Revenue
Revenue generated internally by CTA. Includes fare revenue, advertising, investment income, income from local governments by provision of the Regional Transportation Authority Act, and subsidies for reduced fare riders per 1989 legislation.
Taxi Access Program Allows "ADA Paratransit Certified" customers to travel in specially designated Chicago taxicabs at reduced rates anywhere in Chicago.
TEA–21 Federal transportation package which reauthorized the Federal Transit Program for the eight years from 1998 to 2005. Grants can pay up to 80 percent of a capital project, with the remaining 20 percent funded from local sources.
Top Operator Rate The top hourly rate paid to CTA bus and rail operators, based on employee seniority within the job, as specified by the union contract.
Transit Benefit Program Employer-administered program which allows employees to pay for transit fare media using pre-tax income.
Trip A one-way bus trip, or a one-way train trip from origin to destination terminal.
Unlinked Passenger Trip
A single boarding of a transit vehicle. A single journey by one passenger, consisting of one or more unlinked trips is considered a linked trip.
Vehicle Revenue Hours The hours that vehicles travel while in revenue service. Vehicle revenue hours include recovery time but exclude travel to and from storage facilities.
Vehicle Revenue Miles Miles that vehicles travel while in revenue service. Vehicle revenue miles exclude travel to and from storage facilities.
Warranty and Credits Reimbursement for repairs covered by manufacturers’ warranty agreements.

2006 marked the 16th consecutive year that CTA has received the distinguished budget award from the GovernmentFinance Officers Association (GFOA) for excellence in budget presentation. To receive this award, the budget documentmust meet program criteria as a policy document, as an operations guide, as a financial plan, and as a communicationsdevice. We believe the 2007 budget document continues to satisfy the award criteria and are again submitting it toGFOA for 2007.
Distinguished Budget Presentation Award
January 1, 2006


Chicago Transit AuthorityLN060032