transient overvoltages and risk of failure assessment of ... · transient overvoltages and risk of...
TRANSCRIPT
1
Transient Overvoltages and Risk of Failure Assessment of Kuwait EHV Network: A Statistical Perspective
W.M. Al-HASAWI N. H. ABBASY
Electrical Technology Department College of Technological Studies
Shuwaikh, P.O. Box 42325 KUWAIT 70654
Abstract: – Power Systems Switching Transients are initiated by the action of circuit breakers/switches and/or by faults. These actions include equipment energization/de-energization, and/or fault inception/clearing. In this paper a statistical perspective to switching overvoltages (SOV’s) of Kuwait EHV (300 kV) using EMTP is presented. The statistical simulations include different types of faults (L-G, LL-G, 3L-G, L-L), and line energization. The probability distributions for both system overvoltages (stresses) and insulation failure (strengths) are deduced. The objective is to determine the risk of system insulation failure at the critical spots and accordingly, to assess the system insulators which are currently in use. Surge arresters are introduced in the network in order to study their effect in reducing the risk of failure of the insulation. The study shows that the insulators currently in use are, to a high probability, immune and that the risk of insulation failure is almost null. Key-words: - switching overvoltages- EMTP- statistical methods – risk of failure - transients . 1 Introduction Power system networks are subject to various forms of electrical transients, such as switching transients, lightning overvoltages, and resonant overvoltages. These transients may be produced by either opening or closing of circuit breakers or switches. The analysis of such transients is critical to system insulation design and coordination, system operation and protection, and system fault analysis. Due to the complexity of the mathematical models involved, digital simulation using an electromagnetic transient simulation program plays an important role in the study of switching transients. The EMTP has been proved to be a powerful tool in handling such a problem. The insulation switching transients are usually accompanied with numerous sources of randomness. This includes, but not limited to, the instant of switching and the electrical and mechanical tolerances of the breaker. The random fluctuation in the angle of pole closure is recognized as being due to imperfections in the mechanical system of closure and/or possible pre-
striking of the breaker poles. Switching randomness may be viewed such that if the same stress is applied several times in the same conditions, the failure does not always occur, and when it occurs, it may occur at different times. Furthermore, after the stress application, whether the breakdown has occurred or not, the characteristics of the insulation may have been changed by the application. Therefore, the parameters characterizing the behavior of the insulation must be dealt with from a statistical point of view ([1] through [4]). Thus, a number of runs (typically 100 or more) for the same system have to be made with the time of switching (circuit breaker closing times) being different in each run, either in a predictable manner (for determining the peak overvoltage) or statistically (for obtaining an overvoltage probability distribution). This paper examines the effect of random pole closure of circuit breakers on the statistical distributions of system overvoltages due to various switching operations in Kuwait EHV (300 kV) network. Presented case studies include L-G, LL-G,
Proceedings of the 2006 IASME/WSEAS International Conference on Energy & Environmental Systems, Chalkida, Greece, May 8-10, 2006 (pp416-424)
2
3L-G, and L-L faults. Switching due to line energization is also considered. The study aims at providing an insight into the statistical overvoltage distribution in the network and its impact on the assessment of probability of insulation failure (risk of failure). 2 Methods For the Computation of
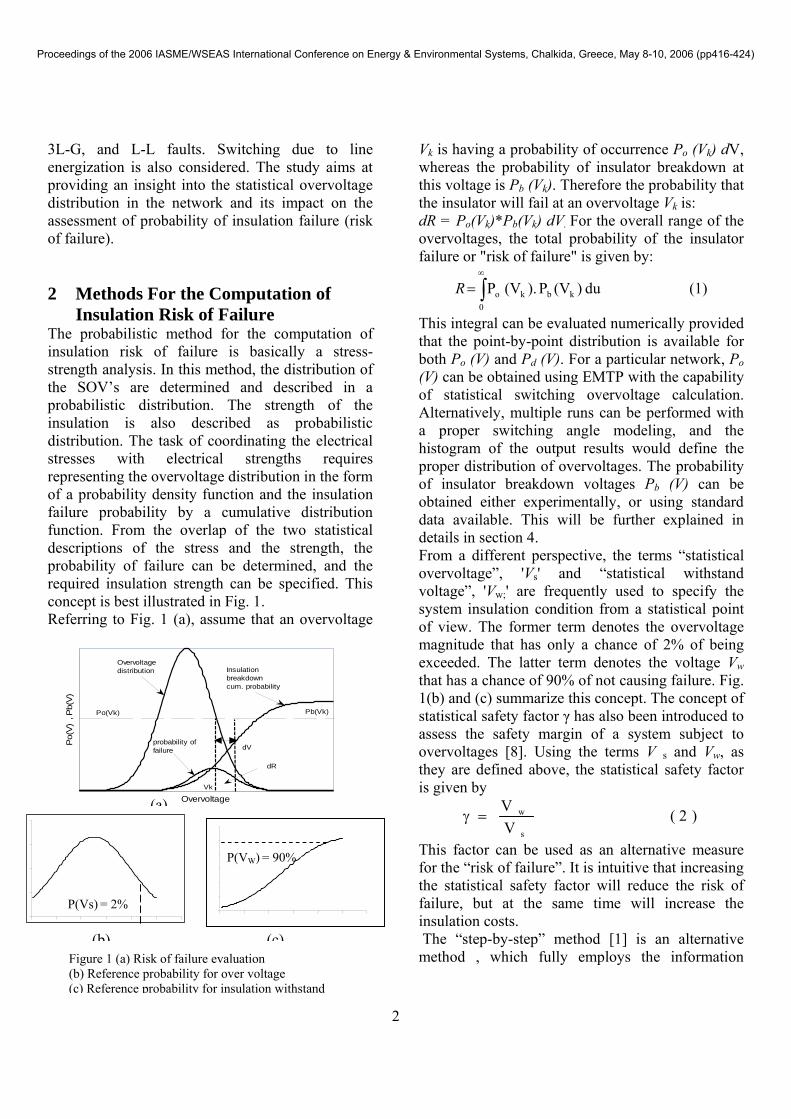
Insulation Risk of Failure The probabilistic method for the computation of insulation risk of failure is basically a stress-strength analysis. In this method, the distribution of the SOV’s are determined and described in a probabilistic distribution. The strength of the insulation is also described as probabilistic distribution. The task of coordinating the electrical stresses with electrical strengths requires representing the overvoltage distribution in the form of a probability density function and the insulation failure probability by a cumulative distribution function. From the overlap of the two statistical descriptions of the stress and the strength, the probability of failure can be determined, and the required insulation strength can be specified. This concept is best illustrated in Fig. 1. Referring to Fig. 1 (a), assume that an overvoltage
Vk is having a probability of occurrence Po (Vk) dV, whereas the probability of insulator breakdown at this voltage is Pb (Vk). Therefore the probability that the insulator will fail at an overvoltage Vk is: dR = Po(Vk)*Pb(Vk) dV. For the overall range of the overvoltages, the total probability of the insulator failure or "risk of failure" is given by:
∫∞
=0
kbko (1) du )(VP ).(V PR
This integral can be evaluated numerically provided that the point-by-point distribution is available for both Po (V) and Pd (V). For a particular network, Po (V) can be obtained using EMTP with the capability of statistical switching overvoltage calculation. Alternatively, multiple runs can be performed with a proper switching angle modeling, and the histogram of the output results would define the proper distribution of overvoltages. The probability of insulator breakdown voltages Pb (V) can be obtained either experimentally, or using standard data available. This will be further explained in details in section 4. From a different perspective, the terms “statistical overvoltage”, 'Vs' and “statistical withstand voltage”, 'Vw;' are frequently used to specify the system insulation condition from a statistical point of view. The former term denotes the overvoltage magnitude that has only a chance of 2% of being exceeded. The latter term denotes the voltage Vw that has a chance of 90% of not causing failure. Fig. 1(b) and (c) summarize this concept. The concept of statistical safety factor γ has also been introduced to assess the safety margin of a system subject to overvoltages [8]. Using the terms V s and Vw, as they are defined above, the statistical safety factor is given by
)2(VV
s
w=γ
This factor can be used as an alternative measure for the “risk of failure”. It is intuitive that increasing the statistical safety factor will reduce the risk of failure, but at the same time will increase the insulation costs. The “step-by-step” method [1] is an alternative method , which fully employs the information Figure 1 (a) Risk of failure evaluation
(b) Reference probability for over voltage (c) Reference probability for insulation withstand
Overvoltage
Po(
V)
, Pb(
V)
Overvoltagedistribution Insulation
breakdowncum. probability
probability offailure
Vk
Po(Vk) Pb(Vk)
dV
dR
(a)
(b) (c)
P(VW) = 90%
P(Vs) = 2%
Proceedings of the 2006 IASME/WSEAS International Conference on Energy & Environmental Systems, Chalkida, Greece, May 8-10, 2006 (pp416-424)
3
available in the overvoltage studies. In particular, this method requires no assumption for either the overvoltage distribution in each location of the network or the possible correlation among the overvoltages in the various locations. Although the method generally requires that every individual insulator to be differently stressed, yet the overvoltage computation can be limited to some locations only, as the overvoltages in much contiguous insulation are practically the same. The risk of failure on system is given by the following formula
where; R = risk of failure of a system of L individual insulation for a given type of event. N = total number of random steps. Pi = probability of occurrence of the ith step (Pi =1) Vs,i= parameters that define the stress on the sth insulation for the ith step. Ws = parameters that define the withstand voltage of the sth insulation, and Pw = probability of withstand voltage of sth insulation, when subject to stress Vsi. The “IEC simplified statistical method” of the IEC 71-2 publication represents a further simple procedure. In this method, the insulation stresses are described with an overvoltage distribution that is assumed to be Gaussian truncated at three times the standard deviation σ, where the truncated value VM represents the maximum prospected overvoltage. According to this model, the various overvoltage distributions as functions of the statistical safety factor can be readily obtained. A rather straightforward method is developed in [6] to estimate the risk of insulation failure by the numerical generation of random events. In that method a random number generator is used to generate normally- distributed times to crest t, surge amplitudes Vs, and insulation withstand voltages Vw, all with appropriate means and standard deviations estimated either analytically or experimentally.
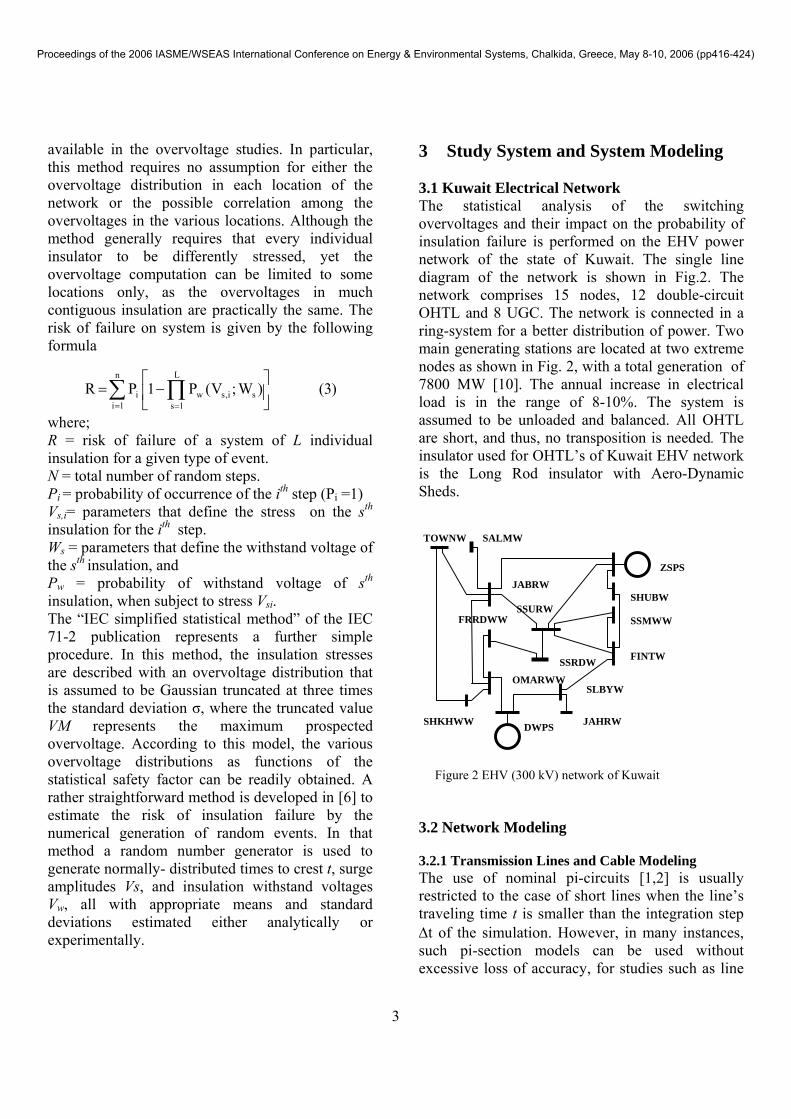
3 Study System and System Modeling 3.1 Kuwait Electrical Network The statistical analysis of the switching overvoltages and their impact on the probability of insulation failure is performed on the EHV power network of the state of Kuwait. The single line diagram of the network is shown in Fig.2. The network comprises 15 nodes, 12 double-circuit OHTL and 8 UGC. The network is connected in a ring-system for a better distribution of power. Two main generating stations are located at two extreme nodes as shown in Fig. 2, with a total generation of 7800 MW [10]. The annual increase in electrical load is in the range of 8-10%. The system is assumed to be unloaded and balanced. All OHTL are short, and thus, no transposition is needed. The insulator used for OHTL’s of Kuwait EHV network is the Long Rod insulator with Aero-Dynamic Sheds.
Figure 2 EHV (300 kV) network of Kuwait 3.2 Network Modeling 3.2.1 Transmission Lines and Cable Modeling The use of nominal pi-circuits [1,2] is usually restricted to the case of short lines when the line’s traveling time t is smaller than the integration step ∆t of the simulation. However, in many instances, such pi-section models can be used without excessive loss of accuracy, for studies such as line
ZSPS
SSMWW
FINTW
SHUBW
SLBYW
JAHRW DWPS SHKHWW
OMARWW
SSRDW
SSURW FRRDWW
JABRW
SALMW TOWNW
)3()W;V(P1PRn
1i
L
1ssi,swi∑ ∏
= =⎥⎦
⎤⎢⎣
⎡−=
Proceedings of the 2006 IASME/WSEAS International Conference on Energy & Environmental Systems, Chalkida, Greece, May 8-10, 2006 (pp416-424)
4
energization [3]. The parameters for the pi-section can readily be obtained from positive and zero sequence fundamental frequency impedance values that are used in load flow studies. In this paper, and in order to maintain accuracy, the traveling wave model with constant (frequency independent) distributed L and C and constant lumped R is used. This model can be justified by the fact that all TL in Kuwait power network have lengths less than 100 km. In this model the currents on N phases of a TL are functions of location x and time t, and are related by the partial differential equations
where R’, L’, and C’ are used to indicate distributed parameters. The input data for balanced 3-phase TL are given in mode quantities, that is one set of values R’, L’, and C’ must be provided for the ground return mode (zero sequence parameters), and another set of values for the line modes (positive sequence parameters). As per cable modeling, the constant parameter assumption can be too limiting, and a frequency dependent parameter model might be preferred, especially when the frequencies span a large bandwidth and the cable parameters significantly vary within this range [12]. Nevertheless, for solid dielectric cables, as is the case in the state of Kuwait, the constant parameter (frequency independent) model is often adequate. As reported in [11], it is practically accepted that cables can be equivalently represented as distributed parameters TL (similar to TL modeling), with values of surge impedance in the range of 27-30 Ohms. This latter option is adopted in the cable modeling in the present study. 3.2.2 Switchgear Modeling In non-statistical switching surge studies, the switch is often modeled as an ideal (zero impedance) conductor when closed, and an open circuit (infinite
impedance) when open. To allow for statistical studies, transient programs usually allow various options to vary the closing time ranging from one-shot deterministic closings to multi-shot statistical or systematic closings. For a single phase circuit, the set of circuit breaker closing times can be represented as a uniform distribution from 0 to 360 degrees with reference to the power frequency [12]. The standard deviation for a uniform distribution over 1 cycle is, ( )f32
1 where f is the frequency of
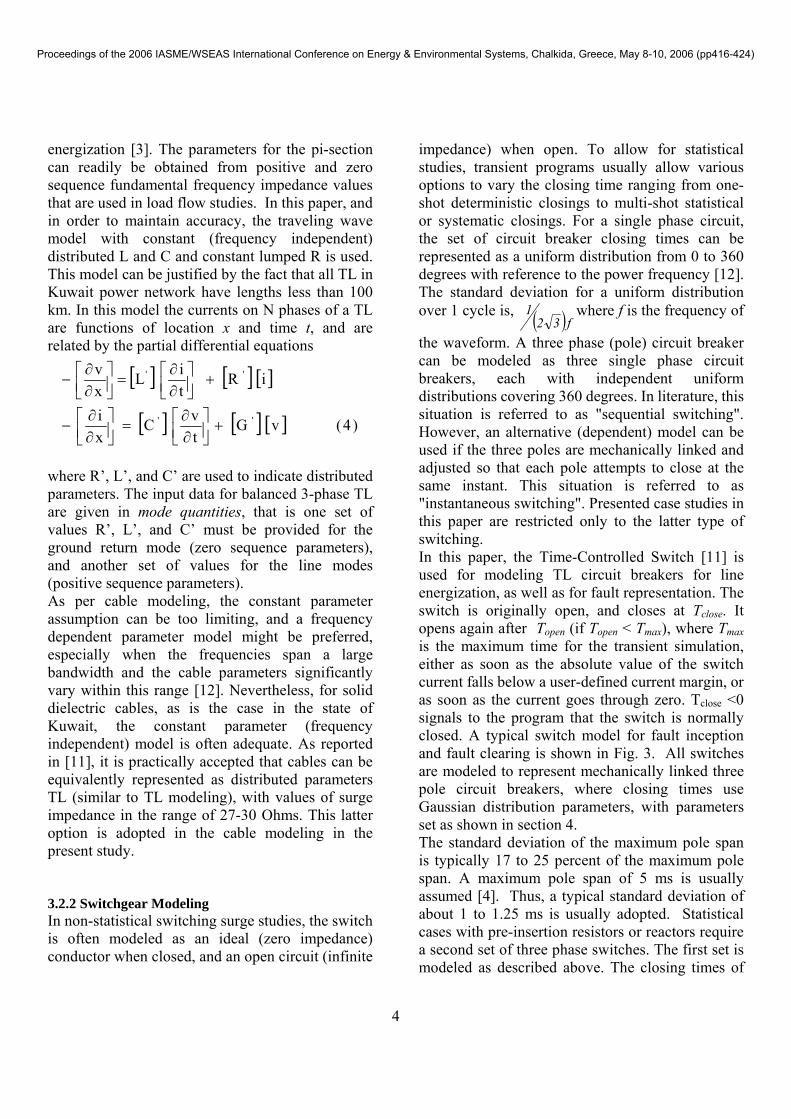
the waveform. A three phase (pole) circuit breaker can be modeled as three single phase circuit breakers, each with independent uniform distributions covering 360 degrees. In literature, this situation is referred to as "sequential switching". However, an alternative (dependent) model can be used if the three poles are mechanically linked and adjusted so that each pole attempts to close at the same instant. This situation is referred to as "instantaneous switching". Presented case studies in this paper are restricted only to the latter type of switching. In this paper, the Time-Controlled Switch [11] is used for modeling TL circuit breakers for line energization, as well as for fault representation. The switch is originally open, and closes at Tclose. It opens again after Topen (if Topen < Tmax), where Tmax is the maximum time for the transient simulation, either as soon as the absolute value of the switch current falls below a user-defined current margin, or as soon as the current goes through zero. Tclose <0 signals to the program that the switch is normally closed. A typical switch model for fault inception and fault clearing is shown in Fig. 3. All switches are modeled to represent mechanically linked three pole circuit breakers, where closing times use Gaussian distribution parameters, with parameters set as shown in section 4. The standard deviation of the maximum pole span is typically 17 to 25 percent of the maximum pole span. A maximum pole span of 5 ms is usually assumed [4]. Thus, a typical standard deviation of about 1 to 1.25 ms is usually adopted. Statistical cases with pre-insertion resistors or reactors require a second set of three phase switches. The first set is modeled as described above. The closing times of
[ ] [ ] [ ]
[ ] [ ] [ ] )4(vGtvC
xi
iRtiL
xv
''
''
+⎥⎦⎤
⎢⎣⎡∂∂
=⎥⎦⎤
⎢⎣⎡∂∂
−
+⎥⎦⎤
⎢⎣⎡∂∂
=⎥⎦⎤
⎢⎣⎡∂∂
−
Proceedings of the 2006 IASME/WSEAS International Conference on Energy & Environmental Systems, Chalkida, Greece, May 8-10, 2006 (pp416-424)
5
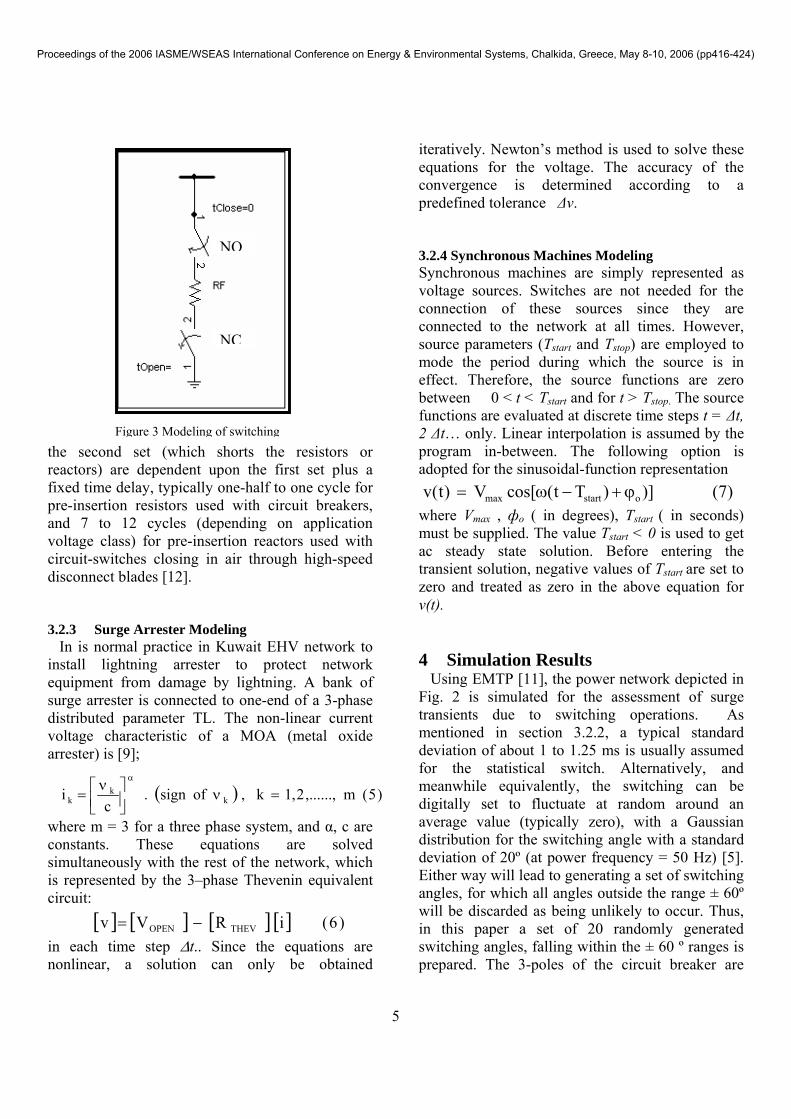
the second set (which shorts the resistors or reactors) are dependent upon the first set plus a fixed time delay, typically one-half to one cycle for pre-insertion resistors used with circuit breakers, and 7 to 12 cycles (depending on application voltage class) for pre-insertion reactors used with circuit-switches closing in air through high-speed disconnect blades [12]. 3.2.3 Surge Arrester Modeling In is normal practice in Kuwait EHV network to install lightning arrester to protect network equipment from damage by lightning. A bank of surge arrester is connected to one-end of a 3-phase distributed parameter TL. The non-linear current voltage characteristic of a MOA (metal oxide arrester) is [9];
where m = 3 for a three phase system, and α, c are constants. These equations are solved simultaneously with the rest of the network, which is represented by the 3–phase Thevenin equivalent circuit:
in each time step ∆t.. Since the equations are nonlinear, a solution can only be obtained
iteratively. Newton’s method is used to solve these equations for the voltage. The accuracy of the convergence is determined according to a predefined tolerance ∆v.
3.2.4 Synchronous Machines Modeling Synchronous machines are simply represented as voltage sources. Switches are not needed for the connection of these sources since they are connected to the network at all times. However, source parameters (Tstart and Tstop) are employed to mode the period during which the source is in effect. Therefore, the source functions are zero between 0 < t < Tstart and for t > Tstop. The source functions are evaluated at discrete time steps t = ∆t, 2 ∆t… only. Linear interpolation is assumed by the program in-between. The following option is adopted for the sinusoidal-function representation
where Vmax , фο ( in degrees), Tstart ( in seconds) must be supplied. The value Tstart < 0 is used to get ac steady state solution. Before entering the transient solution, negative values of Tstart are set to zero and treated as zero in the above equation for v(t). 4 Simulation Results Using EMTP [11], the power network depicted in Fig. 2 is simulated for the assessment of surge transients due to switching operations. As mentioned in section 3.2.2, a typical standard deviation of about 1 to 1.25 ms is usually assumed for the statistical switch. Alternatively, and meanwhile equivalently, the switching can be digitally set to fluctuate at random around an average value (typically zero), with a Gaussian distribution for the switching angle with a standard deviation of 20º (at power frequency = 50 Hz) [5]. Either way will lead to generating a set of switching angles, for which all angles outside the range ± 60º will be discarded as being unlikely to occur. Thus, in this paper a set of 20 randomly generated switching angles, falling within the ± 60 º ranges is prepared. The 3-poles of the circuit breaker are
)7()])Tt(cos[V)t(v ostartmax ϕ+−ω=
( ) )5(m,......,2,1k,ofsign.c
i kk
k =ν⎥⎦⎤
⎢⎣⎡ ν=
α
[ ] [ ] [ ] [ ] )6(iRVv THEVOPEN −=
NC
NO
Figure 3 Modeling of switching
Proceedings of the 2006 IASME/WSEAS International Conference on Energy & Environmental Systems, Chalkida, Greece, May 8-10, 2006 (pp416-424)
6
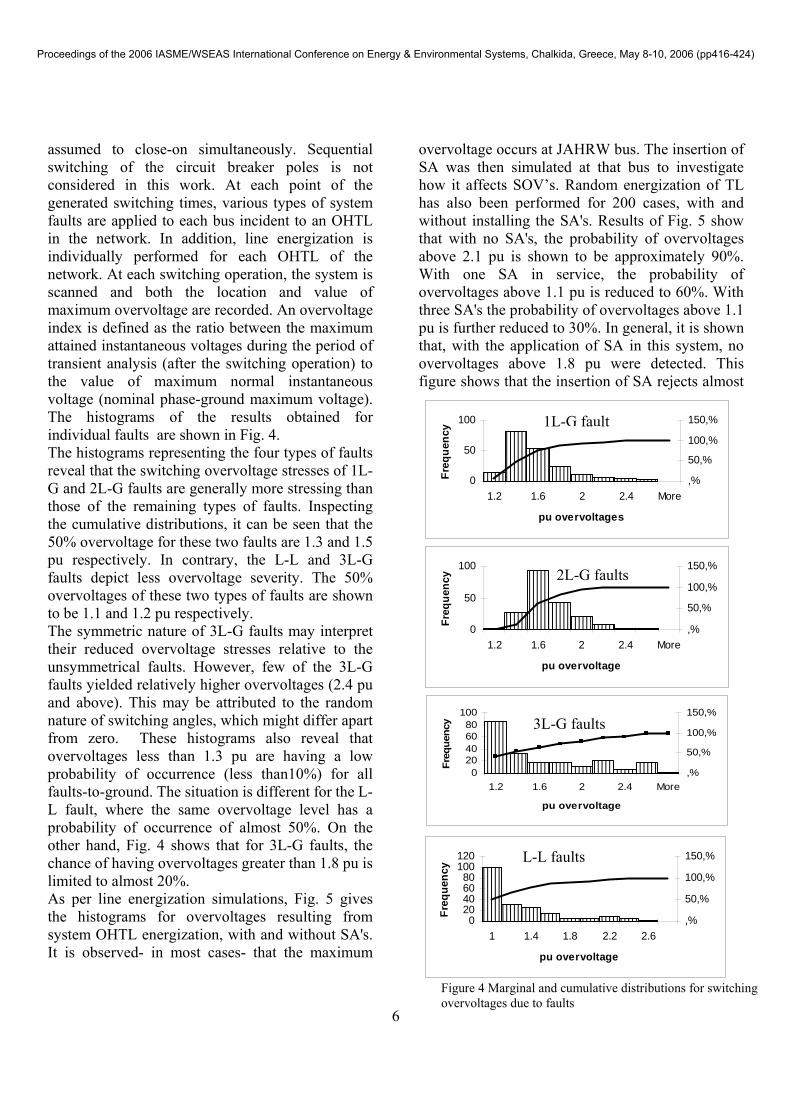
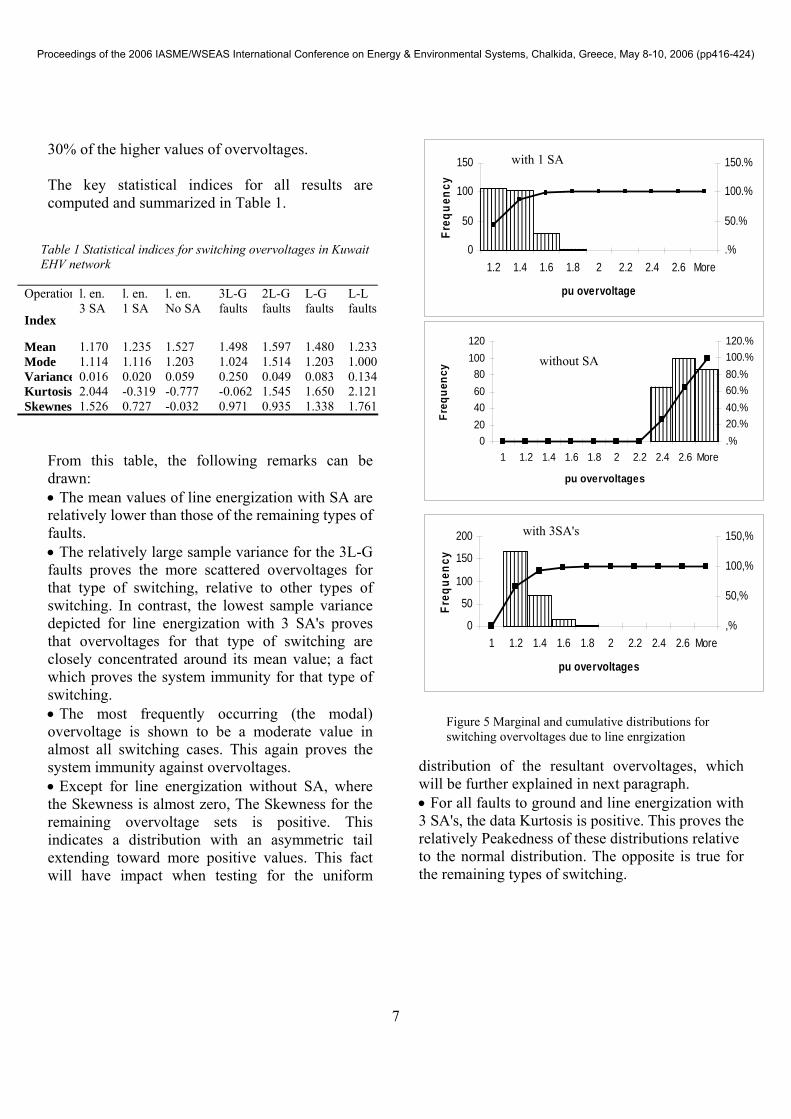
assumed to close-on simultaneously. Sequential switching of the circuit breaker poles is not considered in this work. At each point of the generated switching times, various types of system faults are applied to each bus incident to an OHTL in the network. In addition, line energization is individually performed for each OHTL of the network. At each switching operation, the system is scanned and both the location and value of maximum overvoltage are recorded. An overvoltage index is defined as the ratio between the maximum attained instantaneous voltages during the period of transient analysis (after the switching operation) to the value of maximum normal instantaneous voltage (nominal phase-ground maximum voltage). The histograms of the results obtained for individual faults are shown in Fig. 4. The histograms representing the four types of faults reveal that the switching overvoltage stresses of 1L-G and 2L-G faults are generally more stressing than those of the remaining types of faults. Inspecting the cumulative distributions, it can be seen that the 50% overvoltage for these two faults are 1.3 and 1.5 pu respectively. In contrary, the L-L and 3L-G faults depict less overvoltage severity. The 50% overvoltages of these two types of faults are shown to be 1.1 and 1.2 pu respectively. The symmetric nature of 3L-G faults may interpret their reduced overvoltage stresses relative to the unsymmetrical faults. However, few of the 3L-G faults yielded relatively higher overvoltages (2.4 pu and above). This may be attributed to the random nature of switching angles, which might differ apart from zero. These histograms also reveal that overvoltages less than 1.3 pu are having a low probability of occurrence (less than10%) for all faults-to-ground. The situation is different for the L-L fault, where the same overvoltage level has a probability of occurrence of almost 50%. On the other hand, Fig. 4 shows that for 3L-G faults, the chance of having overvoltages greater than 1.8 pu is limited to almost 20%. As per line energization simulations, Fig. 5 gives the histograms for overvoltages resulting from system OHTL energization, with and without SA's. It is observed- in most cases- that the maximum
overvoltage occurs at JAHRW bus. The insertion of SA was then simulated at that bus to investigate how it affects SOV’s. Random energization of TL has also been performed for 200 cases, with and without installing the SA's. Results of Fig. 5 show that with no SA's, the probability of overvoltages above 2.1 pu is shown to be approximately 90%. With one SA in service, the probability of overvoltages above 1.1 pu is reduced to 60%. With three SA's the probability of overvoltages above 1.1 pu is further reduced to 30%. In general, it is shown that, with the application of SA in this system, no overvoltages above 1.8 pu were detected. This figure shows that the insertion of SA rejects almost
Figure 4 Marginal and cumulative distributions for switching overvoltages due to faults
0
50
100
1.2 1.6 2 2.4 More
pu overvoltages
Freq
uenc
y
,%
50,%
100,%
150,%1L-G fault
020406080
100120
1 1.4 1.8 2.2 2.6
pu overvoltage
Freq
uenc
y
,%
50,%
100,%
150,%
0
50
100
1.2 1.6 2 2.4 More
pu overvoltage
Freq
uenc
y
,%
50,%
100,%
150,%2L-G faults
020406080
100
1.2 1.6 2 2.4 More
pu overvoltage
Freq
uenc
y
,%
50,%
100,%
150,%3L-G faults
L-L faults
Proceedings of the 2006 IASME/WSEAS International Conference on Energy & Environmental Systems, Chalkida, Greece, May 8-10, 2006 (pp416-424)
7
30% of the higher values of overvoltages. The key statistical indices for all results are computed and summarized in Table 1.
From this table, the following remarks can be drawn: • The mean values of line energization with SA are relatively lower than those of the remaining types of faults. • The relatively large sample variance for the 3L-G faults proves the more scattered overvoltages for that type of switching, relative to other types of switching. In contrast, the lowest sample variance depicted for line energization with 3 SA's proves that overvoltages for that type of switching are closely concentrated around its mean value; a fact which proves the system immunity for that type of switching. • The most frequently occurring (the modal) overvoltage is shown to be a moderate value in almost all switching cases. This again proves the system immunity against overvoltages. • Except for line energization without SA, where the Skewness is almost zero, The Skewness for the remaining overvoltage sets is positive. This indicates a distribution with an asymmetric tail extending toward more positive values. This fact will have impact when testing for the uniform
distribution of the resultant overvoltages, which will be further explained in next paragraph. • For all faults to ground and line energization with 3 SA's, the data Kurtosis is positive. This proves the relatively Peakedness of these distributions relative to the normal distribution. The opposite is true for the remaining types of switching.
Table 1 Statistical indices for switching overvoltages in Kuwait EHV network
Operation L-L faults
L-G faults
2L-G faults
3L-G faults
l. en. No SA
l. en. 1 SA
l. en. 3 SA
Index
1.2331.480 1.597 1.498 1.527 1.235 1.170 Mean 1.0001.203 1.514 1.024 1.203 1.116 1.114 Mode 0.1340.083 0.049 0.250 0.059 0.020 0.016 Variance2.1211.650 1.545 -0.062 -0.777 -0.319 2.044 Kurtosis 1.7611.338 0.935 0.971 -0.032 0.727 1.526 Skewnes
0
50
100
150
1.2 1.4 1.6 1.8 2 2.2 2.4 2.6 More
pu overvoltage
Freq
uenc
y
.%
50.%
100.%
150.%with 1 SA
0
50
100
150
200
1 1.2 1.4 1.6 1.8 2 2.2 2.4 2.6 More
pu overvoltages
Freq
uenc
y
,%
50,%
100,%
150,% with 3SA's
without SA
020406080
100120
1 1.2 1.4 1.6 1.8 2 2.2 2.4 2.6 More
pu overvoltages
Freq
uenc
y.%20.%40.%60.%80.%100.%120.%
Figure 5 Marginal and cumulative distributions for switching overvoltages due to line enrgization
Proceedings of the 2006 IASME/WSEAS International Conference on Energy & Environmental Systems, Chalkida, Greece, May 8-10, 2006 (pp416-424)
8
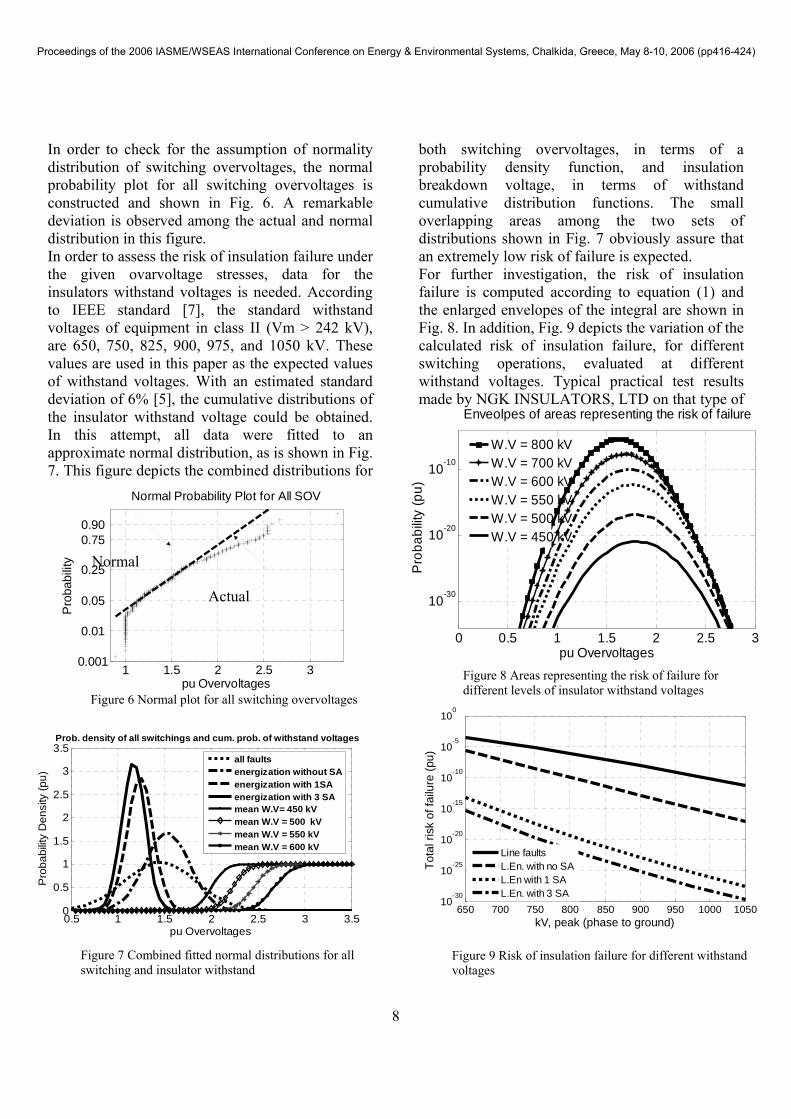
In order to check for the assumption of normality distribution of switching overvoltages, the normal probability plot for all switching overvoltages is constructed and shown in Fig. 6. A remarkable deviation is observed among the actual and normal distribution in this figure. In order to assess the risk of insulation failure under the given ovarvoltage stresses, data for the insulators withstand voltages is needed. According to IEEE standard [7], the standard withstand voltages of equipment in class II (Vm > 242 kV), are 650, 750, 825, 900, 975, and 1050 kV. These values are used in this paper as the expected values of withstand voltages. With an estimated standard deviation of 6% [5], the cumulative distributions of the insulator withstand voltage could be obtained. In this attempt, all data were fitted to an approximate normal distribution, as is shown in Fig. 7. This figure depicts the combined distributions for
both switching overvoltages, in terms of a probability density function, and insulation breakdown voltage, in terms of withstand cumulative distribution functions. The small overlapping areas among the two sets of distributions shown in Fig. 7 obviously assure that an extremely low risk of failure is expected. For further investigation, the risk of insulation failure is computed according to equation (1) and the enlarged envelopes of the integral are shown in Fig. 8. In addition, Fig. 9 depicts the variation of the calculated risk of insulation failure, for different switching operations, evaluated at different withstand voltages. Typical practical test results made by NGK INSULATORS, LTD on that type of
Figure 6 Normal plot for all switching overvoltages
1 1.5 2 2.5 30.001
0.01
0.05
0.25
0.75 0.90
pu Overvoltages
Pro
babi
lity
Normal Probability Plot for All SOV
Actual
Normal
Figure 9 Risk of insulation failure for different withstand voltages
650 700 750 800 850 900 950 1000 105010
-30
10-25
10-20
10-15
10-10
10-5
100
kV, peak (phase to ground)
Tota
l ris
k of
failu
re (p
u)
Line faultsL.En. with no SAL.En with 1 SAL.En. with 3 SA
0 0.5 1 1.5 2 2.5 3
10-30
10-20
10-10
pu Overvoltages
Pro
babi
lity
(pu)
Enveolpes of areas representing the risk of failure
W.V = 800 kVW.V = 700 kVW.V = 600 kVW.V = 550 kVW.V = 500 kVW.V = 450 kV
Figure 8 Areas representing the risk of failure for different levels of insulator withstand voltages
0.5 1 1.5 2 2.5 3 3.50
0.5
1
1.5
2
2.5
3
3.5
pu Overvoltages
Pro
babi
lity
Den
sity
(pu)
Prob. density of all switchings and cum. prob. of withstand voltages
all faultsenergization without SAenergization with 1SAenergization with 3 SAmean W.V= 450 kVmean W.V = 500 kVmean W.V = 550 kVmean W.V = 600 kV
Figure 7 Combined fitted normal distributions for all switching and insulator withstand
Proceedings of the 2006 IASME/WSEAS International Conference on Energy & Environmental Systems, Chalkida, Greece, May 8-10, 2006 (pp416-424)
9
insulators yielded withstand voltage level of 1291 and 1355 kV (with and without arcing horn respectively). Obviously, in view of Fig. 9, a negligibly small value for the risk of failure is obtained. In general, the statistical analysis presented is this paper is general and independent of the network under study. 5 Conclusion A statistical analysis to switching overvoltages in Kuwait EHV network has been outlined in this paper. The network has been modeled on EMTP and random switching events have been simulated. Results show that faults to ground generally depict higher transient voltages than L-L faults. The insertion of SA at the critical buses lead to a reduction in SOV up to 40%, while rejected almost 30% of the higher overvoltages The risk of insulation failure for the network has been evaluated for different insulation withstand levels. According to the specifications of the actual insulator used in the network, the risk of failure is negligibly small. The effect of pollution has not been considered in the present study. A further research is expected to incorporate the effect of sequential switching, rather than simultaneous switching, in the present analysis. 6 References [1] A. S. Farag, M.H. Shewhdi, M. A. Sularab, and T.C. Cheng, "Risk-of- failure calculation accuracy," IEEE I. Sym. on Electrical Insulation, Arlington, Virginia USA, 1998, June 7-10 1998, pp. 507-512. [2] M. R. Garvic, “Method of equal probability overvoltages for calculating risk of failure of power transmission lines," IEEE Proceedings - C, Vol. 138, No. 1, Jan. 1991, pp. 19-26. [3] M. Hamed and D. Esmail, “Statistical study for switching processes in compensated UHV transmission systems," IEEE Proceeding Gener., Transm., Distrib., Vol. 144, No. 3, May 1997, pp. 237-241. [4] M. Morcos and H. Anis,” Random energization transients in EHV systems, “.IEE Proceedings, Vol. 136, No. 6, Nov.1989, pp. 325-330.
[5] M. M. Morcos, “Phase to ground switching transients in EHV systems, “IEEE, 1990, pp. 203-210 [6] A. H. Mahdy. A. El-Morshedy and H. L. Anis,” Insulation failure assessment under random energization," 0-7803-0634-1/92$03.00©IEEE, pp. 1647-1652. [7] EEE Std 1313.1- 1996. [8] E. Kuffel and W. S. Zaengl, High Voltage Engineering Fundamentals, Pergamon Press, 1984. [9] W. M. Al-Hasawi and N. H. Abbasy, "Evaluation of switching transient overvoltages in Kuwait EHV network using EMTP.” EPSRJ. Vol. 52. No.2, November 1999, Issue 52/2. [10] Statistical year Book, State of Kuwait, Ministry of Electricity and Water, 2004. [11] Microtran EMTP Theory Book, Microtran Power System Analysis Corporation, 1992. [12] Task Force Report: Modeling Guidelines for Switching Transients, IEEE PES Switching Transients Task Force 15.08.09.03 Contributing Members: A.M. Gole, et; al.
Proceedings of the 2006 IASME/WSEAS International Conference on Energy & Environmental Systems, Chalkida, Greece, May 8-10, 2006 (pp416-424)