transforming events with beacon technology
TRANSCRIPT
July 21 to July 22, 2015 Boston Quincy Marriott, Quincy, MA
Transforming Events with Beacon Technology
Michael Younder, VP of Growth

2
§ Reality check of the event space § What are Beacons and how do they work? § How do Beacons drive analytics? § Benefits of Beacons and data analytics § What about privacy? § Brief case study: Infiniti
This Afternoon
3
§ What hosts and exhibitors need and want from shows today: engagement � Hosts want a busy event with content resonating
with attendees and activity appealing to exhibitors and sponsors
� Exhibitors and sponsors want to be with the right prospects and see proof that this is the right show to come back to
Reality Check
4
§ How events and trade shows are supported today: � Hardcopy resources like agendas, maps and sign-in
sheets � Mobile apps � Badge scanning hardware for lead capture and
traffic management � Intuition and subjectivity (“the show looks busy”)
§ But…
Reality Check

5
§ More can be done in capturing and understanding the physical activity of those present at an event
§ Events that understand attendees are the most successful: � Hosts can get increased revenue from exhibitors
together with reduced churn � Exhibitors can get the clearest line of sight yet on
booth activity for qualified lead generation
Reality Check

6
Reality Check – Host Perspective
We just finished hosting our 3 day event
Without Beacons With Beacons
Where did attendees congregate the most?
I’ll poll my event team and get feedback
A heat map can show me exactly where peopled
dwelled the longest
We need to look for areas to cut costs
Have review with my ops team, look at
questionnaires, make some guesses and
assumptions
A traffic map can show the flow of people across
different areas or floors to show where I don’t need
space
Exhibitors thought there wasn’t enough traffic
Scanner data will show people engaged… I’ll
check for more details
For each booth and zone (e.g. demo or seminar), I can see total attendance,
total time spent and return visits

7
Reality Check – Exhibitor Perspective
Thank you for coming to our booth Simon
Without Beacons With Beacons
I forgot, were you there? Only if I scanned you Yes
When did you come by? Only if I scanned you 9:45 AM
How long did you stay? I don’t remember – 5 minutes?
13 minutes
Is this your second trip to the booth?
Only if I scan you again No, you’ve come by three times
Did you see a demo? I can’t remember – maybe…
Yes, you spent 4 minutes watching it
What else did you see before coming here?
I don’t know unless I ask A seminar and related content on the show floor
8
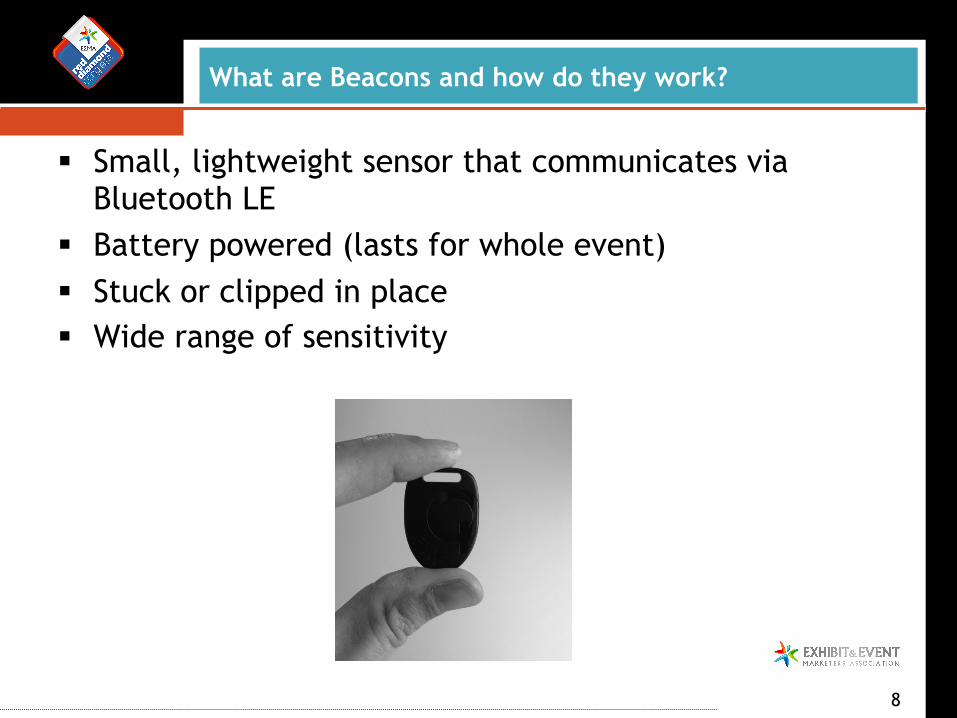
§ Small, lightweight sensor that communicates via Bluetooth LE
§ Battery powered (lasts for whole event) § Stuck or clipped in place § Wide range of sensitivity
What are Beacons and how do they work?

9
What are Beacons and how do they work?

10
What are Beacons and how do they work?
Sens
or
… or by a show app via phone
BLE
11
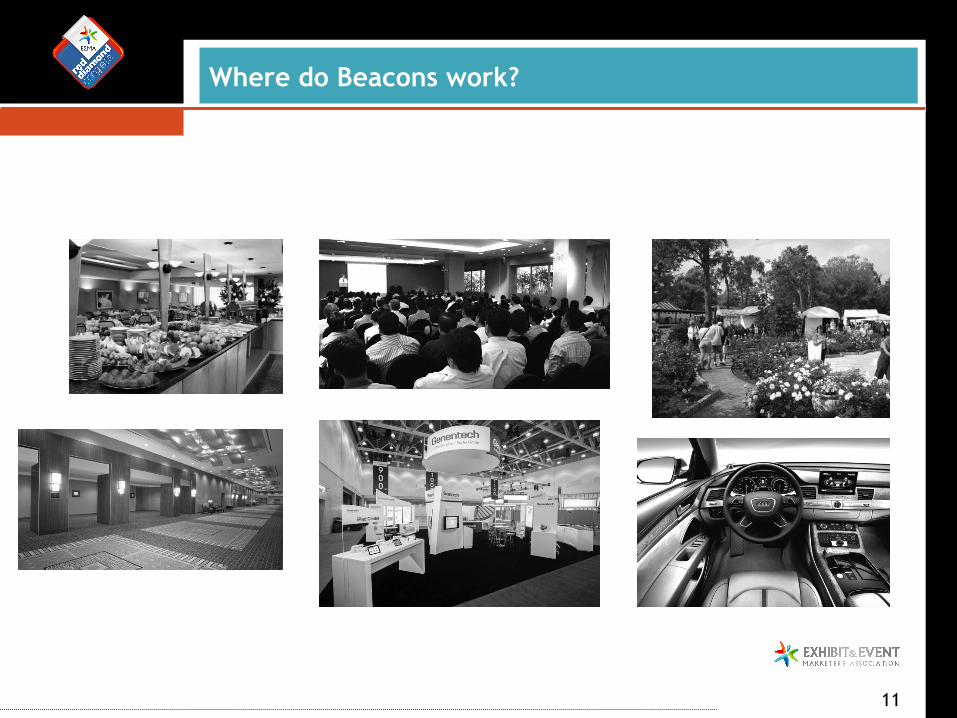
Where do Beacons work?
12
§ Beacons are much less expensive when the event size, hardware and deployment effort are considered
§ More flexible than RFID and easier to deploy (i.e. lighter, less cumbersome equipment)
§ Beacons offer greater coverage (up to 30 times greater) and accuracy (foot versus feet)
RFID versus Beacon

13
RFID versus Beacon
14
§ By explaining what a busy show or booth is and what that means to the host and exhibitor
§ By showing data in multiple dimensions (visits, dwell time and interest)
§ By knowing where someone is, and driving proximity based messages and content that can then be tracked
How do Beacons drive analytics?

15
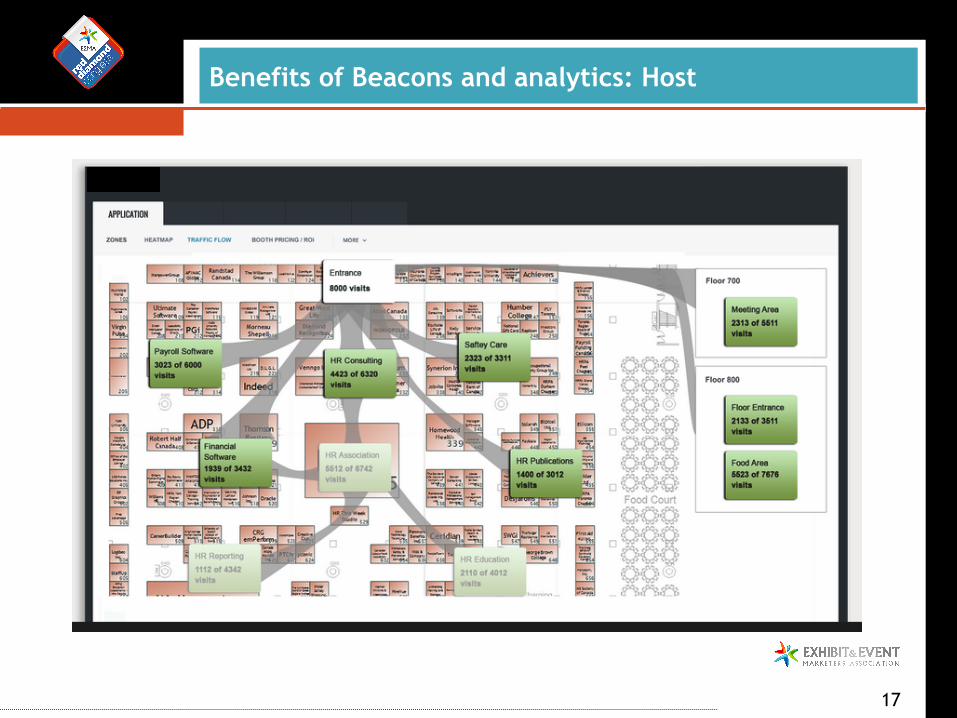
§ Hard data supporting booth and sponsor traffic: � Reduce booth churn and increase profile of the show
with activity reports: § Traffic per booth, aisle, cross section § Dwell time in sponsored or trade areas § Number of return visits
� Wins the business case for investing in solution (based on booth rental and sponsorship rates won)
Benefits of Beacons and analytics: Host

16
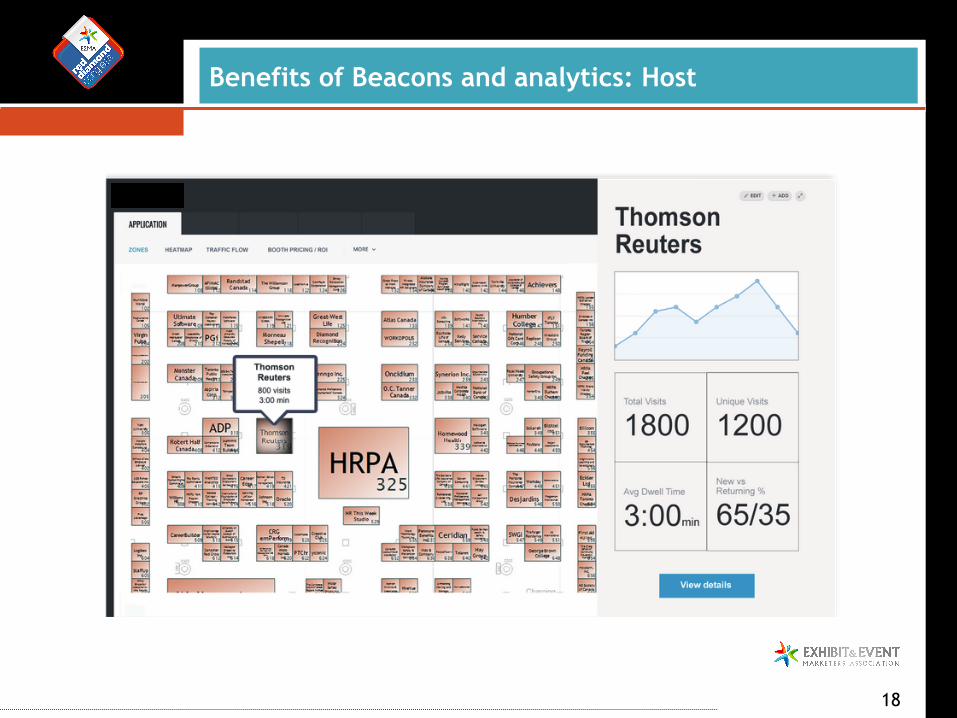
§ Proof of attendee engagement (which part of the show got the most traffic and longest attention span) towards better planning
§ Operational insights (e.g. help better determine where resources are needed via traffic flow maps add content about dark areas)
§ Proximity based message delivery to attendees
Benefits of Beacons and analytics: Host
17
Benefits of Beacons and analytics: Host
18
Benefits of Beacons and analytics: Host

19
Benefits of Beacons and analytics: Host

20
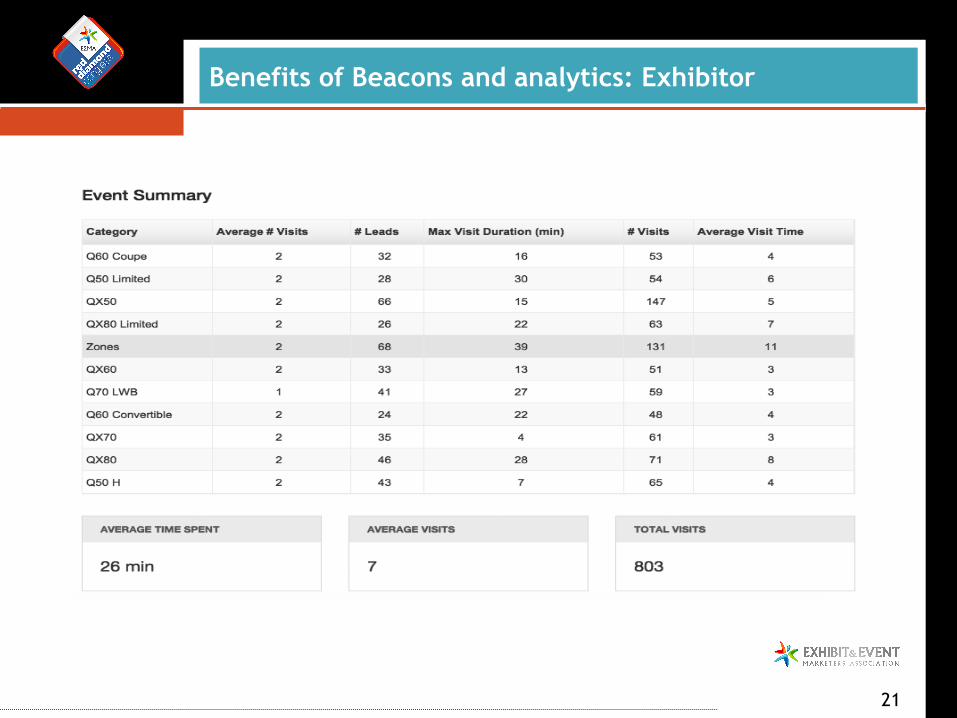
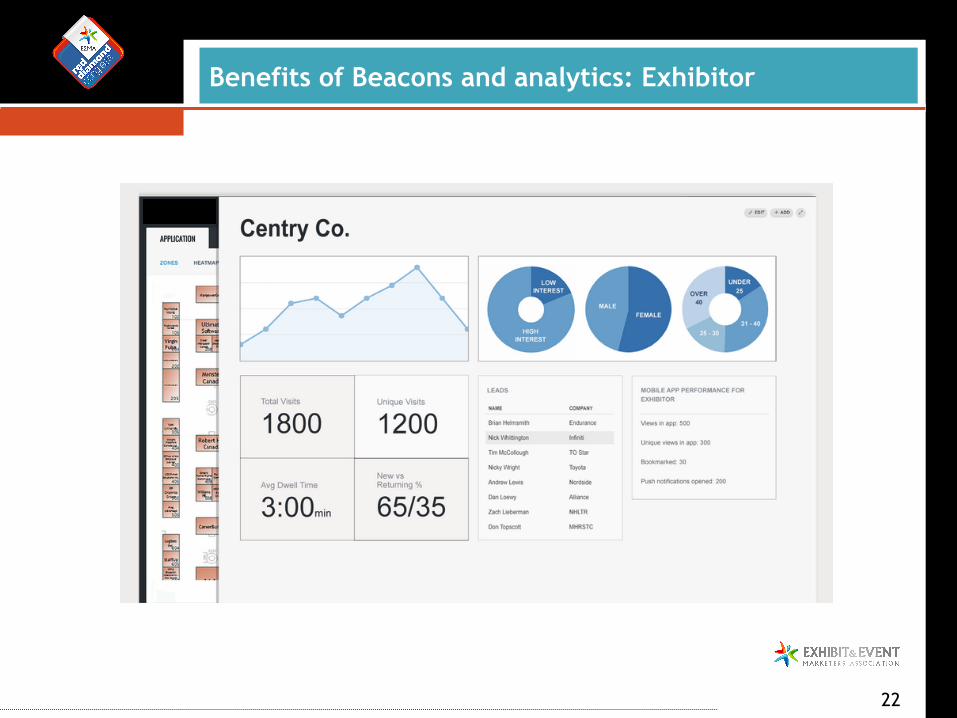
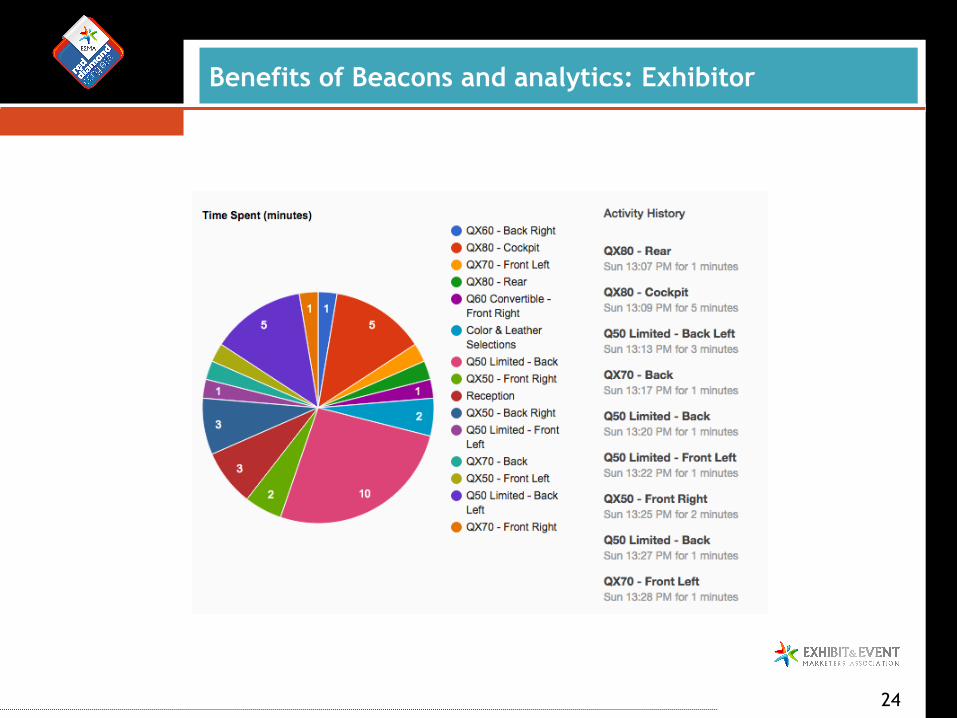
§ Get qualified lead information: who do you call on Monday?
§ Know how long someone spent in a booth § Know how many times someone visited a booth § Know other show content that is most appealing to
attendees § Easy and simple data collection (no need to chase
people and grab badges)
Benefits of Beacons and analytics: Exhibitor
21
Benefits of Beacons and analytics: Exhibitor
22
Benefits of Beacons and analytics: Exhibitor

23
Benefits of Beacons and analytics: Exhibitor
24
Benefits of Beacons and analytics: Exhibitor
What about privacy?
§ Events and shows are fairly public to begin with: � Attendees walk around with big name tags � Attendees are shown on delegate lists or
questionnaires � Attendees are scanned during the event (sometimes
mandatory for admission) � Event apps capture usage patterns and profile data
from attendees � Attendees are captured on security footage
25

What about privacy?
§ Beacon technology is a variation of tracking already being done, however: � It can be modified to show anonymous traffic data � It can be deployed on an opt-out basis at registration � By taking sample data of a large population, not
everyone needs to be tracked: § Example: a 5,000 person event can have 588 attendees
tracked to achieve 99% +/- 5% confidence interval
26
Case Study: Infiniti Cars
27
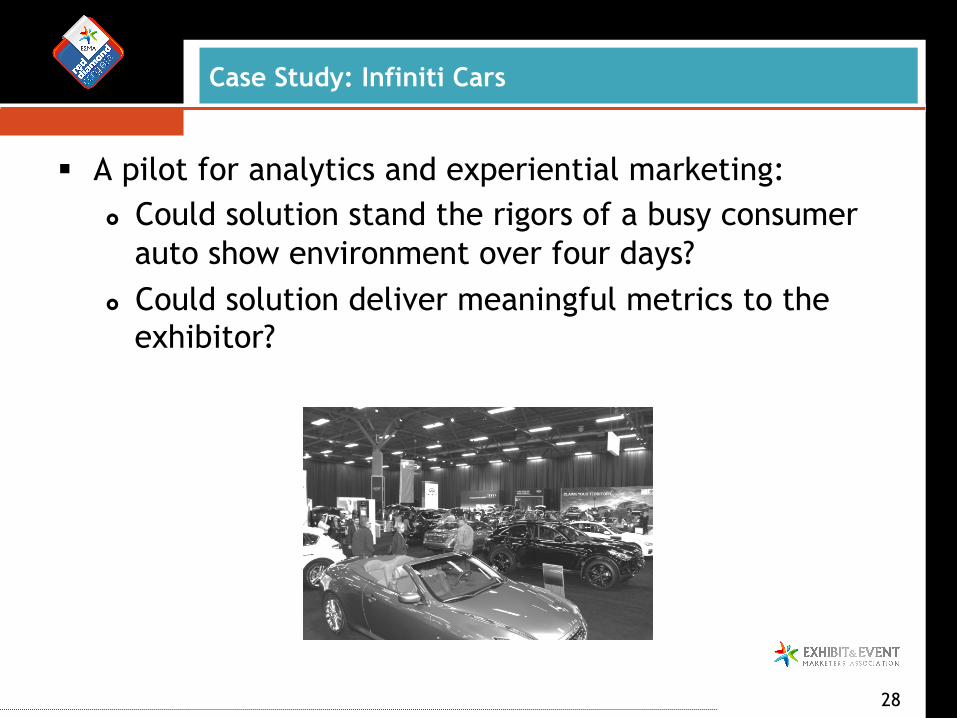
Case Study: Infiniti Cars
§ A pilot for analytics and experiential marketing: � Could solution stand the rigors of a busy consumer
auto show environment over four days? � Could solution deliver meaningful metrics to the
exhibitor?
28

Case Study: Infiniti Cars
§ Light up the booth: � 10 cars and 3
zones included for show duration
� 66 tracked locations in total
� 100 booth visits simulated
� 15.7 million data pings
29

Case Study: Infiniti Cars
§ Rigors of the show floor? � No technical issues
experienced � Misplaced only a
few of the 66 sensors after 4 days
� Manual intervention was minimal
30
Overall Conclusions
§ Reality check of the event space: � Engagement is the word for hosts and exhibitors, to
resonate with the right audience � There’s room for improvement: with Beacons versus
without § What are Beacons and how do they work?
� They’re small, easy to use and deploy, accurate and better than RFID
� They can be deployed in lanyards or via an event app � They can work everywhere
31
Overall Conclusions
§ How do Beacons drive analytics? � They define what “busy” means while delivering
powerful insight into show activity § Benefits of Beacons and data analytics:
� The host gets a clear line of sight on show traffic, supporting tighter operations, reduced churn and a better ROI
� Exhibitors get qualified leads and a clear justification on their investment in the show
32

Overall Conclusions
Privacy: � Beacon technology is a variation on a theme to
what’s been tracked today (albeit, better) � Solution is flexible and can accommodate attendee
opt-out where necessary � Not everyone needs to be tracked in order to have a
meaningful sample of data
33

Questions?
34

Contact
Michael Younder VP, Growth Panvista Mobile [email protected] More here: panvistamobile.com/features or find us at the Red Diamond Congress
35