transformationsof biogenic particulates from the pelagic ... et al 99 dsrii… · in addition to...
TRANSCRIPT

*Corresponding author. National Institute of Water and Atmospheric Research, Centre for Chemicaland Physical Oceanography, Department of Chemistry, University of Otago, Dunedin, New Zealand. Fax:0064-3-479-5248.
E-mail address: [email protected] (P.W. Boyd)1Present Address: UC Berkeley National Laboratory, One Cyclotron Road, M/S 90-1116, Berkeley, CA
94720, USA.
Deep-Sea Research II 46 (1999) 2761}2792
Transformations of biogenic particulates from thepelagic to the deep ocean realm
P.W. Boyd!,*, N.D. Sherry!, J.A. Berges", J.K.B. Bishop#,1,S.E. Calvert!, M.A. Charette$, S.J. Giovannoni%, R. Goldblatt!,
P.J. Harrison!, S.B. Moran$, S. Roy&, M. Soon!, S. Strom',D. Thibault&, K.L. Vergin%, F.A. Whitney), C.S. Wong)
!School of Earth and Ocean Sciences, University of British Columbia, Vancouver, BC, Canada V6T 1Z4"School of Biology and Biochemistry, Queen's University, Belfast Northern Ireland, BT9 7BL, UK
#School of Earth and Ocean Sciences, University of Victoria, Victoria, BC, Canada$Graduate School of Oceanography, University of Rhode Island, Narragansett, RI 02882, USA
%Department of Microbiology, Oregon State University, Corvallis, OR 97331, USA&INRS-Oceanologie, 310 Allee des Ursulines, Rimouski, Quebec, Canada G5L 3A1.
'University of Western Washington, Bellingham, WA, USA)Institute of Ocean Sciences, DFO, P.O. Box 6000, Sidney, BC, Canada V8L 4B2
Received 18 February 1998; received in revised form 4 September 1998; accepted 4 September 1998
Abstract
This overview compares and contrasts trends in the magnitude of the downward ParticulateOrganic Carbon (POC) #ux with observations on the vertical pro"les of biogeochemicalparameters in the NE subarctic Paci"c. Samples were collected at Ocean Station Papa (OSP,503N, 1453W), between 18}22 May 1996, on pelagic stocks/rate processes, biogenic particle#uxes (drifting sediment traps, 100}1000 m), and vertical pro"les of biogeochemical parametersfrom MULVFS (Multiple Unit Large Volume Filtration System) pumps (0}1000 m). Evidencefrom thorium disequilibria, along with observations on the relative partitioning of particlesbetween the 1}53 lm and '53 lm classes in the 50 m mixed layer, indicate that there was littleparticle aggregation within the mixed layer, in contrast to the 50}100 m depth stratum whereparticle aggregation predominated. Vertical pro"les of thorium/uranium also provided
0967-0645/99/$ - see front matter ( 1999 Elsevier Science Ltd. All rights reserved.PII: S 0 9 6 7 - 0 6 4 5 ( 9 9 ) 0 0 0 8 3 - 1

evidence of particle decomposition occuring at depths ca. 150 m; heterotrophicbacteria and mesozooplankton were likely responsible for most of this POC utilisation.A water column carbon balance indicated that the POC lost from sinking particles was thepredominant source of carbon for bacteria, but was insu$cient to meet their demands over theupper 1000 m. While, the vertical gradients of most parameters were greatest just below themixed layer, there was evidence of sub-surface increases in microbial viability/growth rates atdepths of 200}600 m. The C:N ratios of particles intercepted by free-drifting and deep-mooredtraps increased only slightly with depth, suggesting rapid sedimentation even though this regionis dominated by small cells/grazers, and the upper water column is characterised by longparticle residence times ('15 d), a fast turnover of POC (2 d) and a low but constantdownward POC #ux. ( 1999 Elsevier Science Ltd. All rights reserved.
1. Introduction
The fate of particulate organic matter originating in the upper ocean is controlledby the relationship between pelagic particle production and the resulting transforma-tions of such particles in transit to the deep ocean (Peinart et al., 1989; Silver andGowing, 1991). The magnitude of change in biogenic particle #ux with depth has beenestimated primarily using sediment traps deployed at a range of depths (e.g. Martinet al., 1987). In several cases the timing and the magnitude of pelagic events suchas the spring bloom, as recorded by primary production measurements, have beencompared and contrasted with the corresponding signal at depth in free-driftingand/or deep-moored sediment traps (Asper et al., 1992; Karl et al., 1996). However,while POC #uxes from traps provide a record of the attenuation of the bulkparticulate signal, they o!er few insights into the processes that may in#uencethe transformation of biogenic particles as they sink to depth (Boyd and Stevens,submitted).
In the last decade, studies have elucidated processes that will in#uence stronglyboth the magnitude of the downward particle #ux and the depth strata at whichprocess-speci"c particle transformations occur in the water column. In the mixedlayer region, Boyd and Newton (1995,1999) reported that planktonic communitystructure may strongly in#uence the magnitude of the downward particulate#ux. Indeed, based on marine snow vertical pro"les from mounted underwatercamera systems, the upper ocean is the primary site for aggregate formation inthe NE Atlantic (Lampitt et al., 1993a). Using microscopy, such aggregates havebeen shown to be heterogeneous in nature (Lochte and Turley, 1989; Lampittet al., 1993b). Others have revealed the importance of phytoplankton abundance/coagulation (Jackson, 1990), biological glues (Dam and Drapeau, 1995), andother modes of particle interactions (see reviews by Turley, 1992; Kepkay, 1994)in the initiation of aggregation &events' between particles in the upper ocean. Inthis zone, radionuclide studies have provided estimates of particle residence times(Coale and Bruland, 1985), and disaggregation rate constants (Murnane et al.,1996).
2762 P.W. Boyd et al. / Deep-Sea Research II 46 (1999) 2761}2792

In addition to studies of particle formation, other research has focussed on thefactors controlling the breakdown of particles, such as heterotrophic bacterial activ-ity, or the activity of interzonal migrating mesozooplankton (Longhurst et al., 1990).There are marked vertical gradients in bacterial activity (Hoppe et al., 1993) and thedegree of particle solubilisation over the upper 500 m depth stratum (Karl et al., 1988;Smith et al., 1992). Azam et al. (1995) and Christian and Karl (1995) have identi"edand characterised bacterial enzyme systems responsible for solubilisation processes.Giovannoni et al. (1990,1995) and Fuhrman and Davis (1997) have reported theexistence of distinct bacterial groups occupying discrete depth strata. Such processesof particle aggregation and breakdown may be re#ected by the observed verticalgradients of biological, biochemical and/or geochemical parameters. Thus, changeswith depth in the signatures associated with microbial activity (Karl and Knauer,1984), organic constituents (Wakeham and Canuel, 1988), stable isotopes (Altabetet al., 1991), and particle populations (Bishop et al., 1999) may be indicative of changesin the dominant particle transformation processes throughout the water column.
Although the 30 year Ocean Station Papa (OSP) time series is relatively compre-hensive for the open ocean (Banse, 1991), virtually all of these data were obtained fromthe upper 200 m. Similarly, the SUbarctic Paci"c Ecosystem Research (SUPER)programme focused primarily on pelagic foodweb processes (Miller, 1993). Prior tothe present study, the main biogeochemical water column research conducted atdepth in this region was by the VERTical EXchange (VERTEX) programme (Martinet al., 1987). In addition, Takahashi (1986) analysed data obtained from a deep-moored sediment trap deployed at OSP in the 1980s. Thus, relatively few studies inthis region have examined biogeochemical processes at depth. Joint consideration ofthe vertical gradients of biogenic particulate #uxes and of the processes transformingparticles within depth strata may lead to a better mechanistic understanding of thefactors controlling downward POC #ux in this region.
The data presented here represent a synthesis of the majority of the vertical processstudies from surface waters to ca. 4 km depth carried out during a 5-d occupation ofOSP as part of the Joint Global Ocean Flux Study-Canada (JGOFS-Canada).
2. Methods/datasets
Data were available on vertical processes at "ve stations from the coastal (stationP04, 48 393N, 126 403W) to the open ocean (OSP; 503N, 1453W); see map in Whitneyand Freeland (1999) from six cruises between September 1995 and June 1997. Consid-eration of all data was beyond the scope of this overview, which instead attempts tosynthesise data obtained at OSP between 18}22 May 1996. Although the synthesis isbased on a 5-d period at one location, it is more than likely representative of a largerregion of ocean, over a wider time period. The OSP region is characterised by weakupper ocean current #ows (which decrease with depth) from west to east (Tabata,1975; Bograd et al., 1999), and pelagic biological observations to the west and the eastof OSP indicate that the waters are High Nitrate Low Chlorophyll (HNLC) incharacter (see discussion in Boyd et al., 1998). Bishop et al. (1999) report that based on
P.W. Boyd et al. / Deep-Sea Research II 46 (1999) 2761}2792 2763

Table 1Observed seasonal variations (winter versus summer) in (A) ecosystem components, (B) downward biogenic#ux processes at OSP
Parameter Seasonal variation Data source
(A)Chlorophyll a 2 fold Parslow (1981)!; Boyd and Harrison (1999)Primary production 3}4 fold Wong et al. (1995); Boyd and Harrison (1999)Algal size structure" (2 fold Welschmeyer et al. (1993); Boyd and Harrison
(1999)Heterotrophic bacterial biomass 2 fold Boyd et al. (1995a); Sherry et al. (1999)Heterotrophic bacterial production 3-fold Boyd et al. (1995b); Sherry et al. (1999)Microzooplankton biomass 2-fold Boyd et al. (1995a)Microzooplankton grazing 3-fold Boyd et al. (1995b)Mesozooplankton biomass 35-fold# Fulton (1978)
(B)Downward POC #ux 3-fold Charette et al. (1999)Export ratio (2 fold Charette et al. (1999)Upper ocean POC levels 2-fold Bishop et al. (1999)f ratio (2-fold Varela and Harrison (1999)Heterotrophic bacterial respiration (3 fold Sherry et al. (1999)Faecal pellet production 2 fold Thibault et al. (1999)DOC levels #10 lmol Kg~1 $ Wong et al. (1999a)DIC levels #10 lmol Kg~1 $ Wong et al. (1999a)
!Denotes occasional evidence of ten-fold increases in chlorophyll a levels, interpreted by Boyd et al. (1998)to represent episodic Fe-mediated diatom blooms."Based on size-fractionated production and biomass data.#Denotes variations due to seasonal ontogenetic migration of copepods.$Denotes seasonal change over &growth season'.
surveys of POC levels, using optical characterisation, the POC "eld was relativelyuniform in the vicinity of OSP (scale of kms) in May 1996. Furthermore, OSP ischaracterised by relatively low seasonality with respect to phytoplankton processescompared to other regions such as the NE Atlantic (Parsons and Lalli, 1988). The lowseasonality at OSP likely impacts that observed for foodweb and vertical processes(see Table 1).
The majority of the data presented are subsets of other studies in this volume, andthe complete dataset from stations P04-OSP in all seasons, and the methodologiesemployed, are presented in the respective papers (Table 2). The data presented may bedivided into three groups: "rstly the potential source material for particulate aggreg-ates, as represented by particles that are components of (such as ciliates) or are derivedfrom (such as faecal pellets) the pelagic foodweb and associated trophic interactions.Such particles will henceforth in this study be referred to as the &living' particlepopulation. Secondly, data relating to particle aggregation in the upper ocean(0}100 m depth) such as 234Th activity distributions, or size distributions for Partic-ulate Organic Carbon (POC); both obtained (as were the majority of the data
2764 P.W. Boyd et al. / Deep-Sea Research II 46 (1999) 2761}2792

Table 2Summary of the suite of measurements carried out in May 1996 at OSP. Details of the depth range ofsampling over the water column, and the source of the methodologies employed are included
Measurement Depth range Source
Phytoplankton processes 0}50 m Boyd and Harrison (1999)Heterotrophic bacterial processes 0}1000 m Sherry et al. (1999)Mesozooplankton faecal pellet production 0}100 m Thibault et al. (1999)POC/PON levels 0}1000 m Bishop et al. (1999)POC and PON downward #ux 0}1000 m drifting traps Wong et al. (1999)Algal protease activity 0}1000 m Berges and Falkowski (1996)234Th/238U 0}1000 m Charette et al. (1999)Algal pigments 0}1000 m Thibault et al. (1999)Community Respiration 0-1000 m Sherry et al. (1999)d13C-POC 0}1000 m Wu et al. (1999)POC/PON downward #ux 1000 and 3800 m traps Wong et al. (1999)RNA/DNA ratio 0}1000 m Kemp (1995)
presented here) from the MULVFS pumps (Multiple Unit Large Volume FiltrationSystem, see Bishop et al., 1985). Thirdly, data indicative of particle-removal/trans-formations } such as solubilisation/respiration or mesozooplankton grazing in theupper ocean and in midwater.
Ancillary data, on chlorophyll a #uorescence from a bio-optical mooring in thevicinity of OSP, were obtained every 10 min (mean of 60 readings) from a calibratedBiospherical Instruments INF-300 #uorometer deployed at ca. 30 m (depth range$1.5 m over 14 d) below the ocean surface. These data provided estimates oftemporal variability in chlorophyll a levels over this period, and thus of whether thealgal biomass levels observed during the May 18}22 occupation of OSP wererepresentative of events before or after this period (Fig. 1); particles intercepted byfree-drifting sediment traps at depth between May 18}22 probably originated in themixed layer prior to when the May pelagic measurements were made.
Data on the size/abundance of pelagic particles were used to construct a &living'particle size-distribution (after Sheldon et al., 1972), and these data were transformedusing published bipovolume conversions (see Table 3) into estimates of POC for eachcomponent of the foodweb (Table 4). This enabled a comparison of the partitioning,into size-classes, of the calculated &living' POC with that of POC collected by theMULVFS pumps in the upper ocean (Bishop et al., 1999).
The magnitude of observed downward POC #uxes during late May 1996 wascompared with those predicted from an existing vertical #ux modelling approach(Boyd and Newton, 1995,1999; Fig. 2 in present study). The model (Michaels andSilver, 1988) was used in conjunction with data on size-fractionated primary andbacterial production (see Fig. 2 Legend) to predict the downward POC #ux from themixed layer, and as employed by Boyd and Newton, the #ux from the mixed layer wasextrapolated to 100 m using a published algorithm (Bender et al., 1993).
P.W. Boyd et al. / Deep-Sea Research II 46 (1999) 2761}2792 2765

Fig. 1. Time-series of chlorophyll a levels obtained from a moored #uorometer (solar-stimulated #uores-cence, no data during darkness) at 30 m depth in the vicinity of OSP during May 1996 } prior to and afterthe occupation of OSP } (mixed layer depth was ca. 50 m). The instrument was calibrated (using discretesamples) both at the start and end of a 100 d deployment.
Table 3Summary of the data sources for the abundance of each foodweb component, and of the carbon/biovolumeconversion (including carbon : chlorophyll a ratio) factors used to convert the abundances of the compo-nents of the mixed layer at OSP in May 1996 to units of carbon
Foodweb component Data source Biovolume reference
Phytoplankton! Boyd (unpublished) Strathmann (1967); Montagneset al. (1994)
Size-fractionated chlorophyll a Boyd and Harrison (1999) Booth et al. (1993)Heterotrophic bacteria! Sherry et al. (1999) Kirchman et al. (1993)Heterotrophic #agellates! Boyd (unpublished) Borshiem and Bratbak (1987)Cyanobacteria! Sherry (unpublished) Booth et al. (1993)Autotrophic #agellates/dino#agellates!
Boyd (unpublished) Montagnes et al. (1994)
Heterotrophic ciliates! this study Putt and Stoecker (1989)Heterotrophic dino#agellates! this study see Boyd et al. (1995a)Mesozooplankton! Goldblatt et al. (1999) see Boyd et al. (1995a)
!Denotes abundance data.
2766 P.W. Boyd et al. / Deep-Sea Research II 46 (1999) 2761}2792
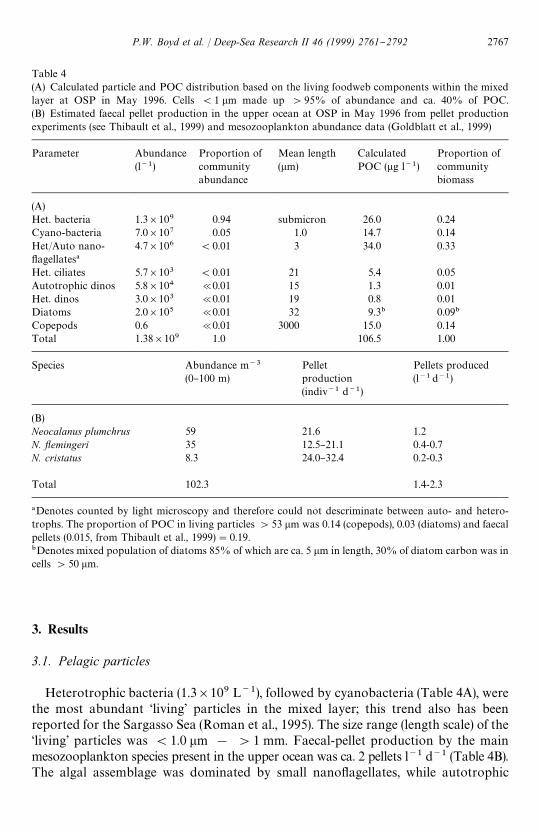
Table 4(A) Calculated particle and POC distribution based on the living foodweb components within the mixedlayer at OSP in May 1996. Cells (1 lm made up '95% of abundance and ca. 40% of POC.(B) Estimated faecal pellet production in the upper ocean at OSP in May 1996 from pellet productionexperiments (see Thibault et al., 1999) and mesozooplankton abundance data (Goldblatt et al., 1999)
Parameter Abundance(l~1)
Proportion ofcommunityabundance
Mean length(lm)
CalculatedPOC (lg l~1)
Proportion ofcommunitybiomass
(A)Het. bacteria 1.3]109 0.94 submicron 26.0 0.24Cyano-bacteria 7.0]107 0.05 1.0 14.7 0.14Het/Auto nano-#agellates!
4.7]106 (0.01 3 34.0 0.33
Het. ciliates 5.7]103 (0.01 21 5.4 0.05Autotrophic dinos 5.8]104 @0.01 15 1.3 0.01Het. dinos 3.0]103 @0.01 19 0.8 0.01Diatoms 2.0]105 @0.01 32 9.3" 0.09"
Copepods 0.6 @0.01 3000 15.0 0.14Total 1.38]109 1.0 106.5 1.00
Species Abundance m~3
(0}100 m)Pelletproduction(indiv~1 d~1)
Pellets produced(l~1d~1)
(B)Neocalanus plumchrus 59 21.6 1.2N. yemingeri 35 12.5}21.1 0.4-0.7N. cristatus 8.3 24.0}32.4 0.2-0.3
Total 102.3 1.4-2.3
!Denotes counted by light microscopy and therefore could not descriminate between auto- and hetero-trophs. The proportion of POC in living particles '53 lm was 0.14 (copepods), 0.03 (diatoms) and faecalpellets (0.015, from Thibault et al., 1999)"0.19."Denotes mixed population of diatoms 85% of which are ca. 5 lm in length, 30% of diatom carbon was incells '50 lm.
3. Results
3.1. Pelagic particles
Heterotrophic bacteria (1.3]109 L~1), followed by cyanobacteria (Table 4A), werethe most abundant &living' particles in the mixed layer; this trend also has beenreported for the Sargasso Sea (Roman et al., 1995). The size range (length scale) of the&living' particles was (1.0 lm ! '1 mm. Faecal-pellet production by the mainmesozooplankton species present in the upper ocean was ca. 2 pellets l~1 d~1 (Table 4B).The algal assemblage was dominated by small nano#agellates, while autotrophic
P.W. Boyd et al. / Deep-Sea Research II 46 (1999) 2761}2792 2767

Fig. 2. Diagram of the pelagic foodweb structure used to predict the downward POC #ux from the mixedlayer at OSP. The algal #ux version of the Michaels and Silver (1988) model, which permits 50% of largealgal cells to sink ungrazed out of the upper ocean was used. As algal biomass at OSP is observed to varylittle in magnitude over the annual cycle (Frost, 1993; Wong et al., 1995) the model was run in steady-statei.e. all inputted daily primary (from Boyd and Harrison, 1999) and bacterial production (from Sherry et al.,1999) is either grazed and/or sinks to depth. The fate of bacterial and primary production in the model isrepresented by foodweb #ows between compartments (solid arrows). The trophic transfer e$ciency ofcarbon at each foodweb #ow is as described in Michaels and Silver (1988). The resulting downward POC#uxes in the model are represented by shaded arrows A and B which denote the #uxes resulting fromfoobweb interactions, and direct algal sinking, respectively. HBACT, PICOP, NANOP, MICRO, HFLAG,HCIL and MZOO denote, heterotrophic bacteria, picophytoplankton, nanophytoplankton, microphytop-lankton, heterotrophic #agellates, heterotrophic ciliates and mesozooplankton, respectively.
cells'53 lm made up 3% of &living' biomass and were mainly diatoms (Table 4A, seethe appendix). No data were available on transparent exoploymers (TEPS; Alldredgeet al., 1993) nor on the abundance of detritus-like particles in the mixed layer. The&living' particle size distribution indicated that '99% of particles were submicron,and that 70% of the POC associated with &living' particles was (5 lm. The '53 lmparticles contributed ca. 19% to the total &living' POC (Table 4A legend). POC levelscalculated for the &living' particles in the mixed layer (ca. 105 lg C l~1) were ca.three-fold greater than POC estimates derived from pumps (Fig. 3A, 30 lg C l~1). Thegreatest disparity between the calculated and measured POC levels was for thesubmicron fraction. Reasons for these disparities are discussed later.
3.2. Particle aggregation/residence times
POC and PON levels were highest in the mixed layer and decreased rapidlywith depth (Figs. 3A and B). The POC size distributions derived from the foodweb(Table 4A) were compared with the partitioning of POC into size classes, as sampledby the MULVFS pumps (Fig. 3C). Despite di!erences between the calculated and
2768 P.W. Boyd et al. / Deep-Sea Research II 46 (1999) 2761}2792

Fig. 3. Vertical pro"les from MULVFS pumps (night-cast) of (A) POC concentrations for the (1, 1}53and '53 lm fractions, total material collected is the sum of these fractions (B) PON concentrations } asfor (A) but no data are available for material collected on 53 lm "lters, (C) the partitioning of POC betweenthe size-fractions, expressed as a proportion of total POC concentration from OSP in May 1996.
measured POC levels, the 1}53 lm fraction dominated both the partitioning of POC(Fig. 3C) and the population of &living'POC in the upper ocean (Table 4A). Submicronparticles made up '20% of POC (ca. 6 mg C m~3) sampled by the pumps, whereasheterotrophic and cyano-bacteria comprised 35% of the &living' carbon(41 mg C m~3). The partitioning of POC into particles '53 lm was less (Fig. 3C)than that observed for the &living' carbon (19% of POC'53 lm). Although it is likelythat some of the large but rare &living' particles (such as sarcodines; Michaels et al.,1990) were not sampled by bottles, and there are discrepancies between the magnitudeof &living' and pump POC levels, these observations suggest that the majority of thePOC in the '53 lm fraction can be attributed to &living' particles in the mixed layer.As such there was likely little particle aggregation within this zone; an observation
P.W. Boyd et al. / Deep-Sea Research II 46 (1999) 2761}2792 2769
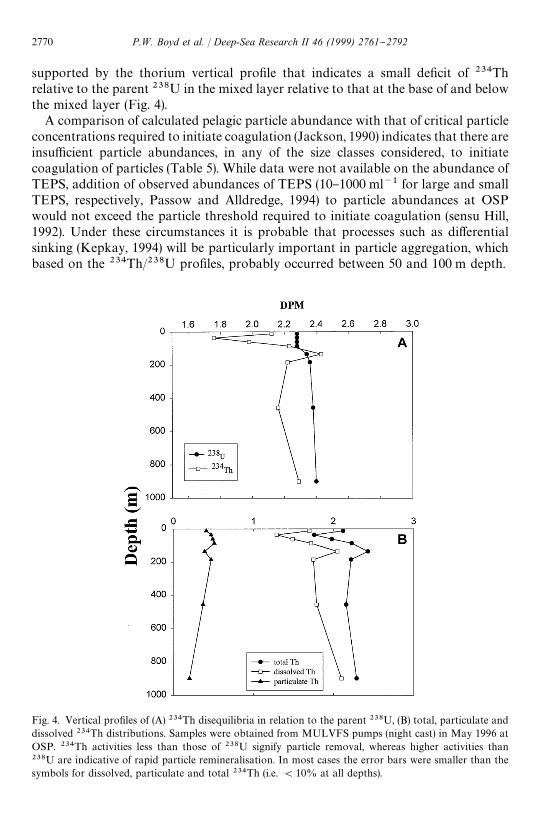
Fig. 4. Vertical pro"les of (A) 234Th disequilibria in relation to the parent 238U, (B) total, particulate anddissolved 234Th distributions. Samples were obtained from MULVFS pumps (night cast) in May 1996 atOSP. 234Th activities less than those of 238U signify particle removal, whereas higher activities than238U are indicative of rapid particle remineralisation. In most cases the error bars were smaller than thesymbols for dissolved, particulate and total 234Th (i.e. (10% at all depths).
supported by the thorium vertical pro"le that indicates a small de"cit of 234Threlative to the parent 238U in the mixed layer relative to that at the base of and belowthe mixed layer (Fig. 4).
A comparison of calculated pelagic particle abundance with that of critical particleconcentrations required to initiate coagulation (Jackson, 1990) indicates that there areinsu$cient particle abundances, in any of the size classes considered, to initiatecoagulation of particles (Table 5). While data were not available on the abundance ofTEPS, addition of observed abundances of TEPS (10}1000 ml~1 for large and smallTEPS, respectively, Passow and Alldredge, 1994) to particle abundances at OSPwould not exceed the particle threshold required to initiate coagulation (sensu Hill,1992). Under these circumstances it is probable that processes such as di!erentialsinking (Kepkay, 1994) will be particularly important in particle aggregation, whichbased on the 234Th/238U pro"les, probably occurred between 50 and 100 m depth.
2770 P.W. Boyd et al. / Deep-Sea Research II 46 (1999) 2761}2792

Table 5A comparison of observed abundances of &living particles' in the upper mixed layer at OSP in May 1996with predictions of critical particle concentrations (CPC) for aggregation (based on coagulation thresholds} from Fig. 7 in Jackson (1990)). Cell dimensions were obtained from Table 4
Cell mean length (lm) Cells (l~1) CPC (l~1)
(1 1.3]109 A1010
1}3 4.0]106 A108
3}5 5.0]105 '107
5}10 2.0]105 5]108
Estimation of the turnover and residence times of POC (from pumps) in the mixedlayer in May 1996 (after Coale and Bruland, 1985) suggested that POC turnover(POC levels/regenerated production; regenerated production was assumed to beprimary production } export production) was ca. 2.5 d, whereas residence time (POClevels/export production; export production was assumed to be downward POC #ux)was 17 d. Bishop et al. (1999) reported POC residence times (calculated from thediurnal variation of POC levels/POC levels from the MULVFS pumps) of (5 d. Theparticulate ('1 lm) thorium residence times in the upper ocean ranged from 31 to59 d (Charette et al., 1999); Murray et al. (1989) reported that the upper oceanresidence time of thorium in the Equatorial Paci"c was twice that for POC.
3.3. Downward biogenic yuxes
Observed POC #uxes, from surface-tethered free-drifting sediment traps, were ca.65 mg C m~2 d~1 at 100 m depth and decreased rapidly with depth (Fig. 5A). Thistrend also was observed for downward PON #uxes (Fig. 5B). The estimated down-ward POC #uxes at 100 m from thorium activity distributions and POC/thoriumratios (see Charette et al., 1999) were two-fold lower than observed for the driftingtraps, suggesting &over-trapping' or the non-removal of cryptic swimmers from trapcups (Michaels et al., 1990) at this depth. Thibault et al. (1999) estimate that meso-zooplankton faecal pellets contributed '30% to this downward POC #ux. Thedownward POC #ux in the deep-moored traps at 1000 and 3800 m in early July 1996was 1.7 and 1.6 mg C m~2 d~1, respectively (Wong et al., 1999b). These data representthe #ux at depth that probably originated in the upper ocean in late May 1996 (i.e. ca.40 d after the pelagic sampling took place, based on a 100 m d~1 sinking rate). Theobserved POC #ux in the 1000 m deep-tethered trap was "ve-fold lower than thatrecorded in the surface-tethered drifting trap at 1000 m; due to the di!erent time-scales of sampling (2.5 d versus 17 d in the deep traps) and the di!erent trap designsemployed, a comparison is problematic.
As chlorophyll a levels changed little either 7 d prior to, or after the occupation ofOSP (Fig. 1), it is likely that the pelagic &snapshot' obtained between 18}22 May wasrepresentative of events before and after. Thus a comparison of the predicted and
P.W. Boyd et al. / Deep-Sea Research II 46 (1999) 2761}2792 2771

Fig. 5. Vertical pro"les of downward #ux of (A) POC (B) PON, estimated from a 72 h deployment ofsurface-tethered free-drifting sediment traps at OSP in May 1996.
observed POC #uxes at 100 m and at depth was valid. The predicted downward POC#uxes, using the foodweb modelling approach, were 71 and 33.3 mg C m~2 d~1 at50 m (base of the mixed layer) and 100 m depth, respectively. The downward POC#ux at 3800 m (1.7 mg C m~2 d~1) predicted using the Boyd and Newton (1995)modelling approach was comparable to that observed in the deep-moored trap(3800 m) in early July 1996.
3.4. Particle removal
In the zone from the base of the mixed layer to 100 m depth, there were ca. two-foldincreases in the proportion of particles '53 lm, a decrease in the proportion of1}53 lm particles, and little change in the proportion of submicron particles (Fig. 3C).Such increases in the proportion of large particles occurred in a zone where POClevels decreased signi"cantly with depth (Fig. 3A), which may therefore representrepackaging of POC, such as by grazing activity or particle aggregation. The shal-lowest surface-tethered free-drifting trap was located at 100 m. The magnitude of the
2772 P.W. Boyd et al. / Deep-Sea Research II 46 (1999) 2761}2792
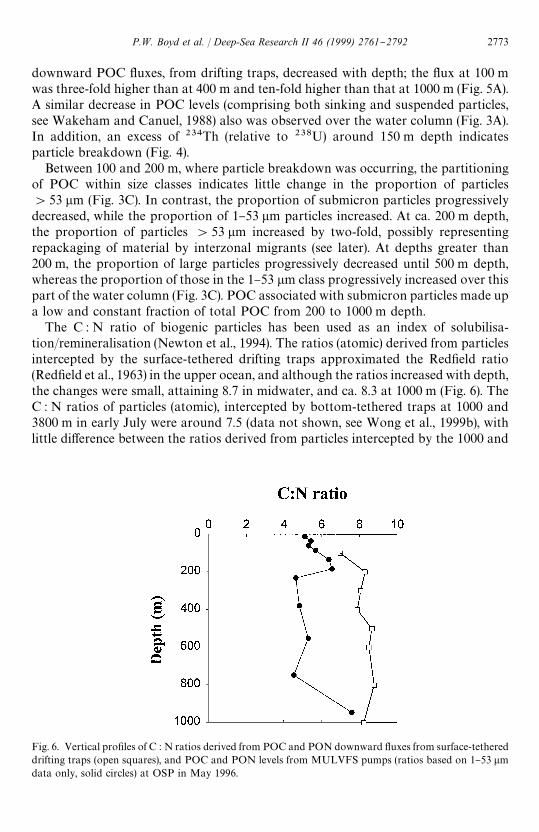
Fig. 6. Vertical pro"les of C : N ratios derived from POC and PON downward #uxes from surface-tethereddrifting traps (open squares), and POC and PON levels from MULVFS pumps (ratios based on 1}53 lmdata only, solid circles) at OSP in May 1996.
downward POC #uxes, from drifting traps, decreased with depth; the #ux at 100 mwas three-fold higher than at 400 m and ten-fold higher than that at 1000 m (Fig. 5A).A similar decrease in POC levels (comprising both sinking and suspended particles,see Wakeham and Canuel, 1988) also was observed over the water column (Fig. 3A).In addition, an excess of 234Th (relative to 238U) around 150 m depth indicatesparticle breakdown (Fig. 4).
Between 100 and 200 m, where particle breakdown was occurring, the partitioningof POC within size classes indicates little change in the proportion of particles'53 lm (Fig. 3C). In contrast, the proportion of submicron particles progressivelydecreased, while the proportion of 1}53 lm particles increased. At ca. 200 m depth,the proportion of particles '53 lm increased by two-fold, possibly representingrepackaging of material by interzonal migrants (see later). At depths greater than200 m, the proportion of large particles progressively decreased until 500 m depth,whereas the proportion of those in the 1}53 lm class progressively increased over thispart of the water column (Fig. 3C). POC associated with submicron particles made upa low and constant fraction of total POC from 200 to 1000 m depth.
The C : N ratio of biogenic particles has been used as an index of solubilisa-tion/remineralisation (Newton et al., 1994). The ratios (atomic) derived from particlesintercepted by the surface-tethered drifting traps approximated the Red"eld ratio(Red"eld et al., 1963) in the upper ocean, and although the ratios increased with depth,the changes were small, attaining 8.7 in midwater, and ca. 8.3 at 1000 m (Fig. 6). TheC : N ratios of particles (atomic), intercepted by bottom-tethered traps at 1000 and3800 m in early July were around 7.5 (data not shown, see Wong et al., 1999b), withlittle di!erence between the ratios derived from particles intercepted by the 1000 and
P.W. Boyd et al. / Deep-Sea Research II 46 (1999) 2761}2792 2773
3800 m traps for concurrent time periods (data not shown). In contrast, the C : N ratioof POC and PON levels (for the 1}53 lm fraction only) collected by pumps (includingboth suspended and sinking particles) ranged from 5.5 to 6.5 in the upper ocean, witha subsurface peak at ca. 200 m, and with values of between 4.5 to 7.6 in deeper water(Fig. 6).
3.5. Removal mechanisms
The main agents for the removal and transformation of particles include hetero-trophic bacteria/protozoa and interzonal migrants (Azam et al., 1995). The verticalpro"le of heterotrophic bacterial abundance displays a pattern similar to that ofdownward POC #ux, i.e. a six-fold decrease in abundance below 50 m (Fig. 7A).However, while 7% of the bacterial assemblage in the mixed layer was viable (i.e.metabolically active and with intact membranes as inferred by exclusion of the#uorescent stain propidium iodide; Lloyd and Hayes, 1995), the viability of thepopulation increased three-fold below 100 m (Fig. 7B), attaining 25% at 200 m, andthen declining between 400 and 800 m depth. This results in a vertical pro"le of(viable) bacterial abundance that does not exhibit such a pronounced decrease withdepth (see Fig. 7A). Bacterial activity, measured using Thymidine and Leucineincorporation (but not incubated at ambient pressure for deep water samples),displayed a marked decrease with depth, particularly between 50 and 300 m, butexhibited increases at 400 m depth (data not shown, but see Fig. 7D). Thethymidine/leucine ratio (ratio of nucleic acid:protein synthesis) also showed markeddecreases with depth, except at 400 m (not shown).
Conversion of thymidine incorporation into net bacterial carbon uptake afterKirchman et al. (1993) yielded a mixed layer uptake rate of ca. 0.7 lg C l~1 d~1
(Fig. 7D). This compares with a community respiration rate of ca. 30 lg C l~1 d~1 atOSP (Fig. 7C). Del Giorgio et al. (1997) and Cherrier et al. (1996) recently reportedthat the assimilation e$ciency (AE) of heterotrophic bacteria was ca. 0.1}0.2. Inaddition, Tortell et al. (1996) report that the AE of bacteria under Fe-stressedconditions ranges from 0.1 to 0.3. As bacteria at OSP are likely Fe-stressed in theupper ocean (Tortell et al., 1996), the gross bacterial C uptake will likely be in therange 2.3}7.0 lg C l~1 d~1. From size-fractionated respiration measurements, hetero-trophic bacteria are reported to contribute between 25 and 80% to communityrespiration at OSP (Sherry et al., 1999). On this basis, a bacterial AE at OSP of 0.1(and hence a ca. 25% contribution to community respiration) is more likely that oneof 0.3 (8% contribution to community respiration). Although community respirationdata were only available for the upper 60 m (Fig. 7C), bacterial respiration at depths'60 m were estimated by scaling them to the relative magnitude of thymidineincorporation over the 0}1000 m. If it is assumed that bacterial AE did not alter withdepth (see later), then respiration rates should decrease by seven-fold from 0 to1000 m.
Bacterial growth rates (bacterial biomass divided by production) were (0.05 d~1
over the water column (Fig. 7E); such a turnover time appears low relativeto phytoplankton (ca. 1 division d~1, Booth et al., 1993), which provide substrates
2774 P.W. Boyd et al. / Deep-Sea Research II 46 (1999) 2761}2792

Fig. 7. Vertical pro"les of heterotrophic bacterial (A) abundance (closed symbols denote all cells, opensymbols denote live cells (total abundance * cell viability); (B) viability; (C) community respiration (ex-pressed as lg C l~1 d~1, converted to carbon uptake using an RQ of 0.85); (D) production expressed inunits of carbon; (E) growth rate, estimated for production/biomass of all cells, (F) growth rate, estimated forproduction/biomass of active cells only. Note as incubations were conducted on deck at simulated in situtemperatures, pressure e!ects which may markedly reduce the magnitude of rate processes (Turley, 1993;Turley and Mackie, 1995) were not considered.
(via exudation) used by bacteria, or to bacterivores ('1 division d~1, Fenchel, 1982).However, the estimation of bacterial growth rates, based on viability, resulted in ratesof 0.4 d~1 in the upper ocean (Fig. 7F). Indeed, bacterial growth rates of 0.3 d~1 werecalculated for midwater populations at 400 m depth } this zone is thought to be
P.W. Boyd et al. / Deep-Sea Research II 46 (1999) 2761}2792 2775

Fig. 8. Vertical pro"les of the RNA/DNA ratio of particles (A) 1}53 lm, night (closed circles), day (opensquares); (B) (1 lm, day; (C) '53 lm, day, collected using MULVFS pumps from casts at OSP in May1996.
characterised by &carbon-poor' substrates (see Fig. 5 in Cherrier et al., 1996). Such highgrowth rates suggest that substrates are being utilised e$ciently at depth.
RNA/DNA ratios represent another approach to estimating heterotrophic bacter-ial growth rates (Kemp, 1995). These ratios for particles 1}53 lm likely represent bothfree-living and attached bacteria, and indicate a decrease in growth rate with depth atOSP. In both the day and night pro"les, there is evidence of subsurface increases ingrowth rate (Fig. 8A) at shallower (night cast) and similar depth stratum (day cast),respectively, than observed from other growth rate estimates (Fig. 7F). The ratios fromthe submicron particles are likely indicative of free-living bacterial growth rates, andwhile the dataset is limited there is again a subsurface increase in growth rate ataround 200 m (Fig. 8B). There is some evidence that ratios from the 1}53 lm and'53 lm particles are several fold higher than those for the submicron fraction(Fig. 8C); this may either re#ect higher numbers of eukaryotes in these fractions (larger
2776 P.W. Boyd et al. / Deep-Sea Research II 46 (1999) 2761}2792

Fig. 9. Vertical pro"les of (A) Soluble protein; (B) Caseinolysis (10~9 lmol FTC min~1 l~1); (C) Leucineaminopeptidase activity (LAP) activity (10~9 lmol min~1 l~1); (D) Caseinolysis (10~9 lmol FTCmin~1 prot~1) and LAP (10~9 lmol min~1 prot~1) activity normalised to soluble protein. Samples wereobtained from MULVFS pumps (night cast) in May 1996 at OSP.
cells tend to have higher RNA/DNA ratios) or faster growth rates by attachedbacteria, although the latter seems less likely (see DeLong et al., 1993).
3.6. Other biogeochemical gradients
The vertical pro"les of biochemical parameters, such as algal protease activity,which may play a role in accelerating the solubilisation of sinking aggregates (Bergesand Falkowski, 1996), showed 6}10 fold decreases in levels/activity at depths below100 m (Fig. 9A}C). However, when normalised to soluble protein levels, there waslittle di!erence in caseinolytic activity over the upper 1000 m, whereas leucineaminopeptidase activity (LAP) declined at depths '150 m (Fig. 9D). Mesozooplan-kton data from a Tucker trawl (150}250 m depth) indicate that while abundanceswere low (Table 6) the assemblage contained several important and e$cient suspen-sion feeders such as Neocalanus cristatus CV. Particle-ingestion rates by animals at
P.W. Boyd et al. / Deep-Sea Research II 46 (1999) 2761}2792 2777

Table 6Estimates of mesozooplankton ingestion rates of particles in the midwater column derived for the mainspecies sampled by a Tucker trawl between 150}250 m in May 1996 at OSP (see Goldblatt et al. (1999) formethodological details). Ingestion rates were obtained for Neocalanus cristatus CV from the mean of theday/night abundance in conjunction with grazing data presented by Dagg (1993), and were assumed for theother species (scaled to 10% of body weight of each species per day)
Species Abundance (m~3) Ingestion rate(lg C cop~1 d~1)
POC removed(mg C m~2 d~1)(150}250 m)
Eucalanus bungii 6.7 15 10Neocalanus cristatus CV 7.0}23.0 24.8}47.0 61.8Oithona spp. 3.7 0.04 0.01Conchoecia spp. 15.6 2 3.1Eukrohnia hamata 4.4 10 4.3Microcalanus pygmaeus 19.3 0.1 0.2
Total 56.7}72. 7 79.4
depth, estimated using published rates (Dagg, 1993) in conjunction with observedabundances in May 1996 at OSP, indicate that ca. 79 mg C m~2 d~1 are ingested bymesozooplankton over this depth stratum (Table 6). However, ca. 30% of this carbonlikely will be returned to the water column, as faecal pellets (Dagg, 1993), and hencecontribute to the downward POC #ux at depth.
Vertical gradients of algal pigment levels (data not shown, see Thibault et al., 1999)revealed marked decreases in pigment levels beneath the mixed layer and a ca. ten-folddecrease over the upper 1000 m, with little variation in either day or night, or betweenpigment groups, such as fucoxanthin (diatoms) or hexanoyloxy-fucoxanthin (prym-nesiophytes) in this trend. Pyropheophorbide a levels (a marker for copepod faecalmaterial) derived from the MULVFS pumped samples, exhibited a sub-surfacemaximum at 80}100 m depth (data not shown). The isotope signature of d13C inparticles, collected by MULVFS pumps, displayed strong vertical gradients over theupper 1000 m (Fig. 10) with a value of !27.5& in the mixed layer, declining by 2.5&at 100 m, and thereafter remained in the range !25 to !23.45& at depth.
4. Discussion
4.1. Sources of particles in the mixed layer
The magnitude of phytoplankton stocks in May 1996 at OSP was similar to thatobserved in May 1993, May 1994 (Boyd et al., 1996), May 1995 and June 1997 (Boydand Harrison, 1999). In addition, the reported biomass of microbial components ofthe food web in May 1996 were similar to those previously observed in late spring atOSP for bacterial (Kirchman et al., 1993; Sherry et al., 1999) and microzooplankton
2778 P.W. Boyd et al. / Deep-Sea Research II 46 (1999) 2761}2792

Fig. 10. Vertical pro"le of stable isotopes ratio (d13C, &) for POC obtained from MULVFS pumps (nightcast) in May 1996 at OSP.
biomass (Booth et al., 1993; Rivkin et al., 1999), respectively. Thus, in addition to theobserved low seasonality at OSP, there is also evidence of low interannual variabilityin the magnitude of &living' particles during late spring for this region. Mesozooplan-kton abundance, which displayed the largest seasonal variation of the all pelagicfoodweb components, was relatively high in May 1996 at OSP; late spring is charac-terised by the highest levels of grazers over the annual cycle (Fulton, 1978). Thesefoodweb components will be the building blocks for particle aggregates (Silver andGowing, 1991; Lampitt et al., 1993b).
Calculated POC levels for &living carbon' (105 lg C l~1) in May 1996 were compa-rable to those reported previously at OSP for late spring (see Booth et al., 1993(autotrophs/heterotrophs 60 lg C l~1); Kirchman et al., 1993 (bacteria 30 lg C l~1),but were ca. three-fold greater than those collected by the pumps. Reasons for thisdisparity probably include the cumulative error associated with using 5}6 speci"cbiovolume conversion factors (up to three-fold, see discussion in Caron et al., 1995),the inability to size each individual cell for the foodweb components, and thelikelihood that the pumps may not have captured particles with the same e$ciency aswater bottles; submicron POC calculated from biovolume factors was ca. 40 lg C l~1
compared with 6 lg C l~1 sampled by the pumps. Although pumps have beenreported as collecting lower PN levels than bottle samplers in the Sargasso Sea(Altabet et al., 1992) and fewer microbial particles in the NW Mediterranean (Turleyand Stutt, 1999), Caron et al. (1995) report that in a Sargasso Sea study (10% oftotal heterotrophic bacterial abundance was observed in GF/F "ltrates. Thus, asreported by Caron et al., the bacterial carbon content (20 fg C cell~1) used in manystudies may be an overestimate for open ocean bacteria. Despite such disparitiesbetween POC levels from these two approaches, changes in the partitioning of POCbetween size fractions over the water column may provide indirect evidence of particletransformations.
P.W. Boyd et al. / Deep-Sea Research II 46 (1999) 2761}2792 2779

The calculated fast turnover times and long residence times for particles in themixed layer at OSP are consistent with insu$cient particle abundances to initiateaggregation via coagulation, a &living' particle population dominated by cells toosmall to exit the water column directly, and high levels of pigment markers for grazingactivity. Such observations suggest that the water column at OSP is characterised bya low and constant downward #ux of material where decomposition of particles isdominant, and this conclusion supports the theoretical description of the region byLegendre and Le Fevre (1991). The modelling study of Michaels and Silver (1988)suggests that the main particles contributing directly to downward POC #ux will belarge algae such as diatoms, and faecal pellets from meso-grazers (copepods andsalps). Such particles are present at relatively low levels at OSP (see Table 4A; salps((0.1 L~1, Purcell and Madin, 1991; Goldblatt et al., 1999)). Cells (5 lm maycontribute indirectly to this #ux via particle pumping (Gardner et al., 1993).
4.2. Particle transformations in the upper ocean
The low seasonal variability at OSP in autotrophic and heterotrophic biomass(Boyd et al., 1995a) is due, in part, to high grazer activity (Landry et al., 1993; Gi!ord,1993). Initial particle transformations are therefore mainly associated with grazingactivity, in conjunction with particle aggregation by di!erential sinking. Data fromthorium disequilibria, the presence of a sub-surface pyropheophorbide a maxima, andchanges in the partitioning of POC within size classes all indicate that the main regionof particle formation is between 50 and 100 m depth. This also has been observed inthe NE Atlantic by Lampitt et al. (1993b).
4.3. The attenuation of downward POC yuxes } a mass balance approach
The availability of concurrent POC data from drifting traps and pumps withestimates of heterotrophic bacterial respiration (BR)/mesozooplankton grazing (MZ)permits an assessment of whether the rates of attenuation of POC (both suspendedand sinking) balance biogenic carbon demands over the upper 1000 m. In this carbonbalance calculation, three zones of the water column were considered, 100}150 m (BRdata only), 150}250 m (BR and MZ data), and 100}1000 m (BR data only) (Fig. 11).The number of terms to be considered in this calculation were reduced since horizon-tal advection in this region is low (Tabata, 1975; Bograd et al., 1999), and although nodata were available for May 1996, DOC and DIC levels changed little (10 lmol kg~1
or less) over the 100}1000 m water column during the period May 1995 to September1995 (Wong et al., 1999a). Furthermore, Bishop et al. (1999) report that water columnPOC levels increased slightly over the period of May to September 1996; suspendedparticles are thought to have long residence times in the deep ocean (Dru!el et al.,1992). Therefore DIC, DOC and POC can be assumed to be in quasi-steady-state andthus not considered in the mass balance; the main POC source is probably theproportion of sinking particles &lost' to the water column (58.3 mg C m~2 d~1
(66.5}8.2)) between 100 and 1000 m.
2780 P.W. Boyd et al. / Deep-Sea Research II 46 (1999) 2761}2792

Fig. 11. A carbon budget comparing the POC (as the fraction of sinking particles lost between each depthhorizon over the water column) available to bacteria/mesozooplankton (positive values in bold boxes), andthe carbon demand by biota (negative values in boxes). The solid arrows denote the downward POC #ux ateach depth horizon. Bacterial carbon demand based is on an assimilation e$ciency (AE) of 0.1 (BCD basedon an AE of 0.4 is in parentheses) for three depth horizons (100}150 m, 150}250 m and 250}1000 m) at OSPin May 1996. All #uxes are in mg C m~2 d~1. BR denotes bacterial respiration and represents the sum ofthe utilisation of Dissolved Organic Carbon (DOC) and the solubilisation of Particulate Organic Carbon(POC) to DOC (Smith et al., 1992). Note DIC and DOC #uxes were not considered as they change little inmagnitude over the growth season. MZ represents the ingestion of particles by mesozooplankton, PPdenotes primary production. The shaded arrow denotes the #ux of faecal pellets from interzonal migrants.Calculations of BCD at OSP are under-estimates since that do not take into account the requirements ofattached bacteria; Turley and Mackie (1994) report that they may comprise 25}34% of the biomass offree-living cells.
Column-integrated BCD for the water column between 100 and 1000 m depth was609 mg C m~2 d~1 (a BCD (152.6 mg C m~2 d~1) based on an AE of 0.4 is includedfor comparison). In the present study, data on particle ingestion by large copepods atdepth were only available from the 150}250 m depth stratum where they &removed' ca.79.4 mg C m~2 d~1; 30% of this carbon was likely returned to the water column asegested pellets. The total carbon required daily over the 100}1000 m water columnranged from 232 to 688 mg C m~2 d~1. The total carbon demand, based either ona bacterial AE of 0.1 or 0.4 is ca. four-fold to'ten-fold higher, respectively, than theavailable carbon. The total carbon demand (using bacterial AEs of 0.1 or 0.4) was alsoin excess of the available carbon for the 150}250 m, but not for 100}150 m (AE of 0.4)horizon (see Fig. 11).
P.W. Boyd et al. / Deep-Sea Research II 46 (1999) 2761}2792 2781

4.4. Comparison with the NE Atlantic
In contrast to the present study, Turley and Mackie (1994) report that the fractionof sinking POC lost between 150 and 3100 m in the NE Atlantic was capable ofsupplying ca. 90% of the BCD (455 mg C m~2 d~1). However, there appear to beseveral important di!erences between these two locales: "rstly, Turley and Mackie(1994) used an AE of 0.4 (see their Table 9; NE Atlantic waters are not characterisedby subnanomolar iron levels (Martin et al., 1993)) whereas an AE of 0.1 was used atOSP. This will result in a higher BCD at OSP. Secondly, the downward POC #ux inthe NE Atlantic was three-fold higher in the late spring period than that observed atOSP. Turley and Mackie (1994) invoked the possibility of the vertical supply of DOCcontributing to the BCD in the NE Atlantic. While care must be taken whencomparing processes occurring on di!erent timescales (Taylor and Karl, 1991), it isprobable that both the solubilisation of POC from suspended particles and thebacterial utilisation of DOC are the only other sources to supply the BCD. However,since DOC Wong et al. (1999a) and POC Bishop et al. (1999) levels increase fromspring to summer, they cannot supply the missing carbon; the supply of '95% of thehighest BCD (0.1 AE) would remove '10% of suspended POC (100}1000 m columnintegrated POC 6.2 g C m~2) or (1% of the DOC pool (100}1000 m columnintegrated ca. 750 g C m~2 DOC) at OSP.
4.5. Does Fe supply determine bacterial carbon demand?
The elevated BCD at OSP depends critically on the assumption that the lowbacterial AE estimated for the upper ocean is applicable throughout the watercolumn. Dissolved Fe levels increase from 0.02 to 0.6 nmol kg~1 from surface watersto 1000 m (Martin and Gordon, 1988). Furthermore, the nitracline (150 m) appears tobe shallower than that for Fe (300 m, Martin and Gordon, 1988), suggesting that thereis a stronger sink for iron than for nitrate in this region (assuming that the di!usioncoe$cient is the same for both nitrate and Fe). These factors will likely alter the BCDwith depth. While more information is needed on how bacterial AE changes withdepth, the lack of closure of the water column carbon balance suggests that bacterialcells may have a higher AE/lower BCD (consistent with higher Fe supply) at depth atOSP. Alternatively, the inability to consider the e!ects of pressure on alteringbacterial production (see Fig. 7 legend) resulted in arti"cally elevated BCD for thewater column.
4.6. Solubilisation of particles } C : N ratios
Smith et al. (1992) reported that the nitrogen associated with particles was preferen-tially solubilised resulting in an elevated C : N ratio of particles with depth. Indeed, aninverse relationship has been observed between the magnitude of downward POC#ux and the C : N ratio of the associated particles, i.e. faster deposition of particlesresults in less solubilisation (Newton et al., 1994; Turley and Mackie, 1995). The C : Nratio of particles intercepted by free-drifting traps at OSP increased only slightly with
2782 P.W. Boyd et al. / Deep-Sea Research II 46 (1999) 2761}2792

depth (ratios of 8.2 (150 m) and 8.1 (600 m)), suggesting that particles sank relativelyquickly. At the HOT site in the N Central Paci"c Gyre, Karl et al. (1996) observedC : N ratios of ca. 8 and '10 for particles intercepted by drifting traps at 150 and'600 m depth, respectively. At OSP, the C : N ratios of particles intercepted bydeep-moored traps at 1000 and 3800 m in early July are at the lower end of the rangeof C : N ratios (6.6-!'10 over the annual cycle) of particles intercepted by deeptraps (3200 m) in the NE Atlantic (Newton et al., 1994), again suggesting a rapidsettling of material to depth at OSP. Indeed, Takahashi (1986) and Wong et al. (1999b)have estimated particle sinking rates at OSP of up to 175 m d~1 and ca. 130 m d~1,respectively. These are similar to rates associated with the NE Atlantic spring bloom(Newton et al., 1994).
In contrast, the C : N ratios of the suspended (plus sinking) material at OSP were5.5}6.5 and relatively uniform in the upper ocean, with a slight decrease with depth.Given the high residence times/low sinking rates of suspended POC at OSP, it willlikely be subject to heterotrophic bacterial solubilisation (see Fig. 2 in Christian et al.,1997) in the upper ocean and at depth. Thus, it is likely that these suspended particlesare heavily colonised by bacteria, which have a C : N ratio of ca. 4}5 (estimated fromratio of submicron POC/PON in Fig. 3A/B), which would potentially o!set thein#uence of di!erential solubilisation on the C : N ratios. Despite the region beingdominated by small cells and being characterised by a relatively low and constantdownward particle #ux, it appears that this #ux is dominated by a small proportion offast-settling particles.
4.7. The role of mesozooplankton in particle transformations } evidence of seasonality?
Longhurst et al. (1990) have demonstrated in the NW Atlantic that interzonalmigrants may transport considerable amounts of C and N to depth via respiredcarbon and dissolved inorganic nitrogen excretion, respectively. In spring at OSP, theupper ocean is characterised by little diel zooplankton vertical migration (Mackaset al., 1993; Goldblatt et al., 1999), and thus the magnitude of biogenic #uxesassociated with interzonal migrants is unlikely to be a pronounced mechanism for thedownward transport of carbon in this region. Nevertheless, mesozooplankton appearto be a key determinant of the particle transformations which alter the magnitude ofthe downward POC #ux; Thibault et al. (1999) report that the #ux of faecal pel-lets/pheopigments contributed ca. 30% to the downward POC #ux in May 1996.
There is evidence that particles exiting the mixed layer at OSP are an importantsource of nutrition for mesozooplankton, in particular Neocalanus cristatus, withindiscrete depth strata below the mixed layer (Dagg, 1993). In the present study, largecopepods at depth, such as N. cristatus, ingested ca. 79 mg C m~2 d~1 POC from the150}250 m depth stratum. These "ndings do not concur with Lampitt et al. (1993b)who observed relatively low rates of particle ingestion by grazers in the NE Atlantic.Since Thibault et al. (1999) observed a considerably lower contribution of faecalpellets to the downward #ux of POC in summer, the seasonal ontogenetic migrationof mesozooplankton may be one of the main sources of seasonal variability indownward POC #ux over the annual cycle.
P.W. Boyd et al. / Deep-Sea Research II 46 (1999) 2761}2792 2783

4.8. Discrete depth strata for distinct particle transformations?
The availability of vertical pro"les of biogeochemical parameters enables theinvestigation of the possibility of vertical zonation in particle transformation pro-cesses. The permanent pycnocline at OSP is at ca. 150 m depth (Tabata, 1975), abovewhich multiple thermoclines exist (Denman and Gargett, 1988). These zones of rapiddensity change may in#uence particle distributions either by forming a temporarybarrier to some forms of sinking particles (Alldredge and Crocker, 1995), or byisolating di!erent groups of organisms. In addition, the relatively shallow depth of thepermanent pycnocline, cf. NE Atlantic depth of 500 m (see Turley and Mackie, 1994),may have implications for the ratio of &sequestered' to &recycled' export production(sensu Riebesell and Wolf-Gladrow, 1992; see below).
Medders et al. (1997) reported the presence of a novel d protobacterial lineagewithin a distinct depth stratum in the midwater region (160}500 m) of the OSP watercolumn. Such a vertical distribution also has been described by Giovannoni et al.(1990) in the Sargasso Sea. Medders et al. (1997) suggested that such a strati"eddistribution, i.e. higher abundances of these protobacteria at depth, may re#ecta functional adaptation to the utilisation of substrates. Most of the vertical pro"les ofparameters in the present study point to marked ten-fold gradients. However, themaxima observed by Medders et al. (1997) are coincident with the elevated proportionof large particles relative to surface waters (Fig. 3C). In addition, such reports offunctionally adapted bacterial communities may explain the presence of increases inboth bacterial viability (200}350 m depth) and growth rate (200 m depth } fromRNA/DNA ratios; 400 m depth } from thymidine) in the midwater column at OSP;such trends are consistent with the e$cient utilisation of substrates, thought to be of&poor' quality, at depth. While the observed increases in bacterial growth rate at depth,from these di!erent approaches, do not match with respect to depth range inmidwater, nevertheless, the few available data suggest that this area of researchrequires further investigation.
4.9. Other biogeochemical gradients
Although proteases from microalgae have been measured and characterised tosome extent (Berges and Falkowski, 1996), their precise functions remain unknown.Given their very high extracellular stability, it is likely that they could play a role inaccelerating the solubilisation of sinking aggregates. Thus, it is of interest to note thatwhen normalised to soluble protein, the depth distribution of the two proteolyticactivities examined } LAP and caseinolysis } were markedly di!erent. In the case ofLAP, there were marked decreases at depths '150 m, whereas with caseinolysisthere was little change. The lack of signi"cant variability of caseinolysis activity withdepth probably re#ects the very broad optimal conditions for this activity and its highstability (Berges and Falkowski, 1996). While it is di$cult to assign unambiguouslythese proteolytic activities to speci"c organisms (e.g. phytoplankton versus bacteria),it is prudent to assume that phytoplankton as well as bacteria may contribute to thepool of extracellular activity (Berges and Falkowski, 1996). Furthermore, high LAP
2784 P.W. Boyd et al. / Deep-Sea Research II 46 (1999) 2761}2792
and caseinolytic activity have been associated with dark-mediated cell-death events insome species (Berges and Falkowski, 1998).
The range of LAP activity observed at OSP at "rst appeared to be several orders ofmagnitude lower than reported for the oceanic waters o! California by Smith et al.(1992) using an identical technique. However, it has since been established that thehydrolysis rates reported in Smith et al.'s Table 2 are nmol ml~1 h~1, notlmol ml~1 h~1, and that the volume considered in Smith et al.'s measurements wasthat of the aggregate, not the volume of seawater in which the measurement was made(D. Smith, personal communication). Taking these factors into account, the resultsfrom OSP become much closer; for example, the "rst value quoted in Smith et al.'sTable 2 corresponds (in seawater) to 5.2]10~8 lmol min~1 l~1, which is very compa-rable to the mean upper water column values at OSP of ca. 6]10~8 lmol min~1 l~1.
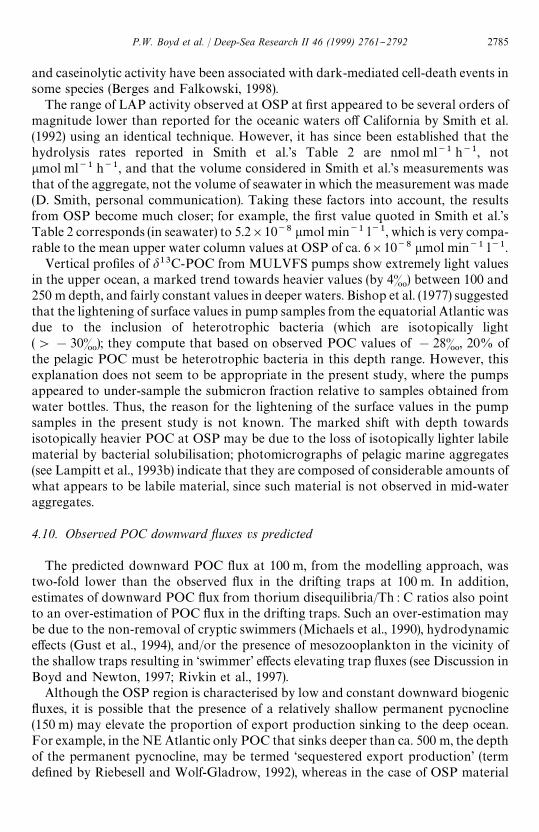
Vertical pro"les of d13C-POC from MULVFS pumps show extremely light valuesin the upper ocean, a marked trend towards heavier values (by 4&) between 100 and250 m depth, and fairly constant values in deeper waters. Bishop et al. (1977) suggestedthat the lightening of surface values in pump samples from the equatorial Atlantic wasdue to the inclusion of heterotrophic bacteria (which are isotopically light('!30&); they compute that based on observed POC values of !28&, 20% ofthe pelagic POC must be heterotrophic bacteria in this depth range. However, thisexplanation does not seem to be appropriate in the present study, where the pumpsappeared to under-sample the submicron fraction relative to samples obtained fromwater bottles. Thus, the reason for the lightening of the surface values in the pumpsamples in the present study is not known. The marked shift with depth towardsisotopically heavier POC at OSP may be due to the loss of isotopically lighter labilematerial by bacterial solubilisation; photomicrographs of pelagic marine aggregates(see Lampitt et al., 1993b) indicate that they are composed of considerable amounts ofwhat appears to be labile material, since such material is not observed in mid-wateraggregates.
4.10. Observed POC downward yuxes vs predicted
The predicted downward POC #ux at 100 m, from the modelling approach, wastwo-fold lower than the observed #ux in the drifting traps at 100 m. In addition,estimates of downward POC #ux from thorium disequilibria/Th : C ratios also pointto an over-estimation of POC #ux in the drifting traps. Such an over-estimation maybe due to the non-removal of cryptic swimmers (Michaels et al., 1990), hydrodynamice!ects (Gust et al., 1994), and/or the presence of mesozooplankton in the vicinity ofthe shallow traps resulting in &swimmer' e!ects elevating trap #uxes (see Discussion inBoyd and Newton, 1997; Rivkin et al., 1997).
Although the OSP region is characterised by low and constant downward biogenic#uxes, it is possible that the presence of a relatively shallow permanent pycnocline(150 m) may elevate the proportion of export production sinking to the deep ocean.For example, in the NE Atlantic only POC that sinks deeper than ca. 500 m, the depthof the permanent pycnocline, may be termed &sequestered export production' (termde"ned by Riebesell and Wolf-Gladrow, 1992), whereas in the case of OSP material
P.W. Boyd et al. / Deep-Sea Research II 46 (1999) 2761}2792 2785

settling deeper than 150 m depth will be &sequestered'. Thus, slow sinking particles ormaterial that is solubilised between 150 and 500 m depth will be part of the &seques-tered' production in the NE subarctic Paci"c but not the NE Atlantic. This mayrepresent the additional removal of ca. 30 mg C m~2 d~1 (POC #ux at 200 m minusthat at 500 m, 49.5}19.3 mg C m~2 d~1).
4.11. Conclusions
(i) The open NE subarctic Paci"c appears to be characterised by relatively lowseasonality for the majority of pelagic and downward biogenic #ux processes, andhence the magnitude of vertical processes recorded during May 1996 period arelikely to be representative of a larger spatial area and wider time period. However,the seasonal ontogenetic vertical migration of mesozooplankton into the upperocean may be one of the main sources of seasonal variability in downward POC#ux over the annual cycle.
(ii) The upper ocean at OSP in May 1996, below the mixed layer and above 100 m, isa region of particle aggregation, whereas at depths '100 m decompositiondominates particle transformations. Mixed layer residence times for POC are'15 d and POC turnover within the mixed layer is ca. 2 d.
(iii) Despite estimated long residence times in the upper ocean, particles that sink todepth display relatively little change in C : N ratios, suggesting a rapid transit todepth. In contrast, suspended particles have relatively low C : N ratios when theymight be expected, on the basis of di!erential solubilisation, to have elevated ratios
(iv) The bacterial gross carbon demand (BCD) in the water column (100}1000 mdepth) was, depending on assumptions, up to ten-fold greater than could besupplied by available POC. The inability to close the water column carbonbudget suggests that the BCD may have been over-estimated. High Fe levels atdepth at OSP may result in a greater bacterial assimilation e$ciency and hencea reduced BCD. More information is needed on how BCD changes with depth.
(v) Both bacterial and interzonal migrant activity dominate midwater particle trans-formations. There is evidence of elevated midwater microbial activity (viability,growth rates) despite the availability of &poor' quality substrates. This points tofunctionally adapted microbial populations, such as d protobacterial groups atvarious depth strata below the mixed layer.
Acknowledgements
We thank the Captain and o$cers of the vessel John P. ¹ully for their skills andco-operation. We wish to acknowledge the skilled assistance provided by HughMaclean (UBC), Tim Soutar, Ron Bellegay, Reg Bingham, John Love (IOS, Canada).We thank Bruce Johnson for his unstinting support and sel#ess guidance of theJGOFS-Canada programme. We are grateful to three anonymous reviewers for theirhelpful comments and advice which improved substantially this manuscript, to DavidSmith (University of California) for a personal communication and to Ken Denman
2786 P.W. Boyd et al. / Deep-Sea Research II 46 (1999) 2761}2792

Table 7
Group Spp or size (length scale) Cell (l~1)
Cyanobacteria Synechococcus 7]107
Diatoms pennates(10 lm 2.0]105
pennates 10}25 lm 2]104
centrics'25 lm! 3]103
Dino#agellates (25 lm" 5.5]104
'25 lm 3]103
Nano#agellates# (5 lm$ 4.3]106
5}20 lm 4]105
!Denotes mainly Thalassiosira species."Denotes mainly Gymnodinium.#Denotes mainly Micromonas pusilla.$Denotes counted by light microscopy and therefore could not discriminate between auto- and hetero-trophs.
for useful comments on the manuscript. This research was performed as part of theCanadian JGOFS Program. Principal support for Canadian JGOFS comes from theNatural Sciences and Engineering Research Council and from the Department ofFisheries and Oceans, Canada.
Appendix A
A list of the abundances of the main phytoplankton functional groups from May1996 at OSP are given in Table 7.
References
Alldredge, A.L., Passow, U., Logan, B.E., 1993. The abundance and signi"cance of a class of largetransparent organic particles in the ocean. Deep-Sea Research 40, 1131}1140.
Alldredge, A.L., Crocker, K.M., 1995. Why do sinking mucilage aggregates accumulate in the watercolumn?. The Science of the Total Environment 165, 15}22.
Altabet, M.A., Deuser, W.G., Honjo, S., Stienen, C., 1991. Seasonal and depth-related changes in the sourceof sinking particles in the North Atlantic. Nature 354, 136}139.
Altabet, M.A., Bishop, J.K.B., McCarthy, J.J., 1992. Di!erences in particulate nitrogen concentration andisotopic composition for samples collected by bottles and large volume pumps in Gulf Streamwarm-core rings and the Sargasso Sea. Deep-Sea Research 39, S405}417.
Asper, V.L., Deuser, W.G., Knauer, G.A., Lohrenz, S.E., 1992. Rapid coupling of sinking particle #uxesbetween surface and deep ocean waters. Nature 357, 670}673.
Azam, F., Smith, D.C., Long, R.A., Steward, G., 1995. Bacteria in ocean carbon cycling as a molecularproblem. In: Joint, I. (Ed.) Molecular ecology of aquatic microbes, NATO ASI Series, vol. G38.Springer, Berlin, pp. 39}54.
Banse, K., 1991. Iron availability, nitrate uptake and exportable new production in the subarctic Paci"c.Journal of Geophysical Research 96, 741}748.
Bender, M., Ducklow, H., Kiddon, J., Marra, J., Martin, J., 1993. The carbon balance during the 1989 springbloom in the North Atlantic Ocean, 473N, 203W. Deep-Sea Research I 39, 1707}1725.
P.W. Boyd et al. / Deep-Sea Research II 46 (1999) 2761}2792 2787

Berges, J.A., Falkowski, P.G., 1996. Cell-associated proteolytic enzymes from marine phytoplankton.Journal of Phycology 32, 556}574.
Berges, J., Falkowski, P.G., 1998. Physiological stress and cell death in marine phytoplankton: Induction ofproteases in response to nitrogen or light limitation. Limnology and Oceanography 43, 129}135.
Bishop, J.K.B., Edmond, J.M., Ketten, D.R., Bacon, M.P., Silker, W.G., 1977. The chemistry, geology andvertical #ux of particulate matter from the upper 400 m of the equatorial Atlantic Ocean. Deep-SeaResearch 24, 511}548.
Bishop, J.K.B., Schupack, D., Sherrell, R.M., Conte, M., 1985. A Multiple Unit Large Volume in-situFiltration System (MULVFS) for sampling oceanic particulate matter in mesoscale environments. In:Zirino, A. (Ed.) Mapping Strategies in Chemical Oceanography, Advances in Chemistry Series, 209.American Chemical Society, Washington, DC, pp. 155}175.
Bishop, J.K.B., Calvert, S.E., Soon, M., 1999. Spatial and temporal variability of POC in the northeastsubarctic Paci"c. Deep-Sea Research II 46, 2699}2733.
Bograd, S.J., Thomson, R.E., Rabinovich, A.B., Paul, H.L. (1999). Near-surface circulation of the northeastPaci"c Ocean derived from WOCE}SVP satellite-tracked drifters. Deep-Sea Research II, this volume.
Booth, B.C., Lewin, J., Postel, J.R., 1993. Temporal variation in the structure of autotrophic and hetero-trophic communities in the subarctic Paci"c. Progress in Oceanography 32, 57}99.
Borshiem, K.Y., Bratbak, G., 1987. Cell volume to cell carbon conversion factors for a bacterivorous Monassp. Enriched from seawater. Marine Ecology Progress Series 36, 171}175.
Boyd, P., Newton, P., 1995. Evidence of the potential in#uence of planktonic community structure on theinterannual variability of particulate carbon #ux. Deep-Sea Research I 42, 619}639.
Boyd, P.W., Strom, S., Whitney, F.A., Doherty, S., Wen, M.E., Harrison, P.J., Wong, C.S., Varela, D.E.,1995a. The NE subarctic Paci"c in winter. Biological standing stocks. Marine Ecology Progress Series128, 11}24.
Boyd, P.W., Whitney, F.A., Harrison, P.J., Wong, C.S., 1995b. The NE subarctic Paci"c in winter.Biological rate processes. Marine Ecology Progress Series 128, 25}34.
Boyd, P.W., Muggli, D., Varela, D., Goldblatt, R.H., Chretien, R., Orians, K.J., Harrison, P.J., 1996.In vitro iron enrichment experiments in the NE subarctic Paci"c. Marine Ecology Progress Series 136,179}193.
Boyd, P.W., Newton, P., 1997. Measuring biogenic carbon #ux in the ocean. Science 275, 554.Boyd, P.W., Harrison, P.J., 1999. Phytoplankton dynamics in the NE subarctic Paci"c. Deep-Sea Research
II 46, 2405}2432.Boyd, P.W., Wong, C.S., Merrill, J., Whitney, F., Snow, J., Harrison, P.J., Gower, J., 1998. Atmospheric iron
supply and enhanced vertical carbon #ux in the NE subarctic Paci"c } is there a connection? GlobalBiogeochemical Cycles 12, 429}441.
Boyd, P.W., Newton, P.P., 1999. Does planktonic community structure determine downward particulateorganic carbon #ux in di!erent oceanic provinces. Deep-Sea Research I 46, 63}91.
Boyd, P.W., Stevens, C.L., 1999. A coupled C #ux/particle dynamics model to assess factors controlling thetransfer of material to the deep ocean. Deep Sea Research I, submitted for publication.
Caron, D.A., Dam, H.G., Kremer, P., Lessard, E.J., Madin, L.P., Malone, T.C., Napp, J.M., Peele, E.R.,Roman, M.R., Youngbluth, M.J., 1995. The contribution of micro-organisms to particulate carbonand nitrogen in surface waters of the Sargasso Sea near Bermuda. Deep-Sea Research I 42,943}972.
Charette, M.A., Moran, S.B., Bishop, J.K.B., 1999. 234Th as a tracer of particulate organic carbon export inthe northeast Paci"c Ocean. Deep-Sea Research II 46, 2833}2861.
Cherrier, J., Bauer, J.E., Dru!el, E.R.M., 1996. Utilization and turnover of labile dissolved organic matterby bacterial heterotrophs in eastern North Paci"c surface waters. Marine Ecology Progress Series 139,267}279.
Christian, J.R., Karl, D.M., 1995. Bacterial ectoenzymes in marine waters: activity ratios and temperatureresponses in three oceanographic provinces. Limnology and Oceanography 40, 1042}1049.
Christian, J.R., Lewis, M.R., Karl, D.M., 1997. Vertical #uxes of carbon, nitrogen and phosphorusin the North Paci"c Subtropical Gyre near Hawaii. Journal of Geophysical Research 102,15667}15677.
2788 P.W. Boyd et al. / Deep-Sea Research II 46 (1999) 2761}2792

Coale, K.H., Bruland, K.W., 1985. 234Th : 238U disequilibria within the California current. Limnology andOceanography 30, 22}32.
Dagg, M., 1993. Sinking particles as a possible source of nutrition for the large calanoid copepodNeocalanus cristatus in the subarctic Paci"c Ocean. Deep-Sea Research I 40, 1431}1445.
Dam, H.G., Drapeau, D.T., 1995. Coagulation e$ciency, organic matter glues and the dynamics of particlesduring a phytoplankton bloom in a mesocosm study. Deep-Sea Research II 42, 111}123.
DeLong, E.F., Franks, D.G., Alldredge, A.L., 1993. Phylogenetic diversity of aggregate-attached vs.free-living marine bacterial assemblages. Limnology and Oceanography 38, 924}934.
del Giorgio, P.A., Cole, J.J., Cimbleris, A., 1997. Respiration rates in bacteria exceed phytoplanktonproduction in unproductive aquatic systems. Nature 385, 148}151.
Denman, K.L., Gargett, A.E., 1988. Multiple thermoclines are barriers to vertical exchange in the subarcticPaci"c during SUPER, May 1984. Journal of Marine Research 46, 77}103.
Dru!el, E.R., Williams, P.M., Bauer, J.E., Ertel, J.R., 1992. Cycling of dissolved and particulate organicmatter in the open ocean. Journal of Geophysical Research 97, 15639}15659.
Fenchel, T., 1982. Ecology of hetrotrophic micro#agellates: II Bioenergetics and growth. Marine EcologyProgress Series 8, 225}231.
Frost, B.W., 1993. A modelling study of processes regulating plankton standing stock and production in theopen subarctic Paci"c Ocean. Progress in Oceanography 32, 17}56.
Fuhrman, J.A., Davis, A.A., 1997. Widespread Archea and novel bacteria from the deep sea as shown by 16SrRNA gene sequences. Marine Ecology Progress Series 150, 275}285.
Fulton, J.D., 1978. Seasonal and annual variations of net zooplankton at Ocean Station P, 1965}1976.Canadian Fisheries Marine Services Data Report, 49.
Gardner, W.D., Walsh, I.D., Richardson, M.J., 1993. Biophysical forcing of particle production anddistribution during a spring bloom in the North Atlantic. Deep-Sea Research II 40, 171}198.
Gi!ord, D.J., 1993. Protozoa in the diets of Neocalanus spp. In the oceanic subarctic Paci"c Ocean.Progress in Oceanography 32, 223}238.
Giovanonni, S.J., Britschgi, T.B., Moyer, C.L., Field, K.G., 1990. Genetic diversity in Sargasso Seabacterioplankton. Nature 345, 60}63.
Giovannoni, S.J., Mullins, T.D., Field, K.G., 1995. Microbial diversity in oceanic systems: rRNA ap-proaches to the study of unculturable microbes. In: Joint, I. (Ed.) Molecular ecology of aquaticmicrobes, NATO ASI Series, G38. Springer, Berlin, pp. 217}248.
Goldblatt, R.H., Mackas, D.L., Lewis, A.G., Wen, M.E., 1999. Mesozooplankton community characteristicsin the NE subarctic Paci"c. Deep-Sea Research II 46, 2619}2644.
Gust, G., Michaels, A.F., Johnson, R., Deuser, W.G., Bowles, W., 1994. Mooring line motions and sedimenttrap hydromechanics: in situ intercomparison of three common deployment designs. Deep-SeaResearch I 41, 831}857.
Hill, P.S., 1992. Reconciling aggregation theory with observed vertical #uxes following phytoplanktonblooms. Journal of Geophysical Research 97, 2295}2308.
Hoppe, H.G., Ducklow, H., Karrasch, B., 1993. Evidence for the dependency of bacterial growth onenzymatic hydrolysis of particulate organic matter in the mesopelagic Ocean. Marine Ecology ProgressSeries 93, 277}283.
Jackson, G.A., 1990. A model of the formation of marine algal #ocs by physical coagulation processes.Deep-Sea Research 37, 1197}1211.
Karl, D.M., Knauer, G.A., 1984. Vertical distribution, transport and exchange of carbon in thenortheast Paci"c Ocean: evidence for multiple zones of biological activity. Deep-Sea Research 31,221}243.
Karl, D.M., Knauer, G.A., Martin, J.H., 1988. Downward #ux of particulate organic matter in the ocean:a particle decomposition paradox. Nature 332, 438}441.
Karl, D.M., Christian, J.R., Dore, J.E., Hebel, D.V., Letelier, R.M., Tupas, L.M., Winn, C.D., 1996. Seasonaland interannual variability in primary production and particle #ux at Station ALOHA. Deep-SeaResearch II 43, 539}568.
Kemp, P.F., 1995. Can we estimate bacterial growth rates from ribosomal RNA content. In: Joint, I. (Ed.)Molecular ecology of aquatic microbes, NATO ASI Series, G38. Springer, Berlin, pp. 279}302.
P.W. Boyd et al. / Deep-Sea Research II 46 (1999) 2761}2792 2789

Kepkay, P.E., 1994. Particle aggregation and the biological reactivity of colloids. Marine Ecology ProgressSeries 109, 293}304.
Kirchman, D.L., Keil, R.G., Simon, M., Welschmeyer, N.A., 1993. Biomass and production of heterotrophicbacterioplankton in the oceanic subarctic Paci"c. Deep-Sea Research 42, 967}988.
Lampitt, R.S., Hillier, W.R., Challenor, P.G., 1993a. Seasonal and diel variation in the open oceanconcentration of marine snow aggregates. Nature 362, 737}739.
Lampitt, R.S., Wishner, K.F., Turley, C.M., Angel, M.V., 1993b. Marine snow studies in the NortheastAtlantic Ocean: distribution, composition and role as a food source for migrating plankton. MarineBiology 116, 689}702.
Landry, M.R., Monger, B.C., Selph, K.E., 1993. Time-dependency of microzooplankton grazing andphytoplankton growth in the subarctic Paci"c. Progress in Oceanography 32, 205}222.
Legendre, L., Le Fevre, J., 1991. From individual plankton cells to Pelagic marine ecosystems and to globalbiogeochemical cycles. In: Demers, S. (Ed.) Particle Analysis in Oceanography. Springer, Berlin, pp.261}300.
Lloyd, D., Hayes, A.J., 1995. Vigour, vitality, and viability of microorganisms. FEMS MicrobiologicalLetters 133, 1.
Lochte, K., Turley, C.M., 1989. Bacteria and cyanobacteria associated with phytodetritus in the deep sea.Nature 333, 67}68.
Longhurst, A.R., Bedo, A.W., Harrison, W.G., Head, E.J.H., Sameoto, D.D., 1990. Vertical #ux ofrespiratory carbon by oceanic diel migrant biota. Deep-Sea Research 37, 685}694.
Mackas, D.L., Sefton, H., Miller, C.B., Raich, A., 1993. Vertical habitat partitioning by large calanoidcopepods in the oceanic subarctic Paci"c during spring. Progress in Oceanography 32, 259}294.
Martin, J.H., Gordon, R.M., 1988. Northeast Paci"c iron distributions in relation to phytoplanktonproductivity. Deep-Sea Research, Part A 35, 177}196.
Martin, J.H., Knauer, G.A., Karl, D.M., Broenkow, W.W., 1987. Vertex: Carbon cycling in the northeastPaci"c. Deep-Sea Research 34, 267}285.
Martin, J.H., Fitzwater, S.E., Gordon, R.M., Hunter, C.N., Tanner, S.J., 1993. Iron, primary production andcarbon}nitrogen #ux studies during the JGOFS North Atlantic Bloom Experiment. Deep-Sea ResearchII 40, 115}134.
Medders, T.D., Vergin, K.L., Boyd, P.W., Giovannoni, S.J., 1997. A novel d-subdivision Proteobacteriallineage from the Lower ocean surface layer. Applied Environmental Microbiology 63, 1441}1448.
Michaels, A.F., Silver, M.W., 1988. Primary production, sinking #uxes and the microbial food web.Deep-Sea Research 35, 473}490.
Michaels, A.F., Silver, M.W., Gowing, M.M., Knauer, G.A., 1990. Cryptic zooplankton &swimmers' in upperocean sediment traps. Deep-Sea Research 37, 1285}1296.
Miller, C.B., 1993. Pelagic production processes in the Subarctic Paci"c. Progress in Oceanography 32,1}17.
Montagnes, D.J.S., Berges, J.A., Harrison, P.J., Taylor, F.J.R., 1994. Estimating carbon, nitrogen, protein andchlorophyll a from volume in marine phytoplankton. Limnology and Oceanography 39, 1044}1060.
Murnane, R.J., Cochran, J.K., Buessler, K.O., Bacon, M.P., 1996. Least-squares estimates of thorium,particle and nutrient cycling rate constants from the JGOFS North Atlantic Bloom Experiment.Deep-Sea Research I 43, 239}258.
Murray, J.W., Downs, J.N., Strom, S., Wei, C.L., Jannasch, H.W., 1989. Nutrient assimilation, exportproduction and 234Th scavenging in the eastern equatorial Paci"c. Deep-Sea Research 36, 1471}1489.
Newton, P.P., Lampitt, R.S., Jickells, T.D., King, P., Boutle, C., 1994. Temporal and mesoscale variability ofbiogenic particle #uxes in the context of the JGOFS north-east Atlantic process studies at 47N 20W(1989}1990). Deep-Sea Research I 41, 1617}1642.
Parslow, J.S., 1981. Phytoplankton}zooplankton interactions: data analysis and modelling (with particularreference to Ocean Station Papa [503N 1453W] and controlled ecosystem experiments), PhD Thesis,University of British Columbia, Canada.
Parsons, T.R., Lalli, C.M., 1988. Comparative oceanic ecology of the plankton communities of thesubarctic Atlantic and paci"c Oceans. Oceanography and Marine Biology Annual Review 26,317}359.
2790 P.W. Boyd et al. / Deep-Sea Research II 46 (1999) 2761}2792

Passow, U., Alldredge, A.L., 1994. Distribution, size and bacterial colonization of transparent exoploymersin the ocean. Marine Ecology Progress Series 133, 185}198.
Peinart, R., von Bodungen, B., Smetacek, V.S., 1989. Foodweb structure and loss rate. In: Berger, W.H.,Smetacek, V.S., Wefer, G. (Eds.) Productivity of the Ocean: Present and Past. Wiley, New York, pp.35}48.
Purcell, J.E., Madin, L.P., 1991. Diel patterns of migration, feeding, and spawning by salps in the subarcticPaci"c. Marine Ecology Progress Series 73, 211}217.
Putt, M., Stoecker, D.K., 1989. An experimentallly determined carbon : volume ratio for marine &oligot-richous' ciliates from estuarine and coastal waters. Limnology and Oceanography 34, 1097}1103.
Red"eld, A.C., Ketchum, B.H., Richards, F.A., 1963. The in#uence of organisms on the composition ofseawater. In: Hill, M.N. (Ed.) The Sea. Wiley, New York, pp. 26}77.
Riebesell, U., Wolf-Gladrow, D.A., 1992. The relationship between physical aggregation of phytoplanktonand particle #ux: a numerical model. Deep-Sea Research 39, 1085}1102.
Rivkin, R.B., 1997. Measuring biogenic carbon #ux in the oceans. Science 275, 554}555.Rivkin, R.B., Putland, J.N., Deibel, D., Anderson, M.R., 1999. Microzooplankton bacterivory and herbi-
vory in the NE subarctic Paci"c. Deep-Sea Research II 46, 2579}2618.Roman, M.R., Caron, D.A., Kremer, P., Lessard, E.J., Madin, L.P., Malone, T.C., Napp, J.M., Peele, E.R.,
Youngbluth, M.J., 1995. Spatial and temporal changes in the partitioning of organic carbon in theplankton community of the Sargasso Sea o! Bermuda. Deep-Sea Research I 42, 973}992.
Sheldon, R.W., Prakash, A., Sutcli!e, W.H., 1972. The size distribution of particles in the ocean. Limnologyand Oceanography 17, 327}340.
Sherry, N.D., Boyd, P.W., Sigimoto, K., Harrison, P.J., 1999. Seasonal and spatial patterns of heterotrophicbacterial production, respiration, and biomass in the NE subarctic Paci"c. Deep-Sea Research II 46,2557}2578.
Silver, M.W., Gowing, M.M., 1991. The &particle' #ux: Origins and biological components. Progress inOceanography 26, 75}113.
Smith, D.C., Simon, M., Alldredge, A.L., Azam, F., 1992. Intense hydrolytic enzyme activity on marineaggregates and implications for rapid particle dissolution. Nature 359, 139}142.
Strathmann, R.R., 1967. Estimating the organic carbon content of phytoplankton from cell volume orplasma volume. Limnology and Oceanography 12, 411}418.
Tabata, S., 1975. The general circulation of the Paci"c Ocean and a brief account of the oceanographicstructure of the North Paci"c Ocean. Part I } Circulation and volume transports. Atmosphere 13, 133}168.
Takahashi, K., 1986. Seasonal #uxes of pelagic diatoms in the subarctic Paci"c, 1982}1983. Deep-SeaResearch 33, 1225}1252.
Taylor, G.T., Karl, D.M., 1991. Vertical #uxes of biogenic particles and associated biota in the eastern northPaci"c: implications for biogeochemical cycling and productivity. Global Biogeochemical Cycles 5,289}303.
Thibault, D., Roy, S., Wong, C.S., Bishop, J.K., 1999. The downward #ux of biogenic Material in the NEsubarctic Paci"c: importance of algal sinking and mesozooplankton herbivory. Deep-Sea Research II46, 2669}2697.
Tortell, P.D., Madonado, M.T., Price, N.M., 1996. The role of heterotrophic bacteria in iron-limited oceanecosystems. Nature 383, 330}332.
Turley, C.M., 1992. Formation, vertical #ux and remineralisation of aggregates in the ocean: a short review.Archiv. Fur Hydrobiologie Beiheft Ergebnisse der Limnologie 37, 155}163.
Turley, C.M., 1993. The e!ect of pressure on leucine and thymidine incorporation by free-living bacteriaand by bacteria attached to sinking particles. Deep-Sea Research I 40, 2193}2206.
Turley, C.M., Mackie, P., 1994. Biogeochemical signi"cance of attached and free-living bacteria and the #uxof particles in the NE Atlantic Ocean. Marine Ecology Progress Series 115, 191}203.
Turley, C.M., Mackie, P., 1995. Bacterial and cyanobacterial #ux to the deep NE Atlantic on sedimentingparticles. Deep-Sea Research I 42, 1453}1474.
Turley, C.M., Stutt, E.D., 1999. Depth related cell speci"c leucine incorporation rates on particles and itsbiogeochemical signi"cance in the NW Mediterranean. Limnology and Oceanography, submitted forpublication.
P.W. Boyd et al. / Deep-Sea Research II 46 (1999) 2761}2792 2791

Varela, D.E., Harrison, P.J., 1999. Seasonal variability in the nitrogenous nutrition of natural phytoplan-kton assemblages in the northeastern subarctic Paci"c. Deep-Sea Research II 46, 2505}2538.
Wakeham, S.G., Canuel, E.A., 1988. Organic geochemistry of particulate matter in the eastern tropicalNorth Pacifc Ocean: Implications for particle dynamics. Journal of Marine Research 46, 183}213.
Welschmeyer, N.A., Strom, S., Goericke, R., DiTuillio, G., Belvin, B., Petersen, W., 1993. Primaryproduction in the subarctic Paci"c Ocean: Project SUPER. Progress in Oceanography 32, 101}135.
Whitney, F.A., Freeland, H., 1999. Variability in upper ocean water properties along Line P in the NEPaci"c Ocean. Deep-Sea Research II, this volume.
Wong, C.S., Whitney, F.A., Iseki, K., Page, J.S., Zeng, J., 1995. Analysis of trends in primary productivityand chlorophyll-a over two decades at Ocean Station P (503N 1453W) in the Subarctic NortheastPaci"c Ocean. Canadian Journal of Fisheries and Aquatic Science 121, 107}117.
Wong, C.S., Yu, Z., Johnson, W.K., Matear, R.J., Whitney, F.A., 1999a. Dissolved organic carbon inSub-Arctic Northeast Paci"c Ocean. In: Handa, N., Tanoue, E., Hama, T. (Eds.), Dynamics andCharacterization of Marine Organic Matter, Terra Scienti"c Publishing Co., Tokyo, pp. 107}116.
Wong, C.S., Whitney, F.A., Crawford, D.W., Johnson, W.K., Iseki, K., Matear, R.J., Page, J.S., Timothy, D.,1999b. Seasonal and interannual variability in particle #uxes of carbon, nitrogen and silicon from timeseries of sediment traps at Ocean Station P, 1982}1993: relationship to changes in subarctic primaryproductivity. Deep-Sea Research II 46, 2735}2760.
Wu, J., Calvert, S.E., Wong, C.S., Whitney, F.A., 1999. Carbon and nitrogen isotopic composition ofsedimenting particulate material at Station Papa in the subarctic northeast Paci"c. Deep-Sea ResearchII 46, 2793}2832.
2792 P.W. Boyd et al. / Deep-Sea Research II 46 (1999) 2761}2792