transformational leadership characteristics of …
TRANSCRIPT

TRANSFORMATIONAL LEADERSHIP CHARACTERISTICS OF COLLEGE AND UNIVERSITY PRESIDENTS OF PRIVATE, TITLE III AND TITLE V-ELIGIBLE
INSTITUTIONS
CHRISTINE D. HEMPOWICZ
Chair John W. Mulcahy, Ph.D., LL.D.
Readers
Gary Alger, Ed.D. Nan Kurz Nutt, Ph.D.
DISSERTATION
SUBMITTED IN PARTIAL FULFILLMENT OF THE REQUIREMENTS FOR THE DEGREE OF DOCTOR OF EDUCATION
THE SCHOOL OF EDUCATION AND HUMAN RESOURCES UNIVERSITY OF BRIDGEPORT
CONNECTICUT
2010

UMI Number: 3455642
All rights reserved
INFORMATION TO ALL USERS The quality of this reproduction is dependent upon the quality of the copy submitted.
In the unlikely event that the author did not send a complete manuscript
and there are missing pages, these will be noted. Also, if material had to be removed, a note will indicate the deletion.
UMI 3455642
Copyright 2011 by ProQuest LLC. All rights reserved. This edition of the work is protected against
unauthorized copying under Title 17, United States Code.
ProQuest LLC 789 East Eisenhower Parkway
P.O. Box 1346 Ann Arbor, MI 48106-1346

Copyright 2010 by
Hempowicz, Christine D.
All rights reserved.


iv
Abstract
TRANSFORMATIONAL LEADERSHIP CHARACTERISTICS OF COLLEGE AND
UNIVERSITY PRESIDENTS OF TITLE III AND TITLE V-ELIGIBLE INSTITUTIONS
Christine D. Hempowicz
The purpose of this study was to investigate the transformational leadership
characteristics of college and university presidents of private Title III and Title V-eligible
institutions. Private institutions of higher education comprise approximately half of the total
post-secondary institutions in the U.S. However, they are at greater risk for closure than their
public counterparts. The U.S. Department of Education’s Strengthening Institutions Program,
also known as Title III, was created as part of the Higher Education Act of 1965 to provide
competitive grant support to institutions with higher percentages of low-income students and
comparatively smaller general and educational expenditures per student. These institutions were
considered vulnerable and at the same time, were deemed to be important for the nation’s
growing number of college-bound students. The Hispanic-Serving Institutions Program, also
known as Title V, was established a few decades later to serve institutions with a significant
percentage of Hispanic students in addition to the Title III institutional characteristics.
Higher education leadership theorists vary in their views on the efficacy of president
transformational leadership in the college and university setting. However, by nature, private
Title III and V-eligible institutions are at some level of risk for survival and president
transformational leadership practices could provide the leverage needed for continued existence
and prosperity.
The 219 private, four-year Title III and V-eligible college and university presidents were
invited to complete Kouzes and Posner’s Leadership Practices Inventory-Self (LPI) in order to

v
measure their leader behaviors through the LPI-descriptors “Model the Way”, “Inspire a Shared
Vision”, “Challenge the Process”, “Enable Others to Act”, and “Encourage the Heart”. President
and institutional demographic information was also collected on gender, race/ethnicity, number
of years in current position, total undergraduate student population, percent undergraduate
minority population, urban or non-urban campus setting, and institutional religious affiliation to
analyze for potential relationships and differences in LPI-descriptor responses.
The data-generating sample was comprised of 146 presidents (66.67%) of private, four-
year Title III and V-eligible institutions located throughout the United States. Presidents reported
levels of engagement in transformational leader behaviors that were higher than a national
average of executive managers, as measured by the Leadership Practices Inventory (LPI)
(Posner, 2009). The presidents’ strongest transformational leader behavior was reported as
“Enable Others to Act”, followed by “Model the Way”, “Inspire a Shared Vision”, “Encourage
the Heart”, and “Challenge the Process”.
Undergraduate enrollment was the only variable in the study that demonstrated
significance with regards to the LPI descriptor scores. The relationship between undergraduate
enrollment and president responses to three of the five LPI descriptors approached significance.
Undergraduate enrollment approached significance as a predictor variable in a multiple
regression of institutional characteristics for two LPI descriptors and was a significant positive
predictor for the leader behavior, “Challenge the Process”.

vi
Acknowledgements
There are so many people to thank for their constant encouragement, generously shared
expertise, and gifts of love and support that I have received throughout this dissertation. All are
deserving of more acknowledgement than space permits. First and foremost, to my beloved
husband, Chris, for his unwavering love, support and encouragement through this intense
journey to our children, Michael, Elizabeth, Nicholas and Anna, as well as our Ubzek family,
who had to adjust to my intense schedule that often took my time, energy and focus away from
them. I owe tremendous gratitude to my dissertation committee: Dr. John W. Mulcahy, whose
solid encouragement and brilliant expertise in the area of motivation and leadership were
invaluable, especially his leadership synthesis model, which provided a framework for this study;
to Dr. Gary Alger, for his proficient insight into the design and analysis of the data; and to Dr.
Nan Kurz Nutt, for her guidance, encouragement, infectious passion, and leadership insights.
To University of Bridgeport President Neil Albert Salonen, whose leadership of a Title
III-eligible institution inspired the concept and development of this study, and to the 146 college
and university presidents who, despite the multiple requests that come across their desk every
year, took the time from their busy schedules to respond to my survey, and especially to those
who also expressed words of encouragement.
To my parents, James H. and Jean Erwin, who always loved and encouraged me, believed
in me and invested in me, and my brothers and sisters, Kathy, Blane, Lisa, and Jim. To my sister
in law, Maria Jasztrebski and her husband, Tadeusz, for their love and support. To the teachers
who fed my hunger for knowledge, taught me to persevere, and helped instill a life-long passion
to learn, you each have found a permanent place in my heart: Mr. Robert Dwyer, Mrs. Dorothy
Holland, Mrs. Mary Alice Daniels, and Dr. Clark Bricker.

vii
I also wish to thank my fellow students in the doctoral program, for your friendships,
encouragement, and acceptance. I expect to see each one of us “doctorfied” soon!
Finally, it is with a great sense of respect and honor that I acknowledge Rev. Dr. Sun
Myung Moon, his wife, Dr. Hak Ja Han Moon, and their children, for their examples of
transformative leadership, intense quest for peace in this world, and for their most sincere and
passionate love of God and humankind.

viii
DEDICATION
To God, True Parents, My Parents and Family

ix
Table of Contents
Abstract. . . . . . . . . . . . . . . . . . . . . . . . . . . . . . . . . . . . . . . . . . . . . . iv
Acknowledgements. . . . . . . . . . . . . . . . . . . . . . . . . . . . . . . . . . . . . vi
Dedication. . . . . . . . . . . . . . . . . . . . . . . . . . . . . . . . . . . . . . . . . . . . viii
Table of Contents. . . . . . . . . . . . . . . . . . . . . . . . . . . . . . . . . . . . . . ix
List of Tables . . . . . . . . . . . . . . . . . . . . . . . . . . . . . . . . . . . . . . . . . . xiii
List of Figures. . . . . . . . . . . . . . . . . . . . . . . . . . . . . . . . . . . . . . . . . .xvi
Chapter 1: Introduction. . . . . . . . . . . . . . . . . . . . . . . . . . . . . . . . . 1
Introduction to Leadership in Higher Education. . . . . . . . . . 1
Statement of the Problem. . . . . . . . . . . . . . . . . . . . . . . . . . . . 5
Research Questions. . . . . . . . . . . . . . . . . . . . . . . . . . . . . . . . .6
Significance of the Study. . . . . . . . . . . . . . . . . . . . . . . . . . . . 7
Definition of Terms. . . . . . . . . . . . . . . . . . . . . . . . . . . . . . . . 8
Limitations of the Study. . . . . . . . . . . . . . . . . . . . . . . . . . . . .9
Organization of the Study. . . . . . . . . . . . . . . . . . . . . . . . . . . 10
Chapter 2: Review of Literature. . . . . . . . . . . . . . . . . . . . . . . . . . 11
Leadership Theorists. . . . . . . . . . . . . . . . . . . . . . . . . . . . . . . 11
Classic Motivation Theorists. . . . . . . . . . . . . . . . . . . 12
Maslow. . . . . . . . . . . . . . . . . . . . . . . . . . . . . .12
Herzberg. . . . . . . . . . . . . . . . . . . . . . . . . . . . .14
Vroom. . . . . . . . . . . . . . . . . . . . . . . . . . . . . . .17
Porter and Lawler. . . . . . . . . . . . . . . . . . . . . .19
Classic Leadership Theorists. . . . . . . . . . . . . . . . . . . 21

x
Ohio State Leadership Studies. . . . . . . . . . . . 21
Likert. . . . . . . . . . . . . . . . . . . . . . . . . . . . . . . 27
McGregor. . . . . . . . . . . . . . . . . . . . . . . . . . . . 30
Argyris. . . . . . . . . . . . . . . . . . . . . . . . . . . . . . 32
Blake and Mouton. . . . . . . . . . . . . . . . . . . . . 34
Fiedler. . . . . . . . . . . . . . . . . . . . . . . . . . . . . . 36
Hersey and Blanchard . . . . . . . . . . . . . . . . . . 37
Vroom and Yetton. . . . . . . . . . . . . . . . . . . . . 40
Kouzes and Posner. . . . . . . . . . . . . . . . . . . . . 42
Mulcahy Model. . . . . . . . . . . . . . . . . . . . . . . 46
Education Leadership Theorists. . . . . . . . . . . . . . . . . 49
Birnbaum. . . . . . . . . . . . . . . . . . . . . . . . . . . . 49
Bensimon. . . . . . . . . . . . . . . . . . . . . . . . . . . . 52
Neumann. . . . . . . . . . . . . . . . . . . . . . . . . . . . .55
Sergiovanni. . . . . . . . . . . . . . . . . . . . . . . . . . .59
Kezar. . . . . . . . . . . . . . . . . . . . . . . . . . . . . . . 61
Higher Education Act of 1965. . . . . . . . . . . . . . . . . . . . . . . . 64
Title III Legislation. . . . . . . . . . . . . . . . . . . . . . . . . . .66
Title V Legislation. . . . . . . . . . . . . . . . . . . . . . . . . . . 69
Title III and V Eligibility. . . . . . . . . . . . . . . . . . . . . . 71
Title III-eligible Institutions. . . . . . . . . . . . . . . . . . . . . . . . . . 73
Invisibility. . . . . . . . . . . . . . . . . . . . . . . . . . . . . . . . . 74
Turnaround. . . . . . . . . . . . . . . . . . . . . . . . . . . . . . . . . 76

xi
Viability. . . . . . . . . . . . . . . . . . . . . . . . . . . . . . . . . . . 77
Selectivity. . . . . . . . . . . . . . . . . . . . . . . . . . . . . . . . . .78
Risk for Merger or Closure. . . . . . . . . . . . . . . . . . . . .80
Minority Student Population. . . . . . . . . . . . . . . . . . . .81
Title V-eligible Institutions. . . . . . . . . . . . . . . . . . . . . . . . . . .82
Transformational Leadership for Higher Education. . . . . . . .84
Chapter 3: Research Methodology . . . . . . . . . . . . . . . . . . . . . . . . 88
Subjects. . . . . . . . . . . . . . . . . . . . . . . . . . . . . . . . . . . . . . . . . 88
Materials. . . . . . . . . . . . . . . . . . . . . . . . . . . . . . . . . . . . . . . . 90
Leadership Practices Inventory-Self (LPI). . . . . . . . .90
Validity and Reliability of the LPI. . . . . . . . . . . . . . .91
Procedures. . . . . . . . . . . . . . . . . . . . . . . . . . . . . . . . . . . . . . . 93
Data Gathering Plan. . . . . . . . . . . . . . . . . . . . . . . . . . 93
Data Analysis Plan. . . . . . . . . . . . . . . . . . . . . . . . . . . 95
Chapter 4: Analysis of Findings. . . . . . . . . . . . . . . . . . . . . . . . . . . 106
Description of the Sample. . . . . . . . . . . . . . . . . . . . . . . . . . . 106
Results . . . . . . . . . . . . . . . . . . . . . . . . . . . . . . . . . . . . . . . . . . 111
Research Question 1. . . . . . . . . . . . . . . . . . . . . . . . . .111
Research Question 2. . . . . . . . . . . . . . . . . . . . . . . . . .120
Research Question 3. . . . . . . . . . . . . . . . . . . . . . . . . .123
Research Question 4. . . . . . . . . . . . . . . . . . . . . . . . . .125
Research Question 5. . . . . . . . . . . . . . . . . . . . . . . . . .130
Research Question 6. . . . . . . . . . . . . . . . . . . . . . . . . .135

xii
Research Question 7. . . . . . . . . . . . . . . . . . . . . . . . . .143
Summary. . . . . . . . . . . . . . . . . . . . . . . . . . . . . . . . . . . . . . . . 153
Chapter 5: Summary, Conclusions, and Recommendations. . . . 156
Summary. . . . . . . . . . . . . . . . . . . . . . . . . . . . . . . . . . . . . . . . .156
Conclusions. . . . . . . . . . . . . . . . . . . . . . . . . . . . . . . . . . . . . . .162
Recommendations for Future Research. . . . . . . . . . . . . . . . . 166
Summary. . . . . . . . . . . . . . . . . . . . . . . . . . . . . . . . . . . . . . . . .167
References. . . . . . . . . . . . . . . . . . . . . . . . . . . . . . . . . . . . . . . . . . . . .169
Appendices. . . . . . . . . . . . . . . . . . . . . . . . . . . . . . . . . . . . . . . . . . . . 188
Appendix A: List of Title III and V-eligible Institutions. . .189
Appendix B: LPI-Self (Third Edition) and Instructions. . . .216
Appendix C: Demographic Survey. . . . . . . . . . . . . . . . . . . 219
Appendix D: November 2008 Preliminary Mailing Letter. 221
Appendix E: Permission from Kouzes Posner. . . . . . . . . . 223
International
Appendix F: Permission from University of Bridgeport . . 225
Institutional Review Board
Appendix G: July 2009 Letter to Invited Sample. . . . . . . . .227
Appendix H: September 2009 Follow-up Letter to. . . . . . . 229
Non-responders

xiii
List of Tables
Table 2.1 Theory X Assumptions and Theory Y Assumptions Table 31 Table 2.2 Situational Factors Facilitating and Inhibiting Leadership 37 Table 2.3 Theories Included in Mulcahy’s Continuum of Job 48 Satisfaction, Leadership & Decision Making
Table 2.4 Cognitive Frames of Presidential Leadership 52 Table 2.5 Table of Leadership Theories and Associated Studies 54 as per Bensimon, Neumann, and Birnbaum Table 2.6 Summary of Neumann and Bensimon Presidential 58 Leadership Types Table 2.7 Undergraduate Enrollment by Percent Race/Ethnicity 82 of Title III and V-eligible Institutions Table 3.1 College and University Presidents of Title III and V- 89 Eligible Private, Non-profit Institutions Table 3.2 LPI-Self Reliability Coefficients 92 Table 3.3 Research Questions, Hypotheses, and Statistical 97 Tests Employed Table 4.1 Geographic Distribution of Invited Sample and 107 Data Generating Sample Table 4.2 Ranking of LPI Descriptor Averages 111 Table 4.3 Comparison of LPI Descriptor Averages 120 Table 4.4 Independent t-test Results by Gender 122 Table 4.5 Pearson Product Moment Correlation Coefficient Results 125 & Years in Current Position

xiv
Table 4.6 Pearson Product Moment Correlation Coefficient Results 127 & Percentage Undergraduate Minority Students Table 4.7 Pearson Product Moment Correlation Coefficient Results 129 & Undergraduate Enrollment Table 4.8 Independent t-test Results by Campus Setting 132 Table 4.9 Independent t-test Results by Institutional Affiliation 135 Table 4.10 “Model the Way” ANOVA President Variables 136 Table 4.11 “Model the Way” Coefficients: President Variables 137 Table 4.12 “Inspire a Shared Vision” ANOVA President Variables 138 Table 4.13 “Inspire a Shared Vision” Coefficients: President Variables 138 Table 4.14 “Challenge the Process” ANOVA President Variables 139 Table 4.15 “Challenge the Process” Coefficients: President Variables 140 Table 4.16 “Enable Others to Act” ANOVA President Variables 141 Table 4.17 “Enable Others to Act” Coefficients: President Variables 141 Table 4.18 “Encourage the Heart” ANOVA President Variables 142 Table 4.19 “Encourage the Heart” Coefficients: President Variables 143 Table 4.20 “Model the Way” ANOVA Institutional Variables 145 Table 4.21 “Model the Way” Coefficients: Institutional Variables 145 Table 4.22 “Inspire a Shared Vision” ANOVA Institutional Variables 146 Table 4.23 “Inspire a Shared Vision” Coefficients: Institutional 147 Variables

xv
Table 4.24 “Challenge the Process” ANOVA Institutional Variables 148 Table 4.25 “Challenge the Process” Coefficients: Institutional 149 Variables Table 4.26 “Enable Others to Act ANOVA Institutional Variables 150 Table 4.27 “Enable Others to Act” Coefficients: Institutional 151 Variables Table 4.28 “Encourage the Heart” ANOVA Institutional Variables 152 Table 4.29 “Encourage the Heart” Coefficients: Institutional 153 Variables

xvi
List of Figures
Figure 2.1 Herzberg’s Motivation-Hygiene Content Theory 16 Figure 2.2 Ohio State Leadership Quadrants Resulting from the 24 Leadership Behavior Description Questionnaire (LBDQ) Figure 2.3 Blake and Mouton’s Managerial Grid 35 Figure 2.4 Kouzes and Posner’s Five Practices and Ten 44 Commitments of Leadership Figure 2.5 Mulcahy’s Continuum of Job Satisfaction, Leadership 47 & Decision Making in Leadership Analytics Figure 4.1 Histogram – Distribution of President Number of Years 108
in Current Position
Figure 4.2 Histogram – Distribution of Undergraduate Enrollment 109 Figure 4.3 Histogram – Distribution of Percent Undergraduate 110 Minority Enrollment Figure 4.4 Histogram – “Enable Others to Act” Raw Scores 113 Figure 4.5 Histogram – “Model the Way” Raw Scores 114 Figure 4.6 Histogram – “Inspire a Shared Vision” Raw Scores 116 Figure 4.7 Histogram – “Encourage the Heart” Raw Scores 117 Figure 4.8 Histogram – “Challenge the Process” Raw Scores 119

Chapter 1
Introduction
Introduction to Leadership in Higher Education
The university president is the chief executive officer (CEO) for the post-secondary
educational organization. Among the 4,352 degree-granting institutions in the United States
(Snyder, Dillow, & Hoffman, 2009), institutional size and operating budgets vary considerably,
as do the number and types of students, the mission, and the number and type of degree
programs. Yet, each institution is led by a president or chancellor as CEO.
Governance.
Legally, organizational authority and control reside with the governing board of each
college or university (Birnbaum, 1988a; Carnegie Foundation for the Advancement of Teaching,
1982). In early American higher education, the president was appointed by the board to act as the
board’s executive agent (Carnegie Foundation for the Advancement of Teaching, 1982). This
tradition remains, but governance is shared in higher education today between each institution’s
administration and its faculty (Bensimon, Neumann, & Birnbaum, 1989; Marcy, 2008). The
contemporary president leads the faculty, administration and students within the institution,
mediates between the institution and the governing board, and represents the institution to
external stakeholders (Association of Governing Boards of Universities and Colleges [AGB],
2006; Balderston, 1995).
Challenges facing higher education.
Internal and external environmental issues challenge the effective leadership and
administration of the institution (Kezar & Eckel, 2004; Marcy, 2004; Ramsden, 1998). The
current economic crisis is one such example of an enormous challenge, which calls for effective
2
leadership in higher education. Prior to the present crisis, the stability of higher education was
already threatened by a three-decade-old increase in costs that were gradually being transferred
to parents and students to the point of being prohibitive (Schweber, 2008). Other recent
challenges faced by college and university presidents included: increased accountability and
scrutiny, high numbers of impending faculty retirements, diversity among new faculty hires, and
the shrinking time frame for strategic decision-making (Kezar & Eckel, 2004). Marcy (2004)
discussed the shifting demographics of the American undergraduate student population and its
challenge to institutional finances. In 1998, Ramsden listed the top leadership challenges facing
academia, according to 100 university leaders, as: producing more with less, the instability of the
times and change needed in those times, and the changing face of post-secondary students and
their numbers. Presidents who have served for 10 or more years recently reported that the three
growing areas of presidential activities were: fundraising, accountability or assessment of student
learning, and financial management (American Council on Education [ACE], 2007).
Vulnerability of smaller, private institutions.
A major distinction between the 4,352 U.S. post-secondary institutions is type of control,
with an equal number of public and private, not-for-profit institutions (Snyder et al., 2009). For-
profit (private) institutions number 1,043 (Snyder et al., 2009), but were not included in this
research. Private institutions are at greater risk for closure than their public counterparts.
Between academic years 1969-70 and 2007-2008, 258 private, four-year institutions closed their
doors compared to just six public, four-year institutions during the same time period (Snyder et
al., 2009). A study conducted by Porter and Ramirez (2009) on three decades of private college
closings and mergers, presented at a 2009 conference, concluded that colleges and universities
with smaller endowment size, smaller enrollment size, and/or lack of religious affiliation, were at

3
greater risk for closure. Another study on private college closures and mergers between 1960 and
1994 listed contributing factors as: decrease in real value of tuition, increase in real faculty
salaries, shrinking student pool, and decline in religious affiliation (Bates & Santerre, 2000).
High selectivity and higher enrollments differentiate elite colleges and universities from
numerous private, four-year colleges that are “invisible,” that is, relatively unknown due to small
enrollments and lower selectivity (Astin & Lee, 1972). This “invisibility” leaves these
institutions more vulnerable to closure (Astin & Lee, 1972; Bates & Santerre, 2000; Porter &
Ramirez, 2009).
Title III and V.
Concern for the vulnerability of smaller institutions and a desire to expand post-
secondary educational opportunities in part prompted President Lyndon Johnson to advocate for
landmark legislation that became the Higher Education Act of 1965 (Boone, 1992). Specifically,
Title III of the Higher Education Act was created to provide competitive grant assistance to
public and private, degree-granting institutions determined to be at risk for survival (Hood,
1984). Title V, which, in addition to Title III-type conditions, serves institutions with a
substantial percentage of low-income Hispanic students, was added in a later reauthorization of
the Higher Education Act. Title III and V institutional eligibility is defined by a high enrollment
of low-income undergraduate students and low institutional educational and general expenditures
per student (U.S. Department of Education, 2009). Institutions may apply annually for Title III
and V designation. There were 219 such private, four-year colleges and universities located in
the United States among the 1,095 eligible institutions in 2007 (Appendix A). This study targeted
the presidents of these 219 colleges and universities, many of which may be categorized as
invisible and at greater risk for closure among private institutions.

4
Leadership in higher education.
The proliferation of leadership research in the latter half of the twentieth century may be
attributed to the belief, as expressed by leadership scholar Bass (2008), that, “Leaders also can
make the difference in whether organizations succeed or fail” (p. 8). The study of modern
leadership theory started in the early 1900s and higher education leadership studies have been
published over the past two decades by academics such as Birnbaum (1987, 1988a, 1988b,
1992), Neumann (1987), Bensimon, Neumann, and Birnbaum (1989), Neumann and Bensimon
(1990), Kezar (1996, 2000), Kezar and Eckel (2004), and Kezar, Carducci, and Contreras-
McGavin (2006). Though personal theories of effective higher education leadership differed, the
president’s legitimate and authoritative status was recognized and afforded the opportunity to
influence the institution (Neumann & Bensimon, 1990). The interest in academic leadership also
has produced numerous dissertations in recent years on college or university presidents’
leadership styles (Levine, 2000; Ogu, 2006; Roberts, 2005; Skyers, 2006; Webb, 2003).
Transformational leadership.
The research presented in this dissertation continued the work of previous scholarship yet
focused on the transformational leadership characteristics of private, not-for-profit, Title III and
V-eligible four-year colleges and university presidents. Since these institutions are at some level
of risk for survival, transformational leadership practices could provide the leverage needed for
continued existence and prosperity. Kouzes and Posner’s (2007) well-established Leadership
Practices Inventory (Self Instrument, 3rd Edition) was used to measure five transformational
behavior descriptors: “Model the Way”, “Inspire a Shared Vision”, “Challenge the Process”,
“Enable Others to Act”, and “Encourage the Heart” (p. 26). The president of a declining
institution must be the “chief change agent” who works in collaboration with stakeholders for

5
successful turnaround (Cowan, 1993). University presidents and higher education organizations,
institutes and research will benefit from a better understanding of the transformational
characteristics of those presidents who lead institutions with students whose needs are greater
and whose resources are limited. With the present national financial crisis presumably
deepening, leaders assume that the number of eligible institutions will almost certainly increase
in coming years.
This researcher possesses the experience and knowledge of university personnel and
functions, and the U.S. Department of Education’s Strengthening Institutions (Title III) program
that are needed to investigate this problem; has served in various administrative positions in a
private university for thirteen years; has worked with the president of a private, Title III-eligible
institution in the capacity of fundraising and community relations for five years; has served on
the institutional planning board for three years. Finally, this researcher has a working knowledge
of the Title III-eligibility and programming, having established the institution’s eligibility for the
past eight years. Under the university president’s leadership, this researcher recently coordinated
the submission of a Title III competitive, five-year grant application that resulted in an award.
Statement of the Problem
The purpose of this research was to investigate the transformational leadership
characteristics of college and university presidents of private, Title III and Title V-eligible
institutions and to determine if these were related to selected demographic characteristics of the
presidents and the institutions they lead.

6
Research Questions
Specifically, this research sought to answer the following questions:
1. What is the distribution of president responses to leadership practices, as measured by the
Leadership Practices Inventory-Self?
2. Is there a significant difference between president responses to leadership practices
related to the demographic variable of gender, as measured by the Leadership Practices
Inventory-Self?
3. Is there a significant relationship between president responses to leadership practices
related to the demographic variable of number of years in current position, as measured
by the Leadership Practices Inventory-Self?
4. Is there a significant relationship between president responses to leadership practices
related to the institutional variables of percentage undergraduate minority students and
undergraduate enrollment, as measured by the Leadership Practices Inventory-Self?
5. Is there a significant difference between president responses to leadership practices
related to the institutional variables of campus setting and institutional affiliation, as
measured by the Leadership Practices Inventory-Self?
6. Do the variables of president gender and president number of years in current position
significantly predict president responses to leadership practices, as measured by the
Leadership Practices Inventory-Self?
7. Do the variables of percentage undergraduate minority enrollment, undergraduate
enrollment, campus setting, and institutional affiliation significantly predict president
responses to leadership practices, as measured by the Leadership Practices Inventory-
Self?

7
Significance of the Study
In his book, Leadership and Performance Beyond Expectations, transformational
leadership scholar Bass (1985) acknowledged that academic governance tradition, complex
politics, numerous policies and requirements discourage the practice of transformational
leadership in institutions of higher education. The exceptions might include well-established,
highly reputable private institutions with significant endowments (Bass, 1985). Birnbaum
(1992) agreed that the effectiveness of transformational leadership was the exception to the rule
in higher education leadership and, in fact, considered strong transformational leadership
practices of the college or university president to be disruptive to institutional goals. Other
scholars (Hoff, 1999; Ramsden, 1998) distinguished between management and leadership in
higher education and advocated for the necessity of leadership, even transformational leadership,
in colleges and universities. In the 2006 book, Rethinking the “L” Word in Higher Education,
the authors cited numerous studies that challenged Bass’ conclusion about the limited place for
transformational leadership in higher education (Kezar et al., 2006). Further, the authors stressed
the important role transformational leadership can play in contemporary issues such as diversity,
assessment and technology (Kezar et al., 2006).
The research presented in this dissertation furthered the scholarship on transformational
leadership of college and university presidents. After a thorough search for research specific to
this population of Title III and V institutions, no published documents were located. The
characteristics of Title III and V institutions by nature preclude them from competitive ranking
and other mainstream categorizations (Miller, Gurin & Clarke, 1970). Further still, the findings
added to the body of knowledge of transformational leadership, as measured by Kouzes and
Posner’s Leadership Practices Inventory-Self. It is the intention of this study to encourage
8
additional research on leadership characteristics of college and university presidents, potentially
grouped in ways that are meaningful and useful for subsets of the population of higher education
institutions.
The research presented in this dissertation holds significance for: the governing boards,
presidents and senior administrators of Title III and V-eligible private, four-year institutions. In
addition, the research holds significance for the U.S. Department of Education’s Office of
Postsecondary Education, which includes the Title III and V program offices. The results of the
study should add to the body of knowledge of associations that serve private colleges and
universities, including the Association of Governing Boards of Universities and Colleges, the
Council of Independent Colleges, and the National Association of Independent Colleges and
Universities.
Definition of Terms
Campus Setting – Location of the institution’s campus as urban or non-urban.
Challenge the Process – Kouzes and Posner’s (2007) behavior descriptor label for the climate
created to allow for change, innovation, and experimentation.
Enable Others to Act – Kouzes and Posner’s (2007) behavior descriptor label for a deliberate,
distributed sense of personal empowerment and ownership within an organization.
Encourage the Heart – Kouzes and Posner’s (2007) behavior descriptor label for the practice of
encouraging and recognizing achievement and promoting endurance.
Inspire a Shared Vision – Kouzes and Posner’s (2007) behavior descriptor label for the
enthusiastic articulation of what “could be” and the implicit invitation to share that belief.
Institutional Affiliation – Religious affiliation or no affiliation, i.e., an independent institution.

9
Minority Enrollment – The total number of undergraduate students (full and part-time) who are
Alaska Native, American Indian, Asian-American, Black (African-American), Hispanic
American, Native Hawaiian, or Pacific Islander, as reported for 2007 and documented in the U.S.
Department of Education’s Integrated Postsecondary Education Data System (IPEDS).
Model the Way – Kouzes and Posner’s (2007) behavior descriptor label for the practice of
behaving according to one’s set of values in order to provide the example to follow.
Title III and V-eligible – Designation given by the U.S. Department of Education to applicants
that apply for and meet the eligibility requirements of number of low-income students and low
educational and general expenditures per student, or are granted a waiver (U.S. Department of
Education, 2009).
Undergraduate Enrollment – Total number (full and part-time) of undergraduate students, as
reported for 2007 and documented in the U.S. Department of Education’s Integrated
Postsecondary Education Data System (IPEDS).
Limitations of the Study
This study was limited to the subjects, materials and procedures utilized to conduct this
research undertaking. Specifically, this study was limited to an investigation of transformational
leadership characteristics of private Title III and Title V-eligible college and university
presidents. Regarding the research subjects, this study was limited to the data-generating sample
of 146 presidents of Title III or V-eligible, private, not-for-profit, four-year colleges and
universities. Further, the study was limited to the validity and reliability of the research
instrument, the Leadership Practices Inventory (Self Instrument, 3rd Edition). In addition, this
study was limited to the specific statistical analysis techniques employed to examine the data.

10
Organization of the Study
This study was presented in five chapters. Chapter 1 presented the introduction, statement
of the problem, research questions, definition of terms, significance of the study, limitations of
the study, and organization of the study. Chapter 2 presented a review of literature, as that review
was reflective of leader behavior literature, and Title III and Title V institutions literature.
Chapter 3 presented the subjects, materials and procedures. Chapter 4 presented an analysis of
the findings. Chapter 5 presented the conclusions and recommendations for future research.

11
Chapter 2
Review of Literature
Leadership Theorists
The phenomenon of leadership is social by virtue of its nature, that is, its existence
requires some level of interaction between two or more people. Leadership requires a group of
people, requires influence, and requires goals (Northouse, 2004). A commonly accepted
definition of leadership is lacking. Even among scholars, 587 books published between 1900 and
1990 presented 221 definitions on leadership (Rost, 1993). The study of leadership has been
undertaken in a variety of settings and is naturally interdisciplinary (Rost, 1993). The field of
industrial psychology, which brings together the study of human behavior in the organizational
setting, provided the focus for this study. Whether implicit or explicit, the study of motivation
played a critical role in leadership research. In fact, leadership theorists Hersey and Blanchard
devoted 67 of the 312 pages of their 1982 book, Management of Organizational Behavior, to
motivation. In order to better grasp the findings of major leadership theorists, then, a brief survey
of prominent motivation theorists would benefit the reader. As Adair (2006) stated, “Leadership
and motivation are like brother and sister” (p. 7).
The studies included in this review of literature appeared to have been undertaken within
the theoretical lens of positivism, not including Kezar’s approach, which appeared to fit within
Mertens’ (2010) concept of a transformative paradigm. Most theories and research that follow
took the quantitative approach. As Mertens (2010) explained, “positivists held that the use of the
scientific method allowed experimentation and measurement of what could be observed, with the
goal of discovering general laws to describe constant relationships between variables” (pp. 10-
11). According to positivism, an independent reality existed that could be studied and

12
understood, with conclusions drawn and predictions made (Ponterotto, 2005). This intent,
implied or otherwise, was apparent throughout the studies and theories that make up this
literature review.
Classic motivation theorists.
The Hawthorne Studies of the late 1920s to early 1930s revealed ground-breaking
perspectives on worker attitudes and motivations (Carey, 1967). Researchers of Western Electric
Company’s Hawthorne plant had hypothesized and carefully designed experiments to study the
effect of work conditions on productivity, only to discover, much to their chagrin, that other,
unaccounted for variables were at play (Roethlisberger, 1989). In particular, the discovery that
social benefits of work were more important to workers than financial benefits was “the great
élaircissement, the new illumination”, according to Roethlisberger (1989, p. 7). Consequently,
the study of work motivation became the focus of industrial psychologists and social scientists,
which, in part, resulted in new motivation theories by the 1950s (Steers, Mowday & Shapiro,
2004). The best known theorists included Maslow, Herzberg and Vroom (Hofstede, 1980). Since
that time, motivation theories have played a role, explicit or implied, in the study of leader
behaviors and development of leadership theories.
Maslow.
Maslow introduced his needs theory of motivation in 1943, which had tremendous
ramifications for organizational leader behavior. The 13 propositions challenged contemporary
beliefs and assumptions that focused on separable, physiological needs as the model and basis
for the study of motivation, i.e., this new theory was distinctly “anthropocentric” rather than
“animalcentric” (Maslow, 1943a; Maslow, 1943b). Maslow introduced the concept of a
hierarchy of prepotent needs as the basis for human motivation with the five categories of basic

13
needs identified as: physiological, safety, love, esteem, and self-actualization (Maslow, 1943b).
Maslow’s needs were organized in a hierarchy because of their prepotency, that is, the nature of
each need’s individual influence within a human being over the others.
An additional distinction was made by Maslow between the physiological, safety, love,
and esteem needs on the one hand, and self-actualization needs on the other. The first group of
needs were characterized as “deficit needs” whereas the need for self-actualization was known as
“being needs”, each of which prompted deficiency motivation and growth motivation,
respectively. According to Maslow (1962), “the psychological life of a person, in many of its
aspects, is lived out differently when he is deficiency-need-gratification-bent and when he is
growth-dominated or ‘metamotivated’ or growth-motivated or self-actualizing” (p. 25). If one
were to label Maslow’s hierarchy of needs from Level 1 to Level 5, Levels 1-4 would be
“deficiency needs” and Level 5 would be the “being” or “growth need” (Hall, Lindzey, &
Campbell, 1998; Shaffer, 1978).
Physiological needs were recognized by Maslow as the most prepotent of the basic needs.
Further, these “classic” needs of hunger, thirst and sex were acknowledged as different from
others in Maslow’s hierarchy because they could be isolated and attributed back to a specific
physical drive. The hierarchy was arranged in the order of basic needs as they emerged once the
previous need was satisfied to some acceptable level. Consequently, once the physiological
needs were satisfied, the need for safety would take the prepotent position, and so on. However,
Maslow also explained that the basic needs did not emerge one by one but rather, co-existed in
certain levels of fulfillment. The exception would be the overriding existence of an unfulfilled
need, such as extreme, enduring hunger. In such a situation, the person would be besieged with

14
constant thoughts of this unfulfilled need even to the extent that how he or she saw the future
would be primarily in terms of the fulfillment of that need.
Later, an important distinction was made with regards to the highest level need, self-
actualization (Lawler, 1994; Maslow, 1970). Unlike the other needs, which decreased when
fulfilled, the attainment of some level of self-actualization stimulated the desire for additional
self-actualization. Maslow (1962) explained that for people motivated by growth, “Gratification
breeds increased rather than decreased motivation, heightened rather than lessened excitement”
(p. 28).
Various researchers studied Maslow’s theory in the context of work motivation.
According to Landy and Trumbo (1980), some studies looked for differences between the needs
focus at various organizational levels (cross-sectional research) while others applied the theory
longitudinally. The results of Hall and Nougaim’s 1968 study contradicted Maslow’s theory, as
did Lawler and Suttle’s 1972 study (Landy & Trumbo, 1980). Finally, Wahba and Bridwell’s
1976 review of research on Maslow’s theory demonstrated that cross-sectional study results were
weak and longitudinal studies did not support the theory (Landy & Trumbo, 1980). Regardless of
the criticisms, however, Maslow’s hierarchy of needs theory has graced most organizational
behavior textbooks since the 1950s (Dye, Mills, & Weatherbee, 2005).
Herzberg.
Like Maslow, Herzberg recognized and categorized human needs as biological or
achievement-oriented. Further, Herzberg theorized that humans were born with these needs
(Landy & Trumbo, 1980). Unlike Maslow, however, Herzberg identified these needs from
industry. Herzberg’s two categories of needs (two-factor theory), which he labeled “hygiene”
and “motivator”, were each comprised of numerous components that had been identified from 16

15
industry studies (Herzberg, 1967). Hygiene and motivator factors were associated with job
dissatisfaction and satisfaction, respectively.
The hygiene factors, synthesized from 1,844 on-the-job events, were “company policy
and administration”, “supervision”, “relationship with supervisor”, “work conditions”, “salary”,
“relationship with peers”, “personal life”, “relationship with subordinates”, “status”, and
“security” (Herzberg, 1967, p. 108). The nature of hygiene factors was such that they could
contribute to job dissatisfaction, which could only be rated between strong dissatisfaction to
neutral (Lawler, 1994). That is, hygiene factors were not able to contribute to job satisfaction.
Herzberg (1967) also referred to the hygiene factors as “dissatisfaction-avoidance” factors or
KITA, the acronym for kick in the (pants). Actually, Herzberg (1967) made it clear that KITA,
whether negative physical, negative psychological, or positive, was not motivation.
Motivator factors, on the other hand, contributed to job satisfaction. The motivator
factors, synthesized from 1,753 on-the-job events, were “achievement”, “recognition”, “work
itself”, “responsibility”, “advancement”, and “growth” (Herzberg, 1967, p. 108). The ratings for
motivator factors ranged from neutral to strong satisfaction (Lawler, 1994). According to
Herzberg (1967), the range from job dissatisfaction to job satisfaction did not exist as opposites
on a single continuum (Figure 2.1). To be more precise, Herzberg (1967) explained that, “the
opposite of job satisfaction is not job dissatisfaction but, rather, no job satisfaction; and,
similarly, the opposite of job dissatisfaction is not job satisfaction, but no job dissatisfaction” (p.
107). Further, an employee could experience both job satisfaction and job dissatisfaction
simultaneously (Lawler, 1994).

16
Figure 2.1. Herzberg’s Motivation-Hygiene Content Theory (Mulcahy, 2009, p. 4). Used with permission.

17
Both hygiene and motivator factors should be provided in the workplace (Lawless, 1972).
An employee’s satisfied hygiene factors would minimize job dissatisfaction. In other words,
satisfied hygiene factors were preventive (Lawless, 1972). In order to be productive, however, an
employee’s motivator factors needed to be addressed as well. Further, according to Landy and
Trumbo (1980), an employee experiencing extreme job dissatisfaction would likely leave that
particular employment prior to having experienced satisfied motivator factors.
The lack of theoretical concepts of correlation between job factors and performance, or
any relationship between job factors, behaviors, performance, and outcomes, led Lawler (1994)
to conclude that Herzberg’s concept of job satisfaction and dissatisfaction was not a theory of
motivation. However, Tiffin and McCormick (1965) referenced a 1963 study by Schwartz,
Jenusaitis, and Stark, as well as a 1964 study by Myers, confirming Herzberg’s hygiene and
motivator factor components, which were referred to as dissatisfiers and satisfiers.
Vroom.
Captivated by the emerging field of industrial psychology and leading leadership
theorists of the day such as Likert, Shartle, and Maier, and influenced by the ideas of expectancy
motivation theorist Lewin, Vroom began to develop his Expectancy Theory, which was also
known as Valence Instrumentality and Expectancy Theory (VIE), shortly after completing his
dissertation at the University of Michigan in 1958 (Vroom, 1993). Isaac, Zerbe, and Pitt (2001)
presented a simplified formula for the motivational state and a straightforward diagram of the
conceptual process involved in Expectancy Theory. The formula consisted of the multiplication
of Expectancy, Instrumentality, and Valence to produce Motivation. Expectancy was comprised
of the employee’s belief that the effort to be exerted would generate a specific outcome;
Instrumentality was comprised of the employee’s belief that a specific performance would

18
generate a specific outcome (i.e., the “reward” for the employee); and Valence referred to how
much the employee desired the specific outcome (Vroom, 1964).
With a seminal focus on the application of Expectancy Theory to motivation in the
workplace, Vroom developed an equation of sorts to describe the interrelationship between a
worker’s desire to attain an outcome, the worker’s confidence that the activity would produce
that particular outcome, and the worker’s ability to perform the activity (Behling & Starke,
1973). Lawler (1994) mapped out the following description of the first part of Vroom’s theory:
Force = Σ (E x V), in which Σ represented the products of all the outcomes, Expectancy (E)
represented the worker’s confidence that the particular activity would produce the outcome, and
Valence (V) represented the worker’s desire to attain that outcome. Vroom (1964) compared his
concept of Force as similar to contemporary scholars’ concepts of behavior potential with
direction and magnitude.
The value of Vroom’s E ranged from a minimum of 0 to a maximum of 1. The value of V
could range from negative (-1) to neutral (0) to positive (+1), depending of the worker’s desire,
indifference or objection to outcome attainment. The resulting Force (motivation) would be
positive, neutral, or negative, depending on the value of E (Vroom, 1964). Vroom (1965) went
on to express motivation in the context of job performance as, “Performance = f (Ability X
Motivation)” (p. 32). Thus, Vroom (1965) made the observation that the effects of ability and
motivation on job performance were not additive, but multiplicative in nature. Further, both
played equally important roles in job performance.
In his book, Work and Motivation, Vroom (1964) acknowledged that his theory was
untested. However, suggestions of how one might measure and experimentally manipulate
Valence and Expectancy were presented. A rich history and contemporary theories and studies

19
on motivation in the context of the workplace were presented and Vroom’s recommendations for
further study were presented in the framework of that era’s scholarship.
Research on Vroom’s VIE model produced some common findings, according to Landy
and Trumbo (1980). First, performance could not be predicted as precisely as effort. This was
attributed to the worker’s ability to control his or her effort, whereas performance was influenced
by factors that were outside of the worker’s control. Second, effort was more strongly influenced
by Valence (the worker’s desire to attain an outcome) than by Instrumentality or Expectancy.
Third, correlations between effort and the components of Valence, Instrumentality and
Expectancy were found to be “not particularly strong” (Landy & Trumbo, 1980, p. 348).
Porter and Lawler.
According to Behling and Starke (1973), Porter and Lawler’s Expectancy Model was one
of five to be developed based on Vroom’s Expectancy Theory. Porter and Lawler’s hypothesis
was similar to Vroom’s, but the former renamed Vroom’s “Force” as “Effort” (Behling & Starke,
1973), and added the multiplicative of role perceptions to effort and ability (Heneman &
Schwab, 1972). A simple, conceptual equation of Porter and Lawler’s theory, then, would be
written as “P = f(E × A × R)”, in which P is job performance, E is effort or motivation, A is
ability, and R is Role perceptions (Henemann & Schwab, 1972, p. 1).
Porter and Lawler diagrammed an elaborate flow chart to illustrate this theoretical model
in their 1968 book, Managerial Attitudes and Performance. The flow chart included 10
variables, of which four extended beyond the performance itself and one looped back to
influence an initial variable. The theoretical model was designed to illustrate the relationship
between workers’ mind-set and their job performance.

20
The 10 variables were: value of reward, perceived effort-reward probability, effort,
abilities and traits, role perceptions, performance, intrinsic rewards, extrinsic rewards, perceived
equitable rewards, and satisfaction (Porter & Lawler, 1968). The word or phrase used to label
each variable could have multiple meanings, depending on the context in which it was used, but
Porter and Lawler’s definitions for each variable were very specific, as applied to motivation in
the workplace. Performance referred to work-relevant behavior that resulted from associated
effort. The amount of effort expended towards performance was influenced by the individual’s
desire for the potential reward and his or her perception that the effort would result in the reward
desired by the individual. Porter and Lawler (1968) recognized that effort was further qualified
by abilities and traits of the individual as well as his or her role perception that the specific
performance was expected by his or her superiors in the organization. The attainment of the
intrinsic and/or extrinsic rewards could reinforce the perceived effort-reward probability. The
performance influenced the perceived equitable rewards. Finally, the resulting satisfaction of
internal and/or external reward attainment and the influence of perceived equitable rewards
reinforced the value of the reward.
Porter and Lawler (1968) tested and revised their theoretical model through correlational
studies that examined attitudes toward pay, role perceptions, need fulfillment, need satisfaction,
and satisfaction with pay. In 1972, Heneman and Schwab reported that the results of nine field
studies confirmed the significant relationship between valence, instrumentality, role perceptions,
and performance. Mulcahy (2000) explained the Porter-Lawler Model of performance
motivation as follows: motivation was a function of effort, as influenced by the value of reward
and reward expectations.

21
Classic leadership theorists.
The modern study of leadership is considered to have begun in the early 1900s,
chronicled by Stogdill’s 1948 literature review that documented 128 contemporary studies on the
subject (Bass, 2008). At the time of Stogdill’s review, leaders had been studied for almost a half
century, primarily to identify distinct traits that could be attributed to their ability to lead or to
some recognition of inherent leadership characteristics (Bass, 2008; Chemers, 2000; Horner,
1997; Jago, 1982; Northouse, 2004). Chemers (2000) credited this emerging interest of the early
twentieth century in part to the development of intelligence tests in the field of psychology.
Stogdill concluded in 1948, though, that “A person does not become a leader by virtue of the
possession of some combination of traits” (as cited in Kirkpatrick & Locke, 1991, p. 48). This
conclusion strongly influenced the direction of subsequent research away from further study of
traits at that time (Lord, De Vader, & Alliger, 1986).
Ohio State Leadership Studies.
The Ohio State Leadership Studies project began in 1945 with a focus on leader behavior
and performance. In the introduction to the 1957 research monograph, Leader Behavior: Its
Description and Measurement, Shartle, initiator of the Ohio State Leadership Studies, explained
the deliberate approach to the study of behavior rather than the conventional study of traits. Trait
research had failed to produce a reasonable theory and definition for leadership. Further,
researchers had presumed that “only ‘good’ leadership is leadership”, and consequently had not
studied all leadership, effective or otherwise (Shartle, 1957, p. 2).
The staff of the Ohio State University’s Personnel Research Board focused both on what
constituted leader behavior and how leaders lead. In the early stages of their research, the team
worked to design a questionnaire that could be used to measure these behaviors (Hemphill &

22
Coons, 1957; Yukl, 1981). An interdisciplinary approach to the classification and labeling of
leader behaviors was employed by a team of psychologists, sociologists, and economists so that
the questionnaire would be able to be used in a wide variety of disciplines and settings (Hemphill
& Coons, 1957). The questionnaire would be used by group members to describe the leader
behaviors of their leader (Halpin, 1957). Hemphill and Coons (1957) documented the
development of the instrument, the Leader Behavior Description Questionnaire (LBDQ), in
which they explained the process and considerations that went into the identification of 10 leader
behavior dimensions: Initiation, Membership, Representation, Integration, Organization,
Domination, Communication Up, Communication Down, Recognition, and Production.
In addition to explaining and describing the dimensions of what constituted leader
behavior, the authors also explained the ways in which the questionnaire was able to measure
how leaders lead. Hemphill and Coons (1957) wrote that analysis of leader behavior dimensions
would reveal the following characteristics:
1. A leader may stress being a socially acceptable individual in his interactions with other group members.
2. A leader may stress “getting the job done.” This would involve emphasis upon group conduction and concern with problems relative to obtaining the group’s objectives.
3. A leader may stress making it possible for members of a group or organization to work together. Emphasis would be on the leader’s job as one of a “group catalyst.” (p. 37)
Halpin and Winer (1957) continued to conduct research and develop the LBDQ. They
revised and reduced the number of leader behavior dimensions to Membership, Communication,
Organization, Production, Domination, Leadership Quality, Goal Direction, and Initiative. In
turn, these were further reduced to four factors: Consideration, Initiative Structure, Production
Emphasis, and Sensitivity (social awareness). Halpin and Winer (1957) eventually concluded
that both Production Emphasis and Sensitivity (social awareness) were negligible and thus were

23
eliminated. Consequently, two major dimensions emerged from the factor analysis: Initiating
Structure and Consideration. This made it possible for the researchers to shorten the LBDQ from
its initial 150 questions to 40, with 15 items each to measure Consideration and Initiating
Structure, and an additional 10 “buffer” items for tone that would also measure the less
significant factors of Production Emphasis and Sensitivity (Halpin & Winer, 1957).
The two significant factors, Initiating Structure and Consideration, were each regarded as
a particular orientation towards leadership, task-oriented and relationship-oriented, respectively
(Yukl, 1981). While separate and distinct, these orientations concurrently functioned at different
levels (Wren, 1995). Thus, their values, as measured by the LBDQ, could be plotted on two axes
(Wren, 1995). Initiating Structure (task orientation) was plotted on the horizontal axis, from low
to high, and Consideration (relationship orientation) was plotted on the vertical axis, from low to
high. Four quadrants emerged that reflected the combinations of task and relationship orientation
in a leader’s behavior (Figure 2.2). They were: (1) Low Structure and Consideration, (2) High
Structure, (3) High Consideration, and (4) High Structure and Consideration.

24
Figure 2.2. Ohio State Leadership Quadrants Resulting from the Leadership Behavior Description Questionnaire – LBDQ (Mulcahy, 2009, p. 58). Used with permission.
The fourth revision of the LBDQ questionnaire, known as the LBDQ XII, was published
in 1962. The LBDQ XII contained 100 items, making it significantly longer than the 1957

25
LBDQ version with 40 items. In the Manual for the LBDQ XII, Stogdill (1963) explained that,
following the development of the original questionnaire, continued research into role
differentiation and group achievement resulted in 12 subscales to measure, with five or 10 items
assigned per subscale. The original two subscales of the LBDQ, Initiating Structure and
Consideration, were joined by “Representation”, “Demand Reconciliation”, “Tolerance of
Uncertainty”, “Persuasiveness”, “Tolerance and Freedom”, “Role Assumption”, “Production
Emphasis”, “Predictive Accuracy”,” Integration”, and “Superior Orientation” (Stogdill, 1963, p.
3). Subsequently, the Ohio State group developed additional leadership instruments, the
Supervisory Behavior Description (SBD) and the Leadership Opinion Questionnaire (LOQ),
which were both designed to measure Initiating Structure and Consideration in industry settings
(Fleishman, 1957).
The phenomenon of Initiating Structure and Consideration captured the interest of
leadership theorists and dominated research until the 1970s (Francoeur, 2008; Judge, Piccolo, &
Iles, 2004). Yukl (1981) provided detailed descriptions of behaviors associated with each
dimension that offered insights into possible relationships between leaders and subordinates.
Consideration included behavior items concerned with leader supportiveness, friendliness, consideration, consultation with subordinates, representation of subordinate interests, openness of communication with subordinates and recognition of subordinate contributions. These “relationship oriented” behaviors are all instrumental for establishing and maintaining good relationships with subordinates. Initiating Structure included behavior items concerned with directing subordinates, clarifying subordinate roles, planning, coordinating problem solving, criticizing poor work, and pressuring subordinates to perform better. These “task-oriented” behaviors are instrumental for efficient utilization of personnel and resources in the attainment of group goals. (p.106)
In fact, for two decades, researchers endeavored to establish and measure relationships between
leader Initiating Structure and Consideration behaviors and outcome measures, such as employee
satisfaction, grievances and turnover. Task performance was the main outcome criterion of

26
study; other criteria included counterproductive subordinate behaviors such as absenteeism,
grievances, and job turnover (Yukl, 1981). An assortment of conclusions was reported by various
studies. The least desirable combination was low Initiating Structure and low Consideration
(Fleishman & Harris, 1998). Further, the International Harvester studies of the 1950s
demonstrated that while the combination of high Initiating Structure and low Consideration was
favored by management, this combination was also associated with higher subordinate absences,
turnover, grievances and low job satisfaction (Fleishman & Harris, 1998). Bass (2008) reported
that Initiating Structure and Consideration were demonstrated to have a positive correlation in
multiple studies. However, Fleishman and Harris (1998) noted that the relationship was
curvilinear, not linear. That is, when the level of leader Consideration was increased, at some
level it would cease to influence subordinate turnover and grievances. Further, the combination
of very low Consideration and very high Initiating Structure resulted in an increase in
subordinate turnover and grievances (Fleishman & Harris, 1998).
Yukl (1981) reported that other studies such as Kerr and Schreisheim in 1974, Stogdill,
in 1974, and Yukl in 1971 were each unable to consistently demonstrate a relationship between
leader behavior of Initiating Structure and Consideration, and subordinate satisfaction. However,
according to Francoeur (2008), the results of various studies may have brought into question the
types and strengths of relationship between Initiating Structure and Consideration and other
outcome measures, but the most damaging was published by Korman in 1966. Korman’s
criticisms strongly influenced a trend away from continued study of Initiating Structure and
Consideration theory despite Kerr and Schriesheim’s 1974 refutation of Korman’s conclusions
(Francoeur, 2008). Still, although researchers turned elsewhere in the continued pursuit of leader
behavior theories, the study of Initiating Structure and Consideration continued. Researchers

27
Judge, Piccolo and Iles (2004) published a meta-analysis of 130 studies that were conducted and
available on the PsycINFO database through 2001. Judge, Piccolo and Iles’ (2004) study, “The
Forgotten Ones? The Validity of Consideration and Initiating Structure in Leadership Research,”
reported a fairly strong correlation between Consideration and Initiating Structure and leadership
outcomes and concluded that these studies and this leadership theory could continue to, “prove
useful once again in leadership research” (p. 47).
Likert.
At the same time that the Ohio State studies were launched, social research being
conducted at the University of Michigan was reinvented and intensified in 1946 through the
newly-established Survey Research Center. Likert and colleagues who had left the downsized
federal Division of Program Surveys at the end of World War II were able to reach an agreement
with the University of Michigan’s administration to establish the Center, which was promptly
renamed the Institute for Social Research in 1948 (Likert, 1979). Likert, a Michigan alumnus
who had gone on to earn a Ph.D. in Psychology from Columbia University, was named the
Institute’s first director (Frantilla, 1998). Over the next few decades, Likert and associates
conducted research into leader behavior, which became known as the Michigan Leadership
Studies (Yukl, 1981). The Ohio State studies have been included in contemporary historical
leadership accounts more frequently than the Michigan studies. This author noted that among
nine articles and books on modern leadership theories, all nine included the Ohio State studies
compared with just five instances of the Michigan studies’ inclusion.
The theory of four systems of management was published in Likert’s 1961 book, New
Patterns of Management. Bass (2008) described the systems as “interpersonal relationships in
large organizations” (p. 453). According to Likert (1967), leadership style was consistent within

28
one system rather than comprised of a combination of components from different systems. The
nature and character of the leadership represented by each system was summarized as follows:
Systems 1 through 4 were labeled Exploitative-Autocratic, Benevolent-Autocratic, Consultative,
and Participation (Likert, 1967; Mulcahy, 2000, 2009). A manager whose leadership was
characterized by top-down relations, centralized decision-making and control would be
considered autocratic; his or her emphasis on punishment, threats and other negative
characteristics would represent a System 1, Exploitative-Autocratic management style, whereas a
System 2 Benevolent-Autocratic style, would emphasize a more positive-type reinforcement
(Bass, 2008). Systems 3 and 4 represented increases in the manager’s trust and confidence in
subordinates and an increased sharing in goal-setting and decision-making (Bass, 2008).
Likert (1967) illustrated the nature of leadership behaviors from System 1 through to
System 4 in the Table of Organizational and Performance Characteristics of Different
Management Systems. In the Table, seven organizational variables were presented, each with
two to five statements of leader behaviors to be labeled high or low on a scale that was labeled
System 1, 2, 3 and 4, and had additional statements from which to choose for the label. The
seven variables were: “Leadership processes used”, “Character of motivational forces”,
“Character of communication process”, “Character of interaction-influence process”, “Character
of decision-making process”, “Character of goal setting or ordering”, and “Character of control
processes” (pp. 4-10). Statements that illustrated the natures of Systems 1 through 4 reflected the
leadership behaviors of Likert’s theory. For example, the statement, “Extent to which superiors
have confidence and trust in subordinates” was accompanied by the following choices (one high
and one low): System 1: “Have no confidence and trust in subordinates”, System 2, “Have
condescending confidence and trust, such as master has to servant”, System 3, “Substantial but

29
not complete confidence and trust; still wishes to keep control of decisions”, and System 4,
“Complete confidence and trust in all matters” (Likert, 1967, p. 4).
According to Likert (1967), each system could be further understood through the
interrelationships between causal variables, intervening variables and end-result variables.
Leadership style determined the causal variables of organization and behaviors; these variables
were independent of the intervening and end-result variables (Likert, 1967; Yukl, 1981). The
intervening variables of subordinate attitudes towards the leader, organization, and peers were
shaped by the causal variables. The measurable end-result variables of productivity were
influenced by the intervening variables which, in turn had been influenced by the causal
variables.
Patterns of decision making and supervision differed among Likert’s systems. Systems 1
and 2 were characterized by the traditional, one-to-one, leader-subordinate mechanism for
decision-making, interaction and supervision at every organizational level. Likert (1967)
explained:
In this model, starting at the top of the firm, the president has full authority and responsibility. He delegates to each vice-president specific authority and responsibility and holds each accountable. Each vice-president in turn does the same with each of his subordinates, and this continues down through the organization. The entire process–stating policy, issuing orders, checking, controlling, etc.–involves man-to-man interaction at every hierarchical level. (p. 50)
In contrast, the “linking pin” model was introduced by Likert (1967) to reflect System 4’s group
pattern of decision making and supervision. In the “linking pin” model, the leader-subordinate
relationship was group-oriented. Each leader would have a group of subordinates who, in turn,
were leaders to the next lower group of subordinates. Likert (1967) explained that the individuals

30
who were in the position of leader to a lower group and simultaneously in a subordinate position
in a higher group were known as the “linking pins”.
System 4 management, which included the group pattern of decision making and
supervision, was considered by Likert (1967) to be the system of choice because of its resulting
higher productivity with low absences and turnover. Even though Systems 1 and 2 could
demonstrate high productivity short-term, it would not be sustained by System 1 or 2 over the
long term. Yukl (1981) renamed Likert’s System 4 causal variables as leadership variables, and
identified the System 4 end-result variables as a high level of productivity and quality of work,
with low absenteeism, turnover and grievance rates. As stated earlier, these end-product
variables resulted from the causal or leadership variables. The Michigan Studies included the
five-year, Inter-Company Longitudinal Study (ICLS) that yielded the following conclusion, “The
results consistently show that the closer to System 4 a firm’s management system is, the more
favorable the attitudes and the greater the productivity” (Likert, 1979, p. 155).
McGregor.
A prominent management theorist of the late 1950s through the 1960s, McGregor
developed a dichotomy of leadership practices that he labeled “Theory X” and “Theory Y”
(Bass, 2008). Both theories involved assumptions about human motivation, behaviors, and the
intrinsic nature of organizations (McGregor, 1989). In his well-known treatise, “The Human Side
of Enterprise,” McGregor challenged the then-common managerial assumptions that
subordinates were lazy, unmotivated, self-centered, and dimwitted and therefore in need of strict,
close management administered through a system of reward-and-punishment (“Theory X”)
(McGregor, 1989). Mulcahy (2009) summarized assumptions made by Theory X and Theory Y
leaders about followers (Table 2.1).

31
Table 2.1
Theory X Assumptions and Theory Y Assumptions Table (Mulcahy, 2009, p. 24). Used with permission.
Theory X Assumptions
Theory Y Assumptions
People by nature: People by nature: 1. Lack integrity. 1. Have integrity. 2. Are fundamentally lazy and desire to work as little as possible.
2. Work hard toward objectives to which they are committed.
3. Avoid responsibility. 3. Assume responsibilities within these commitments.
4. Not interested in achievement. 4. Desire to achieve. 5. Are incapable of directing their behavior. 5. Are capable of directing their behavior. 6. Are indifferent to organizational needs. 6. Want their organization to succeed. 7. Prefer to be directed by others. 7. Are not passive or submissive. 8. Avoid making decisions whenever possible. 8. Will make decisions within their commitments. 9. Are not very bright. 9. Are not stupid.
Theory X, according to McGregor (1989), focused on motivating subordinates through
their lower order physiological and safety needs. Instead, McGregor (1989) proposed a new
theory, “Theory Y”, in which the environment was designed to tap into human motivation to
satisfy higher order social, ego and self-fulfillment needs. Bass (2008) labeled Theory X and
Theory Y as autocratic and democratic respectively. McGregor (1957) suggested that the
subordinate’s lack of motivation towards organizational goals was the result of Theory X
managerial practices. Successful transition to Theory Y practices might include the following
steps: “decentralization and delegation”, “job enlargement”, “participation and consultative
management”, and “performance appraisal” (McGregor, 1989, p. 19).

32
Argyris.
Beginning in the 1950s, Argyris brought a unique, psychological perspective to the study
of leadership. With an A.B. in psychology and business and an M.A. in economics and
psychology, Argyris went on to earn a Ph.D. in organizational behavior from Cornell University
in 1951 (Putnam, 1995). Following graduation, Argyris was employed by the Yale Labor and
Management Center until 1970, at which time he joined the faculty of the Harvard University
Graduate Schools of Business and Education (Putnam, 1995).
Earlier in his career, Argyris (1955) studied and wrote of the contrast between the state of
the adult human personality and the workplace environment. Development of human personality
progressed from infancy to adulthood, characterized as maturation from a receiving to
controlling culture, from passivity to activity, from narrow behaviors to flexibility, from
subordinate to equal or super-ordinate positions, from dependence to independence and
interdependence (Argyris, 1955). In direct contrast, administrative management principles
presumed the need to treat subordinates such that they had almost no control, were passive, were
kept as subordinates, were allowed only a small measure of flexibility, and were situated in a
way that their dependence on the boss was maintained (Argyris, 1955).
Working with then-current empirical research of organizational human behavior to create
a framework that would expose patterns, Argyris reported in his 1957 book, Personality and
Organization, that organizations had both formal and informal counterparts and that the informal
organization existed for employees to be able to maintain their health in the unhealthy
environment sustained by the formal organization. The formal organization operated based on
the administrative management principles described in the previous paragraph; these were the
causes of employee frustration, tension, and other undesirable, work-related feelings. The

33
informal organization, according to Argyris, provided outlets for the employee. Activities that
could become part of the informal organization included: demanding control and participation
through unions, leaving the employment of the organization, and maintaining formal
employment but leaving “psychologically” (Argyris, 1973).
Likert (1957) also included a measure of the informal organization and its potential
opposition to the goals of the formal organization in his Table of Organizational and
Performance Characteristics of Different Management Systems. On one end of the spectrum,
System 1 was characterized by conflicting goals between the informal and formal organization,
whereas on the other end of the spectrum, System 4 was characterized by the complete unanimity
of the informal and formal organizations’ goals. In a 1950 article, Stogdill explained that the
informal organization existed alongside the formal organization “as a result of the development
of discrepancies (a) between work performance and responsibilities defined and (b) between
informal interactions and formally defined interactions” (Stogdill, 1997, p. 118). It was the task
of the leader, according to Stogdill, to resolve the discrepancies, including those between the
needs of the individual and the organization.
Argyris (1973) later provided a list of four possible individual and organizational
conditions, the combinations of which could be compared to that between actual organizations
and their employees for predictive purposes of congruence. Each condition was presented as
either a dimension “the individual aspired toward” or a dimension “the organization required that
the individual aspire toward ” (p. 143). Argyris’ four individual-organizational combinations
were: (1) adulthood/infancy, (2) infancy/adulthood, (3) adulthood/adulthood, and (4)
infancy/infancy. Organizations with individuals that reflected the third and fourth dimension

34
combinations, according to Argyris (1973), would experience less informal organizational
behavior.
Argyris (1971) built on McGregor’s Theory X and Theory Y framework, adding
descriptions of “interpersonal behavior, group dynamics, and organizational norms” associated
with each Theory (p. xi). Pattern A was the description associated with Theory X and Pattern B
for Theory Y. Pattern A behaviors could be summarized as conventional, with a focus on
thoughts and ideas rather than feelings and emotion. Pattern A reflected coercive behavior with
little feedback. Conversely, Pattern B behaviors could be summarized as caring, inclusive of the
group, willingness to consider and try out a new idea. Argyris (1971) reported on research into
XA and YB management styles and noted the widespread acceptance and use of XA. According
to Argyris (1971), Theory X and Pattern A were not always associated with each other. Hersey
and Blanchard (1982a) explained that an XB managerial combination could exist under certain
circumstances because the manager, while still subscribing to the belief that people were lazy
and unmotivated, could have been directed to be supportive, or could have learned through
experience that Pattern B behaviors resulted in higher production. Further, Theory Y managers
might employ Pattern A behaviors in order for new skills to be learned. However, Argyris (1971)
recognized that the ideal organizational practice was the YB management style.
Blake and Mouton.
Social psychologists Blake and Mouton (1985) developed a theoretical construct called
The Leadership Grid, Management Grid, or simply, the Grid, to explain their findings from more
than a decade of interpersonal research conducted in various settings, including industry.
According to Blake and Mouton, a number of leadership theorists, including: Fiedler, Hersey and
Blanchard, and Vroom and Yetton, each developed theories based on variations of the Initiating

35
Structure and Consideration themes of the Ohio State Leadership Studies. While these theorists
viewed Initiating Structure and Consideration as independent aspects of leadership, Blake and
Mouton proposed two interdependent leadership dimensions, “concern for accomplishing the
task” and “concern for one another as participants”, simplified as Concern for Production and
Concern for People. The Grid diagrammed different combinations of leadership styles based on
the leader’s Concern for Production (low to high) and Concern for People (low to high) (Figure
2.3).
Figure 2.3. Blake and Mouton’s Managerial Grid (Mulcahy, 2009, p.59). Used with permission.

36
The interrelationship between the two concerns were labeled as leader “orientation” on
the use of power and authority to influence production (Blake & Mouton, 1985). The values
from 1 to 9 could be plotted on both the X and Y axes. Blake and Mouton (1985) highlighted
five leadership styles, and explained that, “From the range of orientations, five display such
significant differences in characteristic actions and outcomes they are readily identified as
benchmark styles” (p. 13). The five are labeled and explained in Figure 2.5. The superior Team
Management 9,9 orientation was a management-by-objectives approach and Blake and Mouton
(1985) developed grid seminars in order to help organizations achieve the goal of profit growth
through a six-phase program (Blake & Mouton, 1985). Blake and Mouton founded a company in
1961 to market their services, which is known today as Grid International.
Fiedler.
A major shift occurred in leadership theory through Fiedler’s studies that were conducted
in the late 1950s and published in the 1960s (Chemers, 2000). A distinction was made between
leaders who were task-oriented and leaders who were relationship-oriented and Fiedler
concluded that each leadership type was effective for different situations (Chemers, 2000;
Northouse, 2004). Further, situations were comprised of three dimensions in order from greatest
importance: leader-member relations, task structure, and position power (Jago, 1982; Northouse,
2004). Fiedler’s contingency model for leader effectiveness was later confirmed through Strube
and Garcia’s 1981 meta-analysis.
Fiedler (1997) summarized the contingency model as follows:
This theory holds that the effectiveness of a group or an organization depends upon two interacting factors: (a) the personality of the leader (leadership style), and (b) the degree to which the situation gives the leader control and influence, or, in somewhat different terms, the degree to which the situation is free of the uncertainty for the leader. (p. 128)

37
Two distinct types of leaders, relationship-motivated and task-motivated, would exhibit
different behaviors depending on the level of control in the situation. According to Fiedler
(1997), the relationship-motivated leader would only become more task-motivated in a high level
of situational control whereas, the opposite would be true for the task-oriented leader.
The most appropriate leadership style in the contingency model was dependent on the
situation. Whereas a moderately favorable situation was best matched with a relationship-
motivated leader, extreme situations, either favorable or unfavorable, were better matched with a
task-oriented leader (Vroom & Jago, 1988). Ultimately, as Fiedler (1997) stated, “The acid test
of leadership theory obviously must be its ability to improve organizational performance” (p.
127). Mulcahy (2009) presented a table in which to view Fiedler’s situational variables (Table
2.2).
Table 2.2 Situational Factors Facilitating and Inhibiting Leadership (Mulcahy, 2009, p. 41). Used with permission.
Situational Variables Rank (Reflecting ease of leadership)
Leadership-Member Relations
Task Structure Position Power
1 (most favorable) Close Structured Strong 2 Close Structured Weak 3 Close Unstructured Strong 4 Close Unstructured Weak 5 Distant Structured Strong 6 Distant Structured Weak 7 Distant Unstructured Strong 8 (most unfavorable) Distant Unstructured Weak
Hersey and Blanchard.
Continuing in the vein of Blake and Mouton’s managerial grid and Fiedler’s contingency
framework, Hersey and Blanchard developed a bell-shaped, “prescriptive curve”, imposed on the

38
Ohio State Leadership Studies’ relationship and task grid, to display four possible leadership
practices, the choice of which was dependent on the maturity level of the follower (Bass, 2008).
According to Hersey, Blanchard, and Natemeyer (1979), the concept of maturity consisted of
two components, ability and willingness. The leader should evaluate the level of subordinate
ability and willingness in order to assess the particular leadership practice that would produce
maximum leadership effectiveness.
In 1969, Hersey and Blanchard (1996) first published their leadership theory. At that
time, they described the development of Blake and Mouton’s Managerial Grid from the Ohio
State Leadership studies, noting that the Grid implied the superiority of its 9,9 (Team
Management) leadership style and the lowest appeal for its 1,1 (Impoverished) leadership style.
Hersey and Blanchard disputed the idea of a “best leadership style”, explaining that the level of
follower task-oriented maturity influenced the best leadership style for a particular situation.
Their theory, known as Situational Leadership, was influenced by the findings of Korman in
1966 and Fiedler’s studies of 1951 to 1967.
Hersey and Blanchard’s leadership practices and associated follower maturity levels
corresponded to the relationship and task grid as follows (Hersey, Blanchard, and Natemeyer,
1979):
• Leadership Style S1–Telling–corresponded to high task/low relationship and low
follower maturity.
• Leadership Style S2–Selling–corresponded to high task/ high relationship and low to
moderate follower maturity.
• Leadership Style S3–Participating–corresponded to high relationship/low task and
moderate to high follower maturity.

39
• Leadership Style S4–Delegating–corresponded to low relationship/low task and high
follower maturity.
The leadership progression from “Telling” to “Selling” depended on the follower’s level
of maturity at any given time. Low follower maturity would be characterized as “unable and
unwilling” therefore, the leader would need to “tell” the followers what, when, and how to
perform the tasks (Hersey et al., 1979). Follower maturity at the low to moderate level would be
characterized as “unable but willing” therefore, the leader would need to “sell” the followers on
how to perform and reinforce that performance for eventual “buy-in”. Moderate to high follower
maturity would be characterized as having the ability but lacking self-confidence therefore, the
leader would need to “participate” in order to support growth in self-confidence. The final
follower maturity level of high would be characterized as having “ability and motivation”
therefore, the leader would “delegate” the what, who, when and how to the follower.
Hersey et al. (1979) described seven power bases to be employed by the leader in order to
influence the behavior of the followers: Coercive, Connection, Reward, Legitimate, Referent,
Information, and Expert. Six had been described by other theorists and the seventh, Connection
power, was contributed by the authors (Hersey et al., 1979). According to Hersey et al. (1979), a
particular power base would be most effective when used according to the associated follower
maturity level. For example, the Coercive power base would be most effective for followers with
low maturity. Use of the Connection power base would be most effective for followers with low
to moderate maturity levels. For highly mature followers, the Expert power base would be most
effective. Other factors, such as organizational climate and the range of power bases possessed
by a particular leader, also influenced their use by a leader at any given time (Hersey et al.,
1979).

40
The Leader Adaptability and Style Inventory (LASI) was developed to be an instrument
for measurement of Situational Leadership styles, as applied to 12 different situations with four
response choices per situation (Bass, 2008; Hersey & Blanchard, 1981). LASI was developed by
Hersey and Blanchard and later renamed the Leadership Effectiveness Adaptability Description
(LEAD) with two versions, LEAD-Self and LEAD-Other. In 1982, Hersey and Blanchard
reported that most leaders/managers selected the high relationship styles of “Selling” and
“Participating” from among the four Situational Leadership styles; subordinates included an
increase in the selection of low relationship styles of “Telling” and “Delegating”.
In 1982, Blake and Mouton published findings of their research in which they compared
leader responses to instruments that measured Blake and Mouton’s Managerial Grid and Hersey
and Blanchard’s Situational Leadership. The studies were conducted in order to resolve the
debate between “one best leadership style”, i.e., Managerial Grid’s 9,9 (Team Management)
versus “no one best leadership style”, i.e., Situational Leadership. Blake and Mouton (1982a)
reported their findings that leaders chose the Managerial Grid’s 9,9 consistently over situational
styles. Hersey and Blanchard (1982a) disputed Blake and Mouton’s findings. According to
Hersey and Blanchard (1982b), responses to the LEAD-Self tended to reflected leader attitudes
of how they would like to behave, the LEAD-Other responses reflected actual leader behaviors
as reported by followers. Responses to the LEAD-Self favored the “Selling” and “Participating”
styles but responses to the LEAD-Other included an increase in “Telling” and “Delegating”.
Vroom and Yetton (and Vroom and Jago).
During his professorship at Carnegie-Mellon University in the late 1960s, Vroom, along
with Yetton, one of his graduate students, began their work of studying situational relativity,
participative management, and decision-making approaches (Vroom, 1993). They developed a

41
process of managerial decision-making that framed formal logic in a decision tree (Vroom,
1993). Responses to a series of yes/no questions applied to a managerial problem would result in
prescriptive “feasible” managerial responses that ranged from most autocratic to the most
participative (Vroom & Jago, 1988). They were symbolized as AI, AII, CI, CII, DI, GI and GII.
CII and GII were only applied to group problems whereas DI and GI were only applied to
individual problems. Vroom and Jago (1988) presented Vroom and Yetton’s questions, which
covered seven “problem attributes”. They were: Attribute A, “The Importance of the Decision
Quality” (p.55); Attribute B, “Leader’s Information Relevant to the Problem” (p. 55); Attribute
C, “Extent to Which the Problem is Structured” (p. 56) ; Attribute D, “Importance of Acceptance
of Decision by Subordinates to Effective Implementation”(p. 56); Attribute E, “Probability that
the Leader’s Decision Will Be Accepted by Subordinates” (p. 57); Attribute F, “Congruence of
Organizational and Subordinate Goals” (p. 58); and Attribute G, “Conflict or Disagreement
Among Subordinates” (p. 59). Bass (2008) summarized the use of the prescriptive leadership
styles depending on whether or not the supervisor had more information in relation to the
subordinates, or vice versa, as well as the subordinates’ acceptance of a supervisory decision, if
that acceptance was critical for the success of a situation. A review of six comparable validation
studies reported 62 percent decision effectiveness when the recommended choice(s) was
implemented (Vroom & Jago, 1988). It was noted that this percentage was favorable, given the
complex nature of behaviors and their prediction in the social sciences.
Vroom moved to Yale University in the early 1970s and continued to research his
decision-making model with another student, Jago (Vroom, 1993). Despite the validation of the
Vroom and Yetton Model, shortcomings of the model were identified, and Vroom and Jago went
on to modify the Vroom-Yetton Model to address those shortcomings (Vroom & Jago, 1988).

42
Additional questions were added to modify the original model, yes/no responses were expanded
to include options with qualified responses (probably yes, maybe, and probably no), as well as
other situational variables (Bass, 2008). The added use of multiple regression to analyze the
responses, and other modifications, resulted in a model that had greater validity than the original
Vroom-Yetton Model (Bass, 2008).
Kouzes and Posner.
In 1983, Kouzes and Posner initiated a research project that they developed into a
program known as The Leadership Challenge, with its associated quantitative survey, the
Leadership Practices Inventory (LPI) (www.leadershipchallenge.com/WileyCDA/Section/id-
131054.html). Their leadership theory was developed through administering a “personal best
survey” of 37 open-ended questions to more than 650 managers, designed to elicit their
“personal best” experiences (Posner & Kouzes, 1988). In addition, Posner and Kouzes (1988)
continued interviews with middle to senior-level managers of public and private companies, and
administered a shortened one- to two-page survey to another 450 managers. Posner and Kouzes
(1988) analyzed the extensive responses to the personal best survey, shortened survey, and
interviews to discover “the fundamental pattern of leadership behavior which emerges when
people are accomplishing extraordinary things in organizations” (pp. 484-485). The five
practices that were identified and subsequently organized as the Five Practices of Exemplary
Leaders® were: “Model the Way”, “Inspire a Shared Vision”, “Challenge the Process”, “Enable
Others to Act”, and “Encourage the Heart” (Kouzes & Posner, 2007, p. 26). According to
Kouzes and Posner (2007), “best” leadership was a matter of behavior, not personality, and
therefore could be learned. Further, it was not dependent on the type of industry or organization.

43
Followers were also surveyed to identify the most desirable characteristics they expected
from a leader. Kouzes and Posner (2007) reported the following characteristics as most likely to
elicit willingness as: “honest”, “forward-looking”, “inspiring”, and “competent”. These
characteristics remained the most frequently identified through Kouzes and Posner’s four
editions of The Leadership Challenge. Further, they were the top four in cross-cultural
comparisons. Kouzes and Posner (2007) associated the characteristics with four of the Five
Practices as follows:
• Model the Way - honest
• Inspire a Shared Vision – forward-looking, inspiring
• Enable Others to Act – honest, competent
• Encourage the Heart - inspiring
Kouzes and Posner (2007) further developed the Five Practices into the Ten
Commitments of Leadership. The Ten Commitments, according to the authors, were behaviors
embedded within the Five Practices (Figure 2.4). These specific behaviors were described for the
purpose of teaching how to lead.

44
Figure 2.4. Kouzes and Posner’s Five Practices and Ten Commitments of Leadership (Kouzes & Posner, 2007 p.26). This material was reproduced with permission of John Wiley & Sons, Inc.
Studies that validated or illustrated aspects of the Commitments were included in the
fourth edition of The Leadership Challenge. For example, the Commitment to “clarify values by
finding your voice and affirming shared ideals” (Kouzes & Posner, 2007, p. 26) was illustrated
by a description of Liedetka’s 1989 values congruence model between leader values and
organizational values, and the impact of that congruence on their work attitudes and
organizational ethical practices (Posner & Schmidt, 1993). Further still, a reference to a survey
of almost 1,500 leaders revealed “a strong and positive correlation between the sharing of
45
organizational values by employees and important individual and organizational success
measures” (Posner, Kouzes, & Schmidt, 1985, p. 305).
The Commitment to “set the example by aligning actions with shared values” (Kouzes &
Posner, 2007, p. 26) was affirmed by Kouzes and Posner’s reference to a survey that was
distributed to over 6,500 hotel employees in order to study the behavioral integrity of managers,
that is, the alignment between their words and actions, as perceived by their employees (Simons,
2002). Researchers found that profits were much higher for the hotels in which employees
viewed management as high in behavioral integrity.
Kouzes and Posner (2007) referenced a 2000 study by Crant as a confirmation of their
Commitment to, “search for opportunities by seizing the initiative and by looking outward for
innovative ways to improve” (p. 26). Crant (2000) wrote about proactive behavior, which he
defined as “taking initiative in improving current circumstances or creating new ones” (p. 436),
and presented a literature review on research findings of proactive behavior in organizational
settings. According to Crant (2000), strong proactive personality was associated with perceptions
of leadership effectiveness by Crant and Bateman in 2000, Deluga in 1998, and Bateman and
Crant in 1993.
A high level of trust was shown to promote more effective problem-solving between
group members in an industrial setting, according to Zand’s 1972 study, which was included to
support Kouzes and Posner’s (2007) Commitment to “foster collaboration by building trust and
facilitating relationships” (p. 26). The experimental design tested eight hypotheses related to
problem-solving and trust in groups. Zand (1972) explained that for the purposes of the study,
trust was not viewed as a personality trait, but rather, as an “induced attitude”. Trust was
“intentions as to one’s behavior, expectations as to the behavior of others, feelings such as

46
anxiety or discomfort, and cognitive frame used to interpret events and form perceptions” (Zand,
1972, p. 233). Zand concluded that trust could be identified through specific behaviors and that
groups with high trust were more effective problem solvers.
A field study was included that analyzed the effects of increased access to information
and participation in decision-making on increased work efficiency and effectiveness, as reported
by Williams and Wilson (1997). Participants perceived that their own increased power and
influence in the workings of the organization led to their greater effectiveness. Kouzes and
Posner (2007) included this study as an illustration of the Commitment to “strengthen others by
increasing self-determination and developing competence” (p. 26).
Kouzes and Posner’s approach to leader behaviors has been discussed in writings about
transformational leadership by Bass (2008), Carless, Wearing, and Mann (2000), Conger (1999),
Hautala (2006), Podsakoff, MacKenzie, Moorman and Fetter (1990), and Strang (2005).
However, Kouzes and Posner did not label their leadership theory or its associated instrument,
the Leadership Practices Inventory (LPI), as transformational per se (Strang, 2005). Kouzes and
Posner did write about Burns’ transformational leadership concept in a chapter they authored in
the 1990 book, Measures of Leadership, and in The Leadership Challenge’s chapter, “Envision
the Future”.
Mulcahy model.
Mulcahy (2000, 2009) analyzed multiple leadership theories and associated instruments,
along with motivational theories, to create a synthesis, Mulcahy’s Continuum of Job Satisfaction,
Leadership & Decision Making (Figure 2.5).

47
Figure 2.5. Mulcahy’s Continuum of Job Satisfaction, Leadership & Decision Making in Leadership Analytics (Mulcahy, 2009, p. 175). Used with permission.

48
The continuum provided a comprehensive collection of seminal motivation and leadership
concepts in a way so as to group them based on the overarching theme of Boss-Centered
Leadership and Subordinate-Centered Leadership. Several leadership and motivation theorists
and instruments were included in the Continuum (Table 2.3).
Table 2.3
Theories Included in Mulcahy’s Continuum of Job Satisfaction, Leadership & Decision Making
Theory/Instrument Theorist(s) Theory X and Theory Y MacGregor Hygiene and Motivator Factors Herzberg Hierarchy of Needs Maslow Four Systems of Management Likert Contingency Theory/Least Preferred Co-Worker (LPC) Fiedler The Leadership Challenge/Leadership Practices Inventory (LPI) Kouzes and Posner Leadership Effectiveness and Adaptability Descriptions (LEAD) Hersey and Blanchard Managerial Grid Blake and Mouton Vroom-Yetton-Jago Model Vroom Employee Values System American Banking
System Ohio State Leadership Studies/ Leadership Behavior Description Questionnaire (LBDQ)
Shartle et al.
Supervisory Leadership Behaviors Questionnaire (SLBQ) Rao
In an earlier book, Administrative Analytics: A Workbook in the Behavioral Sciences for
Educators and Managers, Mulcahy (2000) had referred to his synthesis as “Tannenbaum
Revisited”, in recognition of Tannenbaum’s preceding efforts to compile a collection of leader
behavior choices. Like Mulcahy’s model, Tannenbaum’s continuum ranged between Boss-
centered and Subordinate-centered leadership (Tannenbaum & Schmidt, 1958, 1973). According
to this paradigm, the leader could choose between asserting authority on one side and giving
greater freedom to subordinates on the other side. Mulcahy’s continuum differed from
Tannenbaum’s, however, in its complex synthesis and categorization of multiple theories.

49
Mulcahy’s synthesis presented a variety of leadership constructs for the purpose of providing a
multi-tooled chart for leaders and managers. Mulcahy’s taxonomy is the most comprehensive
synthesis of leadership, job satisfaction, and decision making to date.
Education leadership theorists. Birnbaum.
In the early 1980s, Birnbaum (1987) led “a five year, longitudinal study of college and
university leadership” (p. 4). Named the Institutional Leadership Project (ILP), the study
involved in-depth interviews of 32 college and university presidents to determine their
perceptions of leadership. Framed in the context of existing leadership theories, the study
concluded that of the five possible theories: trait, power and influence, behavioral, contingency,
and symbolic, 31 (96.9%) and 28 (87.5%) of presidents identified with the behavioral, and power
and influence approaches, respectively (Birnbaum, 1987). Further analysis of presidents’
perceptions of power and influence revealed that most of the presidents’ perceived leadership
influence was a one-way rather than a two-way process (Birnbaum, 1987). The most frequently
identified behaviors were goal-setting, followed by “moving people to action in support of the
goals” (Birnbaum, 1987, p. 9). It is of interest to note that 10 of the presidents (31.25%)
articulated the need to provide inspirational support as well.
In How Colleges Work, Birnbaum (1988a) framed the position of the college or
university president within the complex and unique institution known as higher education.
Birnbaum (1988a) argued that the presidential leadership role in higher education, and therefore
successful leadership, could not be compared to the CEO corporate model because of significant
organizational differences. One of the primary differences was higher education’s shared
governance structure. Legal authority was held by the institution’s board, which usually
delegated some authority to the president. Further, the faculty assumed responsibility for

50
curriculum and faculty appointments. The American Association of University Professors’
(AAUP) 1947 “Statement on Government of Colleges and Universities,” called for considerable
authority to be shared between the administration and faculty, including the faculty’s potential
involvement in the selection of the college or university’s president. According to Birnbaum
(1988a),
This appears to give the de facto authority of the faculty more weight than the de jure authority of the board in those areas that in fact define the institution–what shall be taught, who shall teach, and who shall study. In the eyes of some, this muddled the problem further rather than clarifying solutions (p. 8).
Further, this “dualism of controls” or shared governance practice created the dichotomy of a
centralized administration and decentralized academic decision-making base.
Other unique aspects of higher education that differentiated it from the business and
corporate sector were the conflicting goals of complex institutions and the lack of metrics so
common to the measurement of performance in business (Birnbaum, 1988a). Finally, Birnbaum
(1988) elaborated on the limited authority of the college or university president, which differed
greatly from the authority of a corporate CEO. This limited authority had tremendous
implications for the application of leadership theory to the college or university president,
according to Birnbaum (1988a), who explained that, “in higher education, there is a strong
resistance to leadership as it is generally understood in more traditional and hierarchical
organizations” (p. 22).
Birnbaum (1989) boldly posed two confronting questions of higher education, “How
important is the president to college and university performance? Do presidents make a
difference?” (p. 123). A study of faculty perceptions of the relationship between presidential
leadership and institutional functioning reported only slight changes over a ten-year period
(Birnbaum, 1989). In time, Birnbaum (1988a, 1988b, 1989) began to conclude that the role of

51
college and university presidential leadership was primarily symbolic because outcomes were
not strongly linked to this leadership in higher education.
The Institutional Leadership Project (ILP) produced considerable data through interviews
(qualitative) and data reduction processes to produce patterns and generalizations (quantitative)
(Birnbaum, 1992). Two aspects of presidential leadership were introduced, both of which were
determined to be necessary: “instrumental leadership” and “interpretive leadership” (Birnbaum,
1992). Instrumental leadership could be understood as task-oriented. Instrumental leadership was
shared, therefore, an institution lacking in presidential instrumental leadership could continue to
operate. Nonetheless, the president represented the institution to the public, was responsible for
communications, and controlled resources, so the instrumental leadership role of the president
was unique and important (Birnbaum, 1992). Interpretive leadership appeared to be similar to
Birnbaum’s (1992) concept of symbolic leadership in higher education, and was depicted as
“management of meaning”. The nature of interpretive leadership differed from the distributed
nature of instrumental leadership; the president alone could influence the institution as a whole
through interpretive leadership.
Three combinations of presidential use of instrumental and interpretive leadership were
illustrated by Birnbaum (1992), based on ILP president data. They were Exemplary, Modal, and
Failed. The Exemplary president provided instrumental and interpretive leadership. The Modal
president provided instrumental leadership but no interpretive leadership, and the Failed
president provided neither instrumental nor interpretive leadership (Birnbaum, 1992). Birnbaum
(1992) used the task and relationship theme reminiscent of the Ohio State Leadership Studies in
the description of instrumental and interpretive leadership. The Exemplary president balanced

52
task and relationship orientation, whereas the Modal president began with task and relationship
orientation but eventually shifted towards task orientation (Birnbaum, 1992).
Bensimon.
Under Birnbaum’s tutelage, Bensimon earned an Ed.D. in higher education at Teacher’s
College, Columbia University. Bensimon worked with Birnbaum on the ILP program. A 1986
study of the cognitive frames through which college and university presidents viewed leadership
was described by Bensimon in a 1987 presentation, “The Meaning of Good President
Leadership”. Bensimon (1987) applied Birnbaum’s adaptation of Bolman and Deal’s framework
of cognitive frames through which presidents prioritized and responded to problems and
opportunities. The four cognitive frames (Bensimon, 1987) as applied to the institutional setting,
can be found in Table 2.4.
Table 2.4 Cognitive Frames of Presidential Leadership
Frame
Environment As President As
Bureaucratic • Mechanistic • Hierarchical • Clear line of authority
• Problem solver • Result seeker • Systems manager
Collegial • Human needs-oriented • Theory X & Y-oriented • Community of scholars
• Participative and democratic decision-maker
• Motivator Political • Competition for power
• Scarce resources • Coalitions • Bargaining
• Mediator • Negotiator • Diplomat
Symbolic • Shared beliefs • Invented structures and
processes • Appearance over substance
• Catalyst • Facilitator

53
Bensimon (1987) interviewed 32 presidents from a purposive sample to identify their
cognitive frames, in order to analyze what constituted good presidential leadership. Thirteen of
the 32 president responses identified a single frame, ranked in the following order from most
frequent to least frequent: bureaucratic, collegial, symbolic, and political. For the 11 presidents
who identified a two-frame, responses, ranked from most frequent to least frequent were:
collegial/symbolic, collegial/political, political/symbolic, and bureaucratic/political. Seven of the
presidents identified a three-frame response and one identified a four-frame response.
In 1989, Bemsimon, Neumann, and Birnbaum wrote the ASHE-ERIC Higher Education
Report #1, Making Sense of Administrative Leadership: The “L” Word in Higher Education,
which became a seminal document of higher education leadership (Kezar, Carducci, &
Contreras-McGavin, 2006). The authors acknowledged that the study of leadership in higher
education was “problematic because of the dual control systems, conflicts between professional
administrative authority, unclear goals, and other special properties of normative, professional
organizations” (Bensimon, Neumann, & Birnbaum, 1989, p. iv). Studies were presented in which
higher education leadership was analyzed in the context of trait, power and influence, behavioral,
contingency, cultural and symbolic, and/or cognitive leadership theories. A list of the leadership
theory categories, subcategories, and reported studies can be found in Table 2.5.

54
Table 2.5 Table of Leadership Theories and Associated Studies as per Bensimon, Neumann, and Birnbaum (1989) Trait Theories Eble, 1978; Fisher, 1984; Gilley, Fulmer, and Reithlingshoeter, 1986;
Kaplowitz, 1986; Vaughan, 1986; Fisher, Tack, and Wheeler, 1988 Power and
Influence Theories
Social Power Theory Fisher, 1984; Whetten, 1984; Birnbaum, 1989
Social Exchange Theory/
Transactional Theory
Corson, 1960; Bennis, 1972; Gilley, Fulmer, and Reithlingshoefer, 1986; Bensimon, 1987, 1989
Transformational Theory
Clark, 1970; Bennis, 1972; Hesburgh, 1979; Kauffman, 1980; Chaffee, 1984; Riesman and Fuller, 1985; Cameron and Ulrich, 1986; Kerr and Gade, 1986; Birnbaum, 1988; Green, 1988; Rice and Austin, 1988; Bensimon 1989c
Behavior Theories
Behavior of the Leader
Cohen and March, 1974; Madron, Craig, and Mendel, 1976; Astin and Scherrei, 1980; Blake, Mouton, and Williams, 1981; Tucker, 1981; Knight and Holen, 1985
Managerial Roles Dill, 1984; Neumann, 1988 Contingency Theories Tucker, 1981; Taylor, 1982; Staw, 1983; Vroom, 1983; Dill, 1984;
Floyd, 1985; Birnbaum, 1989 Cultural and Symbolic Theories Clark, 1970, 1972; Dill, 1982; Peck, 1983; Chaffee, 1984, 1985;
Corbally, 1984; Deshler, 1985; Vaughan, 1986; Chaffee and Tierney, 1988; Green, 1988b; Kuh and Whitt, 1988; Tierney, 1988, 1989; Neumann, 1989
Cognitive Theories Birnbaum, 1986, 1987, 1989
Bensimon, Neumann, and Birnbaum (1989) concluded, based on these studies, that the
social exchange theory could be usefully applied to the complex nature of higher education
shared governance and decision-making. Conversely, behavioral and contingency theories
probably were not applicable. The application of trait theories was not able to identify consistent
traits in successful higher education leadership.
Bensimon (1989) also wrote about the application of transactional and transformational
leadership practices among college and university presidents. Bensimon echoed Birnbaum’s
sentiment that transactional leadership practices were more effective as the norm in a collegial

55
environment since it was a two-way view of relationship between leaders and followers that was
more amenable to the shared governance structure of higher education. Transformational
leadership might be more suited to institutions in times of presidential succession or institutional
distress, but Bensimon pointed out that transformational leadership in its classic sense would
never be an effective leadership strategy in the collegial environment.
Instead, Bensimon (1989) proposed a hybrid of transactional and transformational
leadership practices, which she named “trans-vigorational” leadership, so-named because of its
style of re-invigorating the current culture, that is, improving it rather than changing it. This
approach used the “best of both worlds” between transactional and transformational leadership.
A case study of four new presidents of higher education institutions confirmed the advantage of
the trans-vigorational approach (Bensimon, 1989). Interestingly, while the same actions may
have been carried out by both the Type One (Theory X) (quick acting, solo leader, top-down)
and Type Two (Theory Y) (listening, engaging, group decision-making) leaders, that is, layoffs,
program closures, and restructuring, the acceptance and “buy in” of these action only took place
through the Type Two presidents’ leadership style, in which other members of the campus
community were made to feel part of the process.
Neumann.
Neumann, who earned a Ph.D. in higher education at the University of Michigan, worked
closely with Birnbaum and Bensimon on the Institutional Leadership Project. Neumann’s 1987
presentation at the Annual Meeting of the Association for the Study of Higher Education
(ASHE) focused on the findings of research on college president strategies. Thirty-two
presidents from a purposive sample that included major research universities, state institutions,
private colleges, and community colleges, were interviewed in 1986 and 1987 to determine their

56
strategies in carrying out their presidential duties (Neumann, 1987). Newer and seasoned
presidents each were included; in addition to the perceptions of new presidents, the presidents
who had been in office for five years or more were interviewed for their experiences during the
beginning and well into their presidencies.
President responses were coded and analyzed according to Chaffee’s three strategy
models: linear, adaptive, and interpretive (Neumann, 1987). The linear strategy was as its name
implies: data gathering, analysis, consideration of possible options, and rational decision making
were conducted on a single timeline. The linear strategy was strongly goal oriented. The
adaptive strategy was a type of Strengths, Weaknesses, Opportunities, and Threat (SWOT)
approach that focusee on the external environment and the organization’s alignment with that
environment. The interpretive strategy approach focused on perceptions of the organization, with
the president’s efforts directed towards “explaining and clarifying so that organizational actors
carry out their roles in a meaningful way” (Neumann, 1987, p. 4). Words such as values,
symbols, and emotions were associated with the interpretive model.
Analysis revealed that 81 percent of the experienced presidents, i.e., those who had been
in office for five or more years, had employed a single strategic model when they began their
presidency. In contrast, 56 percent of the new presidents, i.e., those who had been in office one
to three years, initially employed two strategic models (Neumann, 1987). With regards to a
comparison of president strategies per public and private institutions, they each used the linear
strategy 50 percent, but 50 percent of private institution presidents were more likely to use the
adaptive strategy whereas 40 percent of public institution presidents were more likely to use the
interpretive strategy. Regardless of the strategy, however, experienced presidents tended to use a
single strategy whereas new presidents tended to employ a complex strategy approach.

57
Neumann and Bensimon (1990) wrote about the application of a newer approach to the
study of presidential leadership, in “Constructing the Presidency: College Presidents’ Images of
their Leadership Roles, A Comparative Study”. According to Neumann and Bensimon (1990),
there had been a shift “from a traditional view of college leadership as an objective reality to the
current view of leadership as a subjectively derived and variable reality” (p. 680). The approach
was taken in this ILP study to derive patterns of leadership from a purposive sample of
presidents “subjectively, as it exists in the minds of those who experience it” (Neumann &
Bensimon, 1990, p. 680). Four patterns or types of presidential leadership were produced, but the
authors cautioned the reader not to view the types as distinct categories since the realities of
college and university president were so varied. The four types were summarized according to
Neumann and Bensimon’s (1990) labels by type, target of attention, mode of action, and related
to the institution (Table 2.6).

58
Table 2.6 Summary of Neumann and Bensimon (1990) Presidential Leadership Types
Type Institutional Description
Target of Attention Mode of Action Relatedness to the Institution
A • Stable institution • Some financial
difficulty • Satisfied faculty
• Externally directed • President as
institutional/ spokesperson or ambassador
• Initiating • Entrepreneurial • Risk-taking • Future thinking
• Externally directed
• Externally connected
B • Stable institution • Few with serious
financial pressure • Satisfied faculty
• Internally directed • Student-centered • President as
“ ‘cheerleader,’ ‘coach,’ or ‘mentor’ “ (p. 687)
• Initiating • Catalyst • Focus primarily
on present
• Intense connection to institutional community
C • Uncertain institutional future
• Financial crisis • Uncertain or
hopeful faculty
• Externally directed • President as lobbyist
for organizational image
• Reacting • Credibility
building • Repositioning
• Distant • Delegates
management • Seeks
external resources
D • Current or recent financial crisis
• Low faculty morale
• Internally directed • Focus on procedures • President as strong
authority with centralized decision-making
• Minimal activity outside institution
• External threat sensitivity
• Reacting • Strong bureaucratic emphasis “to constrain, monitor, and control organizational events” (p. 692)
This qualitative study provided information through which patterns could be
distinguished, but the authors did not purport to create theoretical classifications. Neumann and
Bensimon (1990) viewed these findings as tools for use, depending on the situation. Types A
through D could be used at a given time to establish a baseline, but the authors recognized that
“the college and university presidency is not a firm, singular experience, but rather, that its

59
incumbents may conceive and experience it in diverse ways” (Neumann & Bensimon, 1990, p.
698).
Sergiovanni.
A few years after completing his Doctor of Education degree from the University of
Rochester, Sergiovanni published the findings of a research study conducted on the leadership
expectations of teachers towards their principals (Sergiovanni, Metzcus, & Burden, 1969). The
Leadership Behavior Description Questionnaire, Form XII (LBDQ XII) was distributed to 227
teachers. Its use was modified to elicit the teachers’ beliefs of “ideal” principal behaviors, along
with a modified Choice-Motivator Scale to determine the teachers’ hygiene-orientation and
motivation-orientation. The findings supported the preference for high-initiating structure, high-
consideration leader behavior (Sergiovanni et al., 1969). The findings also confirmed the
teachers’ preference for Argyris, Maslow, and McGregor’s “self-actualizing man thesis”
(Sergiovanni et al., 1969, p. 78).
While Sergiovanni’s 1969 study advanced the application of conventional leadership
theories, by 1981, Sergiovanni stressed the importance of symbolic aspects of leadership over
behaviors or style. Cohen and March’s 1974 conclusion that leadership did not make a difference
had prompted Sergiovanni’s response that “too much attention has been given in both leadership
theory and practice to the instrumental and behavioral aspects of leadership and not enough to
the symbolic and cultural aspects” (Sergiovanni, 1981, p. 2). Three primary activities of
symbolic leadership were thus identified by Sergiovanni (1981) as Leadership Selectivity,
Leadership Consciousness, and Leadership Fidelity. Leadership Selectivity referred to the
leader’s prioritization of issues for personal attention. This “administration attention” would send
a clear message of what the leader deemed as most important and, as such, could be considered

60
as modeling on the part of the leader. Leadership Consciousness represented the leader’s ability
to bring understanding, appreciation, and meaning to the work of others within the framework of
the organization’s culture. Sergiovanni (1981) explained, “How people act, think and behave is a
result of their belief and commitment to cultural norms, but the focus of leadership is on the
cultural antecedents and not the behavior itself” (p. 9). In other words, leadership, according to
Sergiovanni was, in part, an expression of and was expressed through the cultural environment of
an organization. In fact, Sergiovanni (1986) went so far as to associate the word “patriotism”
with the idea of “leadership as cultural expression” (p. 111). Finally, the focus of Leadership
Fidelity was to increase the connection between the daily activities of teachers and the
organization’s ideals.
Sergiovanni (1996) took the position that leadership for primary and secondary schools
was unique and therefore should be formulated from within, rooted in the in loco parentis role of
educators. This approach inspired a core of value-added or moral leadership. Sergiovanni (1993)
presented Tonnies’ 1957 continuum of Gemeinschaft and Gesellschaft to illustrate two views of
alternative organizational cultures. Gemeinschaft represented the “sacred” community of the pre-
industrial age whereas Gesellschaft represented the “secularized” society of the industrial age.
Gemeinschaft was a sacred community in which natural will motivated and relationships were
not contractual but rather, were bound by moral ties. The contrasting Gesellschaft represented
contractual values, goal attainment in exchange for benefit, secular society with a motivating
force of rational will. Sergiovanni (1996) was willing to accept a Gesellschaft culture for
corporations, the military, health care, and even research universities, but not for schools.
Nine leadership tasks for principals were presented by Sergiovanni in his 1996 book,
Leadership for the Schoolhouse. They were: “purposing”, “maintaining harmony”,

61
“institutionalizing values”, “motivating”, “managing”, “explaining”, “enabling”, “modeling”,
and “supervising” (Sergiovanni, 1996, pp. 88-89). These tasks appeared to resemble Kouzes and
Posner’s five leader behaviors. It is interesting to note that Sergiovanni (1996) perceived Burns’
transformational leadership as a Gemeinschaft-based idea. According to Sergiovanni (1996),
however, Burns’ idea was changed by others to become Gesellschaft-based, secularized theory
and practices.
Kezar.
Kezar took on the task of examining higher education leadership models as the
dissertation topic for her Ph.D. in Education from the University of Michigan, completed in
1996; Neumann served on the doctoral committee. This research represented a new generation of
scholarship in leadership that furthered the departure from classic leadership theories. The
dissertation consisted of both historical and an in-depth case study of leadership at a Midwestern
community college. Kezar included a personal account of barriers faced by Kezar’s paternal
grandmother and the role it played to motivate her in her own professional career are included in
the dissertation. Kezar (1996) explained:
This study seeks to provide voice for women, people of color, and others who often don’t fit into higher education leadership models. Must individuals adopt a predominately and historically white, male, heterosexual, upper-middle class way of leading within higher education organizations? Can we not expand the ways that we understand leadership to include other voices? (p. 46)
Kezar (1996) portrayed the traditional college president as a white male whose leadership
was top-down, hierarchical, in-charge, authoritarian. Throughout the dissertation, a
reaction to this seemingly “old boy’s club” exclusiveness was expressed and countered
with individual voices that presumably had not been heard due to self-imposed silence or
oppression. The critical-constructivist paradigm was applied to assist the researcher in

62
uncovering the individual perspectives, viewpoints, beliefs, and stories with regards to
the experiences of campus leadership.
In a 2000 journal article, Kezar reprised her dissertation’s case study of a Midwestern
community college and asked, “How does positionality (i.e., role as faculty, location in the
academic bureaucracy) relate to interpretations of leadership? And How do conditions of power
relate to interpretations of leadership?” (Kezar, 2000, p. 723). Once again, Kezar (2000)
recounted the awakening of researchers in the early 1990s who began to recognize the limitations
of previous leadership models in higher education that “tend to be exclusive and represent an
orientation to leadership derived from those traditionally in positions of power, i.e., a mostly
white, male, upper-middle class, heterosexual orientation to leadership” (p. 725). Further,
according to Kezar, earlier studies failed to look at leadership from the perspective of race, social
class, or organizational role. The application of positionality theory permitted the development of
a framework for studying higher education leadership that took into account the complex reality
of any given individual in an organization, as influenced by his or her self-perception and
perceptions of institutional culture, social and societal perspectives and experiences, power
dynamics, situational constructs, and leadership (Kezar, 2000).
One of the main findings of the research was that diverse and even conflicting concepts
of leadership can exist together on a campus (Kezar, 1996, 2000). The case study exposed three
views of campus leadership: “servant leadership”, “servants to the central leadership”, and
“paper pushers” (Kezar, 2000, p. 731). These views were expressed by the following
constituencies and associated respectively: “Liberal Studies faculty, and change-oriented
individuals”, “Careers faculty, noncentral administrators, and critics”, and “faculty” (Kezar,
2000, p. 731). Kezar (2000), then, concluded that pluralistic leadership positions existed at the

63
same time, therefore, positionality theory was able to assist the researcher to study leadership
from multiple perspectives.
A steady call for the update of Bensimon et al.’s 1989 seminal monograph on leadership
in higher education eventually resulted in Kezar, Carducci, and Contreras-McGavin’s 2006
ASHE Higher Education Report, Rethinking the “L” Word in Higher Education: The Revolution
of Research on Leadership. Kezar, then-editor of the ASHE Higher Education Report Series,
recruited two doctoral students to serve as coauthors.
Kezar et al. (2006) tackled the two monumental tasks of: (1) presenting an important
summary of contemporary leadership paradigms and theories, and (2) presenting a summary of
these theories as applied to higher education leadership. The changing landscape in which
leadership took place and new scholarship were two reasons cited for the emergence of the
theories (Kezar et. al., 2006). The authors summarized the dramatic shift that took place in
leadership studies from the early 1990s as follows,
Over the past twenty years, leadership has moved from being leader centered, individualistic, hierarchical, focused on universal characteristics, and emphasizing power over followers to a new vision in which leadership is processed centered, collective, context bound, nonhierarchical, and focused on mutual power and influence processes (Kezar et al., 2006, p. 33)
A new generation of leadership researchers, then, brought into question the underlying
assumptions of the classic leadership theories.
Kezar and colleagues examined and discussed studies of ways in which social
constructivism, postmodernism, and critical theory influenced the study of leadership and their
application to higher education leadership, alongside the continued study of classical theories.
Higher education leadership research, according to the authors, had expanded from a sole focus
on the institution’s president to include other campus leaders. Further, the social constructivist

64
paradigm was added to the pre-1990s functional approach to the study of leadership. (According
to Kezar, an early use of the social constructivist paradigm could be seen in the cognitive theory-
based, 1990s Institutional Leadership Project.) Finally, a shift from an emphasis on task
orientation to a balance between task and relationship orientation took place (Kezar et al., 2006).
Within the sphere of trait and behavior theories, Montez (2003) applied the study of this
approach to different administrative roles in higher education and developed a new instrument to
measure dimensions of behavior and competencies in high education leadership. The dimensions
were integral, relational, credibility, competence, and direction or guidance (Kezar et al., 2006;
Montez, 2003). The new instrument, called the Higher Education Leadership Instrument (HELI)
was designed to measure effective leadership attributes or behaviors. Kezar et al. (2006)
explained that transformational leadership theory, while rooted in the classic vision of leadership,
was aligned to some degree with contemporary leadership through its dimensions of “mutual
power and influence processes”. Cognitive theories grew to dominate leadership studies from the
1990s and on; little research had been conducted in the application of chaos theory to higher
education leadership; aspects of cultural and symbolic theories continued to influence higher
education leadership, especially with the growing recognition the importance of institutional
culture on all levels of campus leadership (Kezar et al., 2006).
Higher Education Act of 1965
The platform for education reform through federal legislation was laid in part through the
landmark 1954 Supreme Court case of Brown v. Board of Education of Topeka in which public
school segregation of children, based on race, was deemed unconstitutional, and through the
Civil Rights Act of 1964, specifically Title VI, which legislated against any practice of
discrimination in education because of race, color, or national origin (Boone, 1992; Howard,
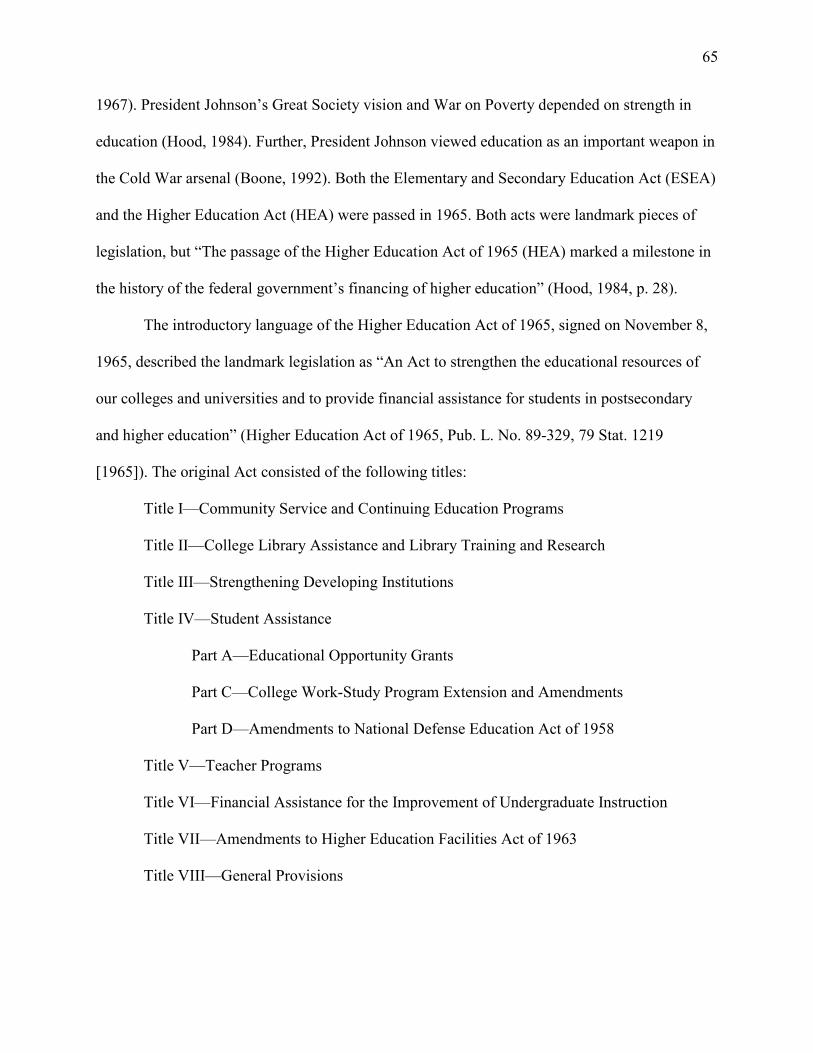
65
1967). President Johnson’s Great Society vision and War on Poverty depended on strength in
education (Hood, 1984). Further, President Johnson viewed education as an important weapon in
the Cold War arsenal (Boone, 1992). Both the Elementary and Secondary Education Act (ESEA)
and the Higher Education Act (HEA) were passed in 1965. Both acts were landmark pieces of
legislation, but “The passage of the Higher Education Act of 1965 (HEA) marked a milestone in
the history of the federal government’s financing of higher education” (Hood, 1984, p. 28).
The introductory language of the Higher Education Act of 1965, signed on November 8,
1965, described the landmark legislation as “An Act to strengthen the educational resources of
our colleges and universities and to provide financial assistance for students in postsecondary
and higher education” (Higher Education Act of 1965, Pub. L. No. 89-329, 79 Stat. 1219
[1965]). The original Act consisted of the following titles:
Title I—Community Service and Continuing Education Programs
Title II—College Library Assistance and Library Training and Research
Title III—Strengthening Developing Institutions
Title IV—Student Assistance
Part A—Educational Opportunity Grants
Part C—College Work-Study Program Extension and Amendments
Part D—Amendments to National Defense Education Act of 1958
Title V—Teacher Programs
Title VI—Financial Assistance for the Improvement of Undergraduate Instruction
Title VII—Amendments to Higher Education Facilities Act of 1963
Title VIII—General Provisions

66
The 1965 Act was reauthorized in 1969, 1972, 1976, 1980, 1986, 1992, 1998 (McCants, 2003),
and most recently, in 2008.
Title III legislation.
Title III, Strengthening Developing Institutions, was created as part of the Higher
Education Act of 1965, with the following statement of purpose (Sec. 301(a)):
The purpose of this title is to assist in raising the academic quality of colleges which have the desire and potential to make a substantial contribution to the higher education resources of our Nation but which for financial and other reasons are struggling for survival and are isolated from the main currents of academic life, and to do so by enabling the Commissioner to establish a national teaching fellow program and to encourage and assist in the establishment of cooperative arrangements under which these colleges may draw on the talent and experience of our finest colleges and universities, and on the educational resources of business and industry, in their effort to improve their academic quality. (Pub. L. No. 89-329, 79 Stat. 1219, 1965, p. 11).
Further, Public Law No. 89-329 directed the establishment of an Advisory Council on
Developing Institutions, authorized the Commissioner to make grants for cooperative
agreements, specified the types of projects for which the grants could be used, and authorized the
Commissioner to award graduate students and faculty members fellowships to teach at
developing institutions.
Hood’s 1984 dissertation, Legislative Intent, Program Implementation, and Higher
Education Policy: The Case of Title III of the 1965 Higher Education Act, provided tremendous
insight into the “hot button” issues associated with the legislators’ intent towards Title III, and
the actual process of implementation from public law to practice. Two such issues were: (1) the
debate on whether or not Title III was written primarily for Black colleges, and (2) whether or
not two-year institutions should be eligible for Title III funds.
During the writing of the House bill that would become PL 89-329, some members of the
House Committee on Education and Labor had understood the implicit beneficiaries of Title III

67
to be the historically Black colleges, or four-year southern Black colleges (Hood, 1984). In fact,
according to St. John (1981), the basic justification and programming for Title III legislation was
patterned on McGrath’s 1964 report of predominately Black colleges. While these race-specific
beneficiaries had been articulated in the House Special Subcommittee on Education, they were
not specified in the full House debate (Hood, 1984).
The issue of two-year institution eligibility was considered by the Senate Subcommittee
on Education, even though the House and President Johnson were not in favor (Hood, 1984). The
Subcommittee included two-year institutions in the Senate bill, with the specification that 22
percent of the funds be allocated for them, and increased the House’s recommended
appropriation level. Out of concern for sound fiscal management of funds by the developing
institutions, the Subcommittee added a requirement for sound administrative management. The
full Senate Committee on Labor and Public Welfare maintained these components and the bill
passed easily in the Senate.
These “hot button issues” continued to heavily influence the debate during the conference
committee’s work to reconcile the House and Senate bills. According to Hood (1984), the
committee maintained the inclusion of two-year institutions but limited the initial funding
authorization for one year so that the issue could be revisited. The rationale for inclusion of the
two-year institutions was their then-increasing enrollments. Some felt it would be inappropriate
to sacrifice these growing institutions in favor of focusing on the four-year Black colleges, where
enrollments were not equally increasing. The final language of Title III, signed into law as part
of the Higher Education Act by President Johnson on November 8, 1965, included two-year
institutions, authorized the first year allocation at $55 million, and did not explicitly name Black
colleges as the target beneficiaries (Hood, 1984).

68
Howard (1967) conducted a U.S. Department of Health, Education, and Welfare-funded
evaluation of Title III that was published in August, 1967, just a year into the first Title III
program grants. According to Howard (1967), the predicaments of Black colleges in the areas of
financial and academic deficiencies had stimulated the development of federal aid for this special
group of institutions, which had been documented in the 1964 McGrath Report. The Report also
had brought to light that a number of non-Black institutions needed federal assistance. The
McGrath Report prompted a change in private foundations’ funding from scant to extensive for
the Black colleges and these funded programs, in turn, became the model for Title III legislation
(Howard, 1967).
The Higher Education Amendments of 1986, Public Law 99-498, finally established a
new Strengthening Historically Black Colleges and Universities (HBCUs) Program under Title
III. The former part B program was eliminated, and this new program for HBCUs was designed
Title III Part B (Boren, Irwin, Lyke, Riddle, Stedman, Frass, Jordan, & Gregory, 1987). Unlike
Title III A, which continued to be administrated as a competitive discretionary program, Title III
Part B was established as a formula (i.e., noncompetitive) grant program (Boren et al., 1987).
House members of the Conference Committee for the Higher Education Amendments of
1992 legislation clearly were concerned about the continuation of sufficient funding levels for
the Title III Part A program. The Conference Report explanatory statement included the
following:
There are over 900 institutions, comprising nearly one-third of all institutions of higher education in the nation, that are eligible for part A assistance. These institutions are in need of Federal assistance because they are in severe financial hardship and because they enroll segments of society that historically have been underrepresented in higher education. (H.R. Rep. No. 102-630, 1992, pp. 423-424)

69
Similar to the original debate between funding for Black colleges and universities versus
funding for other institutions that met the “developing institutions” designation, legislators were
concerned about a reduction of Title III Part A funds that could result from the adoption of a
proposed new Hispanic-serving institutions program. This proposed program became a major
component of the Higher Education Amendments of 1992 (H.R. Rep. No. 102-630, 1992).
Title V legislation.
According to a 2007 study by MacDonald, Botti and Clark, the movement for recognition
and rights of Mexican Americans (and Hispanics/Latinos) began during the Johnson
administration, in the era of the Civil Rights Movement and Great Society. MacDonald et al.
(2007) described stages of progress from the 1960s on as follows:
• “Visibility and Legitimacy of the Early to Late 1960s: Putting Hispanics on the
Federal Radar” (p. 479).
• “Self-Determination in the Early 1970s” (p. 481).
• “Seeking Resources beyond the Rhetoric: The Early 1980s” (p. 487).
• “Emulation Era of the Late 1980s and Early 1990s” (p. 491).
• “Autonomy of the Late 1990s: Latino Higher Education and the Federal Government
in the Twenty-First Century” (p. 494).
Much of the history related through this account was about social and cultural events of each era.
The Hispanic Association of Colleges and Universities (HACU), founded in 1986, played a
significant role in the eventual legislation that became Title V (Laden, 2001; MacDonald, Botti,
& Clark, 2007). MacDonald et al. (2007) made an important distinction in the changing
strategies used by Hispanic populations during the late 1980s, “The creation of HACU not only
raised the visibility of Latino higher education but also, in contrast to the civil rights era

70
approach, created an organization both able and eager to work within established systems of
power” (p. 492).
The current Title V program, “Strengthening Hispanic-serving Institutions,” was first
introduced in the Higher Education Amendments of 1992 under Title III (H.R. Rep. No. 102-
630, 1992). In order to be considered a Hispanic-serving institution, the college or university was
required to meet criteria of Title III A eligibility, as described in Section 312(b), and, in addition,
enroll at least 25 percent Hispanic full-time equivalent undergraduate students (H.R. Rep. No.
102-630, 1992).
According to the Conference Committee’s explanatory statement in House Report No.
102-630 (1992) that accompanied the Higher Education Amendment of 1992, the Hispanic-
serving Institution Program was created to recognize and fund institutions that served a higher
percentage of Hispanic undergraduate students as a distinct group. The proposed program was
introduced in the Senate bill while House concerns were voiced concerning a cap on
appropriations for the Title III Part A programs, to which the Hispanic-serving Institutions
program would be added.
There was concern that the addition of a new program would further limit the amount of
aid for all other Title III part A-eligible institutions. Title III Part B had already been separated
from Title Part A institutions in 1986 in order to serve exclusively the Historically Black
Colleges and Universities. After amending the Senate bill’s language with a caveat to protect the
funding level for Title III Part A, the Developing Hispanic-serving Institutions Program was
created in 1992 (H.R. Rep. No. 102-630, 1992). Though considered a great victory, Hispanics
nonetheless were driven to establish a fully separate program, much as the HBCUs had
eventually done through Title III Part B (MacDonald et al., 2007). The Developing Hispanic-

71
serving Institutions Program was moved to a new Title V in the Higher Education Amendments
of 1998, Public Law 105-244, signed into law on October 7, 1998 (Developing Hispanic-Serving
Institutions Program, 2001).
Title III and V eligibility.
As part of the process to create the Higher Education Act of 1965, hearings were
conducted before the Special Subcommittee on Education of the Committee of Education and
Labor. The 89th Congress hearings on H.R. 3220 included five characteristics of a “developing
institution” (Howard, 1967). These characteristics were: (1) negligible support through
fundraising and a small endowment, (2) high transfer and dropout rates, (3) few academic
programs and small academic departments, (4) minimal academic facilities and a small library,
and (5) difficulty attracting and keeping high quality faculty (Howard, 1967). Within the context
of these characteristics, Jacobs and Tingley (1977) reported that “Title III, as enacted, provided
the Commissioner with the assistance and advice of the Advisory Council, with broad
discretionary authority to define objectives and establish priorities within the parameters of the
definition and description of ‘developing institutions’ as cited above” (p. 37).
According to Howard (1967), Title III of the Higher Education Act of 1965 remained
unclear with regards to the identifying characteristics of its target recipients. Section 302 of the
Higher Education Act of 1965 listed eight factors that collectively comprised a “developing
institution” (Hood, 1984). However, these characteristics were general eligibility factors rather
than specific eligibility factors that would identify Title III-type institutions. Hodgkinson and
Schenkel (1974) reasoned that the legislative definition was sufficiently general and broad so as
to be able to be attributed to almost any institution. Consequently, one of the tasks of the
Hodgkinson and Schenkel study (1974) was “to develop indicators of institutional vitality that

72
may be used in determining an institution’s eligibility for program funding under Title III” (p.
xi). Interestingly, Department of Education officials told Hodgkinson and Schenkel (1974) that,
at the time the Title III Program was being implemented, the officials had conveyed their
understanding that institutions with predominately Black enrollments were the intended
beneficiaries of Title III funds. The officials had therefore instructed the readers of Title III
applications to apply the criteria of higher proportions of ethnic minority and low-income
students when scoring the applications.
The establishment of the current Title III eligibility requirements required persistence and
considerable legislative maneuvering (Hood, 1984). As early as 1972, the Senate Committee on
Labor and Public Welfare proposed these requirements, but they were rejected by the House and
consequently, were not included in the Higher Education Amendments of 1972. Short-lived
eligibility requirements included full-time enrollment, percent of low-income students, average
faculty salary, percent of faculty with a Master’s degree, retention rates, number of students
going on to graduate school, and institutional vitality; for a brief period, the average Basic
Educational Opportunity Grant award per full-time undergraduate student and the average
educational and general expenditure per student were the criteria (Rendon, 1980). The current
eligibility requirements emerged eventually from a series of lengthy and contentious hearings,
drafts, to be included in the final legislation of the Education Amendments of 1980 (Hood,
1984).
Since 1980, Title III eligibility requirements have been established by meeting prescribed
thresholds of two institutional characteristics: percentage of low-income undergraduate students
and low educational and general expenditures per undergraduate student (Strengthening
Institutions Program, 2005). It is important to note that the threshold requirements of percentage

73
of low-income undergraduate students and low educational and general expenditures per
undergraduate student were set for four different institutional types: (1) two-year public, (2) two-
year non-profit, private, (3) four-year public, and (4) four-year non-profit, private institutions
(Office of Postsecondary Education; Strengthening Institutions, 2009). Title V eligibility
additionally requires that, at least 25 percent of the undergraduate full-time equivalent students
must be Hispanic, and of those, at least 50 percent of those Hispanic students must be low-
income individuals (Developing Hispanic-serving Institutions, 2005). Title V initially had
required that the 50 percent of Hispanic students also be first generation; the first generation
requirement was eliminated with the Higher Education Amendments of 1998 (MacDonald et al.,
2007).
Title III-eligible Institutions
As discussed in the previous section, Title III-eligible institutions that have been
recognized by the U.S. Department of Education must have fulfilled the following conditions:
(1) submitted a complete Title III eligibility application to the Department; (2) have met or
exceeded the Title III threshold percent low-income (median Pell Grant percentage)
undergraduate students according to institution type, i.e., two-year public, two-year non-profit
private, four-year public, or four-year non-profit private; and (3) have met or exceeded the Title
III threshold average educational and general expenditures per full-time equivalent student
according to institution type, i.e., two-year public, two-year non-profit private, four-year public,
or four-year non-profit private. These were the characteristics shared by all Title III-eligible
institutions that were recognized by the U.S. Department of Education.
This study focused on the 219 four-year, non-profit, private institutions located in the
United States that established Title III and V eligibility for FY 2007; they represented 20.00

74
percent of the total number of 1,095 eligible institutions for FY 2007 (Title III Part A and Title V
Programs FY 2007 Eligible Institutions; Title III and Title V Eligible Institutions for the Cost-
Share Waiver July 1, 2006 – June 30, 2011) (Appendix A). A thorough search of the literature
failed to identify studies about Title III and V-eligible institutions or the subgroup of four-year,
non-profit, private institutions, with the exception of the most recent U.S. GAO report, Low-
Income and Minority Serving Institutions: Management Attention to Long-standing Concerns
Needed to Improve Education’s Oversight of Grant Programs (2009), which provided additional
data on Title III and V-eligible institutions, disaggregated by two-year public, four-year public,
two-year private not-for-profit, and four-year private not-for-profit institutions. A number of
dissertations and articles were found that discussed some of the 219 colleges and universities of
this study, or on institutions whose characteristics are shared by some or all of these institutions.
Repeated themes in the literature included descriptions of invisibility, turnaround, viability,
student selectivity, institutional affiliation, risk for merger or closure, and minority student
population.
Invisibility.
Astin and Lee’s 1972 book, The Invisible Colleges, sponsored by The Carnegie
Commission on Higher Education, has been cited in 47 articles, books, and dissertations,
according to a search conducted in Google Scholar on February 6, 2010. This author came across
this seminal study repeatedly while reading some of the above-numbered scholarly works.
Therefore, a summary of Astin and Lee’s work was the focus of this section.
Insightful profiles of 494 small, private colleges that were largely unknown to the public
and had extremely limited financial resources were presented. Astin and Lee did not list the
names of the colleges, consequently, their descriptions may or may not reflect some of the

75
institutions studied in this dissertation. However, it is reasonable to deduce that some institutions
were included in both populations. Astin and Lee (1972) selected their 494-institution population
from the total of 918 private four-year colleges in 1968 whose enrollment size was under 2,500
and whose selectivity level was determined by a combined SAT verbal plus mathematical score
of less than 998. The authors’ rationale for studying these institutions was that they constituted a
large segment of the population of four-year institutions in the United States, approximately one-
third, and that their obscurity was a risk factor for extinction.
These invisible colleges were the “have-not” institutions, according to Astin and Lee.
Eaker (2008) summarized succinctly Astin and Lee’s heart of the challenge faced by these
colleges,
The elite private colleges can justify costs through their reputation but less well known colleges have a harder time articulating their value. Public institutions attract students with lower costs; elite private colleges can attract them with their reputations; but less selective private colleges are caught in the middle and have neither low cost or reputation to attract students. (p. 30)
The invisible colleges’ revenue streams of tuition, foundation grants, gifts, and federal and state
aid were limited. Despite these limitations and other challenges, Astin and Lee (1972) presented
reasons to work for the continued existence of these institutions rather than to let them close
down. These reasons included: (1) increased opportunities for students to participate in extra-
curricular opportunities among a smaller student population, (2) ability to provide academic
programs to the growing number of students in post-secondary education nationwide, and (3)
reduce the burden of public institutions to accommodate the growing number of students and the
special academic needs of those less prepared for college. Logue (2003) concurred with many of
these reasons as well.

76
Turnaround.
A number of dissertations and articles, primarily case studies, have been published on the
topic of small college turnaround, some of which included various members of the 219
institutions of this study. Eaker’s 2008 dissertation, Small Private College Revitalization: A
Meta-Study of Successful College Turnaround, included at least six Title III or V-eligible
colleges among the 45 revitalized institutions that formed the basis of the dissertation. Eaker
(2008) readily admitted that each institution was unique, and as such, it could be difficult to
identify common threads in the turnaround process that could be adopted by institutions facing
similar challenges. Nonetheless, some observations worthy of mention were presented.
According to the meta-study, leadership played a particularly critical role in institutional
turnaround, as evidenced by: (1) the increased involvement of the boards of trustees, (2) putting
decision-making structures in place that were accepted by all constituencies, (3) increasing
academic offerings rather than narrowing them, along with associated budget cuts, (4) focusing
on the institution’s mission while, at the same time, needing to “find ways to ‘be more things to
more people’” (Eaker, 2008, p. iv), and (5) imbuing an institution-wide sense of the importance
for everyone to participate in activities to increase enrollment.
Another case study on college turnaround was conducted on Tusculum College, one of
the 219 institutions that were the focus of this dissertation. The story of Tusculum’s turnaround
was the subject of one of three case studies in Franks’ 2003 dissertation, The Educational
Metamorphosis: How Three Small Colleges Transformed Themselves, as well as a 2001
exemplar by Iannozzi. Tusculum successfully turned around from virtual bankruptcy, a few
months away from closing in 1989, to undergo what became a 13-year revitalization (Franks,
2003). Certainly a number of strategies were employed to bring the college back. However, both

77
Franks (2003) and Iannozzi (2001) pointed to the change in leadership, at the president level, as a
main factor in the college’s revitalization. According to Franks (2003), the faculty had declared a
“vote of no confidence” and convinced the board of trustees to begin the search for a new
president, resulting in the first of two presidents whose leadership was credited with saving and
revitalizing Tusculum. It is of interest to note that one of the strategies, the implementation of the
college’s Competency Evaluation Program, was adapted from another non-profit, private Title
III-eligible institution, Alverno College (Franks, 2003).
Viability.
The term, “viability”, does not have one standard definition. In the context of
higher education, Eaker (2008) defined it as “colleges that are not in imminent danger of
closing and are on a generally stable or upward trend in the obvious areas of enrollment,
endowment and operating revenue” (p. 8), while Heinrichs (2002) used the KPMG
definition of financial viability as “the ability of an institution to continue to achieve its
operating objectives and fulfill its mission over the long term” (pp. 20-21). The U.S.
GAO (2009) report framed revenue resources, related to viability, in terms of institutional
endowment holdings, tuition, and fees. According to the U.S. GAO (2009) report, Title
III and V-eligible four-year private, not-for-profit institutions had significantly lower
average endowments per student, $6,610, compared with non-eligible four-year private,
not-for-profit institutions that had $20,391 per student. In addition, the average tuition
and fees for Title III and V-eligible four-year private, not-for-profit institutions was
$11,826, considerably less than the average $19,455 of their non-eligible counterparts.
Logue (2003) studied the “survival ability” of Pennsylvania’s 60 traditional four-year
colleges in the 1990s. Logue’s population included 10 of the 13 Title III or V-eligible private

78
institutions located in Pennsylvania that were included in this dissertation. The author appeared
to define “survival ability” in terms of institutional finances and academic quality (Logue, 2003).
Nine of the 15 Pennsylvania colleges that were studied in depth by Logue and included in this
dissertation were ranked by Logue in the bottom third of Logue’s population in terms of
financial vulnerability. (The composite ranking was comprised of ranking by enrollment,
changes in enrollment, market value of endowment fund and changes in market value of
endowment fund, net tuition revenue per FTE and change in the net tuition revenue per FTE).
Logue chose to conduct further analysis on the bottom 15 of the list; seven of these were part of
this present study. The analysis studied the trends of financial and academic quality strategies for
each of the seven institutions from 1990-1999 (Logue, 2003).
The seven Pennsylvania Title III or V-eligible institutions that were studied in depth by
Logue and included in this present study were: Cabrini College, Carlow College, Chatham
College, Chestnut Hill College, Kings College, Robert Morris University, and Thiel College.
According to Logue (2003), Chatham and Kings Colleges saw significant financial improvement
between 1990 and 1999; Chestnut Hill College saw moderate financial improvement; Cabrini
College, Robert Morris University and Thiel College saw insignificant or no financial change;
and Carlow College saw a moderate financial decline.
Selectivity.
The term “selectivity” was used frequently in various articles and dissertations to refer to
ease of acceptance to an institution of higher education, but was not defined per se. Alon and
Tienda (2005) presented a working definition of “selectivity” as related to key indicators of
average SAT scores and the percentage of applicants admitted to the freshman class. According

79
to Alon and Tienda (2005), these key indicators were selected as cited from Barron’s Best
Colleges (2003), Bowen and Bok (1998), and Greenberg (2002).
The U.S. Government Accountability Office’s (GAO) August 2009 report, Low-Income
and Minority Serving Institutions: Management Attention to Long-standing Concerns Needed to
Improve Education’s Oversight of Grant Programs, reported that 28 percent of Title III and V-
eligible four-year, private, not-for-profit institutions had an “open admissions” policy, compared
with just 10 percent of their non-eligible counterparts. While “open admissions” or “open
enrollment” policy was most typical of two-year public institutions, 96 percent of Title III and V-
eligible and 95 percent of non-eligible, it was more prevalent among eligible institutions as a
whole, 60 percent, compared with just 34 percent of non-eligible institutions (two-year public,
two-year private, four-year public, four-year private) (U.S. GAO, 2009).
According to Astin and Lee (1972), lesser selectivity was one of the characteristics of
“invisible colleges”. The 494 invisible colleges of the 1972 publication were less selective, that
is, the composite SAT scores (math and verbal) of their students were less than 998 or were not
available. The highly selective institutions, according to Astin and Lee, had an average 1320 or
higher on combined SAT scores and represented 1.9 percent of the private college population.
The growing divide of SAT scores of entering students between the top-ranked private
colleges and the lower-tiered institutions between 1966 and 1991 was documented by Hoxby
(1997). In a sample of 731 private colleges, the average combined SAT score (math and verbal)
of students in highly selective colleges, i.e., colleges at the 90th percentile, was 1266 points, a
370 point difference from non-selective colleges, i.e., colleges at the 10th percentile, which had
an average SAT score of 896 points (Hoxby, 1997; Logue, 2003).

80
Eaker’s 2008 meta-study on small private college revitalization briefly discussed issues
of selectivity vis-à-vis revitalization. The practice of lowering admissions standards, i.e.,
accepting students with lower SAT or ACT scores, was used by some of the colleges that
underwent revitalization; the strategy was employed to increase enrollment. In terms of
institutional revitalization, Eaker (2008) reported that as enrollments increased, so did selectivity.
This may suggest that higher selectivity could be a measure of viability and institutional strength
unless, as Eaker cautioned, relaxed selectivity was part of the institution’s mission, that is, to
serve the under-prepared.
Risk for merger or closure.
An implicit, shared characteristic of Title III-and V-eligible institutions is the greater risk
for closure due to financial difficulties, as compared with non-Title III and V-eligible
institutions. Title III was created at a time in American higher education in which enrollments
were growing, so there was interest in helping strengthen the smaller, weaker colleges rather than
dispose of them (St. John, 1981). Over time, the challenges faced by these institutions changed,
and Title III may have been viewed less as a means for strengthening the institution and more as
a means for institutional survival. As St. John (1981) explained,
In 1965 Title III was designed to strengthen weaker colleges that could provide essential educational services to an increasing student population. Fifteen years later, numerous colleges can potentially benefit from the services provided by Title III because many more colleges are suffering from financial stress and enrollment losses (p. 29).
The program was not intended to “save a sinking ship” but it was designed to strengthen the
weaker institutions that, by nature of their weaknesses, were at greater risk for closure.
In 2009, Porter and Ramirez presented an initial study on private college and university
closings and mergers between 1975 and 2005. The authors explained that public institution
81
closures were almost nonexistent; conversely, in the 30-year period of the study, 10 percent of
the 824 institutions had ceased to exist as stand-alone institutions. Institutional size and wealth
were the two factors found to be most related to institutional closure. According to Porter and
Ramirez (2009), smaller institutions were less able to endure the short-term effects of enrollment
declines than larger institutions, which benefited from “economies of scale”. Further, institutions
with small endowments were more vulnerable to short-term financial challenges because
sufficient funds were not available for the possible “rainy day”. Conversely, Porter and Ramirez
(2009) found that selectivity and religious affiliation each had a positive relationship with
institutional survival.
Minority student population.
The U.S. GAO (2009) report provided data on the race/ethnicity percentages at Title III
and V-eligible institutions, which revealed that the eligible four-year, private, not-for-profit
institutions enrolled the highest percentage of minority students, 56 percent, compared with all
other eligible and non-eligible subgroups. Further, of the 56 percent minority students enrolled at
the eligible four-year, private, not-for-profit institutions, 24 percent were African American.
However, this author cautions that the data may include Title III Part A and Part B (Table 2.7).

82
Table 2.7 Undergraduate Enrollment by Percent Race/ Ethnicity of Title III and V-Eligible Institutions Eligible
Ineligible
Race/Ethnicity 2-yr public
2-yr private
4-yr public
4-yr private
2-yr public
2-yr private
4-yr public
4-yr private
African American
16% 16% 22% 24% 11% 13% 8% 8%
Asian
7% 8% 6% 3% 6% 3% 7% 5%
Hispanic
19% 15% 25% 29% 11% 15% 6% 6%
Native American
1% 7% 1% 1% 1% - 1% 1%
Total Minority
43% 46% 54% 56% 30% 30% 22% 29%
White
56% 54% 45% 41% 70% 70% 76% 68%
Other
1% 1% 3% - - 2% 3%
Source: 2006 Data from the Integrated Postsecondary Education Data System, U.S. GAO Report, GAO-09-309 (August 2009)
Title V-eligible Institutions
Hispanic Serving Institutions was the formal name given to the Title V program. The
term, Hispanic-Serving Institutions (HSIs), has been loosely used by scholars to refer to colleges
and universities that enroll an undergraduate Hispanic population of at least 25 percent. While
the label “HSIs” has been recognized to be used routinely for the 25 percent enrollment
benchmark, it is important to remember that the Title V-eligible definition applies the 25 percent
minimum for the undergraduate student population and requires that 50 percent of the Hispanic
population also be low-income students. The Hispanic Association of Colleges and Universities
(HACU) founded in 1986, permits institutions as associate members if they enroll at least 1,000
Hispanic students (Laden, 2001).

83
Unlike many Historically Black Colleges and Universities (HBCUs), which were
chartered as institutions to serve Black students, most institutions that meet HSI enrollment
criteria were not chartered as institutions to serve Hispanic students (Herber-Valdez, 2008;
Laden, 2001; O’Brien, & Zudak, 1998). Rather, existing institutions enrolled greater and greater
numbers of Hispanic students due to geographical demographics. Three institutions were
founded with the mission to serve the Hispanic student population: Hostos Community College
in New York’s South Bronx, Boricua College, in New York City, and the National Hispanic
University, located in California’s Silicone Valley (Herber-Valdez, 2008). The latter two were
part of the 219 institutions for this current dissertation. According to Laden (2001), HACU was
instrumental in the addition of the Strengthening Hispanic-Serving Institutions program to the
Higher Education Act.
Laden (2001) noted 203 as the number of HSIs in the U.S., distributed through 12 states
and Puerto Rico. The states were: Arizona, California, Colorado, Florida, Illinois, Kansas,
Massachusetts, New Jersey, New Mexico, New York, Texas, and Washington. Four-year private
HSIs numbered 52, or 25.6 percent of all HSIs (Laden, 2001).
A number of erroneous myths about Hispanic interest in education were described and
dispelled by Laden (2001). Included were the following:
• “Myth 1: Hispanics Have Little Interest in Going to College” (p. 80).
• “Myth 2: Hispanic Parents Do Not Encourage Their Children to Go to College” (p. 81).
• “Myth 3: Hispanic Students Do Not Seek Financial Assistance” (p. 83).
• “Myth 4: Hispanic Students Have Few Educational Role Models” (p. 84).
• “Myth 5: HSIs Siphon off Resources From Other Special Focus Institutions” (p. 85).
• “Myth 6: HSIs Do Not Figure Prominently in the Community” (p. 87).

84
The number of HSIs, unlike HBCUs, has been increasing due to the dramatic growth of
Hispanic and Latino Americans, documented in Census 2000. A significant number of Hispanic
immigrants are forecast to continue to enter the United States through 2020 (O’Brien, & Zudak,
1998). Stearns and Watanabe (2002) reported that between 1990 and 1999, HSI Hispanic student
enrollment grew from 359,000 to 588,000, exceeding the growth of any other minority
population during that time. Further, HSIs experienced an increase of 36 percent in degrees
awarded between 1991-2000, compared with a 13 percent increase among all other U.S.
institutions of higher education (Sterns & Watanabe, 2002). As the numbers continue to grow,
HSI advocates have voiced concerns that institutional services for Hispanic students must be
developed beyond enrollment (Santiago & Andrade, 2010).
With the rapidly growing population of Hispanic Americans and the continued influx of
immigrants, colleges and universities will consider and admit a greater number of Hispanic
students. The challenge will be to graduate them (Santiago & Andrade, 2010). The number of
emerging HSIs, which enrolled between 12 to 24 percent Hispanic students in 2006-07,
numbered 176 institutions (Santiago & Andrade, 2010). Of the 176, 19 or 10.7 percent, were
part of the 219 Title III and V-eligible institutions of this dissertation.
Transformational Leadership for Higher Education
Burns’ 1978 landmark book, Leadership, launched the concept of “transforming” or
transformational leadership, a new type of leadership that differed significantly from the
transactional leadership theory of the day (Bass & Riggio, 2006; Kouzes & Posner, 2007).
Independently, in 1977, House wrote of the charismatic characteristics of famous leaders, known
as charismatic leadership theory (Chemers, 2000; Northouse, 2004). In the mid 1980s, Bass
expanded and further developed a comprehensive theory of transformational leadership, which

85
included charismatic factors (Bass, 1985; Northouse, 2004). Bass (1985) posited that leadership
theory and practice could be better explained through a multi-disciplinary approach that brought
sociology, political science and psychohistory to the area of study that was dominated by
organizational psychology. Transformational leadership, then, took a different approach to
leader-follower dynamics, decision-making, focus and behaviors as compared with the theories
of the first half of the twentieth century (Bass, 1985).
Burns (1978) described transformational leadership as follows:
[T]he transforming leader looks for potential motives in followers, seeks to satisfy higher needs, and engages the full person of the follower. The result of transforming leadership is a relationship of mutual stimulation and elevation that converts followers into leaders and may convert leaders into moral agents. (p. 4)
Further, Burns (1978) explained that “Such leadership occurs when one or more persons engage
with others in such a way that leaders and followers raise one another to higher levels of
motivation and morality” (p. 20). Bass identified four components of transformational
leadership: “idealized influence”, “inspirational motivation”, “intellectual stimulation”, and
“individualized consideration” (Bass & Riggio, 2006, p. 22).
Bass developed an instrument, the Multifactor Leadership Questionnaire (MLQ), to
measure transformational and transactional leadership characteristics as well as laissez-faire
leadership, management by exception, and contingent reward (Bass & Riggio, 2006). Levine
(2000) utilized the MLQ to assess the leadership styles of presidents of the 50 top national
universities. The MLQ 5x-short version was administered to the senior administrators who
worked most closely with the presidents; responses were analyzed. Levine’s (2000) findings
included a predominance of transformational leadership practices of the presidents, at 68 percent,
followed by 24 percent transactional practices and 8 percent laissez faire. The most surprising

86
finding, however, was the high correlation between extra effort, effectiveness and satisfaction
with the leader, and transformational leadership (Levine, 2000).
Using the same methodology as Levine, Webb (2003) conducted a study of the
presidential transformational and transactional leadership styles through the administration of the
MLQ 5x-short version to the senior administrators who worked most closely with the presidents.
However, Webb studied presidents of institutions with membership in the Council for Christian
Colleges and Universities. Webb (2003) found that 90.8 percent of the presidents of the data
generating sample demonstrated a high degree of frequency of transformational leadership
behaviors. At the same time, the analysis demonstrated a moderate frequency of transactional
leadership behaviors in 96.8 percent of the presidents.
Although Kouzes and Posner did not label their leadership theory as transformational per
se, their five practices of exemplary leaders were identified that have been treated as
transformational by other scholars (Bass, 2008; Carless, Wearing, & Mann, 2000; Conger, 1999;
Mulcahy, 2000, 2009), Kouzes and Posner’s (2007) five characteristics of leadership were
“Model the Way”, “Inspire a Shared Vision”, “Challenge the Process”, “Enable Others to Act”,
and Encourage the Heart” (p. 26). Skyers (2006) studied Kouzes and Posner’s leadership
characteristics as applied to presidents of New England community colleges through the use of
Kouzes and Posner’s instrument, the Leadership Practices Inventory (LPI). Through the self-
reported responses of the 35 presidents who completed the LPI, Skyers (2006) reported that the
presidents’ transformational leadership practices were considerably higher when compared with
other LPI respondents.
Finally, though the Title III program was launched more than a decade before the
emergence of transformational leadership theory, there are similarities between the Title III

87
program’s perspective of the role of the president in Title III-funded institutions. Davis’ 1983
report illustrated this perspective. According to Davis (1983), presidents of strong Title III-
funded institutions demonstrated transformation-like leadership practices. The Title III program
expects close involvement of the institution’s president because program evaluations identified
this characteristic as a critical element of early successful Title III programs. The nature of Title
III, the “strengthening the institution” program, is such that it needs a strong change agent in the
chief executive officer.

88
Chapter 3
Research Methodology
This purpose of this study was to investigate the transformational leadership
characteristics of college and university presidents of private Title III and Title-V eligible
institutions. The survey research method was used because it is the method of choice for
obtaining the self-reported descriptive information sought for this study (Mertens, 2010). This
method has been applied extensively and its use is accepted by academic institutions (Rea &
Parker, 1997). Also, it is used regularly for research in education and psychology (Mertens,
2010). The specific survey research method selected for this study was the simple descriptive
type. According to Mertens (2010), “The simple descriptive approach is a one-shot survey for the
purpose of describing the characteristics of a sample at one point in time” (p. 177).
This chapter was comprised of three sections: (1) a description of the subjects, including
the population, invited sample, responding sample, and data generating sample; (2) the materials
used for the study, which consisted of a demographic survey and an instrument, the Leadership
Practices Inventory (LPI), developed by Kouzes and Posner, with a description of the validity
and reliability of the instrument; and (3) the procedures followed for data collection and data
analysis.
Subjects
The population for this research was the college and university presidents of the 1,041
Title III or V-eligible institutions located in one of the 50 states and the District of Columbia, as
documented by the U.S. Department of Education (Appendix A). (The 54 eligible institutions
located in Guam and Puerto Rico were excluded from this study.) A purposive sample of
presidents of the 219 private, non-profit Title III or V-eligible institutions comprised the invited

89
sample of this research (N=219). The purposive sampling technique was used because: (1) the
presidents of private, four-year institutions represented a small percentage of the population,
21.04 percent, and therefore would likely be under-represented if another sampling technique
were used; and (2) this targeted population represented the exact group chosen for this research
(Mulcahy & Gregory, 2009). The responding sample was 155 (70.78%) and the data generating
sample was 146 (66.67%). Non-data generating responders were comprised of six presidents
who declined to participate and three whose responses were incomplete.
Of the 41 states in which the invited sample presidents’ institutions were located, 38
states were represented in the data generating sample (Table 3.1).
Table 3.1
College and University Presidents of Title III and V-Eligible Private, Non-Profit Institutions – Invited Sample and Data Generating Sample
Region and States Invited Sample Data Generating Sample
Northeast Connecticut, Maine, Massachusetts, New Hampshire, New Jersey, New York, Pennsylvania, Rhode Island, Vermont
61 38
Midwest Illinois, Indiana, Iowa, Kansas, Michigan, Minnesota, Missouri, Nebraska, North Dakota, South Dakota, Ohio, Wisconsin
65
43
South Alabama, Arkansas, Delaware, District of Columbia, Florida, Georgia, Kentucky, Louisiana, Maryland, Mississippi, North Carolina, Oklahoma, South Carolina, Tennessee, Texas, Virginia, West Virginia
64 50
West Alaska, Arizona, California, Colorado, Hawaii, Idaho, Montana, Nevada, New Mexico, Oregon, Utah, Washington, Wyoming
29 15
N=219

90
Materials
The Leadership Practices Inventory (LPI) Self, 3rd Edition (Appendix B), was used to
measure transformational leadership characteristics. A simple demographic survey (Appendix C)
was used to obtain the respondent’s gender, race/ethnicity, and number of years in current
position.
Leadership Practices Inventory (LPI)-Self, Third Edition.
The Leadership Practices Inventory (LPI) was selected as the instrument to measure
transformational leadership characteristics of the sample population. As discussed in Chapter 2,
the authors of the LPI did not identify it as an instrument with which to measure transformational
leadership behaviors. Rather, “The Leadership Practices Inventory was developed to measure
empirically the conceptual framework developed in the case studies of managers’ personal best
experiences as leaders—times when they had accomplished something extraordinary in an
organization” (Posner & Kouzes, 1990, p. 213). Nonetheless, numerous authors have identified
Kouzes and Posner’s measure of leader behaviors as transformational (Bass, 2008; Carless,
Wearing, & Mann, 2000; Conger, 1999; Hautala, 2006; Mulcahy, 2000, 2009; Podsakoff,
MacKenzie, Moorman, & Fetter, 1990; Strang, 2005). Further, a February 28, 2010 query of the
terms “LPI” and “transformational leadership” in the citation and abstract field of the ProQuest
Dissertation & Theses database produced a list of 45 dissertations.
The Leadership Practices Inventory, Third Edition, is a 30-item survey that was first
developed in the 1980s by Posner and Kouzes (1988). Qualitative and quantitative research was
conducted to identify and refine characteristics of best leadership practices. These five leadership
practices that were identified through the initial research were developed into behaviorally-based
statements, six for each practice, for a total of 30 (Posner & Kouzes, 1988). Raw scores for each

91
practice may range from 10 to 60 points. The LPI-Self was designed to be completed by the
leader and the LPI-Other was designed to be completed by direct subordinates of the leader
(Posner & Kouzes, 1988). According to Posner and Kouzes (1988), “The Leadership Practices
Inventory (LPI) was designed on the basis of lengthy and repeated feedback from respondents,
and factor analyses of various sets of behaviorally-based statements. Each statement was cast on
a 5-point Likert scale” (p. 485). The document, “Leadership Practices Inventory Psychometric
Properties (June 2000)” noted that a few changes were made to the LPI second edition: a few of
the 30 LPI statements were modified and the five-point Likert scale was replaced by a 10-point
Likert scale in the second edition of the LPI.
Validity and reliability of the LPI.
Face validity and discriminant validity have been established for the LPI (Posner, 2002).
Predictive validity also was reported for the LPI (Kouzes & Posner, 2001). Further, regarding the
factor analysis performed on the LPI, Posner (2002) concluded, “that the LPI contains five
factors, the items within each factor corresponding more among themselves than they do with the
other factors” (p. 14). Further still, the findings of a 1993 factor analysis on the LPI, conducted
by Herold, Fields, and Hyatt, were quoted in Posner’s The Leadership Practices Inventory:
Theory and Evidence Behind the Five Practices of Exemplary Leaders (2002) as follows:
Estimating a correlated factors model corresponding to the oblique factor rotation, modified to reflect the intercorrelations among the error items for the LPI items that had correlations with other items exceeding, 50, resulted in a confirmatory model with acceptable fit (Chi-Square – 399.9, d.f. = 363, p < .09). In addition, all of the hypothesized structural coefficients linking the observed variables to the five factors were highly significant with all t values exceeding 7.0, suggesting that when modeled appropriately, the LISREL estimates confirm the LPI factor Model. (pp. 14-15)

92
The reliability of the LPI was reaffirmed and reported by Posner in an August 2009
psychometric update. The internal reliability coefficients were reported for each of the five
measured leadership practices for the LPI-Self (Table 3.2).
Table 3.2 LPI-Self Reliability Coefficients (Posner, 2009, p. 1)
Leadership Practice
Cronbach alpha
Model the Way
.74
Inspire a Shared Vision
.88
Challenge the Process
.79
Enable Others to Act
.73
Encourage the Heart
.86
Posner (2002) also reported that the “test-retest reliability for the five leadership practices has
been consistently strong, generally at the .90 level and above” (p. 8). Huber, Mass, McCloskey,
Scherb, Goode, and Watson (2000) published a study in which a number of instruments were
evaluated, including 18 leadership instruments. Psychometric soundness was rated, which was
determined based on “a conceptual or theoretical framework, methodologic description of
development and testing, reported reliability and validity statistics…, and repeated use in
research studies” (Huber, Mass, McCloskey, Scherb, Good, and Watson, 2000). The LPI
received a maximum rating for psychometric soundness. In conclusion, Leong and Lewis (2010)
reported on the LPI for the on-line January 2010 Mental Measurements Yearbook.
93
There is good evidence to support the reliability and validity of the LPI. The conceptual scheme on which the LPI is based is elegant and the test items have excellent face validity as well as psychometric validity. Factor analyses and multiple regressions provide strong support for both the structural and concurrent validity of the LPI.
Procedures
Data gathering plan.
In order to predict whether or not a sufficient data generating sample eventually would
likely be secured at a later date, a preliminary mailing was conducted to the invited sample
(N=219) in November 2008. The mailing included an introductory letter (Appendix D) that was
personally addressed to each president, by name; the envelopes and letter were typewritten. The
introductory letter described the proposed dissertation topic and requested a response from the
recipient, via the enclosed, self-addressed, stamped postcard, to indicate whether or not he or she
would likely participate in the study in the summer of 2009. A copy of the LPI (Appendix B)
was included for information purposes only. Four possible responses were listed on the postcard:
“definitely would”, “probably would”, “probably would not”, and “would not”. The 143
responses (65.30%) were distributed as follows: 115 responded “definitely would” or “probably
would”; 28 responded “probably would not” or “would not”. Permission to use the LPI for
research was requested and secured from Kouzes and Posner in November 2008 (Appendix E).
Prior to mailing the instrument for data collection, approval to conduct this research on
human subjects was granted by the University of Bridgeport Institutional Review Board in May
2009 (Appendix F). Subsequently, the data request mailing was sent to the invited sample
(N=219) in July 2009. Each cover letter was personally addressed to the institution’s president;
the envelope and letter were typewritten. The mailing consisted of a cover letter with explanation
and instructions (Appendix G), a copy of the LPI and LPI instructions (Appendix B) that had

94
been reproduced in color, the demographic survey (Appendix C), and a self-addressed, stamped,
return envelope. A unique, three-digit numerical code was placed at the bottom of the LPI and
demographic survey in order to track responses. All recipients were informed that participation
was voluntary and complete anonymity was assured for all respondents. A follow-up, repeat
mailing was sent to non-responders in September 2009 (Appendix H). Again, each cover letter
and envelope were personally addressed and typewritten, the enclosed LPI and instructions were
reproduced in color. The follow-up mailing also included the demographic survey and a self-
addressed stamped, return envelope. The same unique, three-digit numerical code was placed at
the bottom of the LPI and demographic survey. Again, recipients were informed that
participation was voluntary and complete anonymity assured. See Appendices B, C, G, and H for
copies of each mailing.
Personal information on each respondent was obtained through the self-reported
Demographic Survey (Appendix C), which was returned with the completed LPI. Data on the
respondent’s gender, race/ethnicity, and number of years in position was provided for each data-
generating sample.
Demographic characteristics of each data generating sample’s institution were obtained
as follows: (1) data on the institution’s undergraduate minority enrollment, total undergraduate
enrollment, and institutional affiliation were obtained from information available through the on-
line, publically released data of the Integrated Postsecondary Education Data System (IPEDS),
which is part of the U.S. Department of Education’s National Center for Education Statistics
(NCES). The percentage undergraduate minority enrollment was calculated by the researcher. (2)
Data on the campus setting was obtained through each institution’s on-line profile at

95
www.petersons.com. Peterson’s is a well-known, private company that provides self-reported
information on colleges and universities to the general public.
Data analysis plan.
In order to study the transformational leadership characteristics of college and university
presidents of private, four-year Title III and V-eligible institutions, the Leadership Practices
Inventory scores, personal information and institutional information of the data generating
sample were analyzed. The aggregate LPI scores for each LPI descriptor, i.e., “Model the Way”,
“Inspire a Vision”, “Challenge the Process”, “Enable Others to Act”, and “Encourage the Heart”,
were calculated for each respondent using the LPI Scoring 3.0 CD-Rom (Kouzes & Posner,
2003). All statistical tests were conducted on the Statistical Package for the Social Sciences
(SPSS) Student Version 16.0 for Windows software. All data was processed at the .05 level of
significance.
The various statistical tests that were performed were selected based on the nature of the
research question. This included the use of: (1) descriptive statistics: mean, median, standard
deviation, and range; (2) parametric inferential statistics: independent t-test to compare
differences; and (3) correlational studies: Pearson Product Moment Correlation Coefficient for
relationships and multiple regression to determine the predictive ability of certain variables.
Descriptive statistics were computed to provide the distribution of responses to the five
LPI descriptors: “Model the Way”, “Inspire a Shared Vision”, “Challenge the Process”, “Enable
Others to Act”, and “Encourage the Heart”. The use of descriptive statistics permitted the
researcher to view the measures of central tendency and measures of variability of the data
generated sample (Mertens, 2010; Mulcahy & Gregory, 2009). Since the sample was purposive,

96
these statistics provided a generalized description of the college and university presidents who
were the target of this research.
The independent t-test was used to analyze for differences between the individual
variables of gender, campus setting, and institutional affiliation with the LPI descriptors: “Model
the Way”, “Inspire a Shared Vision”, “Challenge the Process”, “Enable Others to Act”, and
“Encourage the Heart”. The sample size and normal distribution allowed for the use of this
parametric inferential statistic (Mulcahy & Gregory, 2009). The independent t-test was selected
because it is the inferential statistic of choice to compare for differences between two groups
(Mertens, 2010).
The Pearson Product Moment Correlation Coefficient was used to analyze for a
relationship between the individual variables of number of years in current position, percentage
undergraduate minority students, and undergraduate enrollment with the LPI descriptors: “Model
the Way”, “Inspire a Shared Vision”, “Challenge the Process”, “Enable Others to Act”, and
“Encourage the Heart”. The sample size and normal distribution allowed for the use of this
parametric inferential statistic (Mulcahy & Gregory, 2009). The Pearson Product Moment
Correlation Coefficient was selected because it “describes the strength and direction of a
relationship between two variables” (Mertens, 2010, p. 406).
Multiple regressions were performed to “indicate the amount of variance that all of the
predictor variables explain” (Mertens, 2010, p. 406). The two multiple regressions performed
were between (1) predictor variables of gender and number of years in current position and the
LPI descriptors: “Model the Way”, “Inspire a Shared Vision”, “Challenge the Process”, “Enable
Others to Act”, and “Encourage the Heart”; and (2) predictor variables of percentage
undergraduate minority students, undergraduate enrollment, campus setting, and institutional

97
affiliation and the LPI descriptors: “Model the Way”, “Inspire a Shared Vision”, “Challenge the
Process”, “Enable Others to Act”, and “Encourage the Heart”. Table 3.3 presented the research
questions, hypotheses and statistical tests employed follows.
Table 3.3 Research Questions, Hypotheses, and Statistical Tests Employed
Research Question Hypothesis Statistical Test
Research Question 1: What is the distribution of president responses to leadership practices, as measured by the Leadership Practices Inventory-Self?
No corresponding hypothesis Mean Median Standard Deviation Range
Research Question 2: Is there a significant difference between president responses to leadership practices related to the demographic variable of gender, as measured by the Leadership Practices Inventory-Self?
Gender
Null Hypothesis 1:
There is no significant difference between male and female president responses to the LPI descriptor, “Model the Way”.
Independent t-test
Research Question 2: Is there a significant difference between president responses to leadership practices related to the demographic variable of gender, as measured by the Leadership Practices Inventory-Self?
Null Hypothesis 2:
There is no significant difference between male and female president responses to the LPI descriptor, “Inspire a Shared Vision”.
Independent t-test
Research Question 2: Is there a significant difference between president responses to leadership practices related to the demographic variable of gender, as measured by the Leadership Practices Inventory-Self?
Null Hypothesis 3:
There is no significant difference between male and female president responses to the LPI descriptor, “Challenge the Process".
Independent t-test

98
Research Question 2: Is there a significant difference between president responses to leadership practices related to the demographic variable of gender, as measured by the Leadership Practices Inventory-Self?
Null Hypothesis 4:
There is no significant difference between male and female president responses to the LPI descriptor, “Enable Others to Act”.
Independent t-test
Research Question 2: Is there a significant difference between president responses to leadership practices related to the demographic variable of gender, as measured by the Leadership Practices Inventory-Self?
Null Hypothesis 5:
There is no significant difference between male and female president responses to the LPI descriptor, “Encourage the Heart”.
Independent t-test
Research Question 3:
Is there a significant relationship between president responses to leadership practices related to the demographic variable of number of years in current position, as measured by the Leadership Practices Inventory-Self?
Years in Current Position
Null Hypothesis 6: There is no significant relationship between president responses to the LPI descriptor, “Model the Way”, and president number of years in current position.
Pearson Product Moment Correlation Coefficient
Research Question 3:
Is there a significant relationship between president responses to leadership practices related to the demographic variable of number of years in current position, as measured by the Leadership Practices Inventory-Self?
Null Hypothesis 7:
There is no significant relationship between president responses to the LPI descriptor, “Inspire a Shared Vision”, and president number of years in current position.
Pearson Product Moment Correlation Coefficient
Research Question 3:
Is there a significant relationship between president responses to leadership practices related to the demographic variable of number of years in current position, as measured by the Leadership Practices Inventory-Self?
Null Hypothesis 8:
There is no significant relationship between president responses to the LPI descriptor, “Challenge the Process”, and president number of years in current position.
Pearson Product Moment Correlation Coefficient

99
Research Question 3:
Is there a significant relationship between president responses to leadership practices related to the demographic variable of number of years in current position, as measured by the Leadership Practices Inventory-Self?
Null Hypothesis 9:
There is no significant relationship between president responses to the LPI descriptor, “Enable Others to Act”, and president number of years in current position.
Pearson Product Moment Correlation Coefficient
Research Question 3:
Is there a significant relationship between president responses to leadership practices related to the demographic variable of number of years in current position, as measured by the Leadership Practices Inventory-Self?
Null Hypothesis 10:
There is no significant relationship between president responses to the LPI descriptor,” Encourage the Heart”, and president number of years in current position.
Pearson Product Moment Correlation Coefficient
Research Question 4:
Is there a significant relationship between president responses to leadership practices related to the institutional variables of percentage undergraduate minority students and undergraduate enrollment, as measured by the Leadership Practices Inventory-Self?
Percentage Undergraduate Minority Students
Null Hypothesis 11:
There is no significant relationship between president responses to the LPI descriptor, “Model the Way”, and percentage undergraduate minority students.
Pearson Product Moment Correlation Coefficient
Research Question 4:
Is there a significant relationship between president responses to leadership practices related to the institutional variables of percentage undergraduate minority students and undergraduate enrollment, as measured by the Leadership Practices Inventory-Self?
Null Hypothesis 12:
There is no significant relationship between president responses to the LPI descriptor, “Inspire a Shared Vision”, and percentage undergraduate minority students.
Pearson Product Moment Correlation Coefficient
Research Question 4:
Is there a significant relationship between president responses to leadership practices related to the institutional variables of percentage undergraduate minority students and undergraduate enrollment, as measured by the Leadership Practices Inventory-Self?
Null Hypothesis 13:
There is no significant relationship between president responses to the LPI descriptor, “Challenge the Process”, and percentage undergraduate minority students.
Pearson Product Moment Correlation Coefficient

100
Research Question 4:
Is there a significant relationship between president responses to leadership practices related to the institutional variables of percentage undergraduate minority students and undergraduate enrollment, as measured by the Leadership Practices Inventory-Self?
Null Hypothesis 14:
There is no significant relationship between president responses to the LPI descriptor, “Enable Others to Act”, and percentage undergraduate minority students.
Pearson Product Moment Correlation Coefficient
Research Question 4:
Is there a significant relationship between president responses to leadership practices related to the institutional variables of percentage undergraduate minority students and undergraduate enrollment, as measured by the Leadership Practices Inventory-Self?
Null Hypothesis 15:
There is no significant relationship between president responses to the LPI descriptor, “Encourage the Heart”, and percentage undergraduate minority students.
Pearson Product Moment Correlation Coefficient
Research Question 4:
Is there a significant relationship between president responses to leadership practices related to the institutional variables of percentage undergraduate minority students and undergraduate enrollment, as measured by the Leadership Practices Inventory-Self?
Undergraduate Enrollment
Null Hypothesis 16:
There is no significant relationship between president responses to the LPI descriptor, “Model the Way”, and undergraduate enrollment.
Pearson Product Moment Correlation Coefficient
Research Question 4:
Is there a significant relationship between president responses to leadership practices related to the institutional variables of percentage undergraduate minority students and undergraduate enrollment, as measured by the Leadership Practices Inventory-Self?
Null Hypothesis 17:
There is no significant relationship between president responses to the LPI descriptor, “Inspire a Shared Vision”, and undergraduate enrollment.
Pearson Product Moment Correlation Coefficient
Research Question 4:
Is there a significant relationship between president responses to leadership practices related to the institutional variables of percentage undergraduate minority students and undergraduate enrollment, as measured by the Leadership Practices Inventory-Self?
Null Hypothesis 18:
There is no significant relationship between president responses to the LPI descriptor, “Challenge the Process”, and undergraduate enrollment.
Pearson Product Moment Correlation Coefficient

101
Research Question 4:
Is there a significant relationship between president responses to leadership practices related to the institutional variables of percentage undergraduate minority students and undergraduate enrollment, as measured by the Leadership Practices Inventory-Self?
Null Hypothesis 19:
There is no significant relationship between president responses to the LPI descriptor, “Enable Others to Act”, and undergraduate enrollment.
Pearson Product Moment Correlation Coefficient
Research Question 4:
Is there a significant relationship between president responses to leadership practices related to the institutional variables of percentage undergraduate minority students and undergraduate enrollment, as measured by the Leadership Practices Inventory-Self?
Null Hypothesis 20:
There is no significant relationship between president responses to the LPI descriptor, “Encourage the Heart”, and undergraduate enrollment.
Pearson Product Moment Correlation Coefficient
Research Question 5:
Is there a significant difference between president responses to leadership practices related to the institutional variables of campus setting and institutional affiliation, as measured by the Leadership Practices Inventory-Self?
Campus Setting
Null Hypothesis 21:
There is no significant difference between urban and non-urban campus setting president responses to the LPI descriptor, “Model the Way”.
Independent t-test
Research Question 5:
Is there a significant difference between president responses to leadership practices related to the institutional variables of campus setting and institutional affiliation, as measured by the Leadership Practices Inventory-Self?
Null Hypothesis 22:
There is no significant difference between urban and non-urban campus setting president responses to the LPI descriptor, “Inspire a Shared Vision”.
Independent t-test
Research Question 5:
Is there a significant difference between president responses to leadership practices related to the institutional variables of campus setting and institutional affiliation, as measured by the Leadership Practices Inventory-Self?
Null Hypothesis 23:
There is no significant difference between urban and non-urban campus setting president responses to the LPI descriptor, “Challenge the Process”.
Independent t-test

102
Research Question 5:
Is there a significant difference between president responses to leadership practices related to the institutional variables of campus setting and institutional affiliation, as measured by the Leadership Practices Inventory-Self?
Null Hypothesis 24:
There is no significant difference between urban and non-urban campus setting president responses to the LPI descriptor, “Enable Others to Act”.
Independent t-test
Research Question 5:
Is there a significant difference between president responses to leadership practices related to the institutional variables of campus setting and institutional affiliation, as measured by the Leadership Practices Inventory-Self?
Null Hypothesis 25:
There is no significant difference between urban and non-urban campus setting president responses to the LPI descriptor, “Encourage the Heart”.
Independent t-test
Research Question 5:
Is there a significant difference between president responses to leadership practices related to the institutional variables of campus setting and institutional affiliation, as measured by the Leadership Practices Inventory-Self?
Institutional Affiliation
Null Hypothesis 26:
There is no significant difference between religious and no institutional affiliation president responses to the LPI descriptor, “Model the Way”.
Independent t-test
Research Question 5:
Is there a significant difference between president responses to leadership practices related to the institutional variables of campus setting and institutional affiliation, as measured by the Leadership Practices Inventory-Self?
Null Hypothesis 27:
There is no significant difference between religious and no institutional affiliation president responses to the LPI descriptor, “Inspire a Shared Vision”.
Independent t-test
Research Question 5:
Is there a significant difference between president responses to leadership practices related to the institutional variables of campus setting and institutional affiliation, as measured by the Leadership Practices Inventory-Self?
Null Hypothesis 28:
There is no significant difference between religious and no institutional affiliation president responses to the LPI descriptor, “Challenge the Process”.
Independent t-test

103
Research Question 5:
Is there a significant difference between president responses to leadership practices related to the institutional variables of campus setting and institutional affiliation, as measured by the Leadership Practices Inventory-Self?
Null Hypothesis 29:
There is no significant difference between religious and no institutional affiliation president responses to the LPI descriptor, “Enable Others to Act”.
Independent t-test
Research Question 5:
Is there a significant difference between president responses to leadership practices related to the institutional variables of campus setting and institutional affiliation, as measured by the Leadership Practices Inventory-Self?
Null Hypothesis 30:
There is no significant difference between religious and no institutional affiliation president responses to the LPI descriptor, “Encourage the Heart”.
Independent t-test
Research Question 6:
Do the variables of president gender and president number of years in current position significantly predict president responses to leadership practices, as measured by the Leadership Practices Inventory-Self?
President Characteristics
Null Hypothesis 31:
The variables of president gender and number of years in current position do not significantly predict president responses to the LPI descriptor, “Model the Way”.
Multiple regression
Research Question 6:
Do the variables of president gender and president number of years in current position significantly predict president responses to leadership practices, as measured by the Leadership Practices Inventory-Self?
Null Hypothesis 32:
The variables of president gender and number of years in current position do not significantly predict president responses to the LPI descriptor, “Inspire a Shared Vision”.
Multiple regression
Research Question 6:
Do the variables of president gender and president number of years in current position significantly predict president responses to leadership practices, as measured by the Leadership Practices Inventory-Self?
Null Hypothesis 33:
The variables of president gender and number of years in current position do not significantly predict president responses to the LPI descriptor, “Challenge the Process”.
Multiple regression

104
Research Question 6:
Do the variables of president gender and president number of years in current position significantly predict president responses to leadership practices, as measured by the Leadership Practices Inventory-Self?
Null Hypothesis 34:
The variables of president gender and number of years in current position do not significantly predict president responses to the LPI descriptor, “Enable Others to Act”.
Multiple regression
Research Question 6:
Do the variables of president gender and president number of years in current position significantly predict president responses to leadership practices, as measured by the Leadership Practices Inventory-Self?
Null Hypothesis 35:
The variables of president gender and number of years in current position do not significantly predict president responses to the LPI descriptor, “Encourage the Heart”.
Multiple regression
Research Question 7:
Do the variables of percentage undergraduate minority enrollment, undergraduate enrollment, campus setting, and institutional affiliation significantly predict president responses to leadership practices, as measured by the Leadership Practices Inventory-Self?
Institutional Characteristics
Null Hypothesis 36:
The variables of percentage undergraduate minority enrollment, undergraduate enrollment, campus setting, and institutional affiliation do not significantly predict president responses to the LPI descriptor, “Model the Way”.
Multiple regression
Research Question 7:
Do the variables of percentage undergraduate minority enrollment, undergraduate enrollment, campus setting, and institutional affiliation significantly predict president responses to leadership practices, as measured by the Leadership Practices Inventory-Self?
Null Hypothesis 37:
The variables of percentage undergraduate minority enrollment, undergraduate enrollment, campus setting, and institutional affiliation do not significantly predict president responses to the LPI descriptor, “Inspire a Shared Vision”.
Multiple regression
Research Question 7:
Do the variables of percentage undergraduate minority enrollment, undergraduate enrollment, campus setting, and institutional affiliation significantly predict president responses to leadership practices, as measured by the Leadership Practices Inventory-Self?
Null Hypothesis 38:
The variables of percentage undergraduate minority enrollment, undergraduate enrollment, campus setting, and institutional affiliation do not significantly predict president responses to the LPI descriptor, “Challenge the Process”.
Multiple regression

105
Research Question 7:
Do the variables of percentage undergraduate minority enrollment, undergraduate enrollment, campus setting, and institutional affiliation significantly predict president responses to leadership practices, as measured by the Leadership Practices Inventory-Self?
Null Hypothesis 39:
The variables of percentage undergraduate minority enrollment, undergraduate enrollment, campus setting, and institutional affiliation do not significantly predict president responses to the LPI descriptor, “Enable Others to Act”.
Multiple regression
Research Question 7:
Do the variables of percentage undergraduate minority enrollment, undergraduate enrollment, campus setting, and institutional affiliation significantly predict president responses to leadership practices, as measured by the Leadership Practices Inventory-Self?
Null Hypothesis 40:
The variables of percentage undergraduate minority enrollment, undergraduate enrollment, campus setting, and institutional affiliation do not significantly predict president responses to the LPI descriptor, “Encourage the Heart”.
Multiple regression

106
Chapter 4
Analysis of Findings
This purpose of this study was to investigate the transformational leadership
characteristics of college and university presidents of private Title III and Title-V eligible
institutions. President responses to the LPI descriptors were the dependent variables: “Model the
Way”, “Inspire a Shared Vision”, “Challenge the Process”, “Enable Others to Act”, and
“Encourage the Heart”. Demographic variables were comprised of: president gender, president
number of years in current position, total undergraduate student population, percent
undergraduate minority student population, campus setting, and institutional affiliation. A survey
of president race/ethnicity revealed insufficient variability for statistical analysis.
Description of the Sample
The invited sample included 219 college and university presidents of Title III or Title V-
eligible, private four-year institutions in the 50 states and the District of Columbia. The invited
sample was distributed across four geographical regions as follows: 61 (27.85%) in the
Northeast, 65 (29.68%) in the Midwest, 64 (29.22%) in the South, and 29 (13.24%) in the West.
The data-generating sample of 146 presidents (66.67%) was distributed across the four
geographical regions as follows: 38 (26.03%) in the Northeast, 43 (29.45%) in the Midwest, 50
(34.25%) in the South, and 15 (10.27%) in the West (Table 4.1).
Demographic characteristics of the data-generating sample presidents included 110 male
(75.34%) and 36 female (24.66%) presidents. The president race/ethnicities of the data-
generating sample were comprised of 144 White non-Hispanic (98.63%), one Hispanic (0.68%),
and one Asian/Pacific Islander (0.68%). Responses for president number of years in current
position ranged from less than one year to 31 years, with an average of 8.02 years and a median

107
of 6.00 years. As shown in Figure 4.1, the distribution of the years in current position had a
strong positive skew.
Table 4.1
Geographic Distribution of Invited Sample and Data Generating Sample
Geographic Region
Invited Sample Number
Invited Number Percent
Data Generating Sample Number
Data Generating Sample Percent
Northeast 61 27.85% 38 26.03%
Midwest 65 29.68% 43 29.45%
South 64 29.22% 50 34.25%
West 29 13.24% 15 10.27%
Total 219 99.99% 146 100.00%
Undergraduate enrollment at the institutions of the data generating sample ranged from
26 to 12,038, with an average of 1,700 and a median of 1,256 (Figure 4.2). The distribution of
undergraduate enrollment was positively skewed. The percent undergraduate minority
enrollment ranged from 2.05% to 83.82%, with an average of 24.97% and a median of 18.74%
(Figure 4.3). The undergraduate minority enrollment distribution was positively skewed. The
number of campuses located in an urban setting was 44 (30.14%) and the number of campuses
located in a non-urban setting was 102 (69.86%). The number of institutions with a religious
affiliation was 93 (63.70%) and the number of institutions with no affiliation was 53 (36.30%).

108
Figure 4.1. Distribution of president number of years in current position.

109
Figure 4.2. Distribution of undergraduate enrollment.

110
Figure 4.3. Distribution of percent undergraduate minority enrollment.

111
Results
Research Question 1: What is the distribution of president responses to leadership
practices, as measured by the Leadership Practices Inventory-Self?
President responses to the Leadership Practices Inventory-Self were separated into the
five descriptors: “Model the Way”, “Inspire a Shared Vision”, “Challenge the Process”, “Enable
Others to Act”, and “Encourage the Heart”. Measures of central tendency (mean and median)
and variability (range and standard deviation) were calculated for president responses to each of
the five LPI-Self descriptors. Table 4.2 presented the mean, median, and standard deviation for
president responses to each descriptor, and ranks them from highest to lowest mean scores.
Histograms were created to pictorially present the distribution for each leadership practice,
comparing the practices to the normal curve.
Table 4.2
Ranking of LPI Descriptor Averages of Title III and V-eligible President Responses
LPI Descriptor Mean
Median Standard Deviation
Enable Others to Act
51.27 52.00 4.23
Model the Way
49.77 50.00 5.07
Inspire a Shared Vision
49.75 50.00 6.05
Encourage the Heart
48.83 50.00 6.40
Challenge the Process
47.52 47.00 5.94
N = 146

112
Enable Others to Act.
The raw scores for president responses to the LPI descriptor “Enable Others to Act” had
the highest mean (51.27) of the responses to all five LPI descriptors, with scores ranging from 36
to 60. A comparison made between the mean of president responses and the mean of Executive
Management scores (N = 3,252) reported by Posner (2009) revealed that the president responses’
mean was higher than the Executive Management responses’ mean (50.06) for “Enable Others to
Act” (Table 4.3). The raw score standard deviation for the president responses was 4.23; the
standard deviation for the Executive Management responses was 5.36. Consequently, the Title
III and Title V-eligible presidents’ “Enable Others to Act” responses were greater than those of
the Executive Management responses and had lesser variance. The histogram of president
responses to “Enable Others to Act” is presented in Figure 4.4 and indicated a slight, negatively
skewed distribution.

113
Figure 4.4. Histogram of “Enable Others to Act” raw scores for Title III and Title V-eligible presidents.
Model the Way.
The next highest mean for the raw scores of president LPI responses was for the
descriptor, “Model the Way” (49.77), with scores ranging from 34 to 60. The mean president
responses score was higher than the Executive Management (N = 3,252) mean (46.71) for
“Model the Way” reported by Posner (2009). The raw score standard deviation for the president
responses was 5.07; the standard deviation for the Executive Management responses was 6.34.

114
Consequently, the Title III and Title V-eligible presidents’ “Model the Way” responses were
greater than those of the Executive Management responses and had lesser variance (Table 4.3).
The histogram of president responses to “Model the Way” is presented in Figure 4.5 and
indicated a near normal distribution.
Figure 4.5. Histogram of “Model the Way” raw scores for Title III and Title V-eligible presidents.

115
Inspire a Shared Vision.
The mean president responses’ score (49.75) for the LPI descriptor, “Inspire a Shared
Vision”, was ranked a close third behind “Model the Way”, with a range of 32 to 60. The
president responses’ mean was higher than the mean (44.74) of the Executive Management
scores (N = 3,252) reported by Posner (2009). The raw score standard deviation for the president
responses was 6.05; the standard deviation for the Executive Management responses was 8.29.
Consequently, the Title III and Title V-eligible presidents’ “Inspire a Shared Vision” responses
were greater than those of the Executive Management responses and had lesser variance (Table
4.3). The histogram of president responses to “Inspire a Shared Vision” is presented in Figure 4.6
and indicated a slightly negative skewed distribution.

116
Figure 4.6. Histogram of “Inspire a Shared Vision” raw scores for Title III and Title V-eligible presidents.
Encourage the Heart.
The raw scores for president responses to the LPI descriptor “Encourage the Heart” had a
mean of 48.83, with scores ranging from 28 to 60. A comparison made between the mean
president responses and the mean Executive Management scores (N = 3,252) reported by Posner
(2009) revealed that the president responses’ mean was higher than the Executive Management
responses’ mean (45.53). The raw score standard deviation for the president responses was 6.40;
the standard deviation for the Executive Management responses was 7.86. Consequently, the

117
Title III and Title V-eligible presidents’ “Encourage the Heart” responses were greater than those
of the Executive Management responses and had lesser variance (Table 4.3). The histogram of
president responses to “Encourage the Heart” is presented in Figure 4.7 and indicated a slight
negatively skewed distribution.
Figure 4.7. Histogram of “Encourage the Heart” raw scores for Title III and Title V-eligible presidents.

118
Challenge the Process.
The raw scores for president responses to the LPI descriptor “Challenge the Process” had
the lowest mean (47.52) of the responses for all five LPI descriptors; scores for “Challenge the
Process” ranged from 32 to 60. The president responses’ mean was higher than the mean (45.46)
of the Executive Management scores (N = 3,252) reported by Posner (2009). The raw score
standard deviation for the president responses was 5.94; the standard deviation for the Executive
Management responses was 6.83. Consequently, the Title III and Title V-eligible presidents’
“Challenge the Process” responses were greater than those of the Executive Management
responses and had lesser variance (Table 4.3). The histogram of president responses to
“Challenge the Process” is presented in Figure 4.8 and indicated a slight positively skewed
distribution.

119
Figure 4.8. Histogram of “Challenge the Process” raw scores for Title III and Title V-eligible presidents.

120
Table 4.3
Comparison of LPI Descriptor Averages of Title III and V-eligible President Responses and Posner’s Executive Management Responses
LPI Descriptor President Responses (M)
N = 146
President Responses (SD)
Executive Management
Responses (M)
N = 3,252
Executive Management
Responses (SD)
Model the Way
49.77 5.07 46.71 6.34
Inspire a Shared Vision
49.75 6.05 44.74 8.29
Challenge the Process
47.52 5.94 45.46 6.83
Enable Others to Act
51.27 4.23 50.06 5.36
Encourage the Heart
48.83 6.40 45.53 7.86
Research Question 2: Is there a significant difference between president responses
to leadership practices related to the demographic variable of gender, as measured by the
Leadership Practices Inventory-Self?
The independent t-test was performed to analyze Research Question 2 and associated
Null Hypotheses 1 through 5. The independent t-test was selected in order to measure for
significant differences between the male and female gender responses to each of the five LPI
descriptors. A confidence level of 95% was used (Table 4.4). The calculated t score was
compared to a table of critical values of “t” for two-tailed tests, at two levels of significance,
0.05 and 0.01, in order to determine statistical significance (Sprinthall, 2000).

121
Null Hypothesis 1: There is no significant difference between male and female
president responses to the LPI descriptor, “Model the Way”.
An independent t-test was conducted to compare president responses to the LPI
descriptor, “Model the Way”, in male and female presidents. There was no significant difference
in the scores for male presidents (M = 49.71, SD = 5.12) and female presidents (M = 49.97, SD =
4.99); t(144) = -.269, p = .788. Therefore, the null hypothesis was accepted.
Null Hypothesis 2: There is no significant difference between male and female
president responses to the LPI descriptor, “Inspire a Shared Vision”.
An independent t-test was conducted to compare president responses to the LPI
descriptor, “Inspire a Shared Vision”, in male and female presidents. There was no significant
difference in the scores for male presidents (M = 49.99, SD = 5.94) and female presidents (M =
49.03, SD = 6.40); t(144) = .828, p = .409. Therefore, the null hypothesis was accepted.
Null Hypothesis 3: There is no significant difference between male and female
president responses to the LPI descriptor, “Challenge the Process”.
An independent t-test was conducted to compare president responses to the LPI
descriptor, “Challenge the Process”, in male and female presidents. There was no significant
difference in the scores for male presidents (M = 47.26. SD = 6.07) and female presidents (M =
48.31, SD = 5.54); t(144) = -.912, p = .363. Therefore, the null hypothesis was accepted.
Null Hypothesis 4: There is no significant difference between male and female
president responses to the LPI descriptor, “Enable Others to Act”.
An independent t-test was conducted to compare president responses to the LPI
descriptor, “Enable Others to Act”, in male and female presidents. There was no significant

122
difference in the scores for male presidents (M = 51.55, SD = 4.09) and female presidents (M =
50.44, SD = 4.59); t(144) = 1.36, p = .176. Therefore, the null hypothesis was accepted.
Null Hypothesis 5: There is no significant difference between male and female
president responses to the LPI descriptor, “Encourage the Heart”.
An independent t-test was conducted to compare president responses to the LPI
descriptor, “Encourage the Heart”, in male and female presidents. There was no significant
difference in the scores for male presidents (M = 48.92, SD = 6.29) and female presidents (M =
48.56, SD = 6.81); t(144) = .294, p = .769. Therefore, the null hypothesis was accepted.
Table 4.4 Independent t-test Results for Presidents of Title III and Title V-eligible Institutions by Gender and Leader Behaviors
LPI Descriptor
Gender Mean SD t p
Model the Way Male Female
49.71
49.97
5.12
4.99
-.269 .788
Inspire a Shared Vision
Male Female
49.99
49.03
5.94
6.40
.828 .409
Challenge the Process
Male Female
47.26
48.31
6.07
5.54
-.912 .363
Enable Others to Act
Male Female
51.55
50.44
4.09
4.59
1.360 .176
Encourage the Heart
Male Female
48.92
48.56
6.29
6.81
.294 .769
N = 146

123
Research Question 3: Is there a significant relationship between president responses
to leadership practices related to the demographic variable of number of years in current
position, as measured by the Leadership Practices Inventory-Self?
The Pearson Product Moment Correlation Coefficient was computed to test Research
Question 3 and associated Null Hypotheses 6 through 10. The Pearson Product Moment
Correlation Coefficient was selected in order to measure for a significant relationship between
president number of years in current position to each of the five LPI descriptors. A confidence
level of 95% was used (Table 4.5). The calculated r score was compared to a table of critical
values of “r” for the Pearson correlation coefficient, at two levels of significance, 0.05 and 0.01,
in order to determine statistical significance (Sprinthall, 2000).
Null Hypothesis 6: There is no significant relationship between president responses to
the LPI descriptor, “Model the Way”, and president number of years in current position.
A Pearson Product Moment Correlation Coefficient was computed to assess the
relationship between the LPI descriptor, “Model the Way”, and the president number of years in
current position. There was no significant correlation between the two variables (r = .131, n =
146, p = .116). Therefore, the null hypothesis was accepted.
Null Hypothesis 7: There is no significant relationship between president responses to
the LPI descriptor, “Inspire a Shared Vision”, and president number of years in current
position.
A Pearson Product Moment Correlation Coefficient was computed to assess the
relationship between the LPI descriptor, “Inspire and Shared Vision”, and the president number
of years in current position. There was no significant correlation between the two variables
(r = .061, n = 146, p = .464). Therefore the null hypothesis was accepted.

124
Null Hypothesis 8: There is no significant relationship between president responses to
the LPI descriptor, “Challenge the Process”, and president number of years in current
position.
A Pearson Product Moment Correlation Coefficient was computed to assess the
relationship between the LPI descriptor, “Challenge the Process”, and the president number of
years in current position. There was no significant correlation between the two variables (r =
.007, n = 146, p = .929). Therefore the null hypothesis was accepted.
Null Hypothesis 9: There is no significant relationship between president responses to
the LPI descriptor, “Enable Others to Act”, and president number of years in current position.
A Pearson Product Moment Correlation Coefficient was computed to assess the
relationship between the LPI descriptor, “Enable Others to Act”, and the president number of
years in current position. There was no significant correlation between the two variables (r =
.103, n = 146, p = .217). Therefore the null hypothesis was accepted.
Null Hypothesis 10: There is no significant relationship between president responses to
the LPI descriptor, “Encourage the Heart”, and president number of years in current position.
A Pearson Product Moment Correlation Coefficient was computed to assess the
relationship between the LPI descriptor, “Encourage the Heart”, and the president number of
years in current position. There was no significant correlation between the two variables
(r = -.027, n = 146, p = .748). Therefore the null hypothesis was accepted.

125
Table 4.5
Pearson Product Moment Correlation Coefficient Results for Presidents of Title III and Title V-eligible Institutions and Years in Current Position
LPI Descriptor r p
Model the Way .131 .116
Inspire a Shared Vision .061 .464
Challenge the Process .007 .929
Enable Others to Act .103 .217
Encourage the Heart -.027 .748
N = 146
Research Question 4: Is there a significant relationship between president responses
to leadership practices related to the institutional variables of percentage undergraduate
minority students and undergraduate enrollment, as measured by the Leadership Practices
Inventory-Self?
The Pearson Product Moment Correlation Coefficient was computed to test Research
Question 4 and associated Null Hypotheses 11 through 20. The Pearson Product Moment
Correlation Coefficient was selected in order to measure for a significant relationship between
percentage undergraduate minority students and each of the five LPI descriptors. The Pearson
Product Moment Correlation Coefficient also was selected in order to measure for a significant
relationship between undergraduate enrollment to each of the five LPI descriptors. A confidence

126
level of 95% was used (Tables 4.6 and 4.7). The calculated r score was compared to a table of
critical values of “r” for the Pearson correlation coefficient, at two levels of significance, 0.05
and 0.01, in order to determine statistical significance (Sprinthall, 2000).
Null Hypothesis 11: There is no significant relationship between president responses to
the LPI descriptor, “Model the Way”, and percentage undergraduate minority students.
A Pearson Product Moment Correlation Coefficient was computed to assess the
relationship between the LPI descriptor, “Model the Way”, and the percentage undergraduate
minority students. There was no significant correlation between the two variables (r = .126, n =
146, p = .129). Therefore, the null hypothesis was accepted.
Null Hypothesis 12: There is no significant relationship between president responses to
the LPI descriptor, “Inspire a Shared Vision”, and percentage undergraduate minority
students.
A Pearson Product Moment Correlation Coefficient was computed to assess the
relationship between the LPI descriptor, “Inspire a Shared Vision”, and the percentage
undergraduate minority students. There was no significant correlation between the two variables
(r = .013, n = 146, p = .874). Therefore, the null hypothesis was accepted.
Null Hypothesis 13: There is no significant relationship between president responses to
the LPI descriptor, “Challenge the Process”, and percentage undergraduate minority students.
A Pearson Product Moment Correlation Coefficient was computed to assess the
relationship between the LPI descriptor, “Challenge the Process”, and the percentage
undergraduate minority students. There was no significant correlation between the two variables
(r = -.002, n = 146, p = .979). Therefore, the null hypothesis was accepted.

127
Null Hypothesis 14: There is no significant relationship between president responses to
the LPI descriptor, “Enable Others to Act”, and percentage undergraduate minority students.
A Pearson Product Moment Correlation Coefficient was computed to assess the
relationship between the LPI descriptor, “Enable Others to Act”, and the percentage
undergraduate minority students. There was no significant correlation between the two variables
(r = -.002, n = 146, p = .980). Therefore, the null hypothesis was accepted.
Null Hypothesis 15: There is no significant relationship between president responses to
the LPI descriptor, “Encourage the Heart”, and percentage undergraduate minority students.
A Pearson Product Moment Correlation Coefficient was computed to assess the
relationship between the LPI descriptor, “Encourage the Heart”, and the percentage
undergraduate minority students. There was no significant correlation between the two variables
(r = -.030, n = 146, p = .718). Therefore, the null hypothesis was accepted.
Table 4.6 Pearson Product Moment Correlation Coefficient Results for Presidents of Title III and Title V-eligible Institutions and Percentage Undergraduate Minority Students
LPI Descriptor r p
Model the Way .126 .129
Inspire a Shared Vision .013 .874
Challenge the Process -.002 .979
Enable Others to Act -.002 .980
Encourage the Heart -.030 .718
N = 146

128
Null Hypothesis 16: There is no significant relationship between president responses to
the LPI descriptor, “Model the Way”, and undergraduate enrollment.
A Pearson Product Moment Correlation Coefficient was computed to assess the
relationship between the LPI descriptor, “Model the Way”, and undergraduate enrollment. The
relationship between the two variables approached significance (r = .153, n = 146, p = .065).
However, the null hypothesis was accepted.
Null Hypothesis 17: There is no significant relationship between president responses to
the LPI descriptor, “Inspire a Shared Vision”, and undergraduate enrollment.
A Pearson Product Moment Correlation Coefficient was computed to assess the
relationship between the LPI descriptor, “Inspire a Shared Vision”, and undergraduate
enrollment. The relationship between the two variables approached significance (r = .146, n =
146, p = .078). However, the null hypothesis was accepted.
Null Hypothesis 18: There is no significant relationship between president responses to
the LPI descriptor, “Challenge the Process”, and undergraduate enrollment.
A Pearson Product Moment Correlation Coefficient was computed to assess the
relationship between the LPI descriptor, “Challenge the Process”, and undergraduate enrollment.
The relationship between the two variables approached significance (r = .146, n = 146, p = .079).
However, the null hypothesis was accepted.
Null Hypothesis 19: There is no significant relationship between president responses to
the LPI descriptor, “Enable Others to Act”, and undergraduate enrollment.
A Pearson Product Moment Correlation Coefficient was computed to assess the
relationship between the LPI descriptor, “Enable Others to Act”, and undergraduate enrollment.

129
There was no significant correlation between the two variables (r = .135, n = 146, p = .103).
Therefore, the null hypothesis was accepted.
Null Hypothesis 20: There is no significant relationship between president responses to
the LPI descriptor, “Encourage the Heart”, and undergraduate enrollment.
A Pearson Product Moment Correlation Coefficient was computed to assess the
relationship between the LPI descriptor, “Encourage the Heart”, and undergraduate enrollment.
There was no significant correlation between the two variables (r = .038, n = 146, p = .650).
Therefore, the null hypothesis was accepted.
Table 4.7 Pearson Product Moment Correlation Coefficient Results for Presidents of Title III and Title V-eligible Institutions and Undergraduate Enrollment
LPI Descriptor r p
Model the Way .153 .065
Inspire a Shared Vision .146 .078
Challenge the Process .146 .079
Enable Others to Act .135 .103
Encourage the Heart .038 .650
N = 146

130
Research Question 5: Is there a significant difference between president responses
to leadership practices related to the institutional variables of campus setting and
institutional affiliation, as measured by the Leadership Practices Inventory-Self?
The independent t-test was performed to analyze Research Question 5 and associated
Null Hypotheses 21 through 30. The independent t-test was selected in order to measure for
significant differences between urban and non-urban campus setting president responses to each
of the five LPI descriptors. In addition, the independent t-test was selected in order to measure
for significant differences between religious affiliation or no affiliation and president responses
to each of the five LPI descriptors. A confidence level of 95% was used. See Tables 4.8 and 4.9
for results. The calculated t score was compared to a table of critical values of “t” for two-tailed
tests, at two levels of significance, 0.05 and 0.01, in order to determine statistical significance
(Sprinthall, 2000).
Null Hypothesis 21: There is no significant difference between urban and non-urban
campus setting president responses to the LPI descriptor, “Model the Way”.
An independent t-test was conducted to compare president responses to the LPI
descriptor, “Model the Way”, in urban campus setting and non-urban campus setting presidents.
There was no significant difference in the scores for urban campus setting presidents (M = 50.50,
SD = 5.20) and non-urban campus setting president responses (M = 49.46, SD = 5.01); t(144) =
-1.137, p = .257. Therefore, the null hypothesis was accepted.
Null Hypothesis 22: There is no significant difference between urban and non-urban
campus setting president responses to the LPI descriptor, “Inspire a Shared Vision”.
An independent t-test was conducted to compare president responses to the LPI
descriptor, “Inspire a Shared Vision”, in urban campus setting and non-urban campus setting

131
presidents. There was no significant difference in the scores for urban campus setting presidents
(M = 50.02, SD = 5.99) and non-urban campus setting president responses (M = 49.64, SD =
6.10); t(144) = -.352, p = .725. Therefore, the null hypothesis was accepted.
Null Hypothesis 23: There is no significant difference between urban and non-urban
campus setting president responses to the LPI descriptor, “Challenge the Process”.
An independent t-test was conducted to compare president responses to the LPI
descriptor, “Inspire a Shared Vision”, in urban campus setting and non-urban campus setting
presidents. There was no significant difference in the scores for urban campus setting presidents
(M = 48.27, SD = 6.66) and non-urban campus setting president responses (M = 47.20, SD =
5.61); t(144) = -1.004, p = .317. Therefore, the null hypothesis was accepted.
Null Hypothesis 24: There is no significant difference between urban and non-urban
campus setting president responses to the LPI descriptor, “Enable Others to Act”.
An independent t-test was conducted to compare president responses to the LPI
descriptor, “Enable Others to Act”, in urban campus setting and non-urban campus setting
presidents. There was no significant difference in the scores for urban campus setting presidents
(M = 51.02, SD = 4.85) and non-urban campus setting president responses (M = 51.38, SD =
3.95); t(144) = .470, p = .639. Therefore, the null hypothesis was accepted.
Null Hypothesis 25: There is no significant difference between urban and non-urban
campus setting president responses to the LPI descriptor, “Encourage the Heart”.
An independent t-test was conducted to compare president responses to the LPI
descriptor, “Encourage the Heart”, in urban campus setting and non-urban campus setting
presidents. There was no significant difference in the scores for urban campus setting presidents

132
(M = 48.57, SD = 7.36) and non-urban campus setting president responses (M = 48.94, SD =
5.98); t(144) = .322, p = .748. Therefore, the null hypothesis was accepted.
Table 4.8 Independent t-test Results for Presidents of Title III and Title V-eligible Institutions by Campus Setting
LPI Descriptor
Campus Setting Mean SD t p
Model the Way Urban
Non-urban
50.50
49.46
5.20
5.01
-1.137 .257
Inspire a Shared Vision
Urban
Non-urban
50.02
49.64
5.99
6.10
-.352 .725
Challenge the Process
Urban
Non-urban
48.27
47.20
6.66
5.61
-1.004 .317
Enable Others to Act
Urban
Non-urban
51.02
51.38
4.85
3.95
.470 .639
Encourage the Heart
Urban
Non-urban
48.57
48.94
7.36
5.98
.322 .748
N = 146

133
Null Hypothesis 26: There is no significant difference between religious and no
institutional affiliation president responses to the LPI descriptor, “Model the Way”. An
independent t-test was conducted to compare president responses to the LPI descriptor, “Model
the Way”, in religious affiliation and no affiliation presidents. There was no significant
difference in the scores for religious institutional affiliation presidents (M = 49.56, SD = 4.89)
and no institutional affiliation president responses (M = 50.15, SD = 5.41); t(144) = .677, p =
.500. Therefore, the null hypothesis was accepted.
Null Hypothesis 27: There is no significant difference between religious and no
institutional affiliation president responses to the LPI descriptor, “Inspire a Shared Vision”.
An independent t-test was conducted to compare president responses to the LPI descriptor,
“Inspire a Shared Vision”, in religious affiliation and no affiliation presidents. There was no
significant difference in the scores for religious institutional affiliation presidents (M = 49.81, SD
= 5.61) and no institutional affiliation president responses (M = 49.66, SD = 6.81); t(144) =
-.140, p = .889. Therefore, the null hypothesis was accepted.
Null Hypothesis 28: There is no significant difference between religious and no
institutional affiliation president responses to the LPI descriptor, “Challenge the Process”. An
independent t-test was conducted to compare president responses to the LPI descriptor,
“Challenge the Process”, in religious affiliation and no affiliation presidents. There was no
significant difference in the scores for religious institutional affiliation presidents (M = 47.40, SD
= 5.56) and no institutional affiliation president responses (M = 47.74, SD = 6.61); t(144) =
.329, p = .742. Therefore, the null hypothesis was accepted.

134
Null Hypothesis 29: There is no significant difference between religious and no
institutional affiliation president responses to the LPI descriptor, “Enable Others to Act”.
An independent t-test was conducted to compare president responses to the LPI
descriptor, “Enable Others to Act”, in religious affiliation and no affiliation presidents. There
was no significant difference in the scores for religious institutional affiliation presidents (M =
51.13, SD = 3.90) and no institutional affiliation president responses (M = 51.53, SD = 4.77);
t(144) = .547, p = .585. Therefore, the null hypothesis was accepted.
Null Hypothesis 30: There is no significant difference between religious and no
institutional affiliation president responses to the LPI descriptor, “Encourage the Heart”.
An independent t-test was conducted to compare president responses to the LPI
descriptor, “Encourage the Heart”, in religious affiliation and no affiliation presidents. There was
no significant difference in the scores for religious institutional affiliation presidents (M = 49.01,
SD = 5.68) and no institutional affiliation president responses (M = 48.51, SD = 7.56); t(85.75) =
-.420, p = .676. Therefore, the null hypothesis was accepted.

135
Table 4.9
Independent t-test Results for Presidents of Title III and Title V-eligible Institutions by Institutional Affiliation
LPI Descriptor
Institutional Affiliation
Mean SD t p
Model the Way Religious No affiliation
49.56
50.15
4.89
5.41
.677 .500
Inspire a Shared Vision
Religious No affiliation
49.81
49.66
5.61
6.81
-.140 .889
Challenge the Process
Religious No affiliation
47.40
47.74
5.56
6.61
.329 .742
Enable Others to Act
Religious No affiliation
51.13
51.53
3.90
4.77
.547 .585
Encourage the Heart
Religious No affiliation
49.01
48.51
5.68
7.56
-.420 .676
N = 146
Research Question 6: Do the variables of president gender and president number of
years in current position significantly predict president responses to leadership practices,
as measured by the Leadership Practices Inventory-Self?
A forced entry multiple regression was performed to test Research Question 6 and
associated Null Hypotheses 31 through 35. Forced entry multiple regression was selected in
order to measure for predictive strength of the combination of president gender and number of
years in current position on each of the five LPI descriptors. The coefficient of determination,

136
R2, was calculated in order to determine what percent of variation in responses to each LPI
descriptor was explained by the predictor variables. The F statistic was calculated in order to
establish significance of the regression equation (Pavkov & Pierce, 2007).
Null Hypothesis 31: The variables of president gender and number of years in current
position do not significantly predict president responses to the LPI descriptor, “Model the
Way”.
Multiple regression analysis was performed to test if personal characteristics significantly
predicted president responses to “Model the Way”. The coefficient of determination, R2, was
.017, therefore, 1.7% of “Model the Way” responses could be explained by the predictor
variables, president gender and number of years in current position. ANOVA results showed the
F value as not significant (F = 1.257, p = .288). ANOVA results are displayed in Table 4.10. The
predictor variables of president gender (t = .181, p = .857) and number of years in current
position (t = 1.562, p = .120) were not significant (Table 4.11). Therefore, the null hypothesis
was accepted.
Table 4.10
ANOVAb: Model the Way
Model Sum of Squares df Mean Square F Sig.
1 Regression 64.441 2 32.220 1.257 .288a
Residual 3665.100 143 25.630
Total 3729.541 145
a. Predictors: (Constant), Years in Position, Leader Gender
b. Dependent Variable: Model the Way

137
Table 4.11
Coefficientsa: Gender, Years in Current Position
Model
Unstandardized Coefficients Standardized Coefficients
t Sig. B Std. Error Beta
1 (Constant) 48.991 .666 73.525 .000
Leader Gender .176 .974 .015 .181 .857
Years in Position .092 .059 .130 1.562 .120
a. Dependent Variable: Model the Way
Null Hypothesis 32: The variables of president gender and number of years in current
position do not significantly predict president responses to the LPI descriptor, “Inspire a
Shared Vision”.
Multiple regression analysis was performed to test if personal characteristics significantly
predicted president responses to “Inspire a Shared Vision”. The coefficient of determination, R2,
was .009, therefore, less than one percent of “Inspire a Shared Vision” responses could be
explained by the predictor variables, president gender and number of years in current position.
ANOVA results showed the F value as not significant (F = .648, p = .525). ANOVA results are
displayed in Table 4.12. The predictor variables of president gender (t = -.871, p = .385) and
number of years in current position (t = .782, p = .436) were not significant (Table 4.13).
Therefore, the null hypothesis was accepted.

138
Table 4.12
ANOVAb: Inspire a Shared Vision
Model Sum of Squares df Mean Square F Sig.
1 Regression 47.635 2 23.818 .648 .525a
Residual 5259.488 143 36.780
Total 5307.123 145
a. Predictors: (Constant), Years in Position, Leader Gender
b. Dependent Variable: Inspire a Shared Vision
Table 4.13
Coefficientsa: Gender, Years in Current Position
Model
Unstandardized Coefficients Standardized Coefficients
t Sig. B Std. Error Beta
1 (Constant) 49.561 .798 62.090 .000
Leader Gender -1.015 1.166 -.073 -.871 .385
Years in Position .055 .071 .065 .782 .436
a. Dependent Variable: Inspire a Shared Vision

139
Null Hypothesis 33: The variables of president gender and number of years in current
position do not significantly predict president responses to the LPI descriptor, “Challenge the
Process”.
Multiple regression analysis was performed to test if personal characteristics significantly
predicted president responses to “Challenge the Process”. The coefficient of determination, R2,
was .006, therefore, less than one percent of “Challenge the Process” responses could be
explained by the predictor variables, president gender and number of years in current position.
ANOVA results showed the F value as not significant (F = .414, p = .662). ANOVA results are
displayed in Table 4.14. The predictor variables of president gender (t = .905, p = .367) and
number of years in current position (t = .037, p = .971) were not significant (Table 4.15).
Therefore, the null hypothesis was accepted.
Table 4.14
ANOVAb: Challenge the Process
Model Sum of Squares df Mean Square F Sig.
1 Regression 29.493 2 14.746 .414 .662a
Residual 5094.945 143 35.629
Total 5124.438 145
a. Predictors: (Constant), Years in Position, Leader Gender
b. Dependent Variable: Challenge the Process

140
Table 4.15
Coefficientsa: Gender, Years in Current Position
Model
Unstandardized Coefficients Standardized Coefficients
t Sig. B Std. Error Beta
1 (Constant) 47.244 .786 60.135 .000
Leader Gender 1.040 1.148 .076 .905 .367
Years in Position .003 .070 .003 .037 .971
a. Dependent Variable: Challenge the Process
Null Hypothesis 34: The variables of president gender and number of years in current
position do not significantly predict president responses to the LPI descriptor, “Enable Others
to Act”.
Multiple regression analysis was performed to test if personal characteristics significantly
predicted president responses to “Enable Others to Act”. The coefficient of determination, R2,
was .025, therefore, 2.5% of “Enable Others to Act” responses could be explained by the
predictor variables, president gender and number of years in current position. ANOVA results
showed the F value as not significant (F = 1.808, p = .168). ANOVA results are displayed in
Table 4.16. The predictor variables of president gender (t = -1.437, p = .153) and number of
years in current position (t = 1.326, p = .187) were not significant (Table 4.17). Therefore, the
null hypothesis was accepted.

141
Table 4.16
ANOVAb: Enable Others to Act
Model Sum of Squares df Mean Square F Sig.
1 Regression 63.961 2 31.981 1.808 .168a
Residual 2529.080 143 17.686
Total 2593.041 145
a. Predictors: (Constant), Years in Position, Leader Gender
b. Dependent Variable: Enable Others to Act
Table 4.17
Coefficientsa: Gender, Years in Current Position
Model
Unstandardized Coefficients Standardized Coefficients
t Sig. B Std. Error Beta
1 (Constant) 51.040 .554 92.211 .000
Leader Gender -1.163 .809 -.119 -1.437 .153
Years in Position .065 .049 .110 1.326 .187
a. Dependent Variable: Enable Others to Act
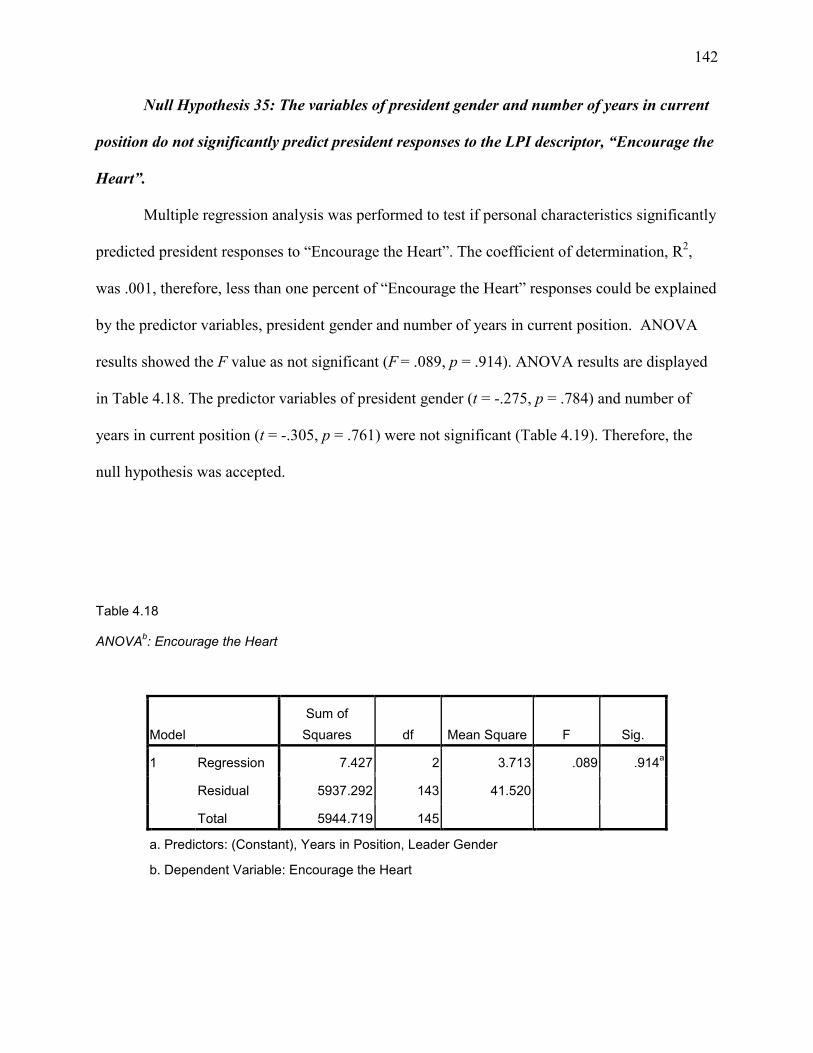
142
Null Hypothesis 35: The variables of president gender and number of years in current
position do not significantly predict president responses to the LPI descriptor, “Encourage the
Heart”.
Multiple regression analysis was performed to test if personal characteristics significantly
predicted president responses to “Encourage the Heart”. The coefficient of determination, R2,
was .001, therefore, less than one percent of “Encourage the Heart” responses could be explained
by the predictor variables, president gender and number of years in current position. ANOVA
results showed the F value as not significant (F = .089, p = .914). ANOVA results are displayed
in Table 4.18. The predictor variables of president gender (t = -.275, p = .784) and number of
years in current position (t = -.305, p = .761) were not significant (Table 4.19). Therefore, the
null hypothesis was accepted.
Table 4.18
ANOVAb: Encourage the Heart
Model Sum of Squares df Mean Square F Sig.
1 Regression 7.427 2 3.713 .089 .914a
Residual 5937.292 143 41.520
Total 5944.719 145
a. Predictors: (Constant), Years in Position, Leader Gender
b. Dependent Variable: Encourage the Heart

143
Table 4.19
Coefficientsa: Gender, Years in Current Position
Model
Unstandardized Coefficients Standardized Coefficients
t Sig. B Std. Error Beta
1 (Constant) 49.096 .848 57.891 .000
Leader Gender -.341 1.239 -.023 -.275 .784
Years in Position -.023 .075 -.026 -.305 .761
a. Dependent Variable: Encourage the Heart
Research Question 7: Do the variables of percentage undergraduate minority
enrollment, undergraduate enrollment, campus setting, and institutional affiliation
significantly predict president responses to leadership practices, as measured by the
Leadership Practices Inventory-Self?
A forced entry multiple regression was performed to test Research Question 7 and
associated Null Hypotheses 36 through 40. Forced entry multiple regression was selected in
order to measure for predictive strength of the combination of percentage undergraduate minority
enrollment, undergraduate enrollment, campus setting, and institutional affiliation on each of the
five LPI descriptors. The coefficient of determination, R2, was calculated in order to determine
what percent of variation in responses to each LPI descriptor was explained by the predictor

144
variables. The F statistic was calculated in order to establish significance of the regression
equation (Pavkov & Pierce, 2007).
Null Hypothesis 36: The variables of percentage undergraduate minority enrollment,
undergraduate enrollment, campus setting, and institutional affiliation do not significantly
predict president responses to the LPI descriptor, “Model the Way”.
Multiple regression analysis was performed to test if institutional characteristics
significantly predicted president responses to “Model the Way”. The coefficient of
determination, R2, was .041, therefore, 4.1% of “Model the Way” responses could be explained
by the predictor variables, percentage undergraduate minority enrollment, undergraduate
enrollment, campus setting, and institutional affiliation. ANOVA results showed the F value as
not significant (F = 1.505, p = .204). ANOVA results are displayed in Table 4.20. The predictor
variables of percentage minority undergraduate enrollment (t = .844, p = .400), campus setting (t
= 1.005, p = .317), and institutional affiliation (t = .006, p = .995) were not significant (Table
4.21). The predictor variable of undergraduate enrollment (t = 1.750, p = .082) approached
significance as a predictor of president responses to the LPI descriptor, “Model the Way”.
Overall, the null hypothesis was accepted.

145
Table 4.20
ANOVAb: Model the Way
Model Sum of Squares df Mean Square F Sig.
1 Regression 152.705 4 38.176 1.505 .204a
Residual 3576.836 141 25.368
Total 3729.541 145
a. Predictors: (Constant), Institution Affiliation, Total Undergraduate Enrollment, Percent Minority Enrollment UG, Campus Setting
b. Dependent Variable: Model the Way
Table 4.21
Coefficientsa: Percentage Undergraduate Minority Enrollment, Undergraduate Enrollment, Campus Setting, and Institutional Affiliation
Model
Unstandardized Coefficients Standardized Coefficients
t Sig. B Std. Error Beta
1 (Constant) 48.147 1.111 43.333 .000
Percent Minority Enrollment UG
.020 .023 .075 .844 .400
Total Undergraduate Enrollment
.000 .000 .151 1.750 .082
Campus Setting .988 .983 .090 1.005 .317
Institution Affiliation .006 .908 .001 .006 .995
a. Dependent Variable: Model the Way

146
Null Hypothesis 37: The variables of percentage undergraduate minority enrollment,
undergraduate enrollment, campus setting, and institutional affiliation do not significantly
predict president responses to the LPI descriptor, “Inspire a Shared Vision”.
Multiple regression analysis was performed to test if institutional characteristics
significantly predicted president responses to “Inspire a Shared Vision”. The coefficient of
determination, R2, was .026, therefore, 2.6% of “Inspire a Shared Vision” responses could be
explained by the predictor variables, percentage undergraduate minority enrollment,
undergraduate enrollment, campus setting, and institutional affiliation. ANOVA results showed
the F value as not significant (F = .950, p = .437). ANOVA results are displayed in Table 4.22.
The predictor variables of percentage minority undergraduate enrollment (t = -.280, p = .780),
campus setting (t = .725, p = .470), and institutional affiliation (t = .537, p = .592) were not
significant (Table 4.23). The predictor variable of undergraduate enrollment (t = 1.902, p = .059)
approached significance as a predictor of president responses to the LPI descriptor, “Inspire a
Shared Vision”. Overall, the null hypothesis was accepted.
Table 4.22
ANOVAb: Inspire a Shared Vision
Model Sum of Squares df Mean Square F Sig.
1 Regression 139.243 4 34.811 .950 .437a
Residual 5167.881 141 36.652
Total 5307.123 145
a. Predictors: (Constant), Institution Affiliation, Total Undergraduate Enrollment, Percent Minority Enrollment UG, Campus Setting
b. Dependent Variable: Inspire a Shared Vision

147
Table 4.23
Coefficientsa: Percentage Undergraduate Minority Enrollment, Undergraduate Enrollment, Campus Setting, and Institutional Affiliation
Model
Unstandardized Coefficients Standardized Coefficients
t Sig. B Std. Error Beta
1 (Constant) 48.227 1.336 36.110 .000
Percent Minority Enrollment UG
-.008 .028 -.025 -.280 .780
Total Undergraduate Enrollment
.001 .000 .165 1.902 .059
Campus Setting .856 1.182 .065 .725 .470
Institution Affiliation .586 1.091 .047 .537 .592
a. Dependent Variable: Inspire a Shared Vision
Null Hypothesis 38: The variables of percentage undergraduate minority enrollment,
undergraduate enrollment, campus setting, and institutional affiliation do not significantly
predict president responses to the LPI descriptor, “Challenge the Process”.
Multiple regression analysis was performed to test if institutional characteristics
significantly predicted president responses to “Challenge the Process”. The coefficient of
determination, R2, was .035, therefore, 3.5% of “Inspire a Shared Vision” responses could be
explained by the predictor variables, percentage undergraduate minority enrollment,
undergraduate enrollment, campus setting, and institutional affiliation. ANOVA results showed
the F value as not significant (F = 1.291, p = .276). ANOVA results are presented in Table 4.24.
The predictor variables of percentage minority undergraduate enrollment (t = -.731, p = .466),

148
campus setting (t = 1.392, p = .166), and institutional affiliation (t = .166, p = .868) were not
significant (Table 4.25). The predictor variable of undergraduate enrollment (t = 2.003, p = .047)
was a significant predictor of president responses to the LPI descriptor, “Challenge the Process.”
Overall, the null hypothesis was accepted.
Table 4.24
ANOVAb: Challenge the Process
Model Sum of Squares df Mean Square F Sig.
1 Regression 181.054 4 45.264 1.291 .276a
Residual 4943.384 141 35.059
Total 5124.438 145
a. Predictors: (Constant), Institution Affiliation, Total Undergraduate Enrollment, Percent Minority Enrollment UG, Campus Setting
b. Dependent Variable: Challenge the Process

149
Table 4.25
Coefficientsa: Percentage Undergraduate Minority Enrollment, Undergraduate Enrollment, Campus Setting, and Institutional Affiliation
Model
Unstandardized Coefficients Standardized Coefficients
t Sig. B Std. Error Beta
1 (Constant) 46.299 1.306 35.445 .000
Percent Minority Enrollment UG
-.020 .027 -.065 -.731 .466
Total Undergraduate Enrollment
.001 .000 .173 2.003 .047
Campus Setting 1.609 1.156 .125 1.392 .166
Institution Affiliation .177 1.068 .014 .166 .868
a. Dependent Variable: Challenge the Process
Null Hypothesis 39: The variables of percentage undergraduate minority enrollment,
undergraduate enrollment, campus setting, and institutional affiliation do not significantly
predict president responses to the LPI descriptor, “Enable Others to Act”.
Multiple regression analysis was performed to test if institutional characteristics
significantly predicted president responses to “Enable Others to Act”. The coefficient of
determination, R2, was .020, therefore, 2.0% of “Enable Others to Act” responses could be
explained by the predictor variables, percentage undergraduate minority enrollment,
undergraduate enrollment, campus setting, and institutional affiliation. ANOVA results showed
the F value as not significant (F = .733, p = .571). ANOVA results are presented in Table 4.26.
The predictor variables of percentage minority undergraduate enrollment (t = -.264, p = .792),

150
undergraduate enrollment (t = 1.506, p = .134), campus setting (t = -.281, p = .779), and
institutional affiliation (t = -.403, p = .687) were not significant (Table 4.27). Therefore, the null
hypothesis was accepted.
Table 4.26
ANOVAb: Enable Others to Act
Model Sum of Squares df Mean Square F Sig.
1 Regression 52.832 4 13.208 .733 .571a
Residual 2540.209 141 18.016
Total 2593.041 145
a. Predictors: (Constant), Institution Affiliation, Total Undergraduate Enrollment, Percent Minority Enrollment UG, Campus Setting
b. Dependent Variable: Enable Others to Act

151
Table 4.27
Coefficientsa: Percentage Undergraduate Minority Enrollment, Undergraduate Enrollment, Campus Setting, and Institutional Affiliation
Model
Unstandardized Coefficients Standardized Coefficients
t Sig. B Std. Error Beta
1 (Constant) 51.064 .936 54.535 .000
Percent Minority Enrollment UG
-.005 .020 -.024 -.264 .792
Total Undergraduate Enrollment
.000 .000 .131 1.506 .134
Campus Setting -.233 .828 -.025 -.281 .779
Institution Affiliation -.309 .765 -.035 -.403 .687
a. Dependent Variable: Enable Others to Act
Null Hypothesis 40: The variables of percentage undergraduate minority enrollment,
undergraduate enrollment, campus setting, and institutional affiliation do not significantly
predict president responses to the LPI descriptor, “Encourage the Heart”.
Multiple regression analysis was performed to test if institutional characteristics
significantly predicted president responses to “Encourage the Heart”. The coefficient of
determination, R2, was .004, therefore, less than one percent of “Encourage the Heart” responses
could be explained by the predictor variables, percentage undergraduate minority enrollment,
undergraduate enrollment, campus setting, and institutional affiliation. ANOVA results showed
the F value as not significant (F = .153, p = .961). ANOVA results are presented in Table 4.28.
The predictor variables of percentage minority undergraduate enrollment (t = -.332, p = .740),

152
undergraduate enrollment (t = 553, p = .581), campus setting (t = -.047, p = .963), and
institutional affiliation (t = .440, p = .660) were not significant (Table 4.29). Therefore, the null
hypothesis was accepted.
Table 4.28
ANOVAb: Encourage the Heart
Model Sum of Squares df Mean Square F Sig.
1 Regression 25.705 4 6.426 .153 .961a
Residual 5919.014 141 41.979
Total 5944.719 145
a. Predictors: (Constant), Institution Affiliation, Total Undergraduate Enrollment, Percent Minority Enrollment UG, Campus Setting
b. Dependent Variable: Encourage the Heart

153
Table 4.29
Coefficientsa: Percentage Undergraduate Minority Enrollment, Undergraduate Enrollment, Campus Setting, and Institutional Affiliation
Model
Unstandardized Coefficients Standardized Coefficients
t Sig. B Std. Error Beta
1 (Constant) 48.428 1.429 33.882 .000
Percent Minority Enrollment UG
-.010 .030 -.030 -.332 .740
Total Undergraduate Enrollment
.000 .000 .049 .553 .581
Campus Setting -.060 1.265 -.004 -.047 .963
Institution Affiliation .514 1.168 .039 .440 .660
a. Dependent Variable: Encourage the Heart
Summary
Chapter 4 presented the findings of this research study through seven research questions
and 40 hypotheses. The first research question was descriptive in nature and so, did not have any
corresponding hypotheses. The second research question looked for differences in responses to
the LPI descriptors based on president gender. The third and fourth research questions examined
the relationship between responses to the LPI descriptors and president years in current position,
as well as between the LPI descriptors and institutional variables related to undergraduate
enrollment. The fifth research question looked for differences in responses to the LPI descriptors
and campus setting and institutional affiliation. The sixth and seventh research questions

154
examined the relationship between responses to the LPI descriptors and multiple predictor
variables.
The first research question revealed that Title III and Title V-eligible presidents reported
high levels of engagement in transformational leadership practices, as measured by Kouzes and
Posner’s Leadership Practices Inventory (LPI). Among the five LPI descriptor responses, the
146-sample president responses from the highest average to the lowest were: “Enable Others to
Act” (51.27), “Model the Way” (49.77), “Inspire a Shared Vision” (49.75), “Encourage the
Heart” (48.83), and “Challenge the Process” (47.52). The national 3,252-sample Executive
Management responses (Posner, 2009) followed the same order for the two highest averages, but
differed in the next three. Overall, the average president response for each LPI descriptor was
higher than that of the corresponding national sample executive management response. Finally,
the variance for president responses to each LPI descriptor was smaller than that for national
sample executive management responses.
The second research question had five corresponding hypotheses in which responses to
each LPI descriptor were studied for differences between male and female presidents. The
independent t-test was performed to determine whether or not to accept each null hypothesis.
There was no significant difference between male and female president scores. The difference
between the mean LPI descriptor scores of male and female presidents was either less than one
point or just more than one point.
The third research question had five corresponding hypotheses and the fourth research
question had 10 corresponding hypotheses for which Pearson Product Moment Correlation
Coefficients were calculated to determine if a significant relationship existed between any of the
president responses and individual or institutional variables. The relationships between president

155
responses to LPI descriptors, “ Model the Way ”, “ Inspire a Shared Vision”, and “ Challenge the
Process”, and undergraduate enrollment approached significance. None of the other variables
approached significance and the null hypotheses were all accepted.
The fifth research question had 10 corresponding hypotheses in which responses to each
LPI descriptor were studied for differences between urban and non-urban settings and religious
or no affiliation institutions. The independent t-test was performed to determine whether or not
to accept each null hypothesis. There was no significant difference between the institutional
variables. The mean president scores of institutions in urban and non-urban settings were very
close, as were the president scores of institutions with religious or no affiliation.
Multiple regressions, were conducted for the sixth and seventh research questions, with
10 associated hypotheses, in order to determine if the combination of president characteristics
and institutional characteristics significantly predict president responses. The predictor variable
of undergraduate enrollment approached significance for “Model the Way ” and “ Inspire a
Shared Vision”. Undergraduate enrollment was the only predictor variable that was significant
with regards to predicting president responses to the LPI descriptor, “Challenge the Process”; it
was a positive relationship. All other predictor variables were not significant and the null
hypotheses were all accepted.

156
Chapter 5
Summary, Conclusions, and Recommendations
This research study investigated the transformational leadership practices of college and
university presidents of private, four-year Title III and Title V-eligible institutions. The purpose
of this chapter was to present a summary based on the analysis of data presented in Chapter 4,
draw conclusions, and make recommendations for further research. This chapter included the
summary, conclusions, and recommendations for future research.
Summary
This research sought to answer seven research questions and 40 corresponding
hypotheses:
Research Question 1: What is the distribution of president responses to leadership
practices, as measured by the Leadership Practices Inventory-Self? (No corresponding
hypothesis)
Research Question 2: Is there a significant difference between president responses to
leadership practices related to the demographic variable of gender, as measured by the
Leadership Practices Inventory-Self?
1. There is no significant difference between male and female president responses to the
LPI descriptor, “Model the Way”.
2. There is no significant difference between male and female president responses to the
LPI descriptor, “Inspire a Shared Vision”.
3. There is no significant difference between male and female president responses to the
LPI descriptor, “Challenge the Process”.

157
4. There is no significant difference between male and female president responses to the
LPI descriptor, “Enable Others to Act”.
5. There is no significant difference between male and female president responses to the
LPI descriptor, “Encourage the Heart”.
Research Question 3: Is there a significant relationship between president responses to
leadership practices related to the demographic variable of number of years in current position,
as measured by the Leadership Practices Inventory-Self?
6. There is no significant relationship between president responses to the LPI descriptor,
“Model the Way”, and president number of years in current position.
7. There is no significant relationship between president responses to the LPI descriptor,
“Inspire a Shared Vision”, and president number of years in current position.
8. There is no significant relationship between president responses to the LPI descriptor,
“Challenge the Process”, and president number of years in current position.
9. There is no significant relationship between president responses to the LPI descriptor,
“Enable Others to Act”, and president number of years in current position.
10. There is no significant relationship between president responses to the LPI descriptor,
“Encourage the Heart”, and president number of years in current position.
Research Question 4: Is there a significant relationship between president responses to
leadership practices related to the institutional variables of percentage undergraduate minority
students and undergraduate enrollment, as measured by the Leadership Practices Inventory-Self?
11. There is no significant relationship between president responses to the LPI descriptor,
“Model the Way”, and percentage undergraduate minority students.

158
12. There is no significant relationship between president responses to the LPI descriptor,
“Inspire a Shared Vision”, and percentage undergraduate minority students.
13. There was no significant relationship between president responses to the LPI
descriptor, “Challenge the Process”, and percentage undergraduate minority students.
14. There is no significant relationship between president responses to the LPI descriptor,
“Enable Others to Act”, and percentage undergraduate minority students.
15. There is no significant relationship between president responses to the LPI descriptor,
“Encourage the Heart”, and percentage undergraduate minority students.
16. There is no significant relationship between president responses to the LPI descriptor,
“Model the Way”, and undergraduate enrollment.
17. There is no significant relationship between president responses to the LPI descriptor,
“Inspire a Shared Vision”, and undergraduate enrollment.
18. There is no significant relationship between president responses to the LPI descriptor,
“Challenge the Process”, and undergraduate enrollment.
19. There is no significant relationship between president responses to the LPI descriptor,
“Enable Others to Act”, and undergraduate enrollment.
20. There is no significant relationship between president responses to the LPI descriptor,
“Encourage the Heart”, and undergraduate enrollment.
Research Question 5: Is there a significant difference between president responses to
leadership practices related to the institutional variables of campus setting and institutional
affiliation, as measured by the Leadership Practices Inventory-Self?
21. There is no significant difference between urban and non-urban campus setting
president responses to the LPI descriptor, “Model the Way”.

159
22. There is no significant difference between urban and non-urban campus setting
president responses to the LPI descriptor, “Inspire a Shared Vision”.
23. There is no significant difference between urban and non-urban campus setting
president responses to the LPI descriptor, “Challenge the Process”.
24. There is no significant difference between urban and non-urban campus setting
president responses to the LPI descriptor, “Enable Others to Act”.
25. There is no significant difference between urban and non-urban campus setting
president responses to the LPI descriptor, “Encourage the Heart”.
26. There is no significant difference between religious and no institutional affiliation
president responses to the LPI descriptor, “Model the Way”.
27. There is no significant difference between religious and no institutional affiliation
president responses to the LPI descriptor, “Inspire a Shared Vision”.
28. There is no significant difference between religious and no institutional affiliation
president responses to the LPI descriptor, “Challenge the Process”.
29. There is no significant difference between religious and no institutional affiliation
president responses to the LPI descriptor, “Enable Others to Act”.
30. There is no significant difference between religious and no institutional affiliation
president responses to the LPI descriptor, “Encourage the Heart”.
Research Question 6: Do the variables of president gender and president number of years
in current position significantly predict president responses to leadership practices, as measured
by the Leadership Practices Inventory-Self?
31. The variables of president gender and number of years in current position do not
significantly predict president responses to the LPI descriptor, “Model the Way”.

160
32. The variables of president gender and number of years in current position do not
significantly predict president responses to the LPI descriptor, “Inspire a Shared
Vision”.
33. The variables of president gender and number of years in current position do not
significantly predict president responses to the LPI descriptor, “Challenge the
Process”.
34. The variables of president gender and number of years in current position do not
significantly predict president responses to the LPI descriptor, “Enable Others to
Act”.
35. The variables of president gender and number of years in current position do not
significantly predict president responses to the LPI descriptor, “Encourage the Heart”.
Research Question 7: Do the variables of percentage undergraduate minority enrollment,
undergraduate enrollment, campus setting, and institutional affiliation significantly predict
president responses to leadership practices, as measured by the Leadership Practices Inventory-
Self?
36. The variables of percentage undergraduate minority enrollment, undergraduate
enrollment, campus setting, and institutional affiliation do not significantly predict
president responses to the LPI descriptor, “Model the Way”.
37. The variables of percentage undergraduate minority enrollment, undergraduate
enrollment, campus setting, and institutional affiliation do not significantly predict
president responses to the LPI descriptor, “Inspire a Shared Vision”.

161
38. The variables of percentage undergraduate minority enrollment, undergraduate
enrollment, campus setting, and institutional affiliation do not significantly predict
president responses to the LPI descriptor, “Challenge the Process”.
39. The variables of percentage undergraduate minority enrollment, undergraduate
enrollment, campus setting, and institutional affiliation do not significantly predict
president responses to the LPI descriptor, “Enable Others to Act”.
40. The variables of percentage undergraduate minority enrollment, undergraduate
enrollment, campus setting, and institutional affiliation do not significantly predict
president responses to the LPI descriptor, “Encourage the Heart”.
The survey research method was used for this study. Respondents completed the
Leadership Practices Inventory-Self (Appendix B) and a demographic survey (Appendix C).
Data analysis used descriptive statistics for Research Question 1, the independent t-test for
Research Questions 2 and 5, the Pearson Product Moment Correlation Coefficient for Research
Questions 3 and 4, and multiple regression, including coefficient of determination, for Research
Questions 6 and 7.
The universe of this study included all Title III and Title V-eligible college and university
presidents (Appendix A). The population and invited sample (N = 219) was comprised of the
presidents of private, four-year institutions in the 50 states and the District of Columbia that had
established Title III and Title V eligibility for 2007. All 219 members of the invited sample were
contacted. Of those contacted, 155 college and university presidents responded; six declined
participation and three responses were incomplete. The data-generating sample was made up of
110 male and 36 female respondents. Data was analyzed using the Statistical Package for the
Social Sciences (SPSS) Student Version 16.0.
162
The average LPI descriptor responses of the presidents of private Title III and Title V-
eligible colleges and universities were higher than those of the national sample of Executive
Management responses reported by Posner (2009). Among the five descriptors, presidents
reported the most frequent practice of the leader behavior, “Enable Others to Act”, followed by
“Model the Way”. According to Posner (2009), Executive Management responses reported the
same top two most frequent practices.
Leader behaviors were analyzed for variation in responses with regards to president
demographic variables and demographic variables of their institutions. The relationship between
the variable of institutional undergraduate enrollment and president LPI descriptor responses
were found to approach significance for “Model the Way” (p = .065), “Inspire a Shared Vision”
(p = .078), and “Challenge the Process” (p = .079). Multiple regression of institutional variables
revealed that undergraduate enrollment approached significance as a predictor of president
responses to “Model the Way” (p = .082) and “Inspire a Shared Vision” (p = .059). The variable
of undergraduate enrollment was determined to be a positive significant predictor (p = .047) for
president responses to “Challenge the Process” in a multiple regression analysis of institutional
characteristics. Other variables did not demonstrate significance with the LPI descriptors.
Conclusions
Education leadership theorists included in Chapter 2, Review of Literature, were mixed in
their views of the effectiveness of the practice of transformational leadership by executive
managers in the educational enterprise. Birnbaum (1992) considered a practice of both
transactional and transformational leader behaviors to be more likely representative of most
college and university presidents. According to Birnbaum (1992), the singular practice of
transformational leadership would be an “anomaly”. Bensimon (1987) favored the combination
163
of transactional and transformational leadership, which was termed “trans-vigorational”. The
nine leadership tasks of school principals, whose charge was to create a Gemeinschaft or sacred
community, as presented by Sergiovanni (1996), resembled Kouzes and Posner’s (2007) five
leader behaviors. The white male dominance of president leadership in higher education, as
criticized by Kezar (1996), was evident in this study’s data-generating sample of Title III and
Title V-eligible presidents, but their self-reported leadership practices did not meet Kezar’s
assumption of a deeply engrained top-down, hierarchical, in-charge, and authoritarian leadership
style. Later, Kezar et. al. (2006) recognized transformational leadership as aligned to some
degree with contemporary leadership in higher education.
Kouzes and Posner’s (2007) leadership characteristic, “Enable Others to Act”, was
ranked highest among the five LPI descriptors for the presidents of four-year, private Title III
and Title V-eligible institutions. This finding may reflect the nature of shared governance in
higher education and may have identified a characteristic of president leadership that is more
successful within this structure. Kouzes and Posner (2007) established that “leadership best”
included the realization and acceptance on the part of the leader that “you can’t do it alone”. The
leader practice of “Enable Others to Act” is expressed through trust, team collaboration, and
empowerment (Kouzes & Posner, 2007). The workings of a college and university, under a
“dualism of controls” between the centralized administration and decentralized academic
decision-making base (Birnbaum, 1988), then, may respond more favorably to leader practices of
shared and distributed leadership practices employed by the college and university president.
Undergraduate enrollment was the only variable in the study that demonstrated
significance with regards to the LPI descriptor scores of the data-generating sample. The
relationship between enrollment and president responses to three of the five LPI descriptors

164
approached significance; “Enable Others to Act” and “Encourage the Heart” remained not
significant. Undergraduate enrollment approached significance as a predictor variable in a
multiple regression of institutional characteristics with “Model the Way” and “Inspire a Shared
Vision”, and was a significant predictor for the leader behavior, “Challenge the Process”. These
relationships were all positively correlated.
In Chapter 2, enrollment was discussed as one of the factors related to institutional
survival, viability and success. Astin and Lee’s (1972) study of “invisible colleges” focused on
institutions with enrollments below 2,500 because, according to the authors, these smaller
institutions were more at risk for survival. Threatened loss of viability was linked to declining
enrollments (Eaker, 2008; Logue, 2003). Further, Eaker (2008) related increased enrollments to
greater selectivity, another factor associated with institutional viability. Ultimately, smaller
institutions were vulnerable to the effects of short-term enrollment fluctuations since they did not
benefit from “economies of scale”. Neumann and Bensimon (1990) included the factor of
financial difficulty or crisis among the few related to the role and type of presidential leadership
in higher education. Though not related to enrollment per se, the presidents of institutions in
recent or current financial crisis were apt to “circle the wagons” through centralized decision-
making; they were reactionary and highly bureaucratic, behaviors that were not consistent with
transformational leadership (Neumann & Bensimon, 1990).
In an analysis of leadership practices by size of organization (employee numbers) Posner
(2009) also found, through ANOVA analysis, that responses to the LPI descriptors were
statistically different, depending on the size of the organization (small, medium, large, very
large). (The ANOVA data were not presented.) There may be trends in these results. However,
though statistically significant, they did not appear to be practically significant since there was

165
only one point or less difference between descriptor means for the different sized organizations.
Further, caution is urged in comparing Posner’s (2009) results to this study’s LPI results since
this study’s organizational size was determined by student enrollment, not number of employees.
The following conclusions were drawn from the data collected and reported in Chapter 4,
within the limitations of the study:
1. Presidents of private, four-year Title III and Title V-eligible colleges and universities
reported levels of engagement in transformational leader behaviors that were higher
than a national average of executive managers, as measured by the Leadership
Practices Inventory (LPI).
2. The presidents’ strongest transformational leader behavior was reported as “Enable
Others to Act”, followed by “Model the Way”, “Inspire a Shared Vision”, Encourage
the Heart”, and “Challenge the Process”.
3. There was no significant difference between president responses to leadership
practices, as measured by the LPI, and the demographic variable of leader gender,
institutional variable of campus setting, and institutional variable of affiliation.
4. There was no significant relationship between president responses to leadership
practices as measured by the LPI and leader number of years in current position and
percentage undergraduate minority students.
5. The relationship between president responses to leadership practices, as measured by
the LPI, and undergraduate enrollment approached significance for the leader
behaviors “Model the Way”, “Inspire a Shared Vision”, and “Challenge the Process”.
6. The predictor variable of undergraduate enrollment approached significance for
president leader behaviors, “Model the Way” and “Inspire a Shared Vision”.

166
7. The variable of undergraduate enrollment was a significant positive predictor of the
president leader behavior, “Challenge the Process”.
By nature, an institution that established Title III and Title V eligibility was labeled as
“developing”, which was related to degree of vitality (Hodgkinson & Schenkel, 1974). The
definition of a “developing institution” and eligibility factors were hotly debated from the time
when Title III was established under the Higher Education Act of 1965 to as recently as 1998,
when Title V was established as a distinct program under the umbrella of Developing Institutions
programming. There is a paucity of studies on this distinct group of institutions and their status,
challenges and successes would add considerably to the body of literature for higher education.
The presidents of the private, four-year Title III and Title V-eligible institutions who participated
in this study have provided a new insight into the high levels of transformational leader
behaviors practiced by the leaders of institutions whose student financial needs are greater and
whose institutional financial resources are limited.
Recommendations for Future Research
This study initiated research on leadership characteristics of the unique group of private,
four-year Title III and Title V-eligible college and university presidents for institutions located in
the United States and District of Columbia. As such, this research represents the beginning of
possibilities for considerable future research in the area of higher education leadership and Title
III and Title V-eligible institutions. The following recommendations are made for future study:
1. A follow-up study should be conducted of the same sample (in a few years) to
determine the scope of change, if any, for the strength and ranking of these president
leader behaviors as reported in this study.

167
2. A study and comparison of president leader behaviors for all Title III and Title V-
eligible institutions, public and private, two-year and four year, should be conducted.
3. A study and comparison of president leader behaviors for eligible and non-eligible
institutions should be conducted in order to identify similarities and differences.
4. A study and comparison of the self-reported leader behaviors of college and
university presidents and those reported by their subordinates should be conducted.
5. A study and comparison should be conducted on president leader behaviors and other
important institutional variables such as retention and graduation rates.
6. A study and comparison should be conducted on president leader behaviors and five-
year change in undergraduate enrollment to further examine the relationship.
7. Title III and Title V-eligible institutions should be studied further to identify predictor
variables of institutional viability (such as per-student endowment, tuition, and fees
for public and private two-year and four-year institutions, as identified in the 2009
U.S. GAO Report).
8. Additional studies on Title III and Title V-eligible institutions should be conducted to
look for patterns of institutional characteristics in addition to the eligibility factors
that could distinguish these institutions for other U.S. Department of Education
programming (e.g. number and types of degree programs, faculty-student ratios, and
number and percentage of departmental full-time and adjunct faculty in relation to
specific program enrollment).
Summary
This study focused on the transformational leadership characteristics of private, four-year
Title III and V-eligible colleges and university presidents located in the United States and

168
District of Columbia. The study was comprised of five chapters. Chapter 1 presented the
introduction, statement of the problem, research questions, definition of terms, significance of
the study, limitations of the study, and its organization. Chapter 2 presented a review of
literature, as that review was reflective of leader behavior literature, a brief history and
introduction to the U.S. Department of Education’s Title III and Title V programs, Title III
institutions literature, Title V institutions literature, and associated literature. Chapter 3 presented
the research methodology of the subjects, materials, and procedures, which included the data
gathering plan and data analysis plan. Chapter 4 presented the data gathered through the LPI
survey, a demographic survey, institutional information available through the U.S. Department
of Education website, and an analysis of the findings. Chapter 5 presented a summary,
conclusions, and recommendations for future research.
This study should hold significance for: the governing boards, presidents and senior
administrators of four-year, private Title III and Title V-eligible institutions, for the U.S.
Department of Education’s Office of Postsecondary Education, which houses the Title III and
Title V program offices, as well as associations that serve private colleges and universities,
including the Association of Governing Boards of Universities and Colleges, the Council of
Independent Colleges, and the National Association of Independent Colleges and Universities.
169
References
Adair, J. (2006). Leadership and motivation. Philadelphia: Kogan Page Limited.
Alon, S., & Tienda, M. (2005). Assessing the “mismatch” hypothesis: Differences in college
graduation rates by institutional selectivity. Sociology of Education, 78(4), 294-315.
American Council on Education. (2007). The American college president. (2007 ed.).
Washington, D.C.: Author.
Association of Governing Boards of Universities and Colleges. (2006). The leadership
imperative. Washington, D.C.: Author.
Argyris, C. (1955). Organizational leadership and participative management, The Journal of
Business, 28(1), 1-7.
Argyris, C. (1957). Personality and Organization. New York: Harper & Brothers.
Argyris, C. (1971). Management and Organizational Development. New York: McGraw-Hill
Book Company.
Argyris, C. (1973). Personality and organization theory revisited. Administrative Science
Quarterly, 18(2), 141-167. Retrieved from http://www.jstor.org/stable/2392060
Astin, A. W., & Lee, C. B. T. (1972). The invisible colleges. San Francisco: McGraw-Hill Book
Company.
Balderston, F. E. (1995). Managing today’s university: Strategies for viability, change, and
excellence (2nd edition). San Francisco: Jossey-Bass Publishers.
Bass, B. (1985). Leadership and performance beyond expectations. New York, The Free Press.
Bass, B. (2008). The Bass handbook on leadership, 4th edition. New York: Free Press.
Bass, B. M., & Riggio, R. E. (2006). Transformational leadership (2nd ed.). Mahwah, NJ:
Lawrence Erlbaum Associations, Publishers.
170
Bates, L. & Santerre, R. E. (2000). A time series analysis of private college closures and mergers
[Electronic version]. Review of Industrial Organization, 17(3), 267-276.
Behling, O. & Starke, F. A. (1973). The postulates of expectancy theory. The Academy of
Management Journal, 16(3), 373-388. doi: 10.2307/254999
Bensimon, E. M. (November 1987). The meaning of “good presidential leadership”: A frame
analysis. Paper presented at the Annual Meeting of the Association for the Study of
Higher Education, Baltimore, MD. Retrieved from ERIC database. (ED292416)
Bensimon, E. M. (April 1989). Transactional, transformation and “trans-vigorational” leaders.
Leadership Abstracts, 2(6). Retrieved from ERIC database. (ED331573)
Bensimon, E. M., Neumann, A., & Birnbaum, R. (1989). Making sense of administrative
leadership: The “L” word in higher education. ASHE-ERIC Higher Education Report
No. 1. Washington, D.C.: School of Education and Human Development, The George
Washington University.
Birnbaum, R. (November 1987). The implicit theories of college and university presidents.
Presented at the National Meeting of the Association for the Study of Higher Education,
Baltimore, MD. Retrieved from ERIC database. (ED292408)
Birnbaum, R. (1988a). How colleges work. San Francisco: Jossey-Bass Publishers.
Birnbaum, R. (1988b). Presidential searches and the discovery of organizational goals. The
Journal of Higher Education, 59(5), 489-509.
Birnbaum, R. (1989). Presidential succession and institutional functioning in higher education.
The Journal of Higher Education, 60(2), 123-135.
Birnbaum, R. (1992). How academic leadership works. San Francisco: Jossey-Bass Publishers.

171
Blake, R. R. & Mouton, J. S. (1982). How to choose a leadership style. Training and
Development Journal, 36(2), 38-47.
Blake, R. R. & Mouton, J. S. (1985). The managerial grid® III. Houston, TX: Gulf Publishing
Company Book Division.
Boone, M. (1992, March). Lyndon Baines Johnson and the presidential election campaign of
1964: A case study of presidential leadership for education. Paper presented at the annual
conference of the Southern History of Education Society, Marietta, GA. (ERIC
Document Reproduction Service No.ED370877)
Boren, S., Irwin, P., Lyke, B., Riddle, W., Stedman, J., Frass, C., Jordan, K. J., & Gregory, W.
(1987). The higher education amendments of 1986 (P.L. 99-498): A summary of
provisions. Library of Congress, Washington, D.C., Congressional Research Service.
Retrieved from ERIC database. (ED294485)
Burns, J. M. (1978). Leadership. New York, NY: Harper & Row, Publishers.
Carey, A. (1967). The Hawthorne studies: A radical criticism. American Sociological Review,
32(3), 403-416. Retrieved from http://www.jstor.org/stable/2091087
Carless, S. A., Wearing, A. J., & Mann, L. (2000). A short measure of transformational
leadership. Journal of Business and Psychology, 14(3), 389-405. doi:
10.1023/A:1022991115523
Carnegie Commission on Higher Education. (1982). The control of the campus: A report on the
governance of higher education. Washington, D.C.: Carnegie Foundation for the
Advancement of Teaching.
Chemers, M. M. (2000). Leadership research and theory: A functional integration. Group
Dynamics: Theory, Research, and Practice, 4(1), 27-43.

172
Conger, J. A. (1999). Charismatic and transformational leadership in organizations: An insider’s
perspective on these developing streams of research. Leadership Quarterly, 10(2), 145-
179. doi: 10.1016/S1048-9843(99)00012-0
Cowan, R. (1993, January). Prescription for small-college turnaround. Change, 25(1), 30.
Crant, J. M. (2000). Proactive behavior in organizations. Journal of Management, 26(3), 435-
362. doi: 10.1177/014920630002600304
Davis, J. A. , Ironside, R. A., & VanSant, J. (1983). The anatomy of institutional development for
higher education institutions serving students from low-income backgrounds.
Washington, DC: U.S. Department of Education, Office of Planning, Budget and
Evaluation, Planning Evaluation Service, Student Institutional Aid Division. Retrieved
from ERIC database. (ED238321)
Developing Hispanic-Serving Institutions Program. 66 Fed. Reg. 1262 (2001) (to be codified at
34 C.F.R. pt. 606)
Developing Hispanic-serving Institutions Program, 34 C.F.R. § 306.2 (2005).
Dye, K., Mills, A. J., & Weatherbee, T. (2005). Maslow: Man interrupted: Reading management
theory in context. Management Decision, 43(10), 1375-1395. doi:
10.1108/00251740510634921
Eaker, R. L. (2008). Small private college revitalization: A meta-study of successful college
turnaround (Doctoral dissertation). Retrieved from ProQuest Dissertations and Theses
database (UMI No. 3346498)
Fiedler, F. E. (1997). Situational control and leadership. In K. Grint (Ed.), Leadership (pp. 126-
148). Oxford: Oxford University Press.

173
Fleishman, E. A. (1957). A leader behavior description for industry. In R. Stogdill & A. Coons
(Eds.), Leadership behavior: Its description and measurement (pp. 6-38). Columbus,
OH: College of Administrative Science, The Ohio State University.
Fleishman, E. A. & Harris, E. F. (1998). Patterns of leadership behavior related to employee
grievances and turnover: Some post hoc reflections. Personnel Psychology, 51(4), 825-
834. doi: 10.1111/j.1744-6570.1998.tb00740.x
Francoeur, K. A. (2008). The relationship between the five-factor model of personality and
leadership preferences for initiating structure and consideration (Doctoral dissertation).
Retrieved from ProQuest Dissertation & Theses. (UMI No. 3315390)
Franks, T. M. (2003). The educational metamorphosis: How three small colleges transformed
themselves (Doctoral dissertation). Retrieved from ProQuest Dissertations and Theses
database. (UMI No. 3083859)
Frantilla, A. (1998). Social science in the public interest: A fiftieth-year history of the Institute
for Social Research. (Bulletin No. 45, September 1998). Retrieved from University of
Michigan Bentley Historical Library website:
http://bentley.umich.edu/research/publications/ISR.pdf.
Hall, C. S., Lindzey, G., & Campbell, J. B. (1998). Theories of personality, 4th edition. New
York, NY: John Wiley & Sons, Inc.
Halpin, A. W. (1957). Manual for the Leader Behavior Description Questionnaire. Retrieved
from http://fisher.osu.edu/supplements/10/2862/1957%20LPDQ%20MANUAL.pdf.
Halpin, A. W. & Winer, B. J. (1957). A factorial study of the leader behavior descriptions. In R.
Stogdill & A. Coons (Eds.), Leadership behavior: Its description and measurement (pp.
39-51). Columbus, OH: College of Administrative Science, The Ohio State University.

174
Hautala, T. M. (2006). The relationship between personality and transformational leadership.
Journal of Management Development, 25(8), 777-794. doi: 10.1108/02621710610684259
Heinrichs, H. R. T. (2002). A framework for determining institutional viability in the independent
colleges and universities of California (Doctoral dissertation). Retrieved from ProQuest
Dissertation and Theses database. (UMI No. 3063903)
Hemphill, J. K. & Coons, A. E. (1957). Development of the Leader Behavior Description
Questionnaire. In R. Stogdill & A. Coons (Eds.), Leadership behavior: Its description
and measurement (pp. 6-38). Columbus, OH: College of Administrative Science, The
Ohio State University.
Heneman, H. G., & Schwab, D. P. (1972). Evaluation of research on expectancy theory
predictions of employee performance. Psychological Bulletin, 78(1), 1-9.
Herber-Valdez, C. A. (2008). Understanding a Hispanic Serving Institution beyond the federal
definition: A qualitative analysis of Mexican American student perceptions and
experiences (Doctoral dissertation). Retrieved from ProQuest Dissertation and Theses
database. (UMI No. 3310675)
Hersey, P. & Blanchard, K. H. (1981). So you want to know your leadership style? Training and
Development Journal, 35(6), 34-54.
Hersey, P. & Blanchard, K. H. (1982a). Management of organizational behavior (4th edition).
Englewood Cliffs, NJ: Prentice-Hall, Inc.
Hersey, P. & Blanchard, K. H. (1982b). Leadership style: Attitudes and behaviors. Training and
Development Journal, 36(5), 50-52.
Hersey, P. & Blanchard, K. H. (1996). Great ideas revisited: Revising the life-cycle theory of
leadership. Training & Development 50(1), 42-47.

175
Hersey, P., Blanchard, K. H., & Natemeyer, W. E. (1979). Situational leadership, perception, and
the impact of power. Group & Organizational Studies, 4(4), 418-428.
Herzberg, F. (1967). How do you motivate employees? In W. Natemeyer & J. Gilberg (Eds.)
(1989), Classics of organizational behavior, 2nd edition (pp. 103-114). Danville, IL: The
Interstate Printers & Publishers, Inc.
Higher Education Act of 1965, Pub. L. No. 89-329, 79 Stat. 1219 (1965)
Hodgkinson, H. L., & Schenkel, W. (1974). A study of Title III of the Higher Education Act: The
Developing Institutions Program. Final Report. Washington, DC: Office of Education
(DHEW). Retrieved from ERIC database. (ED 088316)
Hoff, K. S. (October, 1999). Leaders and managers: Essential skills required within higher
education, Higher Education, 38 (3). Retrieved November 9, 2008 from
http://www.jstor.org/stable/3448056
Hofstede, G. (1980). Motivation, leadership, and organization: Do American theories apply
abroad? Organizational Dynamics, 9(1), 42-63.
Hood, S. (1984). Legislative intent, program implementation, and higher education policy: The
case of Title III of the 1965 Higher Education Act (Doctoral dissertation). Retrieved
from ProQuest Dissertation and Theses database. (UMI No. 8422081)
Horner, M. (1997). Leadership theory: past, present and future. Team Performance Management,
3(4), 270-287. doi: 10.1108/13527599710195402
Howard, L. C. (1967). The developing colleges program: A study of Title III of the Higher
Education Act of 1965. Milwaukee, WI: Institute of Human Relations, The University of
Wisconsin. Retrieved from ERIC database. (ED023341)

176
Hoxby, C. M. (1997). How the changing market structure of U.S. higher education explains
college tuition. Working Paper 6323. Cambridge, MA: National Bureau of Economic
Research. Retrieved from http://www.nber.org/papers/w6323
H.R. Rep. No. 102-630, 1992. Retrieved from ERIC database. (ED351985)
Huber, D. L., Maas, M., JcCloskey, J., Scherb, C. A., Goode, C. J., & Watson, C. (2000).
Evaluating nursing administration instruments. The Journal of Nursing Administration,
30 (5), 251-272.
Iannozzi, M. (2001). Tusculum College. Exemplars. Retrieved from ERIC database. (ED455721)
Isaac, R. G., Zerbe, W. J., & Pitt, D. C. (2001). Leadership and motivation: The effective
application of expectancy theory. Journal of Managerial Issues, 13(2), 212-226.
www.cs.unca.edu/~manns/MotivationExpectancyTheory.pdf
Jacobs, F., & Tingley, T. (1977). The evolution of eligibility criteria for Title III of the Higher
Education Act of 1965: Appendix A. The development of institutions of higher education:
Theory and assessment of impact of four possible areas of federal intervention.
Retrieved from ERIC database. (ED148242)
Jago, A. G. (1982). Leadership: Perspectives in theory and research. Management Science, 28(3),
315-336. Retrieved from http://www.jstor.org/stable/2630884
Judge, T. A., Piccolo, R. F., & Iles, R. (2004). The forgotten ones? The validity of consideration
and initiating structure in leadership research. Journal of Applied Psychology, 89(1), 36-
51. doi:10.1037/0021-9010.89.1.36
Kezar, A. J. (1996). Reconstructing exclusive images: An examination of higher education
leadership models (Doctoral dissertation). Retrieved from ProQuest Dissertations and
Theses database. (UMI No. 9635544)

177
Kezar, A. (2000). Pluralistic leadership: Incorporating diverse voices. The Journal of Higher
Education, 71(6), 722-743. Retrieved from http://www.jstor.org/stable/2649160
Kezar, A. & Eckel, P. (July-August, 2004). Meeting today’s governance challenges: A synthesis
of the literature and examination of a future agenda for scholarship. The Journal of
Higher Education, 75(4), 371-399. Retrieved from http://www.jstor.org/stable/383739
Kezar, A. J., Carducci, R., & Contreras-McGavin, M. (2006). Rethinking the “L” word in higher
education. Hoboken, NJ: Wiley Periodicals, Inc.
Kirkpatrick, S. A. & Locke, E. A. (1991). Leadership: do traits matter? The Executive, 5(2), 48-
60. Retrieved from
http://carmine.se.edu/cvonbergen/Leadership_Do%20Traits%20Matter.pdf
Kouzes, J. M., & Posner, B. Z. (2001). Leadership Practices Inventory [LPI] Revised second
edition online version participant’s workbook. San Francisco, CA: Jossey-Bass-Pfeiffer.
Kouzes, J. M., & Posner, B. Z. (2003). The Leadership Practices Inventory (LPI): Facitators
guide package, third edition. San Francisco, CA: John Wiley & Sons, Inc.
Kouzes, J. M., & Posner, B. Z. (2007). The leadership challenge (Fourth ed.). San Francisco:
Jossey-Bass.
Laden, B. V. (2001). Hispanic-Serving Institutions: Myths and realities. Peabody Journal of
Education, 76(1), 73-92.
Landy, F. J., & Trumbo, D. A. (1980). Psychology of work behavior (Rev. ed.) Homewood, IL:
The Dorsey Press.
Lawler, E. E. (1994). Motivation in work organizations. San Francisco: Jossey-Bass Publishers.
Lawless, D. J. (1972). Effective management: Social psychological approach. Engelwood Cliffs,
NJ: Prentice-Hall.

178
Leadership Practices Inventory Psychometric Properties (June 2000). Retrieved from
http://media.wiley.com/assets/56/95/1c_jb_psychometric_properti.pdf
Leong, F. T. L., & Lewis, M. A. (January 2010). Leadership Practices Inventory (Pfeiffer and
Company International Publishers). In Mental Measurements Yearbook. Lincoln, NE:
Buros Institute of Mental Measurements. Via online database.
Levine, M. (2000). The importance of leadership: an investigation of presidential style at fifty
national universities. Unpublished doctoral dissertation, University of North Texas,
Denton, TX.
Likert, R. (1967). The human organization: Its management and value. New York: McGraw-Hill
Book Company.
Likert, R. (1979). From production- and employee-centeredness to systems 1-4. Journal of
Management, 5(2), 147-156. doi: 10.1177/014920637900500205
Logue, J. W. (2003). An analysis of the survival ability of private colleges and universities in
Pennsylvania (Doctoral dissertation). Retrieved from ProQuest Dissertations and Theses
database. (UMI No. 3106281)
Lord, R. G., De Vader, C. L., & Alliger, G. M. (1986). A meta-analysis of the relation between
personality traits and leadership perceptions: An application of validity generalization
procedures. Journal of Applied Psychology, 71(3), 402-410. doi: 10.1037/0021-
9010.71.3.402
MacDonald, V.-M., Botti, J. M., & Clark, L. H. (2007). From visibility to autonomy: Latinos
and higher education in the U.S., 1965 – 2005. Harvard Educational Review, 77(4), 474-
504.

179
Marcy, M. B. (2004). Where diversity and dollars collide: Challenges for higher education.
Innovative Higher Education, 28(3), 205-218. doi:
10.1023/B:IEHIE.0000015108.11519.08
Marcy, M. B. (2008, May 2). Presidential power and the modern college leadership. Chronicle
of Higher Education, p. A36.
Maslow, A. H. (1943a). Preface to motivation theory. Psychosomatic Medicine, 5, 85-92.
Retrieved from http://www.psychosomaticmedicine.org/
Maslow, A. H. (1943b). A theory of human motivation. Psychological Review, 50(4), 370-396.
doi: 10.1037/h0054346
Maslow, A. H. (1962). Toward a psychology of being. Princeton, NJ: D. van Nostrand Company,
Inc.
Maslow, A. H. (1970). Motivation and personality (Second ed.). New York: Harper & Row,
Publishers, Inc.
McCants, J. (2003). The early history of the Higher Education Act of 1965. National TRIO
Clearinghouse, Washington, DC. Retrieved from
www.pellinstitute/clearninghousepublications.html
McGregor, D. M. (1989). The human side of enterprise. In W. Natemeyer & J. Gilberg (Eds.),
Classics of organizational behavior 2nd edition (pp. 14-20). Danville, IL: The Interstate
Printers & Publishers, Inc.
Mertens, D. M. (2010). Research and evaluation in education and psychology. Thousand Oaks,
CA: Sage Publications, Inc.

180
Miller, J. L., Gurin, G., & Clarke, M. J. (1970). Use and effectiveness of Title III in selected
“developing institutions”, Final Report. Washington, D.C.: National Center for
Educational Research and Development. Retrieved from ERIC database. (ED053450)
Montez, J. (April 2003). Developing an instrument to assess higher education leadership. Paper
presented at the Annual Meeting of the American Educational Research Association,
Chicago, IL. Retrieved from ERIC database. (ED477446)
Mulcahy, J. (2000). Administrative analytics: A workbook in the behavioral sciences for
educators and managers (3rd edition). Dubuque, IA: McGraw-Hill.
Mulcahy, J. (2009). Leadership analytics. Bloomington, IN: AuthorHouse.
Mulcahy, J. & Gregory, J. (2009). Handbook of statistics and quantitative analysis for
educational leadership. Lanham, MD: University Press of America.
Neumann, A. (1987, November). Strategic leadership: The changing orientations of college
presidents. Paper presented at the Annual Meeting of the Association for the Study of
Higher Education, Baltimore, MD. Retrieved from ERIC database. (ED292393)
Neumann, A., & Bensimon, E. M. (1990). Constructing the presidency: College presidents’
images of their leadership roles, a comparative study. The Journal of Higher Education,
61(6), 678-701.
Northouse, P. G. (2004). Leadership theory and practice (3rd edition). Thousand Oaks, CA: Sage
Publications, Inc.
O’Brien, E. M., & Zudak, C. (1998). Minority-Serving Institutions: An overview. New
Directions for Higher Education, 1998(102), 5-15. doi: 10.1002/he.10201
Office of Postsecondary Education; Strengthening Institutions, 74 Fed. Reg. 64059 (2009)
181
Ogu, E. (2006). Leadership styles of Dominican college presidents at four-year institutions of
higher learning (Doctoral dissertation). Retrieved from ProQuest Dissertation and
Theses database. (UMI No. 3226849)
Pavkov, T. W., and Pierce, K. A. (2007). Ready, set go! A student guide to SPSS® 13.0 and 14.0
for Windows ® (Second ed.). New York, NY: McGraw-Hill.
Podsakoff, P. M., MacKenzie, S. B., Moorman, R. H., & Fetter, R. (1990). Transformational
leader behaviors and their effects on followers’ trust in leader, satisfaction, and
organizational citizenship behaviors. Leadership Quarterly, 1(2), 107-142. doi:
10.1016/1048-9843(90)90009-7
Ponterotto, J. G. (2005). Qualitative research in counseling psychology: A primer on research
paradigms and philosophy of science. Journal of Counseling Psychology, 52(2), 126-
136.doi: 10.1037/70022-0167.42.2.126
Porter, L. W. & Lawler, E. E. (1968). Managerial attitudes and performance. Homewood, IL:
Richard D. Irwin, Inc., and The Dorsey Press.
Porter, S. R. & Ramirez, T. J. (2009.) Why do colleges fail? An analysis of college and university
closings and mergers, 1975-2005. Paper presented at the meeting of the American
Educational Research Association, San Diego, CA.
Posner, B. Z. (May 12, 2002). The Leadership Practices Inventory: Theory and evidence behind
the five practices of exemplary leaders. (May 12, 2002). Retrieved from
http://media.wiley.com/assets/61/06/lc_jb_appendix.pdf.
Posner, B. Z. (2009). Leadership Practices Inventory (LPI) data analysis. (August 2009).
Retrieved from http://media.wiley.com/assets/2034/63/LPIAnalysisAug.2009.pdf.

182
Posner, B. Z., & Kouzes, J. M. (1988). Development and validation of the Leadership Practices
Inventory. Educational and Psychological Measurement, 48(2), 483-496. doi:
10.1177/0013164488482024
Posner, B. Z., & Kouzes, J. M. (1990). Leadership practices: An alternative to the psychological
perspective. In K. E. Clark & M. B. Clark (Eds.), Measures of leadership (pp. 205-215).
West Orange, NJ: Leadership Library of America, Inc.
Posner, B. Z., Kouzes, J. M., & Schmidt, W. H. (1985). Shared values make a difference: An
empirical test of corporate culture. Human Resource Management 24(3) 293-309. doi:
10.1002/hrm.3930240305
Posner, B. Z. & Schmidt, W. H. (1993). Values congruence and differences between the
interplay of personal and organizational value systems. Journal of Business Ethics,
12(5), 341-347). doi: 10.1007/BF00882023
Putnam, R. (1995). A biography of Chris Argyris. The Journal of Applied Behavioral Science,
31(3), 253-255.
Ramsden, P. (1998). Learning to lead in higher education. New York, NY: Routledge.
Rendon, L. (1980). Historical and political dimensions of Title III—Strengthening Developing
Institutions of the Higher Education Act of 1965. Ann Arbor, MI: Michigan University
School of Education. Retrieved from ERIC database. (ED194139)
Rea, L. M., & Parker, R. A. (1997). Designing and conducting survey research (2nd edition). San
Francisco, CA: Jossey-Bass, A Wiley Imprint.
Roberts, P. (2005). Transformational leadership at urban and metropolitan public universities.
Unpublished doctoral dissertation, University of Akron, Akron, OH.

183
Roethlisberger, F. J. (1989). The Hawthorne experiments. In W. Natemeyer & J. Gilberg (Eds.),
Classics of organizational behavior 2nd edition (pp. 3-13). Danville, IL: The Interstate
Printers & Publishers, Inc.
Rost, J. C. (1993). Leadership for the twenty-first century. Westport, CT: Praeger Publishers.
Ramsden, P. (1998). Learning to lead in higher education. New York: Routledge.
Santiago, D. A., & Andrade, S. J. (2010). Emerging Hispanic-Serving Institutions (HSIs):
Serving Latino students. Washington, DC: Excelencia in Education.
Schweber, H. (2008, November 24). The next crisis: Higher education. The Huffington Post.
Retrieved from http://www.huffingtonpost.com
Sergiovanni, T. J. (1981). Symbolism in leadership (What great leaders know that ordinary ones
do not). Occasional Paper prepared for the Institute of Educational Administration,
Melbourne, Victoria. Retrieved from ERIC database. (EA015534)
Sergiovanni, T.J. (1986). Leadership as cultural expression. In T. J. Sergiovanni & J. E. Corbally
(Eds.), Leadership and organizational culture: New perspectives on administrative
theory and practice (pp. 105-114). Champaign, IL: University of Illinois Press.
Sergiovanni, T. J. (April 1993). Organizations or communities? Changing the metaphor changes
the theory. Presented at the Annual Meeting of the American Educational Research
Association, Atlanta, GA, April 1993. Retrieved from ERIC database. (ED376008).
Sergiovanni, T. J. (1996). Leadership for the schoolhouse: How is it different: Why is it
important? San Francisco, CA: Jossey-Bass Publishers.
Sergiovanni, T. J., Metzcus, R., & Burden, L. (January 1969). Toward a particularistic approach
to leadership style: Some findings. American Educational Research Journal, 6(1), 62-79.
Retrieved from http://www.jstor.org/stable/1162096

184
Shaffer, J. B. P. (1978). Humanistic psychology. Englewood Cliffs, NJ: Prentice-Hall, Inc.
Shartle, C. (1957). Introduction. In R. Stogdill & A. Coons (Eds.), Leadership behavior: Its
description and measurement (pp. 1-5). Columbus, OH: College of Administrative
Science, The Ohio State University.
Simons, T. (2002). The high cost of lost trust. Harvard Business Review, 80(9) 18-21. doi:
10.1225/F0209A
Skyers, A. (2006). Transformational leadership practices of New England community college
presidents (Doctoral dissertation). Retrieved from ProQuest Dissertation and Theses
database. (UMI No. 3243095)
Snyder, T. D., Dillow, S. A., & Hoffman, C. M. (2009). Digest of Education Statistics 2008.
Washington, D.C.: National Center for Educational Statistics.
Sprinthall, R. C. (2000). Basic Statistical Analysis (Sixth ed.). Boston, MA: Allyn and Bacon.
Steers, R. M., Mowday, R. T., & Shapiro, D. L. (2004). The future of work motivation theory.
Academy of Management Review, 29(3), 379-387.
Sterns, C., & Watanabe, S. (2002). Hispanic Serving Institutions: Statistical trends from 1990 to
1999. Washington, DC: National Center for Education Statistics. Retrieved from
http://nces.ed.gov/programs/quarterly/vol_4/4_4/q4_7.asp
St. John, E. P. (1981). Public policy and college management: Title III of the Higher Education
Act. New York, NY: Praeger.
Stogdill, R. M. (1963). Manual for the Leader Behavior Description Questionnaire – Form XII,
an experimental revision. Retrieved from
http://fisher.osu.edu/supplements/10/2862/1962%20LBDQ%20MANUAL.pdf.
185
Stogdill, R. M. (1997). Leadership, membership, organization. In K. Grint (Ed.), Leadership
(pp. 112-125). Oxford: Oxford University Press.
Stogdill, R. M. & Coons, A. E. (Eds.) (1957). Leader behavior: Its description and
measurement. Columbus, OH: College of Administrative Science, The Ohio State
University.
Strang, K.D. (2005). Examining effective and ineffective transformational project leadership.
Team Performance Management, 11(3/4), 68-103. doi: 10.1108/13527590510606299
Strengthening Institutions Program, C.F.R. § 307.2 (2005).
Strube, M. J. & Garcia, J.E. (1981). A meta-analytic investigation of Fiedler’s contingency
model of leadership effectiveness. Psychological Bulletin, 90(2), 307-321.
doi:10.1037/0033-2909.90.2.307
Tannenbaum, R. & Schmidt, W. H. (1958). How to choose a leadership pattern. Harvard
Business Review, 36, 95-101.
Tannenbaum, R. & Schmidt, W. H. (1973). How to choose a leadership pattern. In W.
Natemeyer & J. Gilberg (Eds.) (1989), Classics of organizational behavior, 2nd edition
(pp. 213-222). Danville, IL: The Interstate Printers & Publishers, Inc.
Tiffin, J. & McCormick, E. J. (1965). Industrial psychology (Fifth ed.). Englewood Cliffs, NJ:
Prentice-Hall, Inc.
Title III and Title V Eligible Institutions for the Cost-Share Waiver July 1, 2006 – June 30, 2011.
Retrieved from (www2.ed.gov/about/offices/list/ope/idues/t3t5elig-waivers2006.pdf )
Title III Part A and Title V Programs FY 2007 Eligible Institutions. Retrieved from
(ww2.ed.gov/about/offices/list/ope/idues/t3t5eligible2007.pdf)

186
U.S. Department of Education. (Fiscal Year 2009). Application Package to Request Designation
as an Eligible Institution under the Following Title III and Title V Programs. [Electronic
version] Retrieved February 27, 2009 from
www.ed.gov/about/offices/list/ope/idues/eligibility2009.pdf
U.S. Government Accountability Office. (August 2009). Low-income and Minority Serving
Institutions: Management attention to long-standing concerns needed to improve
education’s oversight of grant programs. GAO-09-309. Retrieved from ERIC database.
(ED506555)
Vroom, V. H. (1964). Work and motivation. New York, NY: John Wiley & Sons, Inc.
Vroom, V. H. (1965). Motivation in management. American Foundation for Management
Research.
Vroom, V. H. (1993). Improvising and muddling through. In A. G. Bedeian (Ed.), Management
Laureates: A Collection of Autobiographical Essays, Vol. 3. Greenwich, CT: JAI Press.
Vroom, V. H. & Jago, A. G. (1988). The new leadership: Managing participation in
organizations. Englewood Cliffs, NJ: Prentice-Hall, Inc.
Webb, K. (2003). Presidents’ leadership behaviors associated with followers’ job satisfaction,
motivation toward extra effort, and presidential effectiveness at evangelical colleges and
universities. Unpublished doctoral dissertation, University of North Texas, Denton, TX.
Williams, S. R. & Wilson, R. L. (1997). Group support systems, power, and influence in an
organization: A field study. Decision Sciences, 28(4), 911-937. doi: 10.1111/j.1540-
5915.1997.tb01336.x
Wren, J. T. (1995). The leader’s companion: Insights on leadership through the ages. New York,
NY: Free Press.

187
Yukl, G. A. (1981). Leadership in organizations. Englewood Cliffs, NJ: Prentice-Hall, Inc.
Zand, D. E. (1972). Trust and managerial problem solving. Administrative Science Quarterly,
17(2), 229-239. Retrieved from http://www.jstor.org/stable/2393957

188
APPENDICES

189
APPENDIX A
List of Title III and V-eligible Institutions

190
Title III and V-eligible Institutions
State Institutions US DOE List* State Name City
AK Prince William Sound Community College 1 AK University of Alaska Anchorage - Kenai Peninsula College 1 AK University of Alaska Southeast – Juneau Campus 2 AL Alabama Southern Community College 1,2 AL Athens State University 1,2 AL Auburn University Montgomery 1 AL Bevill State Community College 1,2 AL Central Alabama Community College 1 AL Enterprise-Ozark Community College 1 AL Faulkner State Community College 2 AL Faulkner University 1,2 AL Gadsden State Community College 1 AL George C. Wallace State Community College 1,2 AL George C. Wallace State Community College - Selma 1 AL Jefferson Davis Community College 2 AL Jefferson State Community College 1 AL John C. Calhoun State Community College 1,2 AL Northeast Alabama Community College 1,2 AL Reid State Technical College 1 AL Shelton State Community College 1 AL Southern Community College 1 AL Southern Union State Community College 1 AL Troy State University 1,2 AL University of Alabama at Birmingham 1 AL University of North Alabama 1 AL University of South Alabama 2 AL University of West Alabama 1 AR Arkansas Northeastern College 1 AR Central Baptist College 1,2 AR Cossatot Community College of the University of Arkansas 1 AR East Arkansas Community College 2 AR Harding University 2 AR Henderson State University 1,2 AR Mid-South Community College 1,2 AR National Park Community College at Hot Springs 1 AR North Arkansas College 1 AR Ouachita Baptist University 2 AR Pulaski Technical College 1 AR South Arkansas Community College 1 AR Southern Arkansas University Technical 2

191
State Institutions US DOE List* AR University of Arkansas at Monticello 1,2 AR University of Arkansas Community College at Batseville 2 AR University of Arkansas Community College at Morrilton 1,2 AR University of Arkansas Fort Smith 1,2 AR University of Central Arkansas 1,2 AS American Samoa Community College 1,2 AZ American Indian College of the Assemblies of God 2 AZ Arizona Western College 1 AZ Central Arizona College 2 AZ Cochise College 1,2 AZ Eastern Arizona College 1 AZ Estrella Mountain Community College 1,2 AZ GateWay Community College 1 AZ International Institute of the Americas 2 AZ International Institute of the Americas – Mesa 2 AZ International Institute of the Americas – Tuscon 2 AZ Mohave Community College 1,2 AZ Northern Arizona University – Yuma 2 AZ Northland Pioneer College 2 AZ Phoenix College 2 AZ Pima County Community College 1,2 AZ Pima County Community College - Desert Vista Campus 1 AZ Pima County Community College – Downtown Campus 2 AZ Pima County Community College - East Campus 1 AZ Pima County Community College - West Campus 1 AZ Prescott Center for Alternative Education 1 AZ South Mountain Community College 2 AZ University of Arizona - South Campus 1,2 CA Allan Hancock College 1,2 CA Alliant University 1 CA American River College 1,2 CA Antelope Valley College 1,2 CA Antioch University – Southern California 2 CA Art Institute of Southern California 2 CA Bakersfield College 2 CA Bethany College of the Assemblies of God 1 CA Butte College 1,2 CA Cabrillo College 2 CA California State University – Dominguez Hills 2 CA California State University – Fresno 2 CA California State University - Los Angeles 1,2 CA California State University - Northridge 1,2 CA California State University - Stanislaus 1,2

192
State Institutions US DOE List* CA California College of Arts & Crafts 1,2 CA California State University - East Bay 1 CA California State University - Long Beach 1 CA California State University - Monterey Bay 1,2 CA California State University - San Bernardino 1,2 CA Canada College 1,2 CA Cerritos College 2 CA Chabot College 1,2 CA Chaffey Community College 2 CA College of Alameda 1 CA College of the Desert 2 CA College of the Sequoias 1 CA College of the Siskiyous 1 CA Columbia College 1 CA Cosumnes River College 1,2 CA Crafton Hills College 2 CA Cypress College 1,2 CA De Anza Community College 1,2 CA East Los Angeles College 1,2 CA El Camino College 1,2 CA Fresno City College 1 CA Gavilan College 1,2 CA Glendale Community College 1,2 CA Hartnell Community College 2 CA Heald College, Schools of Business and Technology (Stockton) 1 CA Heald College, Schools of Business and Technology (Fresno) 1
CA Heald College, Schools of Business and Technology (Rancho Cordova) 1
CA Heald College, Schools of Business and Technology (Roseville) 1 CA Heald College, Schools of Business and Technology (Salinas) 1 CA Heald College, Schools of Business and Technology (Concord) 1 CA Heald College, Schools of Business and Technology (Hayward) 1 CA Heald College, Schools of Business and Technology (Milpitas) 1 CA Holy Names College 1 CA Hope International University 1 CA Humboldt State University 1,2 CA Imperial Valley College 2 CA InterAmerican College 2 CA La Sierra University 2 CA Lake Tahoe Community College 1,2 CA Laney College 1 CA Long Beach City College 1 CA Los Angeles Mission College 1

193
State Institutions US DOE List* CA Los Angeles Pierce College 2 CA Los Angeles Southwest College 1 CA Los Angeles Trade Technical College 1,2 CA Los Angeles Valley College 2 CA Los Medanos College 2 CA Loyola Marymount University 1 CA Merced College 1,2 CA Merritt College 1 CA Monterey Peninsula College 1 CA Mount Saint Mary’s College 2 CA Mount San Antonio College 1 CA Mount San Jacinto College 2 CA National Hispanic University 1,2 CA National University 1 CA New College of California 1 CA Notre Dame de Namur University 1 CA Orange Coast College 1,2 CA Otis College of Art & Design 2 CA Oxnard College 1,2 CA Palo Verde College 2 CA Palomar College 1,2 CA Pasadena City College 1,2 CA Reedley College 1,2 CA Riverside Community College - Moreno Valley Campus 1,2 CA Sacramento City College 1,2 CA San Diego State University – Imperial Valley Campus 2 CA San Jose City College 1,2 CA Santa Ana College 2 CA Santa Monica College 1 CA Southwestern College 2 CA Taft College 1 CA University of California – Riverside 2 CA University of La Verne 2 CA University of San Francisco 1,2 CA Vanguard University of Southern California 1 CA Ventura College 1,2 CA West Hills Community College 1 CA Whittier College 2 CO Aims Community College - Fort Lupton Branch 1 CO Arapahoe Community College 1 CO Colorado Mountain College 1 CO Colorado State University - Pueblo 1 CO Community College of Denver 1

194
State Institutions US DOE List* CO Fort Lewis College 1,2 CO Front Range Community College 1 CO Lamar Community College 1 CO Metropolitan State College of Denver 1 CO Naropa University 1 CO Otero Junior College 2 CO Pikes Peak Community College 1 CO Red Rocks Community College 2 CO Trinidad State Junior College 1,2 CT Gateway Community Tech College 1 CT Housatonic Community College 2 CT Mitchell College 1 CT Norwalk Community Technical College 1,2 CT Three Rivers Community College 1,2 CT University of Bridgeport 1,2 DC Test University 2 DE Delaware Technical & Community College - Owens Campus 1 FL Barry University 1 FL Brevard Community College 1 FL Carlos Albizu University – Miami Campus 2 FL Central Florida Community College 1 FL Chipola College 1 FL Edison Community College 1 FL Florida Atlantic University 1,2 FL Florida Hospital College of Health Sciences 2 FL Florida International University 1,2 FL Gulf Coast Community College 2 FL Hillsborough Community College 1 FL International College 1 FL Jones College 1 FL Jones College - Miami 1 FL Lake City Community College 1 FL Lake Sumter Community College L1 FL Miami-Dade Community College - Wolfson Campus 1,2 FL Miami-Dade Community College - InterAmerican Campus 1,2 FL Miami-Dade Community College - Kendall Campus 1,2 FL Miami-Dade Community College 1,2 FL Miami-Dade Community College - Homestead Campus 1,2 FL Miami-Dade Community College – Medical Center Campus 2 FL Miami-Dade Community College - North Campus 1,2 FL North Florida Community College 1 FL Nova Southeastern University 1,2 FL Nova Southeastern University – North Miami Beach Campus 2

195
State Institutions US DOE List* FL Okaloosa Walton Community College 1,2 FL Pasco - Hernando Community College 1 FL Pensacola Junior College 1 FL Polk Community College 1 FL Saint Leo University 1 FL Saint Thomas University 1,2 FL Santa Fe Community College 1 FL South Florida Community College 1 FL Southeastern College 1 FL Tallahassee Community College 1 FL University of Central Florida 1 FL Valencia Community College 1 FL Valencia Community College - East Campus 1 FL Valencia Community College - Osceola Campus 1 FL Webber International University 1 GA Abraham Baldwin Agricultural College 1,2 GA Albany Technical Institute 1 GA Appalachian Technical College 1 GA Augusta State University 1,2 GA Brewton Parker College 1,2 GA Chattahoochee Technical College 1,2 GA Clayton College & State University 1 GA Columbus State University 1 GA Columbus Technical College 1 GA Dekalb Technical Institute 1,2 GA Georgia Military College 1 GA Georgia Perimeter College 1 GA Georgia Southern University 1 GA Georgia Southwestern State University 1,2 GA Gordon College 1 GA Middle Georgia College 1,2 GA Moultrie Area Technical College 1 GA Northwestern Technical College 1 GA Ogeechee Technical College 2 GA Sandersville Technical College 2 GA Savannah Technical Institute 1 GA South Georgia Technical College 1 GA Thomas University 1 GA Valdosta State University 1,2 GA Valdosta Technical College 1 GU Guam Community College 1,2 GU University of Guam 1 HI Chaminade University of Honolulu 2

196
State Institutions US DOE List* HI Hawaii Community College 2 HI Heald College - Honolulu 1 HI Honolulu Community College 1,2 HI Kapiolani Community College 2 HI Leeward Community College 1,2 HI University of Hawaii – West Oahu 2 HI University of Hawaii at Hilo 2 HI University of Hawaii at Manoa 2 IA Briar Cliff College 1 IA Clarke College 1 IA Eastern Iowa Community College 1,2 IA Ellsworth Community College 1 IA Graceland University 2 IA Hawkeye Community College 1 IA Indian Hills Community College 1 IA Iowa Lakes Community College 1 IA Iowa Wesleyan College 2 IA Kirkwood Community College 1 IA Maharishi University of Management 1 IA Marshalltown Community College 1 IA North Iowa Area Community College 1 IA Northeast Iowa Community College 1,2 IA Northwest Iowa Community College 1,2 IA Southeastern Community College 1,2 IA Southwestern Community College 1 IA University of Dubuque 1 ID Boise State University 1 ID College of Southern Idaho 2 ID Idaho State University 1 ID Lewis-Clark State College 1,2 ID North Idaho College 2 IL Black Hawk College 1 IL Blackburn University 1,2 IL Chicago State University 1 IL City Colleges of Chicago Richard J. Daley College 1,2 IL College of Du Page 1 IL College of Lake County 1 IL Columbia College 1 IL Danville Area Community College 1 IL Eastern Illinois University 1 IL Eureka College 1 IL Frontier Community College 1,2 IL Governors State University 1,2

197
State Institutions US DOE List* IL Harold Washington College 1,2 IL Highland Community College 2 IL Illinois Central College 2 IL Illinois College 2 IL Illinois Institute of Technology 1 IL John Wood Community College 1 IL Kankakee Community College 1 IL Kaskaskia College 1 IL Kendall College 1 IL Kennedy King College 1 IL Knox College 1,2 IL Lake Land College 1 IL Lincoln Land Community College 2 IL Lincoln Trail College 1,2 IL MacCormac College 1 IL MacMurray College 1 IL Malcolm X College 2 IL Morain Valley Community College 2 IL Morton College 1,2 IL National-Louis University 1 IL Northeastern Illinois University 1,2 IL Oakton Community College 1 IL Olive Harvey College 1 IL Olney Central College 1,2 IL Richland Community College 1,2 IL Rock Valley College 1 IL Rockford College 1 IL Roosevelt University 1 IL Saint Augustine College 1 IL Saint Xavier University 1,2 IL Sauk Valley Community College 1 IL South Suburban College 1 IL Southern Illinois University at Carbondale 1 IL Southern Illinois University at Edwardsville 1,2 IL Southwestern Illinois College 1,2 IL VanderCook College of Music 1,2 IL Wabash Valley College 1,2 IL Wilbur Wright College 1,2 IL William Rainey Harper College 1 IN Anderson University 2 IN Calumet College of Saint Joseph 2 IN Indiana Institute of Technology 1,2 IN Indiana University - East 1

198
State Institutions US DOE List* IN Indiana University - Northwest 1 IN Indiana University – Purdue University – Fort Wayne 2 IN Indiana University - South Bend 1 IN Indiana University Southeast 1 IN Ivy Tech Community College - Bloomington, Region 14 1,2 IN Ivy Tech Community College - Columbus, Region 10 1,2 IN Ivy Tech Community College - Evansville, Region 12 1,2 IN Ivy Tech Community College - Fort Wayne, Region 3 1,2 IN Ivy Tech Community College - Gary, Region 1 1,2 IN Ivy Tech Community College - Indianapolis, Region 8 1,2 IN Ivy Tech Community College - Kokomo, Region 5 1,2 IN Ivy Tech Community College - Lafayette, Region 4 1,2 IN Ivy Tech Community College - Madison, Region 11 1,2 IN Ivy Tech Community College - Muncie, Region 6 1,2 IN Ivy Tech Community College - Richmond, Region 9 1,2 IN Ivy Tech Community College - Sellersburg, Region 13 1,2 IN Ivy Tech Community College - South Bend, Region 2 1,2 IN Ivy Tech Community College - Terre Haute, Region 7 1,2 IN Oakland City University 1 IN Purdue University - Calumet 1 IN Saint Joseph's College 1 IN Saint Mary of the Woods College 1 KS Baker University 1 KS Barton County Community College 1 KS Bethany College 1 KS Bethel College 1 KS Butler County Community College 2 KS Central Christian College of Kansas 1 KS Coffeyville Community College 1,2 KS Colby Community College 1,2 KS Dodge City Community College 2 KS Donnelly College 2 KS Flint Hills Technical College 1 KS Fort Scott Community College 1,2 KS Garden City Community College 1,2 KS Hesston College 1,2 KS Kansas Wesleyan University 1 KS Labette Community College 1 KS Manhattan Area Technical College 2 KS McPherson College 1,2 KS Neosho County Community College 1 KS Newman University 2 KS Ottawa University 1

199
State Institutions US DOE List* KS Pittsburg State University 1 KS Pratt Community College & Area Vocational School 1,2 KS Tabor College 1,2 KS Wichita State University 1 KY Ashland Community College 1 KY Big Sandy Community and Technical College 1 KY Bowling Green Technical College 1 KY Brescia University 2 KY Campbellsville University 1,2 KY Eastern Kentucky University 2 KY Elizabethtown Community College 1
KY Hazard Community College - University of Kentucky Community College 1,2
KY Hopkinsville Community College 1
KY Jefferson Community College - Kentucky Community & Technical College 1
KY Kentucky Christian College 1 KY Kentucky Mountain Bible College 1 KY Kentucky Wesleyan College 1,2 KY Maysville Community and Technical College 1 KY Murray State University 1 KY Pikeville College 1 KY Saint Catharine College 2 KY Southeast Community College 1 KY Spalding University 1 KY Union College 1,2 KY Western Kentucky University 1 LA Baton Rouge Community College 2 LA Bossier Parish Community College 1,2 LA Elaine P. Nunez Community College 1,2 LA L. E. Fletcher Technical Community College 1 LA Louisiana State University - Eunice 1 LA Louisiana State University - Shreveport 1 LA McNeese State University 1,2 LA Nicholls State University 1 LA Northwestern State University 1 LA Our Lady of the Lake College 1 LA Southeastern Louisiana University 1 LA University of Louisiana at Lafayette 2 LA University of Louisiana at Monroe 2 LA University of New Orleans 1 MA American International College 2 MA Becker College 1,2

200
State Institutions US DOE List* MA Berkshire Community College 1 MA Bridgewater State College 2 MA Bristol Community College 2 MA Bunker Hill Community College 1 MA Cape Cod Community College 1 MA Fisher College 1 MA Holyoke Community College 1,2 MA Massachusetts Bay Community College 1 MA Massachusetts College of Art 1 MA Massasoit Community College 1,2 MA Middlesex Community College 1 MA Montserrat College of Art 1 MA Mount Ida College 1,2 MA Mount Wachusett Community College 1,2 MA Newbury College 1 MA Northern Essex Community College 1,2 MA Roxbury Community College 1,2 MA Salem State College 1 MA Springfield Technical Community College 2 MA University of Massachusetts - Boston 1 MA Urban College of Boston 1,2 MD Anne Arundel Community College 1 MD Baltimore City Community College 1 MD Chesapeake College 1 MD College of Southern Maryland 2 MD Garrett Community College 2 MD Hagerstown Community College 1 MD Montgomery College 1,2 MD Prince George's Community College 1 MD Sojourner Douglas College 2 MD Wor-Wic Community College 1 ME Central Maine Community College 1 ME College of the Atlantic 1 ME Eastern Maine Technical College 2 ME Kennebec Valley Technical College 2 ME Unity College 2 ME University of Maine - Fort Kent 1,2 ME University of Maine - Machias 1 ME University of Maine – Presque Isle 2 ME University of New England 1 ME University of Southern Maine 1 ME Washington County Technical College 1 ME York County Technical College 2

201
State Institutions US DOE List* MI Alpena Community College 1 MI Bay De Noc Community College 1 MI Bay Mills Community College 1 MI College For Creative Studies 1,2 MI Delta College 1 MI Finlandia University 1 MI Glen Oaks Community College 1 MI Gogebic Community College 1 MI Grace Bible College 1 MI Grand Rapids Community College 1,2 MI Henry Ford Community College 1 MI Jackson Community College 1,2 MI Kellogg Community College 1 MI Kuyper College 1 MI Lake Michigan College 1,2 MI Lansing Community College 1,2 MI Madonna University 2 MI Mid Michigan Community College 1,2 MI Monroe County Community College 1 MI Muskegon Community College 2 MI North Central Michigan College 2 MI Northwestern Michigan College 1 MI Saginaw Chippewa Tribal College 1 MI Saint Clair County Community College 2 MI Southwestern Michigan College 1 MI Washtenaw Community College 1 MN Bemidji State University 2 MN Central Lakes College 1 MN Century Community and Technical College 1 MN College of Saint Benedict 1 MN College of Visual Arts 1 MN Concordia University - Saint Paul 1 MN Dakota County Technical College 1 MN Inver Hills Community College 1 MN Lake Superior College 1,2 MN Minnesota State and Community Technical College 2 MN North Hennepin Community College 1 MN Pine Technical College 2 MN Riverland Community College 1 MN Rochester Community and Technical College 1 MN Saint Cloud Technical College 1 MN Southwest State University 1 MN White Earth Tribal and Community College 1

202
State Institutions US DOE List* MN Winona State University 1 MO Avila College 1 MO Central Missouri State University 1,2 MO Columbia College 1 MO Crowder College 1,2 MO Jefferson College 1 MO Metropolitan Community Colleges - Blue River 1 MO Metropolitan Community Colleges - Longview 1 MO Metropolitan Community Colleges - Maple Woods 1 MO Metropolitan Community Colleges - Penn Valley 1 MO Mineral Area College 1 MO Missouri Southern State University 1 MO Missouri State University - West Plains 1,2 MO Missouri Western State College 1,2 MO Moberly Area Community College 1 MO North Central Missouri College 1 MO Northwest Missouri State University 1,2 MO Ozarks Technical Community College 1,2 MO Ranken Technical College 1 MO Southeast Missouri State University 1 MO State Fair Community College 1 MO Three Rivers Community College 1 MO University of Missouri - Saint Louis 1,2 MS Blue Mountain College 1 MS Copiah-Lincoln Community College 1 MS Delta State University 1,2 MS East Central Community College 1,2 MS East Mississippi Community College 1 MS Holmes Community College 1 MS Itawamba Community College 2 MS Jones County Junior College 1,2 MS Meridian Community College 1,2 MS Mississippi College 1,2 MS Mississippi University for Women 2 MS Northwest Mississippi Community College 1,2 MS Pearl River Community College 1,2 MS Southwest Mississippi Community College 1 MS University of Southern Mississippi 2 MT Carroll College 1,2 MT Dawson Community College 2 MT Dull Knife Memorial College 1,2 MT Flathead Valley Community College 1 MT Fort Peck Community College 1

203
State Institutions US DOE List* MT Little Big Horn College 1,2 MT Miles Community College 1 MT Montana State University - Billings 1,2 MT Montana Tech (of the University of Montana) 1,2 MT Rocky Mountain College 1,2 MT Salish Kootenai College 1 MT Stone Child College 1,2 MT University of Great Falls 2 MT Western Montana College 1,2 NC Asheville Buncombe Technical Community College 1,2 NC Barton College 1 NC Bladen Community College 1 NC Cabarrus College of Health Sciences 1 NC Carteret Community College 1 NC Catawba Valley Community College 1 NC Cleveland Community College 1 NC College of the Albemarle 1,2 NC Elizabeth City State University 2 NC Fayetteville Technical Community College 1 NC Greensboro College 1 NC Halifax Community College 1,2 NC Haywood Community College 1 NC James Sprunt Community College 1 NC Mars Hill College 1 NC Martin Community College 1 NC Mayland Community College 1 NC McDowell Technical Community College 2 NC Mount Olive College 1 NC North Carolina Wesleyan College 2 NC Pamlico Community College 1,2 NC Piedmont Community College 1 NC Randolph Community College 1 NC Richmond Community College 1 NC Roanoke Chowan Community College 1 NC Robeson Community College 1,2 NC Sandhills Community College 2 NC South Piedmont Community College 1 NC Southeastern Community College 1,2 NC Southwestern Community College 1 NC Stanly Community College 1,2 NC Tri-County Community College 1,2 NC University of North Carolina at Pembroke 1 NC Vance - Granville Community College 1

204
State Institutions US DOE List* NC Wake Technical Community College 1 NC Wayne Community College 1,2 NC Western Piedmont Community College 1 NC Wilkes Community College 1 NC Wilson Technical Community College 1 ND Bismarck State College 1 ND Cankdeska Cikana (Little Hoop) Community College 1,2 ND Dickinson State University 1 ND Fort Berthold Community College 1,2 ND Lake Region State College 1 ND Mayville State University 1,2 ND Minot State University 1 ND Minot State University - Bottineau 1 ND Sitting Bull College 1 ND Turtle Mountain Community College 1,2 ND United Tribes Technical College 1,2 ND University of Mary 2 ND Valley City State University 2 ND Williston State College 2 NE Bellevue University 1 NE Chadron State College 1,2 NE College of Saint Mary 2 NE Concordia University 1 NE Dana College 1 NE Little Priest Tribal College 1,2 NE Metropolitan Community College 1 NE Metropolitan Community College - South Omaha Campus 1 NE Mid-Plains Community College 1 NE Nebraska Indian Community College 1,2 NE Northeast Community College 1 NE Wayne State College 1 NE York College 1 NH Granite State College 1 NH New Hampshire Community Technical College at Manchester 1,2 NH New Hampshire Community Technical College at Berlin/Laconia 1 NH New Hampshire Community Technical College – Stratham 2 NH New Hampshire Community Technical College – Claremont 2 NH New Hampshire Tech College at Nashua/Claremont 1,2 NH New Hampshire Technical Institute 1,2 NJ Atlantic Community College 1 NJ Bloomfield College 1 NJ Burlington County College - Pemberton Campus 1 NJ College of Saint Elizabeth 2

205
State Institutions US DOE List* NJ Essex County College 1,2 NJ Fairleigh Dickinson University 1 NJ Felician College 1 NJ Hudson County Community College 2 NJ Kean University 1,2 NJ Mercer County Community College 1 NJ New Jersey City University 2 NJ Passaic County Community College 1,2 NJ Richard Stockton College of New Jersey 1 NJ Rowan University 2 NJ Rutgers, the State University of New Jersey 2 NJ Saint Peter’s College 2 NJ Sussex County Community College 1 NJ Union County College 1,2 NM Clovis Community College 1,2 NM College of Santa Fe (The) 2 NM Crownpoint Institute of Technology 1 NM Eastern New Mexico University – Roswell 2 NM Eastern New Mexico University 2 NM Institute of American Indian & Alaska National Culture & Arts 1,2 NM International Institute of the Americas – Albuquerque 2 NM Luna Community College 2 NM Mesalands Community College 2 NM New Mexico Highlands University 1,2 NM New Mexico Institute of Mining & Technology 1,2 NM New Mexico Junior College 2 NM New Mexico State University Dona Ana 1,2 NM New Mexico State University 1,2 NM New Mexico State University - Alamogordo 1,2 NM New Mexico State University - Grants 1,2 NM New Mexico State University - Carlsbad 1,2 NM Northern New Mexico Community College 1,2 NM San Juan College 1 NM Santa Fe Community College 2 NM Southwestern Indian Polytechnic Institute 1 NM University of New Mexico 1,2 NM University Of New Mexico Taos 1,2 NM University of New Mexico - Valencia Campus 1,2 NM Western New Mexico State University 1,2 NV Community College of Southern Nevada 1 NY Adelphi University 2 NY Adirondack Community College 1 NY Boricua College 1,2

206
State Institutions US DOE List* NY Bramson ORT College 1 NY Broome Community College 1,2 NY Canisius College 1 NY Cayuga County Community College - SUNY 1,2 NY Cazenovia College 1 NY City College of New York - CUNY 1,2 NY College of Mount Saint Vincent 1 NY College of New Rochelle 1 NY College of Saint Rose 1 NY Columbia - Greene Community College - SUNY 1 NY Concordia College 1,2 NY Corning Community College - SUNY 1,2 NY CUNY Bernard M. Baruch 1 NY CUNY – Bronx Community College 2 NY CUNY – Hostos Community College 2 NY CUNY Hunter College 1,2 NY CUNY John Jay College of Criminal Justice 1 NY CUNY LaGuardia Community College 1,2 NY CUNY Lehman College 1,2 NY CUNY Queens College 1,2 NY CUNY York College 1 NY Daemen College 1,2 NY Dowling College 1 NY D'Youville College 1 NY Erie Community College 1 NY Finger Lakes Community College - SUNY 1 NY Genesee Community College 1,2 NY Hilbert College 1,2m NY Jamestown Community College 1 NY Keuka College 1 NY Medaille College 1 NY Mercy College 1,2 NY Metropolitan College of New York 1,2 NY Molloy College 1 NY Monroe Community College 1 NY Nassau Community College 1
NY New York City Technical College of the City University of New York 2
NY New York Institute of Technology 1 NY Niagara University 1 NY North Country Community College 1 NY Nyack College 1 NY Onondaga Community College 1,2

207
State Institutions US DOE List* NY Orange County Community College 1 NY Paul Smith's College of Arts & Sciences 1 NY Polytechnic University 2 NY Pratt Institute 1 NY Queensborough Community College - CUNY 1 NY Saint Bonaventure University 1 NY Saint John's University 1,2 NY Saint Thomas Aquinas College 1 NY Schenectady County Community College 1,2 NY State University of New York at New Paltz 1,2 NY State University of New York Institute of Technology at Utica 1,2 NY Suffolk County Community College 1 NY SUNY College at Buffalo 1 NY SUNY College at Fredonia 1 NY SUNY College at Old Westbury 1 NY SUNY College at Plattsburgh 1,2 NY SUNY College at Potsdam 1,2 NY SUNY College at Purchase 1,2 NY SUNY College of Technology at Alfred 1 NY SUNY College of Technology at Canton 1,2 NY SUNY Empire State College 1 NY SUNY Fulton-Montgomery Community College 1 NY SUNY Ulster County Community College 1,2 NY Vaughn College of Aeronautics and Technology 1,2 NY Villa Maria College of Buffalo 2 OH Belmont Technical College 1 OH Central Ohio Technical College 1 OH Cincinnati State Technical & Community College 1,2 OH Clark State Community College 1,2 OH Cleveland State University 1 OH College of Mount Saint Joseph 1 OH Columbus State Community College 1,2 OH Cuyahoga Community College 1,2 OH David N Myers College 1 OH Edison Community College 1 OH Hocking Technical College 2 OH James A. Rhodes State College 1 OH Jefferson Community College 1,2 OH Kent State University 2 OH Lorain County Community College 1,2 OH Lourdes College 1,2 OH Marion Technical College 1 OH Mercy College of Northwest Ohio 1,2

208
State Institutions US DOE List* OH North Central State College 1 OH Northwest State Community College 1 OH Notre Dame College of Ohio 2 OH Ohio University - Zanesville Campus 1 OH Owens State Community College 1 OH Shawnee State University 1 OH Stark State College of Technology 1,2 OH Terra State Community College 1 OH Tiffin University 1,2 OH Union Institute & University 1 OH Washington State Community College 1,2 OH Youngstown State University 1,2 OH Zane State College 1 OK Cameron University 2 OK Carl Albert State College 1 OK Connors State College 1 OK Eastern Oklahoma State College 1 OK Northeastern State University 1,2 OK Northwestern Oklahoma State University 1,2 OK Oklahoma City Community College 1 OK Oklahoma Panhandle State University 1 OK Oklahoma State University - Okmulgee 1 OK Rogers University 1 OK Rose State College 1,2 OK Seminole State College 2 OK Southwestern Oklahoma State University 1,2 OK Tulsa Community College 1 OK University of Central Oklahoma 2 OK University of Science & Arts of Oklahoma 1 OK Western Oklahoma State College 1 OR Chemeketa Community College 1,2 OR Clackamas Community College 1 OR Clatsop Community College 1 OR Concordia University 1,2 OR Eastern Oregon University 1,2 OR Heald College - Portland 1 OR Klamath Community College 2 OR Lane Community College 1,2 OR Pacific Northwest College of Art 1 OR Portland State University 1 OR Southern Oregon University 1 OR Southwestern Oregon Community College 1 OR Warner Pacific College 2

209
State Institutions US DOE List* OR Western Oregon University 1 PA Albright College 1 PA Butler County Community College 1 PA Cabrini College 1 PA Carlow College 1 PA Chatham College 1 PA Chestnut Hill College 1 PA Clarion University of Pennsylvania 2 PA Community College of Allegheny County 1 PA Community College of Beaver County 1 PA Edinboro University of Pennsylvania 1 PA Harcum College 1 PA Harrisburg Area Community College 1 PA Johnson College 1 PA Keystone College 1 PA Kings College 1 PA Luzerne County Community College 1 PA Mansfield University of Pennsylvania 2 PA Millersville University of Pennsylvania 1 PA Montgomery County Community College 1 PA Moore College of Art and Design 1 PA Neumann College 1,2 PA Northampton Community College 1 PA Peirce College 1,2 PA Pennsylvania College of Technology 1 PA Pennsylvania Highlands Community College 1,2 PA Pennsylvania Institute of Technology 2 PA Robert Morris College 2 PA Saint Francis University 1,2 PA Slippery Rock University 1 PA Thiel College 1 PA Westmoreland County Community College 1 PR American University of Puerto Rico 1,2 PR Atlantic College 1,2 PR Bayamon Central University 1,2 PR Carlos Albizu University – San Juan Campus 2 PR Centro de Estudios Multidisciplinarios 1,2 PR Colegio Pentecostal Mizpa 2 PR Colegio Tecnologico Del Municipio De San Juan 1,2 PR Colegio Universitario del Este 2 PR Escuela De Artes Plasticas 2 PR Humacao Community College 2 PR Inter American University Aguadilla 1,2

210
State Institutions US DOE List* PR Inter American University Arecibo 1,2 PR Inter American University Barranquitas 1,2 PR Inter American University Bayamon 1,2 PR Inter American University Fajardo 1,2 PR Inter American University Guayama 1,2 PR Inter American University of Puerto Rico - Metropolitan 1 PR Inter American University Ponce 1,2 PR Inter American University San German 1,2 PR Pontifical Catholic UPR (The) 1,2 PR Pontifical Catholic UPR (The) - Arecibo 1,2 PR Pontifical Catholic UPR (The) - Mayaguez 1,2 PR Universidad Adventista De Las Antillas 1 PR Universidad Central del Caribe 2 PR Universidad del Este – Cabo Rojo 2 PR Universidad del Este – Manati 2 PR Universidad del Este – Santa Isabel 2 PR Universidad del Este – Utuado 2 PR Universidad del Este – Yuaco 2 PR Universidad del Turabo 1,2 PR Universidad del Turabo – Cayey 2 PR Universidad del Turabo – Isabela 2 PR Universidad del Turabo – Naguabo 2 PR Universidad del Turabo – Ponce 2 PR Universidad del Turabo – Yabucoa 2 PR Universidad Metropolitana 2 PR Universidad Metropolitana – Aguadilla 2 PR Universidad Metropolitana – Bayamon 2 PR Universidad Metropolitana – Jayuya 2 PR Universidad Politecnica de Puerto Rico 1,2 PR University of Puerto Rico - Aguadilla 1,2 PR University of Puerto Rico – Cayey 2 PR University of Puerto Rico - Humacao 1,2 PR University of Puerto Rico - Rio Piedras Campus 1,2 PR University of Puerto Rico – Utuado 2 PR University of the Sacred Heart 2 PR UPR ACR Carolina Regional College 1 PR UPR Bayamon University College 1,2 PR UPR Mayaguez 1,2 PR UPR Medical Sciences Campus 1,2 PR UPR Ponce University College 1,2 PR UPR Rico Arecibo 1 RI Community College of Rhode Island 1,2 SC Aiken Technical College 1,2

211
State Institutions US DOE List* SC Central Carolina Technical College 1,2 SC Florence - Darlington Technical College 1 SC Francis Marion University 1,2 SC Greenville Technical College 1 SC Horry - Georgetown Technical College 1 SC Limestone College 1,2 SC Midlands Technical College 1 SC Newberry College 1 SC Northeastern Technical College 1 SC Orangeburg - Calhoun Technical College 1 SC Piedmont Technical College 1 SC Southern Methodist College 1 SC Spartanburg Technical College 1 SC Technical College of the Lowcountry - Beaufort Campus 1 SC Tri-County Technical College 1 SC Trident Technical College 1 SC University of South Carolina - Spartanburg 1,2 SC Williamsburg Technical College 1,2 SC Winthrop University 1 SC York Technical College 1 SD Augustana College 1 SD Black Hills State University 1,2 SD Kilian Community College 2 SD Oglala Lakota College 1 SD Presentation College 1 SD Sinte Gleska University 1 SD Sinte Gleska University – Ihankotonwan Community College 2 SD South Dakota State University 1 SD University of Sioux Falls 1,2 SD University of South Dakota 1 SD Western Dakota Technical Institute 1 TN Austin Peay State University 1 TN Baptist Memorial College of Health Sciences 1 TN Bryan College 1 TN Christian Brothers University 1 TN Cleveland State Community College 1 TN Columbia State Community College 1 TN Crichton College 1,2 TN Dyersburg State Community College 1,2 TN Freed Hardeman University 1 TN Jackson State Community College 1 TN King College 1 TN Lee University 1,2

212
State Institutions US DOE List* TN Lincoln Memorial University 1 TN Maryville College 1 TN Middle Tennessee State University 1 TN Motlow State Community College 1,2 TN Nashville State Technical Institute 1 TN Roane State Community College 1,2 TN Southwest Tennessee Community College 1 TN Tennessee Temple University 1 TN Tusculum College 1 TN Walters State Community College 1,2 TN Watkins Institute College of Art & Design 2 TX Amarillo College 1,2 TX Angelina College 2 TX Austin Community College 2 TX Baptist University of the Americas 1,2 TX Brazosport College 1,2 TX Brookhaven College 1 TX Cedar Valley College 1,2 TX Cisco Junior College 1 TX Clarendon College 1 TX Coastal Bend College 1,2 TX Del Mar College 2 TX East Texas Baptist University 1,2 TX El Paso Community College 2 TX Galveston College 1 TX Houston Community College 2 TX Howard College 1,2 TX Jacksonville College 1 TX Kilgore College 1 TX Lamar State College - Port Arthur 1,2 TX Lamar University 2 TX Laredo Community College 1,2 TX Lee College 1 TX McLennan Community College 1 TX Midland College 2 TX Mountain View College 2 TX Navarro College 1 TX North Central Texas College 1 TX North Lake College 1 TX Northwest Vista College 1,2 TX Our Lady of the Lake University 2 TX Palo Alto College 2 TX Panola College 1

213
State Institutions US DOE List* TX Paris Junior College 1,2 TX Saint Edwards University 2 TX Saint Mary's University 1,2 TX San Antonio College 2 TX San Jacinto College - South Campus 1 TX San Jacinto College Central 1 TX Schreiner University 2 TX Southwest Texas Junior College 2 TX Sul Ross State University 1,2 TX Sul Ross State University – Rio Grande-Uvalde 2 TX Texas A&M International University 1,2 TX Texas A&M University – Corpus Christi 2 TX Texas A&M University – Kingsville 2 TX Texas State Technical College 1 TX Texas State Technical College - Harlingen 1,2 TX Texas State Technical College - Waco 1 TX Texas Tech University 2 TX Texas Wesleyan University 1,2 TX Trinity Valley Community College 1 TX Tyler Junior College 1 TX University of Texas of the Permian Basin 1,2 TX University of Houston - Downtown 1,2 TX University of North Texas 1 TX University of Texas at Brownsville 1,2 TX University of Texas at El Paso 1,2 TX University of Texas at San Antonio 1,2 TX University of the Incarnate Word 2 TX Victoria College (The) 2 TX Weatherford College 2 TX Western Texas College 1,2 TX Wharton County Junior College 1 UT Salt Lake Community College 1 UT Utah Valley State College 1 VA Blue Ridge Community College 1 VA Eastern Shore Community College 2 VA Germanna Community College 1 VA J. Sargeant Reynolds Community College 1 VA Jefferson College of Health Sciences 2 VA Lynchburg College 1 VA Marymount University 2 VA New River Community College 1 VA Northern Virginia Community College 2 VA Old Dominion University 1

214
State Institutions US DOE List* VA Paul D. Camp Community College 1 VA Piedmont Virginia Community College 1 VA Radford University 1 VA Rappahannock Community College 1 VA Southside Virginia Community College 1,2 VA Southwest Virginia Community College 1,2 VA Thomas Nelson Community College 1 VA University of Virginia's College at Wise 1,2 VA Virginia Intermont College 2 VA Virginia Western Community College 1 VA Wytheville Community College 1 VT Burlington College 1 VT College of Saint Joseph 1 VT Community College of Vermont 1 VT Johnson State College 1 VT Southern Vermont College 1 VT Vermont Technical College 1,2 VT Woodbury College 1 WA Bates Technical College 1 WA Centralia College 1 WA Clark College 1 WA Columbia Basin College 1 WA Edmonds Community College 1 WA Everett Community College 1 WA Green River Community College 1,2 WA Heritage College 1,2 WA Lake Washington Technical College 1,2 WA Lower Columbia College 1,2 WA Northwest Indian College 1 WA Olympic College 1 WA Peninsula College 1,2 WA Pierce College 1 WA Seattle Central Community College 1,2 WA Skagit Valley College 1 WA Spokane Community College 1,2 WA Spokane Falls Community College 1,2 WA Wenatchee Valley College 2 WA Yakima Valley Community College 2 WI Alverno College 1,2 WI Carroll College 1,2 WI Chippewa Valley Technical College 1 WI College of the Menominee Nation 1,2 WI Lakeshore Technical College 1

215
State Institutions US DOE List* WI Milwaukee Area Technical College 1 WI Milwaukee Institute of Art & Design 1 WI Moraine Park Technical College 1 WI Northcentral Technical College 1 WI Silver Lake College 1 WI University of Wisconsin - Eau Claire 1 WI University of Wisconsin - LaCrosse 1 WI University of Wisconsin - Oshkosh 1 WI University of Wisconsin - Parkside 1 WI University of Wisconsin - River Falls 1 WI University of Wisconsin - Stout 1 WI Western Technical College 1,2 WI Wisconsin Indianhead Technical College 2 WV Concord College 2 WV Davis & Elkins College 1 WV Marshall University 1,2 WV Mountain State University 1 WV New River Community and Technical College 1,2 WV Southern West Virginia Community and Technical College 1 WV University of Charleston 1 WV West Liberty State College 1 WV West Virginia Northern Community College 1 WV West Virginia State Community and Technical College 1 WV West Virginia University 1 WV West Virginia University - Parkersburg 1 WY Central Wyoming College 1 WY Laramie County Community College 1 * 1 – Title III and Title V Eligible Institutions for the Cost-Share Waiver, July 1, 2006 – June 30, 2011 2 – Title III Part A and Title V Programs, FY 2007 Eligible Institutions

216
APPENDIX B
LPI-Self (Third Edition) and Instructions


219
APPENDIX C
Demographic Survey

220
Demographic Survey
Please indicate your gender:
Male
Female
Please indicate your ethnicity/race:
White non-Hispanic
Black non-Hispanic
Hispanic
Asian/Pacific Islander
American Indian or Alaska Native
Other (Specify): Number of years in current position: __________________

221
APPENDIX D
November 2008 Preliminary Mailing Letter

222
Christine Hempowicz 2170 Park Avenue
Bridgeport, CT 06604
November 14, 2008 «Field1» «Position» «Institution» «President_Address_1» «President_City», «President_State» «President_Zip_Code» Dear President «President_Last_Name»: I am a third year doctoral student in the University of Bridgeport’s Educational Leadership program, beginning efforts to refine my proposed dissertation topic. My area of interest is in the leadership styles of private college and university presidents who lead Title III and Title V-eligible institutions. «Institution» is one of more than 200 such institutions nationwide. I am interested in the transformational leadership characteristics of these institutions’ presidents. As part of my proposed study, I will need to gather data during the summer of 2009. At that time, I would ask you to complete a one-page survey. A copy of the survey is enclosed for your information. (I will be permitted to collect data when I pass my doctoral comprehensive examinations, scheduled for the beginning of July, 2009.) I am contacting you now in order to get a reasonable sense of the number of responses I could get for my eventual data sample. In order to meet research requirements, I will need completed surveys from most of the presidents. It is an ambitious plan, but I think the results will be meaningful to presidents of such institutions, as well as to higher education associations. When completed, I would be delighted to share the results with you. Also, please be assured of complete anonymity. At this time, I would really appreciate it if you would indicate your likelihood to participate in a future survey by responding on the enclosed, self-addressed, stamped return postcard. Thank you for the time you have taken from your busy schedule to consider this request. I look forward to hearing from you at your earliest convenience. Respectfully submitted, Christine Hempowicz Third Year Doctoral Student, University of Bridgeport Cc: John W. Mulcahy, Ph.D., Dana Professor of Educational leadership and Professor of Management, University of Bridgeport enclosures

223
APPENDIX E
Permission from Kouzes Posner International


225
APPENDIX F
Permission from University of Bridgeport Institutional Review Board

University of
Bridgeport Institutional Review Board
Bridgeport, Connecticut 06604 • Telephone (203) 576-4279
May 27, 2009
Protocol: Transformational Leadership Characteristics of College and University Presidents of
Private Title III and Title V Eligible Institutions
Protocol number: 02-04-2010 Approval Period: 5/27/2009 – 5/27/2010
Dear Ms. Hempowicz,
On behalf of the University of Bridgeport Institutional Review Board (IRB), I am pleased to
inform you that the protocol listed above has been reviewed and approved as submitted for the
period indicated.
The UB IRB operates under the Code of Federal Regulations CFR: Title 45, part 46. As a result,
this approval is granted with the understanding of continuing investigator responsibilities.
Initiation of the research covered by this approval will be considered acceptance of the following
responsibilities:
1. The consent that is part of the survey submitted must be used as is; unless a subsequent
modification is approved by the IRB (copies may be made).
2. If data collection is to continue beyond the expiration date indicated in this letter, the IRB
must be informed prior to the expiration date, otherwise, you must cease data collection
as your research will no longer be approved
3. Changes in procedures which in any way influence the research participants, study
methodology, consent or protocol must be submitted in writing in advance to the IRB for
approval
4. A final progress report must be submitted to the IRB by the Principal Investigator(s)
within 90 days of study termination.
5. If, during the conduct of your research, any adverse events occur involving the research
participants a report must be submitted to the IRB immediately
6. In the completed presentation of your research project, please be sure to maintain all
privacy and confidentiality components promised to participants in your consent/assent
document(s).
The IRB welcomes your research project into the list of approved protocols. Your compliance
with the above conditions will help protect your research for the approval period and permit final
allowance of your research activity.
Sincerely,
Professor of Clinical Sciences
Co-Chair UB IRB

227
APPENDIX G
July 2009 Letter to Invited Sample

228
Christine Hempowicz
2170 Park Avenue Bridgeport, CT 06604
July 10, 2009 «Field1» «Position» «Institution» «President_Address_1» «President_Address_2» «President_City», «President_State» «President_Zip_Code» Dear President «President_Last_Name»: Thank you so much for taking the time to read the letter I sent you in November 2008. At that time, I expressed my interest in studying the leadership styles of private college and university presidents who lead Title III and Title V-eligible institutions for my doctoral dissertation as a student in the University of Bridgeport’s Educational Leadership program. I asked you if you were likely to complete a survey during the summer of 2009. My dissertation advisor and I were quite encouraged by the significant response I received from that mailing. At this time, I am conducting the actual data collection and ask for your assistance. I respectfully request that you fill out the enclosed, one-page Leadership Practices Inventory and brief demographic survey. The instructions are included on the Inventory, which is coded for the purpose of tracking responders. Again, please be assured of complete anonymity. When completed, you may submit your responses by mailing them in the enclosed, self-addressed, stamped envelope. As I said in my first letter, your participation is voluntary and most appreciated. The results will be meaningful to presidents of such institutions, as well as to higher education associations. When completed, I would be delighted to share the results with you. Once more, I thank you for the time you have taken from your busy schedule to take part in this study. I look forward to hearing from you at your earliest convenience. Respectfully submitted, Christine Hempowicz Cc: John W. Mulcahy, Ph.D., Dana Professor of Educational leadership and Professor of Management, University of Bridgeport enclosures

229
APPENDIX H
September 2009 Follow-up Letter to Non-responders

230
Christine Hempowicz 2170 Park Avenue
Bridgeport, CT 06604
September 26, 2009 «Field1» «Position» «Institution» «President_Address_1» «President_City», «President_State» «President_Zip_Code» Dear President «President_Last_Name»: As you may recall, I first contacted you in November 2008, at which time I asked whether or not you were likely to participate in my proposed study of leadership styles of private college and university presidents who lead Title III and Title V-eligible institutions for my doctoral dissertation as a student in the University of Bridgeport’s Educational Leadership program. I asked you if you were likely to complete a survey during the summer of 2009. My dissertation advisor and I were quite encouraged by the significant response I received from that mailing. The package containing the original research instrument was mailed to you in July 2009 for completion and return. Unfortunately, I have not received your reply. Perhaps it was lost in the mail or inadvertently misplaced. I would be most grateful for your participation in this study. Of the 1,095 Title III and Title V-eligible institutions, just 219 are four-year, private colleges and universities. As such, a high rate of return is critical to the success of my doctoral research. I respectfully request that you fill out the enclosed, one-page Leadership Practices Inventory and brief demographic survey. The instructions are included on the Inventory, which is coded for the purpose of tracking responders. Again, please be assured of complete anonymity. When completed, you may submit your responses by mailing them in the enclosed, self-addressed, stamped envelope. Your response is requested by October 31. Your participation is voluntary and most appreciated. The results will be meaningful to presidents of such institutions, as well as to higher education associations. When completed, I would be delighted to share the results with you. Once more, I thank you for the time you have taken from your busy schedule to take part in this study. Respectfully submitted, Christine Hempowicz Cc: John W. Mulcahy, Ph.D., Dana Professor of Educational Leadership and Professor of Management, University of Bridgeport enclosures