transfer track versus workforce development: implications
TRANSCRIPT

University of South FloridaScholar Commons
Graduate Theses and Dissertations Graduate School
2007
Transfer track versus workforce development:Implications for policy change in Floridacommunity collegesKaren GriffinUniversity of South Florida
Follow this and additional works at: http://scholarcommons.usf.edu/etd
Part of the American Studies Commons
This Dissertation is brought to you for free and open access by the Graduate School at Scholar Commons. It has been accepted for inclusion inGraduate Theses and Dissertations by an authorized administrator of Scholar Commons. For more information, please [email protected].
Scholar Commons CitationGriffin, Karen, "Transfer track versus workforce development: Implications for policy change in Florida community colleges" (2007).Graduate Theses and Dissertations.http://scholarcommons.usf.edu/etd/2191

Transfer Track Versus Workforce Development:
Implications for Policy Change in Florida Community Colleges
by
Karen Griffin
A dissertation submitted in partial fulfillment of the requirements for the degree of
Doctor of Education Department of Adult, Career, and Higher Education
College of Education University of South Florida
Major Professor: Jan M. Ignash, Ph.D. Deirdre Cobb-Roberts, Ph.D.
W. Robert Sullins, Ed.D. William H. Young, Ed.D.
Date of Approval: March 19, 2007
Keywords: career, curriculum analysis, institutional mission, institutional goal, strategic plan
Copyright 2007, Karen Griffin

Dedication
I dedicate this work to my husband, Brian Robert Fisk. His faith in me went
beyond my own and kept me going. As an anthropologist and political scientist, he
provided insightful recommendations that helped to guide my way through the
construction of this study. The support of my family, parents Edward and Donna Griffin,
sister Kristine Griffin, brother Steven and his wife Carolyn and children Aidan and Oona,
grandmothers Orpha Anderson and Flora Brock, in-laws Robert and Harriet Fisk and
Clayton and Linda Fisk, added to Brian’s ongoing efforts to sustain my momentum to
finish, and I truly appreciate them. Finally, I am grateful for the friendship of Mary
Bendickson, Billie Byron, Maridru Clark, Gary Goff, Frank Harber, Ron and Cristy
Johnsrud, Martha Plumb, and David, Kathy, and Emily Reddy, who all have been
steadfast in cheering me onward.

Acknowledgements
I sincerely thank my major chair, Dr. Jan Ignash, for her guidance,
encouragement, and patience in completing my degree. My appreciation also goes to my
committee members for their willingness to provide assistance: Dr. Deirdre Cobb-
Roberts, Dr. Robert Sullins, and Dr. William Young. I am grateful to Dr. Gwendolyn
Stephenson and Dr. Sylvia Marion Carley for their continuing commitment to
professional development. My deep thanks go to Ms. Maridru Clark, who provided
invaluable assistance in pursuing and obtaining missing data, and to Ms. Linda Waters
for her research assistance. I also wish to acknowledge my Saturday dissertation group;
our shared moral support benefits us all. Finally, my thanks go out to my community
college colleagues in the State of Florida, who in many cases endured more than one
telephone call or email from me in my pursuit of data. My appreciation for their
willingness to advance my efforts is immeasurable.

i
Table of Contents
List of Tables ..................................................................................................................... iii
Abstract ................................................................................................................................v Chapter 1 Introduction .......................................................................................................1 Statement of the Problem.........................................................................................3 Significance of the Problem...................................................................................12 Purpose of Study....................................................................................................14 Significance of Study.............................................................................................14 Research Questions/Hypotheses ............................................................................15 Definition of Terms................................................................................................16 Limitations/Delimitations ......................................................................................22 Summary/Organization of Study ...........................................................................25 Chapter 2 Literature Review.............................................................................................27 Theoretical Perspectives on the Growth of Workforce Development Education..28 Functionalism, status-competition theory, and legitimation theory .......................................................................................................29 Policy theories – incremental theory, group theory, and political, terminal, and hidden agendas...................................................................33 The Growth of Workforce Development and the Community College Mission...38 The New Vocationalism ........................................................................................44 Workforce Development........................................................................................49 The Florida Community College and the Role of Vocational Education..............53 Related Curriculum Studies ...................................................................................62 The Method of Content Analysis...........................................................................73 Summary................................................................................................................76 Chapter 3 Method .............................................................................................................78 Introduction: Purpose of Study .............................................................................78 Researcher Objectivity...........................................................................................78 Research Questions/Hypotheses ............................................................................79 Methods..................................................................................................................80 Research question 1 ...................................................................................80 Research question 2 ...................................................................................83 Research question 3 ...................................................................................86 Research question 4 ...................................................................................86 Summary................................................................................................................86

ii
Chapter 4 Results ..............................................................................................................88 Introduction............................................................................................................88 Summary of Data Collection .................................................................................90 Results of Content Analysis...................................................................................95 Research question 1 ...................................................................................95 Results of Curricular Analysis .............................................................................121 Research question 2 .................................................................................121 Research question 3 .................................................................................125 Research question 4 .................................................................................125 Summary..............................................................................................................130 Chapter 5 Summary of Findings, Conclusions, and Implications for Practice and Research .................................................................................................................133 Summary of Method ............................................................................................134 Summary of Findings...........................................................................................135 Research question 1 .................................................................................136 Research question 2 .................................................................................138 Research question 3 .................................................................................139 Research question 4 .................................................................................139 Conclusions..........................................................................................................140 Limitations ...........................................................................................................142 Implications for Theory .......................................................................................143 Implications for Practice ......................................................................................144 Implications for Research ....................................................................................145 Summary..............................................................................................................147 References........................................................................................................................149 Appendices.......................................................................................................................159 Appendix A Strategic plan display: transfer strong...........................................160 Appendix B Strategic plan display: transfer medium........................................165 Appendix C Strategic plan display: workforce development strong .................165 Appendix D Strategic plan display: workforce development medium..............174 About the Author ................................................................................................... End Page

iii
List of Tables
Table 1 Percentage of non-liberal arts sections offered (1998 and 1991) ..............68 Table 2 Percentage of disciplines represented in non-liberal arts sections (1998 and 1991) .......................................................................................70 Table 3 Percentage of liberal arts sections offered (1998 and 1991)......................71 Table 4 Percentage of disciplines represented in liberal arts sections (1998 and 1991) .................................................................................................72 Table 5 Coding rubric for transfer and workforce emphases in mission statements................................................................................................82 Table 6 Coding rubric for transfer and workforce emphases in institutional goal statements........................................................................................83 Table 7 Sample section from state master file ........................................................85 Table 8 1999/2000 institutional mission statements: transfer strong...................100 Table 9 1999/2000 institutional mission statements: transfer medium ...............100 Table 10 1999/2000 institutional mission statements: workforce development strong.....................................................................................................101 Table 11 1999/2000 institutional mission statements: workforce development medium .................................................................................................103 Table 12 2004/2005 institutional mission statements: transfer strong...................103 Table 13 2004/2005 institutional mission statements: transfer medium ...............104 Table 14 2004/2005 institutional mission statements: workforce development strong......................................................................................................105 Table 15 2004/2005 institutional mission statements: workforce development medium .................................................................................................106

iv
Table 16 1999/2000 institutional goal statements: transfer strong ........................107 Table 17 1999/2000 institutional goal statements: transfer medium .....................107 Table 18 1999/2000 institutional goal statements: workforce development strong.....................................................................................................108 Table 19 1999/2000 institutional goal statements: workforce development medium .................................................................................................110 Table 20 2004/2005 institutional goal statements: transfer strong ........................111 Table 21 2004/2005 institutional goal statements: transfer medium .....................111 Table 22 2004/2005 institutional goal statements: workforce development strong.....................................................................................................112 Table 23 2004/2005 institutional goal statements: workforce development medium .................................................................................................113 Table 24 Workforce development mission patterns 1999/2000 .............................115 Table 25 Workforce development mission patterns 2004/2005 .............................115 Table 26 Workforce development goal patterns 1999/2000...................................116 Table 27 Workforce development goal patterns 2004/2005...................................116 Table 28 Percentage of credit non-liberal arts and liberal arts sections as part of total credit sections....................................................................122 Table 29 Percentage of credit non-liberal arts and liberal arts sections as part of total credit sections: small, medium, and large institutions .....124 Table 30 Percentage of disciplines represented in credit non-liberal arts sections..................................................................................................126 Table 31 Comparison of total sections against credit-only sections.......................128 Table 32 Comparison of total sections against credit-only sections: small, medium, and large institutions.............................................................129

v
Transfer Track Versus Workforce Development:
Implications for Policy Change in Florida Community Colleges
Karen Griffin
ABSTRACT
Policy-makers intend community colleges to be the primary vehicles for
workforce development education and training. In support of this intent, community
college mission statements and curricular patterns should clearly indicate a workforce
emphasis. Do these statements and curricular patterns reflect policy intent? If not, are
resources being directed appropriately?
This study was conducted to determine whether the current composition of the
overall Florida public community college curriculum and the content of Florida public
community college mission and planning statements provided evidence to support Florida
leadership policy statements that portray workforce development as a primary component
of the community college mission. An investigation also was made as to whether a
longitudinal assessment of the curriculum and the content of mission and planning
statements provided evidence that workforce development increased as a component of
the community college mission.

vi
Through the assumptions of legitimation theory, the overriding hypothesis of this
study was that community colleges as institutions that allocate status confer a higher
status through their transfer mission than through their workforce development mission.
To carry out this study, a content analysis was conducted of 1999/2000 and 2004/2005
mission and institutional goal statements. Comparisons were made across time and
between institutions. Size was included as a factor.
Findings confirmed the study prediction that the transfer mission would remain
paramount in the Florida community college curriculum. Findings also confirmed
growth in workforce development education once non-credit sections were included in
the overall curricular analysis. However, the liberal arts transfer mission remained the
primary emphasis in the curriculum analysis, although not in the content analysis.
Workforce retains a priority status among policy leaders, both at a national and
state level. The findings from this study indicate that leadership policy directives are
aligned well with institutional mission, goal, and planning documents: workforce
development holds a dominant place. However, the findings suggest that leadership
policy directives are not aligned well with curricular patterns. Community college
stakeholders may wish to investigate what more can be done to promote the workforce
development component to students.

1
Chapter 1
Introduction
On September 2, 2004, in his acceptance speech at the Republican National
Convention, President George W. Bush proposed to increase funding for the nation’s
community colleges to aid workers wishing to learn higher-level skills for better jobs
(Bush, 2004). This statement affirmed his earlier support in his January State of the
Union address to increase funding for the nation’s community colleges for workforce
training purposes (Bush, 2004). President Bush has been consistent in linking
community colleges with workforce development. In 2003, he praised community
colleges as workforce development incubators: “Community colleges are particularly
important, he said, because they can adapt to economic challenges by training and
retraining workers” (Dervarics, 2003, p. 10).
Workforce development education as defined in this study is made up of
community college vocational, occupational, and professional programs and courses
intended to train students and allow them to become immediately employable. Clowes
(1996) describes vocational, occupational, and professional education as being on a
continuum, with the ratio of practice to theory shifting along that continuum. Vocational
education emphasizes practice and deemphasizes theory, occupational education balances
practice and theory, and professional education emphasizes theory and deemphasizes

2
practice. The Florida Department of Education (FLDOE) (2004a) incorporates the
concept of this continuum in its description of workforce development education:
Workforce Development in the Florida Community College System (FCCS)
consists of training programs that prepare adult students for today’s workforce.
These programs serve adult learners, i.e., post-secondary students, by preparing
them for employment in a variety of industries that require well-developed
technical skills. Additional workforce development efforts are focused on
providing skills maintenance and enhancement through continuing education to
those already employed, and retraining for displaced workers. (p. 1)
The workforce role of the community colleges is emphasized in key policy
statements. The American Association of Community Colleges (AACC), which
functions to support the nation’s community colleges, includes in its vision the intent to
promote community colleges as the “premier workforce development providers in
America” with the action of “influencing government and corporate funding policies to
support the colleges in this key role” (AACC, 2004, p. 4). Reinforcing the workforce
theme, in June 2003, AACC sponsored the leadership summit on technological education.
The consensus of the attendees was that “developing a more agile, highly-skilled
workforce is a key goal for the nation’s 1171 community colleges” (Patton, 2003, p. 2).
In Florida, the focus on developing the nation’s workforce has been such that an
Office of Workforce Education has been established in the FLDOE. The workforce
training opportunities cut across the secondary and postsecondary boundaries and are
overseen by the different divisions within Florida’s K – 20 education board. For
example, the Chancellor of the state’s 28 public community colleges had workforce

3
development added to his title in 2003 and is now the Chancellor of Florida Community
Colleges and Workforce Education. Moreover, although workforce development cuts
across the educational sectors, Florida’s 28 public community colleges again are seen as
key sources for job training. Noting the relationship between economic growth and the
need for more college-educated workers, Windham (2003) drew the inference that in
Florida, “community colleges will provide either the entire training or at least the initial
training for a larger portion of the workforce in 2006 than is the current situation” (p.1).
Growth in workforce was reiterated in the newsletter of the Chancellor of Florida
Community Colleges and Workforce Education. In the newsletter, Chancellor Armstrong
(2004a) tied the proposed state budget increases to an expansion in “nursing programs,
technology programs, and other rapidly growing, well-paying career programs” (p. 1).
Statement of the Problem
Above are but a few examples of leadership policy statements that portray
workforce development as a primary component of the community college mission.
However, if policy-makers intend community colleges to be the primary vehicles for
workforce development education and training, then community college mission
statements and curricular patterns should clearly indicate a workforce emphasis if
workforce development is a primary component of the community college mission. Does
community college practice in terms of mission and curriculum in fact reflect policy
intent? If not, are resources being directed appropriately?
For example, President Bush justified his proposal to provide more funds for
workforce development by stating that American workers were lacking the skills to keep

4
up with changes and needed job training (Dervarics, 2003). However, some have argued
that job creation rather than job training is the true goal toward which resources should be
devoted (Lane, 2004; Seewer, 2004; Tampa Bay Workforce Alliance, 2004). If job
creation rather than job training should be a priority, then national and statewide policy
recommendations to divert resources to training may be inappropriate. Moreover, even if
job training should be the focus, have community college workforce development
programs been effective?
In Florida, the 2001 program review of Florida Workforce Development
Education Programs, performed by the Office of Program Policy Analysis and
Government Accountability (OPPAGA), indicated that although community college
program performance had improved for program completers who were placed in the
positions for which they were trained, a majority of students did not complete the
programs in which they were enrolled (OPPAGA, 2001). Completion of the program
would appear to be tied to enhanced benefits for the student. According to the FLDOE in
a 2004 budget presentation, A.S. degree completers on average experienced a 167%
increase in earnings and made more than twice as much as students with a high school
diploma ($35,592 versus $16,032). In addition, 80% of them who completed their degree
in 2001-2002 were employed by the fall of 2002 (FLDOE, 2004c, slide 6). Note that the
A.S. degree is considered the occupational associate’s degree in Florida, equivalent to the
A.A.S. degree in many other states (J. Ignash, November 19, 2004, personal
communication).
The OPPAGA program review provided empirical evidence that workforce
program performance needed improvement, underscored by the FLDOE budget
5
presentation that tied increased completion rates to enhanced student success. However,
data-based decision-making with regard to workforce development education would
appear to be limited. Bragg (2001b) noted that many of the arguments for or against
vocational education (a subset of workforce development education as defined in this
study) lacked the data to support them:
Over much of the twentieth century, arguments for and against vocational
education have been made on political and ideological grounds, but rarely have
they been based on empirical results. This is unfortunate because it suggests that
community colleges have missed opportunities to steer vocational education in
directions that would provide the greatest benefit. (p. 13)
Politically, ideologically, or empirically based, workforce development initiatives
may not have assumed a primary role in the national community college curriculum. Part
of the attempts to assess the ratio between the transfer curriculum and the workforce
development curriculum depends on what is included in the workforce development
curriculum. Clowes (1996) discusses the rise of the practical curriculum as well as the
growth in non-credit and work-related training activities in postsecondary education.
However, this increased infusion of the practical curriculum in the overall postsecondary
curriculum does not automatically mean that workforce development education has a
primary role in the community college curriculum. In their analysis of the community
college curriculum, Cohen and Ignash (1993) found that, “Despite frequent attempts to
shift the curriculum toward studies more directly vocational, the liberal arts, with more
than half the enrollment, remain the centerpiece of community college studies” (p. 9). In

6
an updated curriculum analysis, Brawer (1999) found that the liberal arts curriculum
retained a central role in the community college curriculum.
Historically, Florida community colleges are no different. Even with the onset of
World War II, when the rest of the nation’s two-year higher education institutions were
experiencing growth in defense-related coursework and training, Florida’s efforts in these
areas were covered in large part by trade schools (Stakenas, Mock, & Eaddy, 1984).
Existing junior colleges often shared facilities with vocational schools. The director and
secretary of the Community College Council, James L. Wattenbarger, provided the basis
for the long-range plan for public Florida community colleges with his 1950 doctoral
dissertation (Wattenbarger, 1950). A later publication, A State Plan for Public Junior
Colleges, (Wattenbarger, 1953), noted that the existing two-year colleges appeared to
subscribe to the junior college philosophy “except that the vocational and adult functions
seem to have been passed over rather lightly” (p. 25). The transfer function was the
primary function. Wattenbarger (1953) spoke directly to the functions of the junior
college in Florida and its competition with vocational schools:
Many of the functions of the junior college, such as terminal and adult education,
are at the present time being carried on by vocational-technical schools . . . To
allow these two types of institutions . . . to develop simultaneously, duplicating
work and perhaps at some time even competing for students, is not only poor
administrative practice but also expensive and inefficient . . . no new vocational-
technical schools should be established as separate institutions, and the post-high
school and adult work of the vocational school and of the junior college should be
combined. (41-43)

7
As described in more detail in Chapter 2, the battle for control over vocational
education continued from the inception of the Florida public community colleges to the
present. For example, in 2000, community college presidents petitioned the Florida
legislature to discontinue the duplication of postsecondary vocational education and
allow the community colleges jurisdiction over all postsecondary vocational education
programs. Their bid was unsuccessful.
Wattenbarger’s earlier plea for increased efficiency emerges today as a quest for
seamlessness in the K-20 educational system. FS 1000.02, Policy and guiding principles
for the Florida K-20 education system, refers to the legislature’s policy to achieve a
“seamless academic educational system that fosters an integrated continuum of
kindergarten through graduate school education for Florida's students” as well as
“funding efficiency of educational delivery systems by aligning responsibility with
accountability” (FS 1001.02, 2004b, p. 1). Accordingly, Florida’s K-20 education system
includes a guiding principle to provide “a coordinated, seamless system for kindergarten
through graduate school education” (FS 1001.02, 2004b, p. 1). In keeping with the theme
of seamlessness, the Division of Florida Community Colleges and Workforce Education
(FCCWE) has incorporated into its mission the desire to “increase the proficiency of all
students within one seamless, efficient system,” and it includes as goals “seamless
articulation and maximum access” and “quality efficient services” (FCCWE, 2004, p. 1).
The predominance of the role of workforce development education depends on
how the data are presented. Looking at the 2000-2001 enrollment patterns for the State
of Florida specifically (FLDOE, 2004), 26.91% of all community college students were
enrolled in the Associate in Arts (A.A.) Degree program, which is driven by the liberal

8
arts curriculum. The percentage is based on duplicated headcount. Looking only at credit
enrollment in the form of Associate in Science (A.S.) Degree program enrollment and
College Credit Certificate enrollment (College Credit Certificates focus upon workforce
development areas), workforce development comes in at 11.43 percent. However, the
picture changes when non-credit enrollment is included. Continuing Workforce
Education consists of training for licensure or workplace skills for which no credit is
awarded beyond continuing education units. Enrollment statistics (based on duplicated
headcount) placed this category at the second highest following A.A. degree program
enrollment, with 22.66% of all community college students enrolled. In addition, upon
combining continuing workforce education with A.S. degree, vocational certificate, and
college credit certificate enrollment, more than 38% of community college students were
enrolled in workforce-related programs.
The FLDOE Facts at a Glance document (FLDOE, 2004b), presents graduation
rates only in terms of degrees awarded; that is, continuing workforce education
completers are not represented. For total degrees awarded annually, the A.A. degree has
the highest performance, constituting 56% of the awards conferred. The A.S. degree
constitutes 19%, and vocational and college credit certificates constitute 25%.
As is seen by the examples above, the combinations of categories influence the
Florida community college curriculum portrait of transfer education versus workforce
education. In the 2000 Florida Curriculum Study (Griffin, 2002), liberal arts coursework
(typically associated with transfer coursework) represented a primary place in the Florida
community college curriculum, in part because the study was limited to credit
coursework. In this study, six researchers collected catalogs and course schedules for the

9
fall of 2000 from Florida’s 28 public community colleges. Utilizing a curriculum scheme
developed and used by researchers at the Center for the Study of Community Colleges
(CSCC) in seven national community college curriculum studies conducted between
1975 and 1998, the researchers coded all credit course sections listed in the schedules. A
seventh researcher reviewed all of the coding to check for accuracy and to minimize
error. Within the classification scheme were defined six liberal arts and ten non-liberal
arts areas, remedial, distance learning, and transferability categories. The researchers
used the state master list for Florida’s Common Course Numbering System to generate a
consistent coding system and to determine transferability.
The Florida researchers ultimately coded 42,928 credit course sections in the 28
community colleges. Findings indicated that nearly 67% of the course sections offered in
the Fall 2000 term were found in the liberal arts. Once more, this finding supplies further
evidence of the primary role of liberal arts in Florida’s community colleges: providing
the A.A. degree and the general education component of the A.S. degree remains a major
function of these institutions when only credit curriculum is considered. A limitation of
this study was the exclusion of the non-credit curriculum, which largely is related to
workforce development. Without considering the impact of the non-credit curriculum, it
becomes difficult to estimate the actual dominance (or lack thereof) of the role of
workforce development in the Florida community college curriculum.
Again, the role and predominance of workforce education in the Florida
community college system is not clearly specified. As stated in Richardson (1999),
“Many observers of Florida higher education have concerns about the structure of their
higher education system, including: (1) the limited capacity to address issues that the

10
various sectors of higher education have in common (for example, vocational education
and general education for students seeking the baccalaureate)” (p. 104). As if to
underscore the uncertain role of workforce education, House Bill 769 was passed in the
2004 Florida legislative session, requiring the State’s Commissioner of Education to
convene a workforce education task force. The task force was charged to conduct a
comprehensive study of workforce education (Armstrong, 2004b).
The intent of policy makers with regard to community colleges is reflected by
more than policy statements. Financial evidence exists in terms of the support that
President George W. Bush proposed. Rather than providing unrestricted funds to
community colleges, the Bush proposal tied new dollars directly into workforce
development in the form of “community-based job training grants. These competitive
grants would be awarded to community and technical colleges that partnered with local
employers who were seeking more skilled workers” (The White House, 2004).
At the state level, Governor Jeb Bush supported a substantial increase to Florida’s
community college budgets. In August 2004, the State Board of Education approved a
budget increase of 6% for the community colleges and a 9% increase for workforce
education (which in this use of the phrase includes secondary education programs)
(Armstrong, 2004c).
With regard to leadership policy statements and proposed budgets, policy makers
clearly intend for community colleges to emphasize workforce development education as
a key component. Employment projections support these types of policy statements. The
Council for Education Policy Research and Improvement (CEPRI) reported in 2004 that
for the next ten years, Florida’s top ten fastest growing jobs would require either an

11
associate’s degree or postsecondary vocational certificate, that the most growth would
occur in information technology, which would require a technical credential, and that
61% of the job growth projected through 2010 would require an associate’s degree, a
postsecondary vocational certificate, or a high school diploma with vocational training,
but that “despite these enormous needs for education and training, the state’s priority is
often focused on the college preparatory track . . . Workforce education programs often
receive the lowest priority among all education programs” (CEPRI, 2004, p. 1-2).
At the heart of the budgeting process and the establishment of priorities lies a
deeper issue, which is why certain employment areas require certification, credentials, or
degrees beyond on-the-job training. This issue is directly related to the one that explores
the growth of vocationalism in higher education in general. R. Roemer (1981) provided
an overview of three theoretical models: functionalism, status-competition theory, and
legitimation theory.
The functionalist theoretical approach ties a relationship between knowledge
acquisition and job performance and would serve to explain the growth of vocationalism
in higher education by the nature of the increasingly complex demands of the workplace.
In contrast, status-competition theory draws little or no relationships between knowledge
acquisition and occupational competence. This theoretical approach instead holds that
acquisition of a certificate or degree improves one’s ability to attain a position that is
more economically beneficial or beneficial in other elevated status terms. Finally,
legitimation theory ties together knowledge acquisition and occupational performance, as
does functionalism, but legitimation theory goes beyond functionalism by emphasizing
the active role that postsecondary institutions have in placing value on obtaining

12
certificates and degrees. Higher education serves to validate the degree requirement. A
more extensive discussion of these theoretical approaches and other approaches will
occur in Chapter 2.
Harold Lasswell (as cited in Ginsberg, Lowi, & Weir, 2003) described politics as
“the struggle over who gets what, when, and how” (p. 19). The struggle for ownership of
workforce education is indeed a political one, made more so by leadership policy
statements with promises of future funding. The ownership issue becomes even more
political with a potential for negative backlash against the Florida community college
system if leadership policy intent is not matched by practice. This study will assess
Florida community college documentation and curriculum patterns for evidence that
workforce education is a primary function.
Significance of the Problem
Workforce development education as contained in the vocational, occupational,
and professional curricula has been a component of the community college mission since
the inception of the institution (Cohen & Brawer, 2003; Witt, Wattenbarger,
Gollattscheck, & Suppiger, 1994). Indeed, as institutions that support both the transfer
and workforce development curricula, community colleges may become ideal workforce
development institutions, particularly in terms of the structure of the “new
vocationalism.” The new vocationalism utilizes a learner-centered approach, the
integration of academic and technical education, and the application of knowledge to
problem-solving, critical thinking, and other demonstrations of higher-level thinking
skills (Bragg, 2001b, Grubb, 1997). However, expectations may be too high at this point

13
in time to place workforce development at the forefront of the community college
mission. Mentioned previously, Cohen and Ignash (1993) and Brawer (1999) found that
the liberal arts retained a central place in community college studies. The findings of the
2000 Florida Curriculum Study support that statement. If policy-makers are intending
community colleges to be the primary vehicles for workforce development education and
training, then it is important to determine whether reality reflects intent.
Also, as discussed previously, whether leadership should direct funding toward
job training for higher-skill or new jobs or whether the funding focus should be primarily
upon job creation remains a point of debate. As an example, although CEPRI reported
that the highest job growth in Florida would occur in information technology, graduates
of computer science A.S. degree programs may not find immediate employment in high
wage information technology jobs. Moreover, although the collapse of internet
companies flooded the market with experienced computer science professionals,
outsourcing of technology jobs also presented a major concern. As reported by Giegerich
(2004), “A recent report from Forrester Research projected that as many as 3.3 million
American white collar tech jobs will go to overseas workers by 2015” (p. 1). The Tampa
Bay Workforce Alliance also noted the lowered projections for the computer and data
processing services industry “due to weak demand for services and jobs moving to other
countries” (p. 7). With a market saturated with experienced professionals and with
extensive job outsourcing, it may be ill-advised to direct increased resources toward
workforce development education, at least in the computer science program area.

14
Purpose of Study
The purpose of this study is twofold. One is to determine whether the current
composition of the overall Florida public community college curriculum and the content
of Florida public community college mission and planning statements provide evidence
to support Florida leadership policy statements that portray workforce development as a
primary component of the community college mission. The second is to determine
whether a longitudinal assessment of the curriculum and the content of mission and
planning statements will provide evidence that workforce development has increased as a
component of the community college mission. To conduct the longitudinal assessment,
the researcher will compare the current study against the 2000 Florida Curriculum Study
for the comparison data. The 2000 Florida Curriculum Study provides a strong
comparison point because the researchers used the same curriculum classification scheme
being used in the current study and used the Florida community college credit curriculum
as the research data.
Significance of Study
The significance of the study is in the contribution to the understanding of policy
versus practice and in the nature of the comprehensive community college curriculum in
the State of Florida. Empirical research that presents evidence of actual practice versus
statements of presumed practice is useful in separating rhetoric from reality. In addition,
no such study has been undertaken in Florida. Although research conducted at the state
level provides information on overall program enrollment and completion, it does not

15
provide a detailed focus on curriculum offerings as is provided by previous curriculum
studies.
The relationship between the credit and non-credit curriculum continues to be a
challenge to assess, particularly in terms of quantifying the contributions each has
towards the community college mission. The Community College Research Center
(CRCC) at Teachers College, Columbia University, has directed a research focus upon
mission integration and the role that the credit and non-credit curriculum has in the
community college. The proposed study here, although not affiliated with CRCC, can
contribute to further understanding of the role of the credit and non-credit curriculum,
particularly with regard to policy development and its implementation.
Research Questions/Hypotheses
Through the assumptions of legitimation theory, the overriding hypothesis of this
study is that community colleges as institutions that allocate status confer a higher status
through their transfer mission than through their workforce development mission.
Therefore, the study prediction is that transfer mission will remain paramount in the
Florida community college curriculum. Also through the assumptions of legitimation
theory, a secondary prediction is that the longitudinal analysis will indicate growth in
workforce development education because postsecondary institutions place an active
value on obtaining certificates and degrees and serve to validate the degree requirement.
In support of these assumptions, the specific research questions are as follows:
1. Do Florida public community college mission and planning statements
support national and state leadership policy statements with regard to the

16
dominance of the role of workforce development in the community college
curriculum?
2. What is the overall composition of the Florida public community college
curriculum, utilizing the classification scheme defined by the CSCC?
3. How have the non-liberal arts college-credit offerings changed between the
2000 Florida findings and the current study?
4. What proportion of the Florida community college curriculum is workforce
development education when the non-credit and vocational credit curriculum
is included?
Definition of Terms
The following definitions are provided for use in interpreting this study.
1. College credit:
College credit is the type of credit assigned to courses or course equivalent
learning that is part of an organized and specified program leading to a
graduate, baccalaureate, or associate degree. One (1) college credit is
based on the learning expected from the equivalent of fifteen (15) fifty-
minute periods of classroom instruction. (Florida State Board of
Education, Administrative Rules [FSBEAR], 2004b, para 3)
2. College preparatory instruction: “courses through which a high school
graduate who applies for any college credit program may attain the
communication and computation skills necessary to enroll in college credit
instruction” (Florida Statutes [FS], 2002, p. 2).

17
3. Contact hour: as derived from the FSBEAR (2004b) definition of an
instructional period, one fifty-minute period of classroom instruction.
4. Continuing workforce education:
Instruction that does not result in a technical certificate, diploma, associate
in applied science degree, or associate in science degree (defined below
under workforce development curriculum – parentheses added).
Continuing workforce education is for
a. Individuals who are required to have training for licensure renewal or
certification renewal by a regulatory agency or credentialing body;
b. New or expanding businesses;
c. Business, industry, and government agencies whose products or
services are changing so that retraining employees is necessary or
whose employees need training in specific skills to increase efficiency
and productivity; or
d. Individuals who are enhancing occupational skills necessary to
maintain current employment, to cross train, or to upgrade
employment. (FS, 2002, p. 2-3)
5. Credit:
Credit is a unit of measure assigned to courses or course equivalent
learning. Credit is awarded if the learning activity it represents is part of,
or preparatory for, an organized and specified program leading to a
postsecondary certificate or degree. Credit is a device which indicates to
the learner, to educational institutions, to employers, and to others how

18
much of the program the learner has completed. The credit awarded may
be independent of where the learning occurs. If a learning activity does not
meet these requirements, credit shall not be awarded. (FSBEAR, 2004b,
para 2)
6. General education:
The process of developing a framework on which to place knowledge
stemming from various sources, of learning to think critically, develop
values, understand traditions, respect diverse cultures and opinions, and,
most important, put that knowledge to use. It is holistic, not specialized;
integrative, not separatist. (Cohen & Brawer, 2003, p. 330)
7. Gordon Rule curriculum: As defined in the Florida State Board of Education
Administrative Rule 6A-10.030 (also known as the Gordon Rule), these
courses are those defined by Florida public community colleges and
universities as the ones a student must successfully complete prior to earning
an A.A. degree or prior to entry into the upper division. They include twelve
semester hours of English coursework, or coursework within the humanities,
in which a student must complete writing assignments, and six semester hours
of mathematics coursework at the level of college algebra or higher
(FSBEAR, 2004a).
8. Liberal arts curriculum: As described by Cohen and Ignash (1993), the liberal
arts curriculum is generally transferable credit coursework that contributes to
the attainment of an A.A. and/or Bachelor in Arts degree. For the purposes of
this study, the liberal arts curriculum incorporates six major disciplines –

19
humanities, English, fine and performing arts, social sciences, sciences, and
mathematics and computer sciences (at the more advanced level; for example,
programming).
9. New vocationalism: An educational phenomenon that “emphasizes career
clusters or pathways that extend from the entry level to the professional level
in career fields integral to the new economy (Bragg, 2001b). In contrast with
traditional vocational education, the new vocationalism utilizes a learner-
centered approach, the integration of academic and technical education, and
the application of knowledge to problem-solving, critical thinking, and other
demonstrations of higher-level thinking skills (Bragg, 2001b, Grubb, 1997).
10. Non-credit:
Non-credit is a term indicating that credit, as defined herein, is not
awarded. It applies . . . in the case of community colleges, to the
instructional classifications of supplemental, adult basic and secondary,
citizenship, and recreational . . . The unit of measure is hours of
instruction. (SBEAR, 2004b, para 11).
11. Non-liberal arts curriculum: Credit and non-credit coursework that is
primarily occupational or technical in nature and that contributes to the
attainment of an occupational certificate and/or Associate in Science Degree.
For the purposes of this study, the non-liberal arts curriculum includes
agriculture, business and office, education, engineering technologies, health,
marketing and distribution, personal skills and avocational courses, technical
education, trade and industry, and other (Cohen and Ignash, 1993). “Other” is

20
limited to occupational-technical categories that do not fit into the other
categories. Home economics is excluded from this study. The non-liberal arts
curriculum is used to represent the workforce development and occupational-
technical curriculum in this study.
12. Occupational completion point: “the occupational competencies that qualify a
person to enter an occupation that is linked to a career and technical program”
(FS, 2002, p. 4).
13. Occupational-technical curriculum: Credit and non-credit coursework that is
primarily occupational or technical in nature and that contributes to the
attainment of an occupational certificate and/or A.S. degree. For the purposes
of this study, the occupational-technical curriculum is equivalent to the non-
liberal arts curriculum and includes agriculture, business and office,
education, engineering technologies, health, marketing and distribution,
personal skills and avocational courses, technical education, trade and
industry, and other (Cohen and Ignash, 1993). “Other” is limited to
occupational-technical categories that do not fit into the other categories.
Home economics is excluded from this study. The occupational-technical
curriculum is used to represent the workforce development and non-liberal
arts curriculum in this study.
14. Traditional vocational education: An educational program directed toward
training students to become workers, primarily in low-level, low-income jobs.
Typically, traditional vocational education is characterized by an emphasis on

21
practice rather than upon theory and does not tend to be designed to allow the
student to explore a general area or move upward (Clowes, 1996).
15. Vocational credit:
The type of credit assigned to courses or course equivalent learning that is
part of an organized and specified program leading to a vocational
certificate. It applies to postsecondary adult vocational courses. One (1)
vocational credit is based on the learning expected from the equivalent of
thirty (30) hours of instruction. (SBEAR, 2004b, para 4).
16. Workforce Development Curriculum: The State of Florida defines workforce
development curriculum in the following manner:
Workforce Development in the Florida Community College System
(FCCS) consists of training programs that prepare adult students for
today’s workforce. These programs serve adult learners, i.e., post-
secondary students, by preparing them for employment in a variety of
industries that require well-developed technical skills. Additional
workforce development efforts are focused on providing skills
maintenance and enhancement through continuing education to those
already employed, and retraining for displaced workers.
The following programs types are offered:
a. Adult Basic Education and GED Preparation;
b. Postsecondary Adult Vocational Certificates (non- college credit
occupational training);

22
c. Applied Technology Diplomas (Occupational training offered by a
vocational-technical school or community college and guaranteed to
transfer to an AAS or AS degree);
d. College Credit Certificate (Stand alone certificate, also part of an AAS
or AS degree, 1 year or less);
e. Associate in Applied Science (Two year occupational degree);
f. Associate in Science (Two year occupational degree with general
education transferable to a state university);
g. Applied Technical Certificate (Certification beyond the AAS/AS
degrees);
h. Continuing Workforce Education (Non-credit courses for updating
skills) (FLDOE, 2004a, p. 1).
For the purposes of this study, the workforce development curriculum will
include categories b through h, which encompass Clowe’s (1996) continuum
of vocational, occupational, and professional curriculum as offered in the
Florida community college system.
Limitations/Delimitations
Limitations of the study include the following:
1. The awarding of credit is based on established, formal structures as
required by regional accrediting agencies. The Commission on Colleges
of the Southern Association of Colleges and Schools (COCSACS), for
example, has several mandates related to courses, notably including 3.4.1.,

23
which requires each credit program to be approved by the faculty and
administration and to have learning outcomes developed and assessed;
3.4.4., which requires a definite, published policy for assessing and
accepting transfer credit and non-traditional credit such as experiential
learning and advanced placement; and, most germane to the credit/non-
credit issue, “The institution awards academic credit for course work taken
on a noncredit basis only when there is documentation that the noncredit
course work is equivalent to a designated credit experience. (COCSACS,
2004, p. 23)
COCSACS also has structured guidelines for faculty. Faculty
members teaching general education coursework or coursework designed
for transfer to a bachelor’s degree should hold a master’s degree in the
teaching discipline or a master’s degree with 18 graduate hours in the
teaching discipline. Faculty members teaching associate degree courses
that are not designed for transfer should hold a bachelor’s degree in the
teaching discipline or, minimally, an associate’s degree with experience in
the teaching discipline (COCSACS, 2004).
In contrast, non-credit offerings may be tailored to individual
needs and tend to fulfill shorter-term goals than those affiliated with
obtaining a degree (Cohen & Brawer, 2003). Non-credit programs that are
articulated to credit programs may be based more on faculty credentials
and overall curricular content rather than on the clock hours associated
with a non-credit program. For example, at Hillsborough Community

24
College, an articulation agreement was established between the non-credit
fire fighter program and the credit fire science program in which the entire
fire fighter program was equated to one three-credit hour fire science
course. Developing a formula based on contact hours to measure the
contributions of the non-credit curriculum plows through these distinctions
and forces an arbitrary relationship between the non-credit and credit
curriculum.
2. Although the Florida common course numbering system provides a
template for the credit curriculum in developing a classification scheme
that looks at individual courses, this numbering system does not extend to
the non-credit curriculum. Therefore, I will define for this study how non-
credit coursework is coded in the classification scheme for all Florida
community colleges.
3. Not all colleges offer non-credit coursework in packaged schedules by
term. This affected how the non-credit data could be collected because
total non-credit coursework offered was only known after the term ended.
For example, at Hillsborough Community College, the Postsecondary
Adult Vocational fire fighter coursework was offered on an “as needed”
basis and did not appear in a published course schedule.
Delimitations of the study include the following:
1. The comprehensive curriculum is coded using a curriculum scheme
developed and used by researchers at the CSCC in seven national
community college curriculum studies conducted between 1975 and 1998.

25
The specific coding sheet used is the one developed for the 1998 study.
This curriculum scheme also takes into account the non-credit curriculum,
which is organized according to the categories developed in the 1991 Non-
Liberal Arts Study.
2. Vocational credit and non-credit coursework are coded as sections if they
include at least 45 contact hours (the number of contact hours in a 3-credit
hour course, which is a system standard for credit coursework). Non-credit
coursework that does not fall into one of the non-liberal arts categories is
excluded, as is non-credit coursework that is not employment-oriented.
Examples of this type of coursework are special interest courses that focus
upon personal enrichment or development, such as Antiques, Secrets of
Gourmet Cooking, and Introduction to Scrapbooking.
Summary/Organization of the Study
The purpose of this study is twofold. One is to determine whether the current
composition of the overall Florida public community college curriculum and the content
of Florida public community college mission and planning statements provide evidence
to support Florida leadership policy statements that portray workforce development as a
primary component of the community college mission. The second is to determine
whether a longitudinal assessment of the curriculum and the content of mission and
planning statements will provide evidence that workforce development has increased as a
component of the community college mission. Mentioned previously, the 2000 Florida
Curriculum Study will be used as the basis for comparison in the longitudinal assessment.

26
Through the assumptions of legitimation theory, the overriding hypothesis of this
study is that community colleges as institutions that allocate status confer a higher status
through their transfer mission than through their workforce development mission.
Therefore, the study prediction is that transfer mission will remain paramount in the
Florida community college curriculum. Also through the assumptions of legitimation
theory, a secondary prediction is that the longitudinal analysis will indicate growth in
workforce development education because postsecondary institutions serve to validate
the certificate and degree requirement. Legitimation theory is described in more detail in
Chapter 2.
This dissertation is organized into five chapters. Chapter 1 provides the
introduction. Chapter 2 provides a review of the literature. Chapter 3 provides the
methods of conducting the study. Chapter 4 contains the results, including a summary of
the data collection. Chapter 5 presents the conclusion, including a discussion of the
results and their implications for future study.

27
Chapter 2
Literature Review
The purpose of this study is twofold. One is to determine whether the current
composition of the overall Florida public community college curriculum and the content
of Florida public community college mission and planning statements provide evidence
to support Florida leadership policy statements that portray workforce development as a
primary component of the community college mission. The second is to determine
whether a longitudinal assessment of the curriculum and the content of mission and
planning statements will provide evidence that workforce development has increased as a
component of the community college mission.
Through the assumptions of legitimation theory, the overriding hypothesis of this
study is that community colleges as institutions that allocate status confer a higher status
through their transfer mission than through their workforce development mission.
Therefore, the study prediction is that transfer mission will remain paramount in the
Florida community college curriculum. Also through the assumptions of legitimation
theory, a secondary prediction is that the longitudinal analysis will indicate growth in
workforce development education because postsecondary institutions serve to validate
the certificate and degree requirement.
To provide background to this study, several literature threads are presented:
1. Theoretical perspectives on the growth of workforce development
education in the community college mission;

28
2. Historical and contemporary background on the growth of workforce
development education in the community college mission;
3. The new vocationalism;
4. Workforce development;
5. The Florida community college and the role of vocational education;
6. Related curriculum studies; and
7. The content analysis method.
Theoretical Perspectives on the Growth of Workforce Development Education
Central to this study is the relationship of the transfer mission to the workforce
development mission. As described in Chapter 1, workforce development education
includes the community college coursework that falls along the vocational/occupational/
professional education continuum defined by Clowes (1996). The history of the growth
of workforce development education in the community college curriculum will be
explored in the next section. This section provides theoretical perspectives to offer
explanations for that growth.
At the heart of the growth is the question as to why certain employment areas
came to require certification, credentials, or degrees beyond on-the-job training. Roemer
(1981) provided an overview of three theoretical models: functionalism, status-
competition theory, and legitimation theory. Following a discussion of these theoretical
models is Anderson’s (as cited in Goodchild, Lovell, Hines, & Gill, 1997) portrayal of
the public policy theories known as incremental theory and group theory. Finally,
29
Palmer’s (1987) dissertation perspectives will be included as an additional theoretical
perspective on policy and workforce development education.
Functionalism, status-competition theory, and legitimation theory. The
functionalist theoretical approach on workforce development education ties a relationship
between knowledge acquisition and job performance and would serve to explain the
growth of workforce development education in higher education by the nature of the
increasingly complex demands of the workplace. Whether individual values with regard
to personal achievement or overall socioeconomic benefits drive the growth of workforce
development education, Roemer (1981) indicated that the explanation for the growth
remained the same: “certain kinds of knowledge are sought because of their occupational
relevance” (p. 171).
In his assessment of the links between education, employment, and the growth of
workforce development education in the postsecondary curriculum, Collins (1971)
evaluated functionalism based on empirical evidence. He distinguished the broader
concept of functionalism from a specialized concept known as technical-function theory.
With regard to the broader concept of functionalism, Collins critiqued the overly simple
application of the theory. It tended to be applied as an explanation for a pattern without
providing the conditions under which the pattern would likely occur again. In other
words, straight functionalist theory had limitations as far as being testable, and it also
placed too much focus on societal needs rather than upon group power dynamics.
In describing the technical-function theory as a specific application of
functionalism, Collins (1971) summarized the basic premises as follows: the need for

30
increased skills occurred because of technological change. Two premises were involved:
jobs requiring minimal skills declined while jobs requiring more advanced skills climbed,
and skill requirements increased for existing jobs. On-the-job training was not adequate
for the new skill requirements; rather, formal education was needed.
Based on the empirical evidence, Collins (1971) found that technical-function
theory failed to provide an adequate explanation for the growth of workforce
development education in the postsecondary curriculum. The shift in the proportion of
jobs requiring minimal skills versus those requiring advanced skills only accounted for
15% of the increased education in the workforce. The premise that existing job
requirements were upgraded, thus requiring more formal education, was also dismissed.
Rather, the evidence indicated that the workforce tended to be over-educated for the
positions it held.
Clowes (1996) critiqued the functionalist approach as well. Functionalists
assumed that workforce needs could be projected in a manner that could drive the
development of training programs, and graduates of the programs would fill the
workforce needs. The data supplying workforce projections, however, was limited in its
reliability, and this overly simplistic theoretical approach again did not take into account
other factors that influence employment. In short, the degree alone did not guarantee
future employment.
According to Roemer (1981), in contrast to functionalism (which draws a
relationship between performance, knowledge acquisition, and the socioeconomic forces
and technological changes that place continued demands for education and training)
status-competition theory draws little or no relationships between knowledge acquisition

31
and occupational competence. Instead, status-competition theory proposes that the
acquisition of a degree is a ticket to higher status in society. On the outset, this theory
may appear to be very relevant to offering explanations for the growth of credentialing
related to high-wage/high-skills jobs. However, a central premise of status-competition
theory is that the credential, i.e., college education, has little relationship to occupational
training. Therefore, this premise begs the question as to why resources would be devoted
to workforce development education if the credential had no real relationship to future
success.
In Collins’ (1971) discussion of status, competition, and education, he stated,
“The main activity of schools is to teach particular status cultures . . . in this light, any
failure of schools to impart technical knowledge . . . is not important” (p. 1010). Collins
further noted the historical relationship of education in the United States with higher
status rather than with training:
Education has been associated with high economic and status position from the
colonial period on through the twentieth century. The result was a popular
demand for education as a mobility opportunity. This demand has not been for
vocational education at a terminal or commercial level, short of full university
certification; the demand has rather focused on education giving entry into the
elite status culture. (p. 1014)
Summarizing Roemer (1981), status-competition theory may explain why a
higher status is achieved by obtaining a certain credential, but it fails to explain the
growth of workforce education in the postsecondary curriculum if education is not
needed for occupational proficiency. Under the premises of status-competition theory,

32
certification and formal training should not be needed for the “high skills” associated
with occupational-technical fields. Consequently, as a theoretical approach, status-
competition theory loses ground as an explanation for the actual growth of workforce
development programs in postsecondary institutions, particularly in light of policy leader
statements about “job training” needs.
As described by Roemer (1981), legitimation theory ties together knowledge
acquisition and occupational performance, as does functionalism, but legitimation theory
goes beyond functionalism by emphasizing the active role that postsecondary institutions
have in placing value on obtaining certificates and degrees. Higher education serves to
validate the degree requirement. For example, with the growth of technology has come
the validation of the profession of computer science. No longer is it acceptable for an
engineer to teach computer science courses that are determined to be transferable, that is,
courses that equate to the first and second years of a baccalaureate. Instead, computer
science has become a legitimate profession and the certification needed to teach
transferable computer science coursework is a master’s degree with at least 18 graduate
semester hours in computer science coursework.
Roemer (1981) acknowledged Meyer (1977) in his overview of legitimation
theory. In a more detailed look, Meyer described the role that education not only has
upon individuals through socialization effects but also as an institution upon society
under the approach of legitimation theory. In his words, legitimation theory “treats
education as both constructing or altering roles in society and authoritatively allocating
personnel to these roles . . . Modern education is seen . . . as an agent transforming
society by creating new classes of personnel with new types of authoritative knowledge”

33
(p. 56). In his review of propositions regarding the role of education upon the individual
and society, Meyer maintained that the educational credential and the follow-up
socialization processes have more impact upon individuals than did the socializing
process of the individual school. Summarizing Meyer, education as an institution
asserted that certain types and levels of knowledge are authoritative, or legitimate, and
certain personnel by their educational credential were qualified in these knowledge areas.
Following this train of logic, higher education serves to validate the degree
requirement. Growth in workforce education can be explained through legitimation
theory in the active role that education as an institution plays in establishing new or
additional credentialing for fields that were formerly learned on-the-job. In addition,
legitimation theory serves to affirm that educational institutions confer status overall, and
that within the status hierarchy, the transfer credential remains the more prestigious and
desired credential because of the perceived societal belief that this credential will
“allocate people to positions of higher social status” (Meyer, 1977, p. 74).
Policy theories – incremental theory, group theory, and political, terminal, and
hidden agendas. If legitimation theory can be presented as an explanatory framework for
the growth of occupational/technical fields in higher education, policy theory can be cited
as well, particularly in the framework of the decision theory known as incremental theory
and the public policy theory known as group theory. Anderson (as cited in Goodchild,
Lovell, Hines, & Gill, 1997), summarizes incremental theory in several steps that clearly
indicate the shifting nature of decision making, in contrast to a rational approach to
decision making that presumes a concrete, structured approach with fully-informed

34
policy leaders. The rational approach would presume that the leader is confronted with a
discrete problem that can be assessed individually from other problems and subsequently
translated into a clear action plan. The incremental approach better reflects reality. A
summary of Anderson’s (as cited in Goodchild et al., 1997) description of the steps in
incrementalism follows:
1. Policy leaders are confronted with intertwined problems that cannot be
assessed independently using empirical data.
2. Solutions to the problem are not exhaustive and resemble existing policies.
3. Consequences for each solution are not examined exhaustively.
4. As solutions are being considered, the problem keeps being redefined.
5. The solution is achieved through compromise rather than consensus.
Anderson (as cited in Goodchild, et al., 1997) concluded, “Incremental decision
making is essentially remedial and is geared more to the amelioration of present, concrete
social imperfections than to the promotion of future social goals” (p. 179). With that
conclusion and Anderson’s steps in mind, the recommendation for more funding for
community college workforce development programs may be portrayed as an example of
incremental decision making:
1. The “problem” is complex. Jobs are being outsourced, technology is evolving,
and a clear distinction is not being made between the need for job creation
versus job training. Workforce development education itself is a conglomerate
of courses and programs that cross the non-credit and credit boundaries.
2. Workforce development education is only a partial solution to the problem if
in fact the problem encompasses both job training and job creation.

35
Moreover, workforce development training is in place, so proposing more
money for this area is not a radical departure from existing policy.
3. The consequences of allocating more funds to workforce development
education do not appear to have been fully explored. For example, have
students been asked what they want? As cited in Cohen and Brawer (2003),
the 1986 CSCC survey of students indicated that 16% in workforce
development education coursework did not know that they were enrolled in a
workforce development program, and 26% indicated that they were going to
transfer. How would current students respond to a similar survey?
4. The “problem” is being redefined through the continuing debate over the
proper allocation of funding.
5. No clear-cut solution to the complex problem appears to exist, and any
solution that is applied is predicted to be one of authority or compromise
rather than of consensus, given the continuing controversy over the problem.
6. Finally, recommending more funds towards workforce development education
is clearly a remedial rather than a progressive move if programs are not
particularly effective and graduates are not obtaining employment in their
fields.
The public policy theory known as group theory also may be used to explain the
workforce development education funding recommendations. The premise of the theory
is that “interaction and struggle among groups is the central fact of political life”
(Anderson as cited in Goodchild, et al., 1997, p. 183). As groups achieve power, public
policy represents their interests. With that in mind, an analogy can made with the

36
struggle for resources between groups that advocate workforce development education
and groups that advocate the traditional transfer track. Under the current state and
national administration, policy leaders have placed workforce development education as
a primary function of community colleges. By inference, utilizing the premises of group
theory, workforce development is the interest of the dominant group. A weakness of
group theory is that, like functionalism, it tends to oversimplify the situation. Anderson
(as cited Goodchild, et al.) argues that group theory overstates the importance of groups
at the expense of the power of the individual public official in developing policies.
Palmer (1987) provided additional insight on policies, or agendas, related to
workforce development education. He introduced these agendas with the note that they
were held based on the assumption that within community colleges, discrete curricular
tracks existed for students, including the transfer track, the vocational track, and the
continuing education track. Focusing on vocational education, he described three
agendas: the political agenda, the terminal education agenda, and the hidden agenda.
As described by Palmer (1987), the political agenda underscores the policy
leadership statements cited in Chapter 1, in that workforce development education is
viewed as the means by which people will be effectively and readily trained to enter the
workforce. Students who pursue this track have as their primary goal to attain job
training and not to further their education.
Summarized by Palmer (1987), the terminal education agenda stemmed from
early proponents of junior colleges and was upheld by the American Association of
Junior Colleges (AAJC). The presumption was that a number of students were not truly
suited for college. The vocational track was to serve as an honorable exit from education

37
with the benefit of providing training for the workforce. In promotion of this agenda, the
AAJC convened the Commission on Junior College Terminal Education, about which
Palmer proclaimed a lasting influence on vocational education direction: “Essentially,
the Commission saw in postsecondary vocational education a means of streamlining the
transition from school to work while at the same time performing the humane task of
steering less able students away from overambitious academic goals that would probably
lead to failure” (p. 14).
Although the overt intent of the terminal agenda apparently was beneficial, a
critique was provided by those who drew a relationship between large numbers of
minority and lower-income students in two-year institutions to deduce a hidden agenda to
channel these students away from upward mobility by placing them in vocational,
“terminal” tracks. In his overview of this position, Palmer (1987) noted that although
challenged, this agenda has been accepted as fact by many.
Palmer (1987) proposed and concluded that all three agendas, political, terminal,
and hidden, were based on the assumption that the curriculum could be divided into
discrete segments. Based on student survey results, he found that student intentions did
not support the construct.
The theoretical strands above provide possible explanations for the growth and
sustained momentum of workforce development education in the community college
curriculum. The next section traces the growth of workforce development education
concomitantly with the rise of the junior college movement to its present day mission.

38
The Growth of Workforce Development Education and the Community College Mission
Institutions that offered two years or little more of higher education may have
been around almost as long as higher education itself has existed in the United States.
However, formally planned two-year colleges were not really in existence until the end of
the nineteenth century. According to Ratcliff (1992), this time frame may in part be
attributed to the perception that education was an individual responsibility rather than a
national imperative. He indicated that social, economic and political factors as well as
local support all were influential in the successful founding of new public two-year
institutions.
Like Ratcliff (1992), Cohen and Brawer (1996) and Witt, et al. (1994) cited social
and economic factors as having primary influence on the growth of two-year institutions.
Specifically, they attributed the need for workers, the extended adolescence, and the
demand for social equality as contributing to the growth of the movement. In essence,
the movement’s origins could be argued to stem not only from the “populist” reaction of
the late 1800s against the lack of access to higher education, but also the “elitist” desire
to limit the university mission to research and specialization rather than to general
education (Cohen & Brawer, 1996; Ratcliff, 1992; Witt, et al., 1994).
The socioeconomic factors immediately proceeding and subsequent to the Civil
War that were integral to the birth of the junior college movement also contributed to the
growing shift overall in higher education curriculum from a classical one to a more
pragmatic one. Various legislative acts underscored this shift, the Morrill Act of 1862
being one of the earliest. Geiger (1986) referred to the Morrill Act as one of the two
sources providing impetus to the “notion that colleges should teach subjects that would

39
have some practical utility for their students”; the other source was the growing use of the
elective system (p. 5). The Morrill Act authorized the set aside of federal land for the
establishment of colleges whose primary mission would be to offer coursework related to
agriculture and mechanic arts.
Acceptance of a “vocational trend” in higher education was not easily attained.
The place of vocational education was a matter of debate at one of the earliest meetings
of the organization that ultimately was to become the South’s regional accrediting
agency, the Southern Association of Colleges and Schools. At its fourth meeting, Charles
Dabney, president of the University of Tennessee, presented the findings from his study
of the curriculum of the member colleges. He referred to the college requirements for the
Bachelor of Science degree as a “hotchpotch,” and he recommended distinguishing
“sharply” between the technical and professional degrees in the Bachelor of Arts program
and those offered in the Bachelor of Science (1898). In spite of Dabney’s disparaging
remarks about the state of Bachelor of Science degree programs, he actually was an
advocate of vocational education. In his follow-up study at the next meeting of the
Association, Dabney commented on the lack of appreciation for scientific and technical
education, and referred to the “poverty of equipment and the meagerness of the teaching
staff as being the main trouble” (1899, p. 9). In his presentation, he clearly cited the need
for scientific and technical education, given the impoverished state of the South, and he
recommended that the scientific and technical schools be held to the same standards as
liberal arts schools.
The spread of vocational education, therefore, had its advocates even at the
“elitist” levels. By 1914, additional legislation supporting vocational education was

40
being enacted. The Smith-Lever Act of 1914 added to the Morrill Act by allocated
federal financial aid for agricultural colleges to offer extension work in agriculture and
home economics. Specifically, the purpose of the act was “to provide for cooperative
agricultural extension work between the agricultural colleges in the several States
receiving the benefits of an Act of Congress approved July second, eighteen hundred and
sixty-two” (Smith-Lever Act, 1914). The second major act, the Smith-Hughes Act of
1917, directed funding primarily towards secondary education, but it established a
Federal Board for Vocational Education. Its specific intent was “to provide for the
promotion of vocational education” (Smith-Hughes Act, 1917), which ultimately became
one of the three major missions of community colleges.
The need for workers provides one of the earliest reasons for including the
vocational, or, in the early days, “terminal” track in the two-year institutional mission.
The extensive industrial growth following the Civil War along with an increase in the
number of high school graduates provided an impetus to develop institutions that could
increase the access to higher education as well as to respond to community needs for
trained workers. The socioeconomic need, therefore, was in place.
This same socioeconomic need that helped provide the impetus for increased
growth of the pragmatic curriculum into the overall postsecondary curriculum also
provided the impetus for the formal development of junior colleges. Just as Meyer
(1977) and Roemer (1981) might present the legitimating influence of the educational
institution upon the rise of workforce development education in the overall postsecondary
curriculum, Anderson (as cited in Goodchild, et al., 1997) could make a case for
incrementalism in terms of the rise of junior colleges. The problem was a complex one

41
involving both educational leadership roles, socioeconomic conditions, and the increasing
demand for higher education. While more pressure was coming to bear to provide
postsecondary education, universities were reluctant to accommodate the growth based
on a shift in mission focus to emphasize research over teaching (Cohen & Brawer, 2003).
On the other hand, the overall solution to the rising educational demand does not appear
to reflect incrementalism by being remedial in nature. Over the span of the twentieth
century, the growth of junior colleges represented a significant and progressive departure
from existing institutional structures.
The junior college movement spread in the Midwest and the West. Unlike the
East, where small four-year institutions had been established for some time and “public”
education was considered to be “second rate,” the Midwest and the West accepted the
new junior college model or expanded high school. Another practice was to “decapitate”
existing four-year institutions that were struggling to maintain enrollment by limiting
them to the first and second years (Witt, et al., 1994).
The early decades of the twentieth century continued the trend of industrial
growth and migration from rural to urban settings. Concomitantly, the demand for low-
cost higher education continued to increase as well as the demand for more vocational
education courses. The Great Depression also contributed to vocational education in the
expanding junior college movement. The Federal Emergency Relief Act of 1934 allowed
for the creation of emergency junior colleges, which included a wide range of vocational
education offerings. As Witt, et al. (1994) point out, by having junior colleges available
and affordable, unemployed workers were temporarily removed from the overtaxed
workforce pool while they acquired necessary skills to be competitive.

42
World War II provided another milestone to the movement, particularly with the
passage of the GI Bill in 1944. Like the Federal Emergency Relief Act of 1934, Witt et
al. (1994) describe the GI Bill as a government social engineering program that kept
returning soldiers from overburdening the economy by flooding the workforce. Instead,
returning soldiers went to school, and community college enrollment jumped by more
than 100 percent. Three years later, the Truman Commission Report pushed the junior
college even further forward by calling for a network of public community colleges.
Although the now “junior/community” college movement was to suffer setbacks in the
1950s, the momentum was irreversible.
Proceeding with the second half of the twentieth century, Cohen and Brawer
(2003) discussed 1964 as a time when a “tide of vocational education programs was
beginning to inundate the two-year colleges” (p. 219). As they noted, the basis for this
growth could be traced to the 1963 passage of the federal Vocational Education Act and
the subsequent funding directed toward vocational programs. They commented further
that in acknowledgement and support of this funding, the American Association of Junior
Colleges (AAJC) called for a greater emphasis on vocational and occupational education
in the junior college curriculum, a trend which continues through the organization’s
existence. As mentioned in Chapter 1, AACC, modern incarnation of the AAJC, is
emphasizing the importance of the occupational curriculum in the community college
curriculum today.
Cohen and Brawer (2003) described the continued rise of vocational education in
the community college curriculum in the second half of the twentieth century as being
caused by multiple factors. The sustained influence of early leaders of the two-year

43
college movement; the federal vocational education funding acts from 1963 and on; the
growth rate of two-year institutions; the growing and increasingly diverse student
population, which began to include more women, part-time, disabled, disadvantaged, and
older students; the change in the curriculum, which began to include programs previously
held by secondary institutions; and the change in the labor market all contributed to the
increase of vocational education in community colleges.
In present times, the generic community college mission can be described as
typically including a liberal arts component, a non-liberal arts component, and a non-
credit continuing education component, which includes workforce development, in the
coursework offered (Bragg, 2001a; Cohen & Brawer, 2003). The liberal arts component
consists of coursework within the broad framework of humanities and communications,
social and behavioral sciences, and natural sciences. In Florida, this coursework
generally is the basis for the A.A. degree and for the introductory coursework in the
majors in these fields. The non-liberal arts component consists of coursework that is
professional, occupational, or vocational in nature. In Florida, along with a core general
education requirement consisting of liberal arts courses, the combination of non-liberal
arts classes and liberal arts classes generally is the basis for the A.S. degree. Non-liberal
arts classes alone may constitute the basis for the Associate in Applied Science (A.A.S.)
degree and for occupational certificates. Finally, the continuing education component
consists of a variety of courses spanning from those necessary to prepare students for
entry-level employment, to upgrade skills, to maintain certification in a field, or to
explore recreational and leisure opportunities. The degree to which each of these

44
components is represented in individual community colleges nationally and in Florida
varies according to factors such as local needs, state mandates, and historical directives.
In the case of workforce development education, comprising the vocational,
occupation, and professional coursework offered in community colleges, the continuum
described by Clowes (1996) seems apparent. In addition, many educational and state-
level leaders would concur that a better system could be in place. Bragg (2001a; 2001b)
is among many advocates of the “new vocationalism” who are calling upon governmental
and educational leaders to look to new models that better articulate secondary and
postsecondary programs in order to provide a seamless educational experience for
students from entry to senior levels in the workforce. The next section provides an
overview of the new vocationalism.
The New Vocationalism
Vocationalism has had a role in higher education arguably since the
implementation of the land-grant universities. As Lynch points out, early vocational
programs were designed to prepare “blue-collar-type students with practical skills for the
nation’s farms, factories, and homes (2000, p. 1). Bragg (1997, 2001a) places the origin
of the modern era of vocational education in the 1960s, when the Vocational Education
Act of 1963 made federal funding available for vocational programs in higher education.
However, these traditional vocational education programs tended to be limited in scope;
their missions were to train workers for specific, entry-level employment. Because of the
limited scope and its association with low standards, traditional vocational education was
criticized for channeling its recipients into low-status, low-income jobs and,

45
consequently, contributing to a perpetuation of race, ethnic, class, and gender divisions
(Grubb, 1997a). Moreover, not only was traditional vocational education unsatisfactory
to its recipients, but also Grubb (1997b) noted that by the 1980s, the business community
was expressing dissatisfaction; traditional vocational programs simply did not produce
workers with the types of thinking skills and problem-solving abilities that were needed.
Grubb (1997) links the origins of the new vocationalism to the publication of A
Nation at Risk in 1983, which dramatically called attention to the failings of higher
education in producing a competent workforce (National Commission on Excellence in
Education,1983). In contrast to traditional vocational education, the new vocationalism is
learner-centered and focuses on holistic career development, rather than training for
specific, entry-level jobs. According to Bragg, “the new vocationalism emphasizes
career clusters or pathways that extend from the entry level to the professional level in
career fields integral to the new economy (2001b, p. 8). Lynch (2000) notes the
requirements of industry and technology, and speaks to the academic and general
education contributions in the following description:
This reformed vocational education is characterized with a curriculum based on
the need for students to demonstrate mastery of (1) rigorous industry standards,
(b) high academic standards and related general education knowledge, (c)
technology, and (d) general employment competencies. In addition, the
curriculum seems to be teaching students all aspects of an industry i.e., in contrast
to just a specific job skill(s). (p. 2)
Bragg (2001b) also describes new vocationalism as an integration of academic
and technical concepts. An effective integration incorporates a continuum of vocational

46
education in the K-16 educational system, going from general career exploration in
middle and high school and moving to more specific career clusters in higher education.
This career cluster approach enables the student to explore occupations from the entry
level to the advanced level, which demonstrates the career ladders available. In the
exploration of career clusters and their ladders, the curriculum covers the industry
comprehensively, so that students learn how occupations are linked from the basic level;
for example, technician, to the advanced level, such as scientist. Finally, the new
vocationalism engages constructivist teaching strategies and learner-centered, applied
approaches.
Orr (2001) also notes the need for the seamless K-16 transition, and describes the
manner by which higher education can effect seamlessness via collaborations with
secondary schools through dual enrollment mechanisms and accelerated college credit;
with other higher education institutions through mechanisms such as articulation
agreements, and with business and industry in terms of tailoring programs to meet their
needs. On that note, authors caution against letting business drive reform. For example,
Grubb notes, “the forms of the new vocationalism that require education to be driven
solely by the requirements of employers and the demands of the 21st century labor force
should be particularly suspect: no one can forecast what these demands will be (1996, p.
9).
Gregson (1997) echoes the caution. He believes that the new vocationalism can
aid in social reconstruction, but care needs to be taken to avoid reinstating old problems
with new solutions. In letting the business community set the educational agenda, the
teaching profession has become deskilled and the curriculum becomes too prescribed. In

47
that respect, the new vocationalism has not changed from the old vocational education
methods, and more is done to keep the workplace and work systems the same rather than
to effect positive change in the workplace. As he states, “When vocational educational
curriculum developers utilize only occupational experts through both task analysis and
DACUM to make decisions for an about those who lack their industrial knowledge, they
use vocational education as an instrument for perpetuating the existing industrial regime
instead of operating as a means for its transformation” (p. 128).
Owens (1997) reinforces Gregson, indicating that teachers will need to assume
greater mentoring and coaching responsibilities in the new vocationalism. Included in
these expanded roles are the parts that students, parents, and the community in general
play. Students in the new vocationalism track will also not only need more education,
but education that includes critical thinking skills, collaboration techniques, technological
education, and social and global engagement. Finally, because modern learners are
affected by a much broader array of problems than learners of the past, the family and the
community in general will need to become more involved with the student to make the
educational experience effective.
In his discussion of the new vocationalism, Lynch (2000) indicates that few
institutions have implemented such programs: “Only about 10 percent created structured,
career-focused, comprehensive programs that integrated academic and career and
technical courses, moved to broadly defined career clusters or majors, and grouped
students together for career and academic classes” (p. 13). Phelps (1997) suggests that
problems in adopting the new vocationalism could be related to a failure to engage
stakeholders and achieve local consensus. In addition, he believes that educators may be

48
looking for “simple and quick-fix solutions . . . while ignoring the important steps of
building a shared local understanding of why new education-and-work initiatives are
needed.” (Phelps, p. 22)
Conflicting opinions clearly are apparent in higher education regarding the place
of new vocationalism, how effectively it can be or is being implemented, and whether or
not business should “drive the train of reform.” Regardless of the appropriateness of
business directing educational reform, business and educational leaders both are looking
at community colleges as being a logical vehicle for the delivery of new vocationalism.
Gleazer (1998) provides several characteristics associated with superior community
colleges, including the following: (a) they are adaptable; (b) they are continually aware of
their communities; (c) they have ongoing relationships with learners; and (d) they provide
opportunities for the “unserved.” The first three characteristics have a common theme of
responsiveness: the hallmark of the community college mission is responsiveness to
local needs, and now, national needs in terms of keeping pace with the global economy.
With the fourth characteristic, by providing the new vocationalism, community colleges
are providing opportunities to not only the “unserved” but also the “underserved”;
ostensibly, the new vocationalism will avoid the pitfalls of the faltering “welfare-to-
work” programs.
Grubb (1997a) speaks directly to the ability of community colleges to implement
the new vocationalism through their offerings of “coherent programs” rather than through
fragmented courses. Community colleges also have the option of offering the new
vocationalism through their relationships with business and industry, including
employment agreements. In contrast to training and welfare-to-work programs, with

49
their regimented “skills and drills” approach, community colleges are incorporating
learner-centered approaches.
As mentioned in Chapter 1, Bragg (2001b) emphasizes that many of the
arguments for or against vocational education lack the data to support them. Rather,
decisions have been made based on politics and ideology. In order to steer community
colleges appropriately, she urges leaders to look at the new ideas and models being
proposed under the auspices of new vocationalism. However, the task for leadership may
be a considerable challenge, given the scope of programs that may apply to the new
vocationalism, their lack of ordered categories, and the fluid and flexible tracks that
students take through their educational experiences, as will be seen in the following
section.
Workforce Development
The new vocationalism theme pertains to programs that allow students to move
from entry level positions to senior level positions. As defined in this study, community
college workforce development education programs embrace this theme. As mentioned
earlier, community college workforce development education falls along a continuum of
vocational, occupational, and professional courses and programs and are inconsistent
from college to college. In looking at a broader array of workforce development, the
categories are even less neatly ordered. Grubb (2001) discusses the systems of workforce
development in place, or, in his words, “the confusing array of employment and training
programs” (p. 29). Interestingly, Grubb notes that although programs may be similar,
few actually duplicate each other, in part because of the networking and communication

50
that takes place between program administrators. He provides a general description of a
typical state workforce development strategy: a state agency is created and given a set of
responsibilities on a statewide level. Local agencies are responsible for implementing
state policy.
Zemsky, Shapiro, Iannozzi, Cappelli, and Bailey (1998) also speak to the
“confusing array” and disagree to some extent with Grubb’s comment on the lack of
duplication. In their view, the United States has a plethora of “competing organizations
and agencies often in pursuit of the same objective” (p. i). This plethora, along with the
decentralized organization of the United States, has prevented the formation of an
educational infrastructure that can provide clear direction to students in their path from
the K-12 system to working life. In addition, they comment that “curricula frequently
combine, confound, even confuse academic and vocational pursuits at both the secondary
and tertiary levels” (p. ii). In section seven of the authors’ report, they tackle the analysis
by providing a matrix of major federally-funded programs that are associated with work
and schooling. The matrix is organized along four lines: programs that facilitate
transitions, programs that improve education and training efficiency, programs that
reduce labor market uncertainties, and programs that build networks. They then
categorize 18 programs according to this matrix. The authors note that many of the
programs cross over into more than one line, and to make the project manageable, the
programs are categorized by their primary goal and their major source of revenue.
Education and government leaders who are interested in applying the new models and
programs being proposed under the auspices of new vocationalism, as Bragg (2001b)

51
recommends, may wish to focus on those programs that are working to ease transitions
from education to working life or to a career ladder path first and foremost.
Students play a part in the “confusing array” of workforce development
opportunities as well because of their lack of conformity to college-prescribed roles:
“Although state systems and individual colleges classify academic programs as transfer
or nontransfer and assume students will behave accordingly once they complete the
program, many students behave as though these classifications or tracks do not exist”
(Townsend, 2001, p. 69). For example, originally, in the manner of traditional vocational
education, most Florida community college programs considered to be workforce-
development related were non-transfer. Depending on the type of program, they could be
non-credit as well, such as are the postsecondary adult vocational programs, which are
intended to provide training for students who are already in the workforce. However,
increasingly, students in the credit, traditionally non-transfer associate degree programs
are in fact transferring to upper divisions. The implications of this pattern are at least
two-fold: community colleges are motivated or even pressured to articulate these
programs with their upper division counterparts, and community colleges are required to
hire faculty members who have a master’s degree and 18 hours in the discipline being
taught once non-transfer courses become designated to be transfer courses.
The current Florida workforce development system is divided among federal,
state, and local sectors and includes public, private, and nonprofit agencies. As described
in the OPPAGA February 2004 Information Brief, workforce development agencies
“share a common goal of providing training and employment services that enable people
to become or remain economically self-sufficient, as well as promoting Florida’s
52
economic growth by providing employers with trained workers” (p. 1). OPPAGA
described the workforce development system as being complex. In addition to entities
within the Department of Education, training occurs in multiple entities for specific
populations, including the Department of Corrections, the Department of Elder Affairs,
and the Department of Juvenile Justice. The workforce development system funding
flow involves at least eleven entities. For the casual reader, this system meets Grubb’s
(2001) criteria of constituting a “confusing array.”
The workforce programs in the community college system include the following
categories: (a) Adult Basic Education and GED Preparation; (b) Postsecondary Adult
Vocational Certificates (non- college credit occupational training); (c) Applied
Technology Diplomas (occupational training offered by a vocational-technical school or
community college and guaranteed to transfer to an A.A.S. or A.S. degree); (d) College
Credit Certificate (stand alone certificate, also part of an A.A.S. or A.S. degree, 1 year or
less); (e) A.A.S. (two year occupational degree); (f) A.S. (two year occupational degree
with general education transferable to a state university); (g) Applied Technical
Certificate (certification beyond the A.A.S./A.S. degrees); and (h) Continuing Workforce
Education (non-credit courses for updating skills) (Florida DOE, 2004a). Although these
programs were originally considered “terminal,” within the past five years, the A.S.
degree now has several state articulated degree options with senior institutions (Statewide
Articulation Manual, 2004). Through a statewide career ladder agreement, Florida public
community college A.S. degrees in radiography, nursing, hospitality and tourism
management, electronics engineering technology, business administration, computer
engineering technology, and criminal justice technology will articulate with Florida

53
public university degree programs in associated areas. Another option in the agreement
is that any regionally-accredited A.S. degree program may articulate into a bachelor’s
degree in applied science. Yet another is that A.S. degrees in certain emphases in
technology may articulate into a bachelor’s degree in technology teacher education.
Finally, through a statewide interdisciplinary capstone agreement, A.S. degree graduates
from Florida public community colleges may articulate with individual public and private
universities through capstone agreements. Florida Gulf Coast University, for example,
offers a capstone arrangement with its B.S. in legal studies. The requirements to
articulate are that students must hold an A.S. in Paralegal Studies or Legal Assisting.
Workforce development programs in Florida continue to evolve. Consistent with
the auspices of legitimation theory, community colleges are playing an active role in the
growth of specialized certificates and degrees. In a similar vein, the articulation of the
A.S. degree may add to the status of that degree and draw students who might otherwise
choose the A.A. degree as one that would confer higher status.
The changing relationship of the workforce and transfer degrees in Florida has a
long history. The next section explores the growth and development of community
colleges in Florida, particularly with regard to the relationship of vocational education
and the Florida community college mission.
The Florida Community College and the Role of Vocational Education
Like the rest of the South, Florida was an impoverished state following the Civil
War. Consequently, facilities for the furtherance of higher education were limited at best.
Florida, for example, does not even merit an index reference in Frederick Rudolph’s

54
classic work, The American College and University (1962). Nevertheless, the two
seminaries that ultimately were to become the University of Florida and Florida State
University were established by the mid-1800s (Hale, 1966, Stakenas, Mock, & Eaddy,
1984). Additionally, the establishment of the Association of Colleges and Preparatory
Schools of the Southern States in 1895 (later, the Southern Association of Colleges and
Schools) demonstrated a concerted effort on the part of regional educational leaders to
improve the quality of education. The purpose of the Association was to organize higher
education in the South, to raise the standards of scholarship, to recognize preparatory
schools officially, and to prevent higher education institutions from engaging in
preparatory work (Association of College and Preparatory Schools of the Southern States,
1895).
A review of the first years of Association proceedings indicates that the charter
members were indeed serious about raising the quality of education in the southern states.
For example, after the first year, research papers and opinion pieces on the state of
education in the South were presented at the annual meetings. Mentioned previously,
Dabney (1898, 1899) conducted curriculum analyses that revealed a lack of consistency
in program structure and offerings. Babbitt (1901) continued the “laboratory work on
college catalogs” initiated by Dabney and others. He demonstrated how southern
educational institutions lagged behind the rest of the nation. Of particular relevance to
this paper, Babbitt called for the development of junior colleges in the South from the
many mid-range institutions that functioned on a level somewhat between a high school
and a two-year college institution: “Their work would be condensed and strengthened if
they were organized on a type something like what President Harper has discussed under

55
the name of junior colleges” (p. 70). Notably, this was also the first mention of junior
colleges in the proceedings of this Association.
Arguably, the junior college movement was limited at best in Florida until the
1940s, and especially in the 1950s when legislation enacting public junior colleges was
passed. However, at least one author makes a case that two-year higher education
institutions were established as early as 1907 (Hale, 1966). Hale (1966) credited Palmer
College as being the first junior college in Florida, opening in DeFuniak Springs under
Presbyterian guidance in 1907. He also described four African-American institutions
operating between 1918 and 1930. These were also church-based and eventually became
four-year institutions. For all five institutions, vocational education was rudimentary at
best:
All of these five early junior colleges had limited enrollments, operated in
conjunction with a secondary program, experienced severe financial problems,
and for the most part used the meagerest of facilities. Their programs were
largely academic with but the beginning of some terminal work. (p. 1145)
In his dissertation, Hale (1966) traced the history of 54 institutions that he
credited with being junior colleges at some point in their history. Two of the earliest that
were formally designed to be junior colleges were St. Petersburg Junior College (now St.
Petersburg College) and Palm Beach Junior College. Established in 1927, an early
vocational mission of St. Petersburg Junior College was to train teachers. Like other
colleges nationally, St. Petersburg Junior College was informally “accredited” by a major
university, in this case, the University of Florida. Ultimately, the College attained

56
accreditation from the Southern Association of Colleges and Schools in 1931 (Hale,
1966).
Palm Beach Junior College was the first public junior college established in
Florida. Although its vocational function was described in its first catalog in 1939, the
university transfer function remained the dominant purpose of the college in its earliest
years. Both colleges were established utilizing the Harper plan; that is, they functioned
as extensions of their local high schools (Hale, 1966).
Of the junior colleges that Hale (1966) described, many, like Palm Beach Junior
College, had an element of vocational education; that is, at least one or two courses were
offered in secretarial sciences or business. Part of the explanation for the weak
vocational mission was that precollegiate institutions, both public and private, had
already assumed responsibility for delivering vocational coursework. Stakenas, et al.
(1984) traced the development of vocational education in Florida from before 1917 to
1980. Early Florida settlers had access to minimal education: apprenticeship training,
common schools, and private academies were typical of the first decades of the 1800s.
Following the Civil War, public education struggled because of weak financial resources.
The adoption of segregation legislation in 1869 led to the development of vocationally-
based school systems for African-Americans. According to Stakenas, et al., the
establishment of these “industrial normal schools” had dire consequences:
As teachers, the graduates taught as they were taught, so that black children
received a public school education based on the Hampton-Tuskegee manual labor
concept. This had a devastating effect over time. The teachers were taught the
theory of industrial trades but not the skills to practice them . . . Study in the

57
industrial normal schools failed to provide access to the economic benefits which
blacks sought . . . The kind of education they were exposed to, especially in the
rural areas, only enabled them to work in domestic and service occupations much
like those experienced by their ancestors who had been slaves. (p. 18)
Mentioned earlier, with the implementation of the regional accrediting agency,
efforts toward improving and standardizing the curriculum increased. However, even
had the teachers of the industrial normal schools been taught the skills in addition to
theory, resources for vocational education remained quite limited. Stakenas, et al. (1984)
stated that no real vocational education program existed in Florida’s education system
until the authorization of the Smith-Hughes Act. In their estimation, the “seed money”
provided by the federal funds helped create “moral, political, and additional financial
support that enabled schools either to initiate or to increase their vocational course
offerings” (p. 86).
Federal funding for vocational education weathered the Great Depression, but in
Florida, these programs remained predominantly under the jurisdiction of secondary
schools. As mentioned in Chapter 1, Stakenas, et al. (1984) reported that Florida two-
year institutions did not share the growth caused by defense-related coursework; this
curriculum was managed through trade schools. Moreover, Florida junior colleges often
shared facilities with vocational schools, with occasional conflict over ownership of
programs. Hale (1966), for example, detailed the friction between Orlando Junior
College, Orlando Vocational School, and the local defense training school in 1941.
Orlando Junior College, an infant, private institution, barely survived the fight,
particularly after being accused by the local media of being a “sacred cow” (p. 368).

58
Orlando Junior College rallied and existed until Hale himself, president of the institution
since 1949, closed it after losing a final battle over the establishment in 1967 of Valencia
Community College, a state-planned and locally-supported public institution (J.
Wattenbarger, personal communication, April 8, 2002).
Junior colleges likely would have continued to play a small part in offering
vocational education in Florida except for the passage of the Minimum Foundation
Program law in 1947. This law provided for single district boards of public instruction in
each county and authorized the addition of kindergarten and public junior college levels
of education. However, a statewide system for organizing the junior colleges was not
implemented until 1955, when the Community College Council was convened and a plan
formulated (Witt, et al., 1994). As summarized in Chapter 1, the director and secretary of
the Council, James L. Wattenbarger, laid the groundwork for the long-range plan with his
1950 doctoral dissertation (Wattenbarger, 1950). In his subsequent publication, A State
Plan for Public Junior Colleges, (Wattenbarger, 1953), discussed the junior college
philosophy as being followed in Florida except that the transfer function was by far the
predominant function rather than the vocational one.
Indeed, of the first group of public community colleges established since 1955,
only white Daytona Beach Junior College and its counterpart, African-American Volusia
Junior College, had strong vocational education programs, primarily because these
institutions partnered with the existing, segregated vocational schools in Volusia County.
Even so, Daytona Beach Junior College enrollment was nearly triple that of Volusia
Junior College’s. In fact, the ten public African-American junior colleges that were
established ultimately were absorbed by their white counterparts, and most had

59
vocational education programs limited to secretarial science and business courses (Hale,
1966).
Part of the vision of the Community College Council and James Wattenbarger
was to strengthen the place of postsecondary vocational education in the junior college
system. Cited in Chapter 1, Wattenbarger (1953) disparaged the duplication of efforts
between the Florida junior colleges and vocational schools.
Stakenas, et al. (1984) also described the controversy between the budding junior
college system and the vocational schools. As they stated, “the growing demand for
well-trained technicians and paraprofessionals convinced junior college officials to
assume greater responsibility for vocational and technical training . . . but junior colleges’
curricular changes were slow and piecemeal” (p. 164). In fact, secondary school
vocational educators attempted to convince the legislature to authorize the construction of
area vocational centers, and ultimately, the Area Vocational-Technical Centers Act was
passed in 1963 (Stakenas, et al., 1984). This new law obviously only exacerbated the
situation for junior colleges and postsecondary vocational education programs. In a
further blow to the junior colleges, the Senate Committee on Education gave the State
Board for Vocational Education the authority for secondary and postsecondary vocational
and technical training, which meant that the Division of Vocational, Technical, and Adult
Education had authority over the State Junior College Board in vocational education.
However, the notion that the junior colleges were “comprehensive” rather than “transfer”
institutions was well understood and embraced by Florida junior college supporters, and
they refused to relinquish the postsecondary junior college vocational program (Stakenas,
et al., 1984). In fact, the notion of a “comprehensive” rather than “transfer” mission

60
provided the rationale for changing “junior” to “community” for most of the nation’s
two-year postsecondary institutions (Witt, et al., 1995).
In an interesting turn of events, the Florida legislature invited a consulting firm
headed by one of the major national leaders of the junior college movement, Doak
Campbell, to consult on the situation in Florida. The consultants’ report foreshadowed
the proponents of the “new vocationalism” in that they proposed that vocational and
general education should not be treated distinctly. They recommended making better use
of existing facilities rather than building new area vocational centers. They also
questioned the need for a separate state entity, the Division of Vocational, Technical, and
Adult Education, to administer vocational education programs, contending that it created
an “artificial separation of program content and administration” (Stakenas, et al., 1984, p.
167). Perhaps not surprisingly, area vocational center supporters criticized the report:
Critics . . . believed that the study’s findings were based on the false premise that
vocational and general education were not separate entities. This belief, they
claimed, predetermined the study’s endorsement of concentrating postsecondary
vocational-technical training in the junior colleges – institutions which they
claimed had a poor record of providing vocational education. (Stakenas, et al., p.
167).
Ultimately, appropriations were increased both for Florida junior colleges and for
the area vocational centers, but the battle continued, which is to be expected when
funding was involved. Stakenas, et al. (1984) recounted this continuing battle up to the
early 1980s, and they closed with the remark that “unfortunately, the desired balance
between academic and vocational education remains to be achieved in Florida” (p. 191).

61
As discussed in Chapter 1, Florida community college presidents unsuccessfully
petitioned the Florida legislature in 2000 to give community colleges authority over all
postsecondary vocational education programs.
Summarized in Chapter 1, the findings of OPPAGA in its November 2001
program review of workforce development education programs included the fact that
most students did not complete programs in either the secondary or postsecondary
educational systems and that a number of programs existed within both systems with
fewer than five completers. The report also covered the “ongoing controversy” between
the community colleges and the school districts:
Community college proponents cite the different missions of the two systems and
numerous efficiencies associated with such a consolidation, while the school
districts note the success of the current program, the nature of students served by
school districts, and costs associated with consolidation. (OPPAGA, 2001, p. 55)
OPPAGA provided five options related to consolidating the two systems. Of
interest is the response of the Interim Chancellor of the Community College System to
OPPAGA about the current state of affairs:
With regard to governance models for the workforce system, about the only
consensus you will find, is that no one would design a system in this way. It has
evolved over the years through a series of political decisions that have diffused
ownership and commitment on the part of school districts and community
colleges. The funding history of the last five years alone should be sufficient to
prompt a new model. (OPPAGA, 2001, p. 82)
62
In its report, OPPAGA provided a program review of workforce development.
Other assessment methods include the analysis of the curriculum. The next session
provides a sampling of curriculum research that is germane to the current study.
Related Curriculum Studies
Examining the curriculum to determine actual patterns of behavior is not a new
method of research. Early records of the regional accrediting agency of the South, the
Association of College and Preparatory Schools of the Southern States (precursor to the
Southern Association of Colleges and Schools) contain numerous research papers in
which the authors analyzed catalogs of member institutions to determine patterns of
curriculum and program delivery. Mentioned previously, Dabney (1898), for example,
found that college requirements for the bachelor in science degree varied so extensively
that he referred to them as a “hotchpotch.” The extensive variation possibly reflects the
low status at the time of vocationally-related courses in higher education curriculum,
which retained an emphasis on the classics. Important to this status, and to the economy
of the South overall, Dabney clearly emphasized the need for scientific and technical
education in his 1899 follow-up study into the methods and equipment required for
completion of the bachelor in science degree (Dabney, 1899).
More currently, Breneman (1994) looked at liberal arts colleges specifically.
Assessing curricular changes from 1972 to 1988, he found that only about 200
institutions remain that could be classified as liberal arts colleges; that is, they award
“less than 60 percent of its degrees in professional fields” (p. 139). Many other colleges
63
may still maintain a liberal arts “tradition” but “little of the reality of a traditional liberal
arts institution” (p. 2).
Breneman’s standards may be too pure for many researchers; for example, Brawer
(1999) found that in community colleges, the liberal arts were stable and represented
more than 50% of the national offerings of community colleges. She derived this finding
from her analysis of the curriculum studies conducted by CSCC from 1975 to 1998.
Interestingly, she includes computer science in the liberal arts; Breneman may disagree.
Cohen and Brawer (2003) provided enrollment data from the National Center for
Education Statistics that showed an increase of terminal-occupational program
enrollments from 26% of the total enrollments to 35% of the program enrollments
between 1963 and 1975. The authors indicated that to extend the analysis beyond 1975
was problematic because of the shifting methods by which states classified programs and
enrollments, in part to accommodate vocational funding by making programs previously
classified as the liberal arts into vocational programs. That being said, and focusing upon
degrees awarded, the authors summarized the available data on program and course
enrollments. They estimated that 40 to 45% of the total degree-credit curriculum was in
“areas designed for direct employment” (p. 233).
Zemsky, Shapiro, Iannozzi, Cappelli, and Bailey (1998) also analyzed data
supplied from the National Center for Education Statistics and found an increasing trend
of vocationalization in higher education curriculum:
The purpose of pursuing a college or university education in the United States is
becoming decidedly more vocational. . . In the United States today, only 1 percent
of all four-year undergraduate students and a minimal percentage of all students

64
combined pursue degrees in either philosophy or religion. On the other hand, 16
percent of all undergraduate students pursue degrees in business, and 12 percent
major in fields leading to careers in health care. (p. 10)
Their analysis may be somewhat misleading. Philosophy and religion are
respected degrees, but their place in the liberal arts has not been paramount since the
decline of classical education. Letters and liberal studies, social and behavioral sciences,
and natural sciences are not mentioned in the authors’ analysis. Moreover, on the actual
data table (p. 11) 19% of all students are undeclared (the figure jumps to 26% for two-
year undergraduates). Business attracts at least 15% of the student body from the two-
year through the graduate level (health drops to eight percent at the four-year
undergraduate level), but education takes first place in the percentage of students at the
graduate and professional level.
Travis and Travis (1999) surveyed community college presidents specifically.
They reported on a general shift from a transfer to a comprehensive focus, but they
believed that community colleges would continue to maintain individuality as long as
their missions continued to respond to their respective communities. Travis and Travis
(1999) did report that workforce development represents one of the leading trends:
In concert with similar findings from other studies, renewing and maintaining an
updated workforce has become a major curricular category for community
colleges and is among the strongest trends indicated in the study. Based on the
rapid pace of technological and social change, continuous retraining of the
workforce is being regarded as the community college’s paramount responsibility
to the local community. (p. 24)

65
Badway (1998) examined the extent to which colleges integrated academic and
occupational aspects of their curriculum. Using a rubric entitled “Domains of Career
Preparation,” she evaluated seven aspects of integrated curriculum: job specific/technical
skills; foundation academic competencies; education for citizenship; career exploration;
utilizing systems; generic technical skills; and workplace organization. One third of each
state’s public two-year institutions were randomly selected. Based on her findings,
academic and vocational education were not well integrated, and she concluded that the
eight years of federal legislation had had little impact on community college curricula
with regard to effecting this phenomenon.
Frederickson (1998) conducted a study that profiled transfer students at North
Carolina based on their classification at their respective community colleges. General
descriptive information and a two-tailed t-test were utilized to compare mean values for
different variables from sample of technical students. Findings indicated that 70% of the
students were in transfer programs, and 30% were in technical programs. Findings also
indicated that transfer students were quite heterogeneous with regard to demographic and
academic traits. Following transfer, academic patterns became more similar, but students
still did not follow a prescribed time frame or narrowly defined plans of study.
Levin (2000) conducted a qualitative study that investigated seven sites or
colleges in the Pacific Western region. Including site visits and interviews, he also
conducted an analysis of documents. The study was longitudinal, with a 12 to 18 month
interlude between site visits. Based on the study, he found that a mission shift was taking
place with less emphasis on community social needs and more on economic needs. In his
words,

66
The evidence from this study suggests that the community college mission shifted
in the 1990s from serving local communities to serving the economy, specifically
serving the interests of capital by producing labor and reducing public sector
spending . . . This suggests that for the twenty-first century, community colleges
will function more on a model compatible with business norms: a fluid
organization, with little reverence for academic traditions, little evidence of a
dominant professional class of faculty and more evidence of a professional
managerial class, and greater reliance upon technology and less upon full-time
labor. (p. 7)
Levin’s remarks (2000) about the transition from a “dominant professional class
of faculty” to a “professional managerial class,” and especially the remark about the lack
of reverence to academic traditions, may help to explain some of the resistance of liberal
arts faculty to the workforce trend. The resistance of these faculty members may be a
holdover of the 19th century; faculty of the classics tradition deeply resented encroaching
utilitarian education.
Brown (2001) administered a survey to technical education administrators at
Texas two-year colleges. The survey queried the level of participation in “tech prep”
programs, or programs, as defined by Bragg (2001b) that “should prepare students for
college who might not [otherwise] pursue careers requiring postsecondary-level math,
science, and technological studies” (p. 10). Brown’s findings indicated that the majority
of Texas two-year colleges were active participants in the implementation and
coordination of tech prep programs, and almost 50% indicated that tech prep programs
had a moderate to significant effect on their own technical programs.

67
Three studies that are specifically relevant to the current one are Cohen and
Ignash (1994), Schuyler (1999), and Griffin (2002). The first two were conducted as part
of the Center for the Study of Community College’s periodic assessments of changes in
the community college curriculum. Utilizing a classification system that has been
slightly modified for this current study, the researchers tabulated the credit curriculum
from colleges that were randomly sampled from the Directory of the American
Association of Community and Junior Colleges. In each study, the percentages of
courses offered in each major discipline area were reported. Various other aspects are
reported as well, including, for example, the percentage of community colleges offering
liberal arts classes by institutional size. Cohen and Ignash (1994) reported on data
collected in 1991 and 1992; Schuyler (1999) reported on data collected in 1998.
Keeping in mind that the figures refer to credit curriculum only, the tables below
provide the portions of sections offered in the non-liberal arts and liberal arts
respectively. These tables are derived from Table 1.5 in Schuyler (1998, p. 12). These
tables are included in the literature review because they help illustrate a method by which
the data will be displayed in the current study.
In summary, for both the liberal and non-liberal arts credit curriculum, Schuyler
(2000) indicated, “All in all, other than some slight changes and shifts, the curriculum has
remained dominated by the same disciplines” (p. 11). The comparison of the non-liberal
arts credit curriculum between 1991 and 1998 included three new categories in 1998:
internships/practica, criminal justice, and military science. The total non-liberal art
categories represented were as follows: (a) technical education, (b) business and office,
(c) health, (d) personal skills/avocational, (e) internships/practica, (f) education, (g) trade

68
and industry, (h) engineering/science technologies, (i) marketing/distribution, (j) criminal
justice, (k) agriculture, (l) military science, and (m) other.
Table 1
Percentage of non-liberal arts sections offered (1998 and 1991)
Discipline
Percentage of total credit
sections in 1998 study
n=139,083
Percentage of total credit
sections in 1991 study
n=104,565
Technical education
Business and office
Health
Personal skills/avocational
Internships/practica
Education
Trade and industry
Engineering/science
technologies
Marketing/distribution
Criminal justice
Agriculture
Military science
Other
8.5
8.0
5.8
6.9
3.1
1.7
6.8
1.3
0.9
1.0
0.6
0.1
0.2
7.9
10.7
4.4
8.3
- -
1.1
8.1
0.8
1.5
- -
0.5
- -
0.14
Totals
44.9
43.4
Source: Schuyler (2000, p. 12). Provided with permission from G. Schuyler.

69
In 1991, the non-liberal arts curriculum represented 43.4% of the overall
curriculum whereas in 1998, the non-liberal arts curriculum represented 44.9%.
Technical education, business and office, personal skills/avocational, and trade and
industry sections were the categories with the highest percentages of sections for both
studies.
Table 2 provides the percentages of disciplines as they are represented in the non-
liberal arts curriculum for both studies. In areas of growth, technical education
represented 19.0% of the non-liberal arts curriculum in 1998 versus 18.2% in 1991.
Health represented 12.9% of the non-liberal arts curriculum in 1998 versus 10.2% in
1991. In areas of decline, business and office represented 24.6% of the non-liberal arts
curriculum in 1998 versus 17.8% in 1991. Personal skills/ avocational represented 19.1%
of the non-liberal arts curriculum in 1998 versus 15.4% in 1991.
Overall, the liberal arts curriculum remained stable between 1991 and 1998. The
categories represented were as follows: (a) English, (b) humanities, (c) math, (d) natural
sciences, (e) social sciences, and (f) fine and performing arts. Table 3 indicates that the
liberal arts experienced a decrease from 56.6% of the overall credit curriculum to 54.9%.
The disciplines of English, humanities, and math had the highest percentages of
representation for both studies.
Table 4 depicts the representation of disciplines within the liberal arts curriculum.
The percentage of math sections increased from 18.9 in the 1991 sample to 20.5 in the
1998 sample, and the percentage of natural sciences sections decreased from 13.6 in the
1991 sample to 12.5 in the 1998 sample. A larger number of sections were coded in
1998: 76,466 versus 59,205 in 1991.

70
Table 2
Percentage of disciplines represented in non-liberal arts sections (1998 and 1991)
Discipline
Percentage of non-liberal
arts sections in 1998 study
n=130,083
Percentage of non-liberal
arts sections in 1991 study
n=104,565
Technical education Business and office Health Personal skills/avocational Internships/practica Education Trade and industry Engineering/science technologies Marketing/distribution Criminal justice Agriculture Military science Other
19.0
17.8
12.9
15.4
7.0
3.8
15.0
2.8
2.1
2.2
1.3
0.2
0.5
18.2
24.6
10.2
19.1
- -
2.5
18.6
2.0
3.4
- -
1.2
- -
0.2
Totals
100.0
100.0
Source: Schuyler (2000, p. 12). Provided with permission from G. Schuyler.

71
Table 3 Percentage of liberal arts sections offered as part of total credit sections (1998 and 1991)
Discipline
Percentage of Total Credit
Sections in 1998 Study
n=139,083
Percentage of Total Credit
Sections in 1991 Study
N=014,565
English Humanities Math Natural Sciences Social Sciences Fine and Performing Arts
12.1
12.8
11.3
6.9
6.5
5.3
12.7
13.4
10.7
7.7
6.7
5.4
Totals
54.9
56.6
Source: Schuyler (2000, p. 12). Provided with permission from G. Schuyler.
In the 2000 Florida Curriculum Study (Griffin, 2002), mentioned earlier in
Chapter 1, liberal arts coursework (typically associated with transfer coursework)
represented a large part of the Florida community college curriculum. In this study, six
researchers collected catalogs and course schedules for the fall of 2000 from Florida’s 28
public community colleges. Using the curriculum scheme developed and used by
researchers at the Center for the Study of Community Colleges (CSCC), the researchers
coded all credit course sections listed in the schedules. A seventh researcher reviewed all
of the coding to check for accuracy and to minimize error. Six liberal arts and ten non-
liberal arts areas, remedial, distance learning, and transferability categories were defined
in the classification scheme. The researchers used the state master list for Florida’s

72
Table 4 Percentage of disciplines represented in liberal arts sections (1998 and 1991)
Discipline
Percentage of Liberal Arts
Sections in 1998 Study
n=139,083
Percentage of Liberal Arts
Sections in 1991 Study
N=104,565
English Humanities Math Natural Sciences Social Sciences Fine and Performing Arts
22.1
23.3
20.5
12.5
11.8
9.7
22.5
23.7
18.9
13.6
11.8
9.6
Total
100.0
100.0
Source: Schuyler (2000, p. 12). Provided with permission from G. Schuyler Common Course Numbering System to generate a consistent coding system and to
determine transferability. The Florida researchers coded 42,928 credit course sections in
the 28 community colleges. Findings indicated that nearly 67% of the course sections
offered in the Fall 2000 term were found in the liberal arts.
In related studies (such as the Brawer 1999 reference mentioned previously),
researchers have taken different aspects of the curriculum data and reported findings. For
example, Palmer (1999) provided a more detailed analysis of the non-liberal arts
curriculum in his study. He found that community colleges varied extensively, but a core
set of courses were offered at 90% or more of the sample colleges, including business and
office skills, marketing and distribution, health sciences, computer applications, and
education.

73
In the next section, the method of content analysis will be explored. As a method
of assessing trends and meaning, this approach will be used to evaluate Florida
community college mission statements and planning documents.
The Method of Content Analysis
This study will utilize a content analysis approach applied to Florida public
community college mission statements and planning statements in order to evaluate the
dominance or lack thereof of transfer versus workforce development education in the
Florida community college system. The content analysis method is defined in various
ways, but all with the common theme of reducing information to patterns and attempting
to discover meaning, trends, or other common denominators in the information. Weber
(1985) defined content analysis as a “research methodology that utilizes a set of
procedures to make valid inferences from text” (p. 9). Patton (2001) indicated that
“content analysis is used to refer to any qualitative data reduction and sense-making
effort that takes a volume of qualitative material and attempts to identify core
consistencies and meanings” (p. 453).
Several authors drew distinctions between qualitative content analysis and
quantitative content analysis approaches. Fields (1988) contrasted the two as follows,
“Quantitative content analysts base analytical decisions on tests for statistical significance
while qualitative approaches are more concerned with developing data that can be
interpreted for theoretical significance” (p. 183). Shapiro and Markoff (1997) stated that
content analysis referred to “any systematic reduction of a flow of text (or other symbols)
to a standard set of statistically manipulable symbols representing the presence, the

74
intensity, or the frequency of some characteristics relevant to social science” (p. 14).
Although the definition was ostensibly quantitative, the authors later stated that their
definition included qualitative categories as long as the studies followed a systematic
process. They provided examples of what earlier researchers had classified as qualitative
studies and stated that they could “only be called poor quantitative studies . . . these
studies were based on inadequate samples utilizing unspecified coding methods in a
whimsical fashion” (pp. 27-28).
Rourke and Anderson (2004) also critiqued poorly constructed content analysis
research. Focusing upon quantitative methods of content analysis, they stated that these
methods should be thought of as a type of testing and measurement. The authors noted
that few examples existed in which the coding protocol had been designed and validated
in a methodical and systematic manner. In short, tallying common content and
determining frequencies of occurrence alone was not a sufficient basis upon which to
draw inferences about behavior in a quantitative content analysis. Instead, the authors
recommended procedures for making the inferences valid, including defining the purpose
of the coding data, defining the elements that represented the construct, reviewing the
categories, piloting the project, and developing guidelines for administering, scoring, and
interpreting the scheme.
With their focus upon quantitative aspects of content analysis, Rourke and
Anderson (2004) did not deal extensively with qualitative content analysis except to
recommend its use in defining the elements that represented the construct. In an earlier
work, Altheide (1987), reacting to quantitative portrayals of content analysis, suggested
that the ethnographic research method could be wed to the content analysis method in

75
order to produce a “reflexive analysis of documents” (p. 65). He contrasted ethnographic
content analysis (also known as qualitative content analysis) with quantitative content
analysis. In his discussion of quantitative content analysis, he cited Starosta, who
described this approach as translating the “frequency of occurrence of certain symbols
into summary judgments” (p. 66). With regard to this definition of quantitative content
analysis, it appears to be representative of those that laid the groundwork for Rourke and
Anderson’s (2004) critique of quantitative content analysis as a method to draw
inferences about the data.
Altheide (1987) provided further highlights of the differences between qualitative
content analysis and quantitative content analysis. Looking at the process of data
collection, analysis, and interpretation, he described qualitative content analysis as
reflexive and circular and quantitative content analysis as serial. The qualitative content
analysis sample was purposive and theoretical, and the quantitative content analysis
sample was random or stratified. The qualitative content analysis data included both
narrative and numbers; the quantitative content analysis data was numerical. Narrative
description and comments were always included in qualitative content analysis research,
and concepts always emerged during the research. In quantitative content analysis, these
phenomena seldom occurred. Summarizing qualitative content analysis in Altheide’s
words:
ECA (qualitative content analysis) consists of reflexive movement between
concept development, sampling, data collection, data coding, data analysis, and
interpretation. The aim is to be systematic and analytic, but not rigid. Although
categories and “variables” initially guide the study, others are allowed and

76
expected to emerge throughout the study. Thus, ECA is embedded in constant
discovery and constant comparison of relevant situations, settings, styles, images,
meanings and nuances. (p. 68)
Miles and Huberman (1994) also described the emergent nature of qualitative
content analysis. They recommended early data analysis to allow the researcher to reflect
upon the existing data and plan collection strategies for new data – analogous to
Altheide’s (1987) words about qualitative content analysis data analysis being reflexive
and circular. In developing codes to classify the data, they recommended an initial list
with a clear structure and rationale. They also advocated the more inductive approach in
which the researcher does not precode data until it has been gathered to allow for the
determination of context and variety of data. In the next chapter, I will describe the
qualitative content analysis approach that will be used to evaluate the data for the first
research question.
Summary
The purpose of this study is twofold. One is to determine whether the current
composition of the overall Florida public community college curriculum and the content
of Florida public community college mission and planning statements provide evidence
to support Florida leadership policy statements that portray workforce development as a
primary component of the community college mission. The second is to determine
whether a longitudinal assessment of the curriculum and the content of mission and
planning statements will provide evidence that workforce development has increased as a
component of the community college mission. To provide background to this study,

77
several literature threads were presented. Theoretical perspectives on the growth of
workforce development education in the community college mission included an
overview of the sociological theoretical approaches of functionalism, status-competition
theory, and legitimation theory. An overview of public policy theoretical approaches,
including incrementalism and group theory and political, terminal, and hidden agendas,
was also provided.
To lay the groundwork further, the historical and contemporary background was
explored on the growth of workforce development education in the community college
mission. This synopsis led to a depiction of the new vocationalism and workforce
development. More specific information in this regard was provided about the Florida
community college and the role of vocational education. Finally, curriculum studies
related to the current proposal were summarized, and the method of content analysis was
discussed. In the next chapter, the methods by which this current study was conducted
will be presented.

78
Chapter 3
Method
Introduction: Purpose of Study
The purpose of this study is twofold. One is to determine whether the current
composition of the overall Florida public community college curriculum and the content
of Florida public community college mission and planning statements provide evidence
to support Florida leadership policy statements that portray workforce development as a
primary component of the community college mission. The second is to determine
whether a longitudinal assessment of the curriculum and the content of mission and
planning statements will provide evidence that workforce development has increased as a
component of the community college mission.
Researcher Objectivity
With 15 years of experience working for Florida community colleges, my
background provides an insider’s perspective on the research topic, and, inevitably, a
research bias. Max Weber, a seminal figure in social and behavioral theory, called for a
separation of scientific objectivity and personal values (Dictionary of Philosophical
Terms and Names, 2005). As a student of the behavioral sciences, I gained experience in
obtaining my master’s degree in anthropology in striving for researcher objectivity while
at the same time acknowledging the fact that the researcher, of necessity, becomes part of

79
the study. In this current study, I have applied my research background in an effort to
counter any employment bias.
Research Questions/Hypotheses
Through the assumptions of legitimation theory, the overriding hypothesis of this
study is that community colleges as institutions that allocate status confer a higher status
through their transfer mission than through their workforce development mission.
Therefore, the study prediction was that transfer mission would remain paramount in the
Florida community college curriculum. Also through the assumptions of legitimation
theory, a secondary prediction was that the longitudinal analysis would indicate growth in
workforce development education because postsecondary institutions served to validate
the certificate and degree requirement. In support of these assumptions, the specific
research questions are as follows:
1. Do Florida public community college mission and planning statements
support national and state leadership policy statements with regard to the
dominance of the role of workforce development in the community college
curriculum?
2. What is the overall composition of the Florida public community college
curriculum, utilizing the classification scheme defined by the CSCC?
3. How have the non-liberal arts college-credit offerings changed between the
2000 Florida findings and the current study?

80
4. What proportion of the Florida community college curriculum is workforce
development education when the non-credit and vocational credit curriculum
is included?
Methods
Research question 1: With regard to Research Question 1, (do Florida public
community college mission and planning statements support leadership policy statements
with regard to the dominance of the role of workforce development in the community
college curriculum), the researcher conducted a content analysis of Florida community
college mission and institutional goal statements. These statements were collected from
1999/2000 and 2004/2005 catalogs, and the content analysis included a comparison from
1999/2000 to 2004/2005 as well as a comparison between colleges. The 1999/2000
documents were used because they provided the basis for the research in the 2000 Florida
Curriculum Study, which was used as the basis for comparison in this study.
1. Hypothesis 1: There will be a greater emphasis on workforce development in
the 2004/2005 documents as compared to the 1999/2000 documents.
2. Hypothesis 2: the transfer component will retain a dominant place in the
mission and goals statements both in 1999/2000 and in 2004/2005.
Following the guidelines put forth by Miles and Huberman (1994), I used a
coding matrix that included the two broad categories “workforce development” and
“transfer.” Subcategories of workforce development included the following (defined in
Chapter 1): (a) adult basic education, (b) applied technical certificate, (c) applied
technology diplomas, (d) associate in applied science, (e) associate in science, (f) college

81
credit certificates, (g) continuing workforce education, (h) GED preparation, (i) new
vocationalism, (j) non-credit, (k) non-liberal arts curriculum, (l) occupational completion
point, (m) occupational-technical curriculum, (n) postsecondary adult vocational
certificates, (o) traditional vocational education, (p) vocational credit, and (q) workforce
development curriculum. Subcategories of transfer included the following: (a) college
preparatory instruction (although not transferable, these courses within the community
college curriculum are an essential part of the transfer function for students needing
remedial coursework to enroll in college-level coursework), (b) general education, (c)
Gordon Rule, and (d) liberal arts curriculum.
Miles and Huberman (1994) point out that all coding approaches change during
the field experience, and revisions, deletions, and new categories occur as the researcher
proceeds. The important rule in coding frameworks is to have a conceptual and structural
order with larger conceptual codes and more definitive subcodes. With that in mind, the
analysis included “strong,” “medium,” and “weak” categories for the mission and goal
statements using the following rubric. In both cases, the frequency of the concepts
helped assess strength or weakness across the continuum. The mission and goal
statements were compared within colleges across time to determine any change and also
between colleges for the respective time periods. Table 5 indicates the rubric that was
applied to mission statements; Table 6 indicates the rubric that was applied to
institutional goal statements.
I also divided colleges into categories of “small,” “medium,” and “large” using
the definition in the 2000 Florida study. For that study, small colleges were those with an
unweighted 1999/2000 FTE less than or equal to 2,748, medium colleges were those with

82
an unweighted 1999/2000 FTE between 2,749 and 6,410, and large colleges were those
with an FTE greater than or equal to 6,410. The same categories were used for the
current study with 2004/2005 FTE.
3. Hypothesis 3: Small colleges will have a stronger workforce development
emphasis in their mission and goals statements for 1999/2000 and for
2004/2005.
Table 5 Coding rubric for transfer and workforce emphases in mission statements
Level of Emphasis
Transfer
Workforce
Strong
More than one statement that includes a specific reference to a transfer category.
More than one statement that includes a specific reference to a workforce category.
Medium
One statement that includes specific reference to a transfer category.
One statement that includes specific reference to a workforce category.
Weak
No statements including specific references to a transfer category.
No statements including specific references to a workforce category.
An assessment was also conducted of current community colleges with regard to
current strategic plans. These plans were assessed using the same rubric approach along
the categories of “strong,” “medium,” and “weak.” This analysis was only conducted

83
Table 6 Coding rubric for transfer and workforce emphases in institutional goal statements
Level of Emphasis
Transfer
Workforce
Strong
More than one goal that includes a specific reference to a transfer category.
More than one goal that includes a specific reference to a workforce category.
Medium
One goal that includes specific reference to a transfer category.
One goal that includes specific reference to a workforce category.
Weak
No goals including specific references to a transfer category.
No goals including specific references to a workforce category.
across colleges for plans that were current within the 2004/2005 academic year. Size was
included in this analysis.
4. Hypothesis 4: There will be a greater emphasis on workforce development
than on the transfer program in college strategic plans.
5. Hypothesis 5: Small colleges will include the strongest emphasis on
workforce development in their strategic plans.
Research question 2: With regard to Research Question 2, (what is the overall
composition of the Florida public community college curriculum, utilizing the
classification scheme defined by the CSCC), I collected catalogs and schedules from
Florida’s 28 public community colleges. Using a curriculum coding scheme developed
and applied by researchers at the CSCC in seven national community college curriculum

84
studies conducted between 1975 and 1998, I coded all credit course sections listed in the
schedules, excluding labs (unless the lab was included in the course as a “C,” which
meant that the course was treated as one section). The three-credit hour section was used
as the “standard.” Because the focus of this study was upon workforce development
education, the coding for the liberal arts section was limited to the broad category “liberal
arts areas.” The coding for the non-liberal arts categories included the sub-categories
identified in Table 1 of Chapter 2: (a) technical education, (b) business and office, (c)
health, (d) personal skills/avocational, (e) internships/practica, (f) education, (g) trade and
industry, (h) engineering/science technologies, (i) marketing/distribution, (j) criminal
justice, (k) agriculture, and (l) military science.
For the purposes of consistency, I used the State Master File obtained from the
Florida Articulation Coordinating Committee, which included in its database the 1000
and 2000 level courses offered in Florida’s public community colleges and state
universities. Through the state common course numbering system, each 1000 and 2000
level course is assigned a number, which is captured by the State Master File. This
numbering system allowed me to code like courses consistently by virtue of their
common numbering scheme, even if course titles differed. I augmented the State Master
File to include the coding classification. A sample section derived from the State Master
File appears as Table 7.
Vocational credit and non-credit coursework were coded as sections if they
included at least 45 contact hours (the number of contact hours in a 3-credit hour course,
which is a system standard for credit coursework). Non-credit coursework that did not

85
Table 7
Sample section from state master file
Code
Prefix
Century
C
Title
61-3
ACG
001
Principles of Accounting I
61-3
ACG
011
Principles of Accounting II
61-3
ACG
021
Accounting Prin – Condensed
61-3
ACG
031
Principles of Accounting III
61-3
ACT
062
Computer Focused Principles
61-3
ACG
071
Managerial Accounting I
61-3
ACG
071
C
Managerial Accounting I With Lab
fall into one of the non-liberal arts categories was excluded, as was non-credit
coursework that was not employment-oriented. Examples of this type of coursework are
special interest courses that focus upon personal enrichment or development, such as
Antiques, Secrets of Gourmet Cooking, and Introduction to Scrapbooking.
Following the coding process, the data was compiled in a master file and
descriptive statistics were obtained. An overall presentation of the curriculum was
provided. The data represented by the credit curriculum was compared against the
Florida Study conducted in 2000.
6. Hypothesis 6: The overall curriculum will indicate that the ratio between
transfer and workforce development coursework is close to equal, but the
transfer coursework will represent a larger proportion of the overall
curriculum.
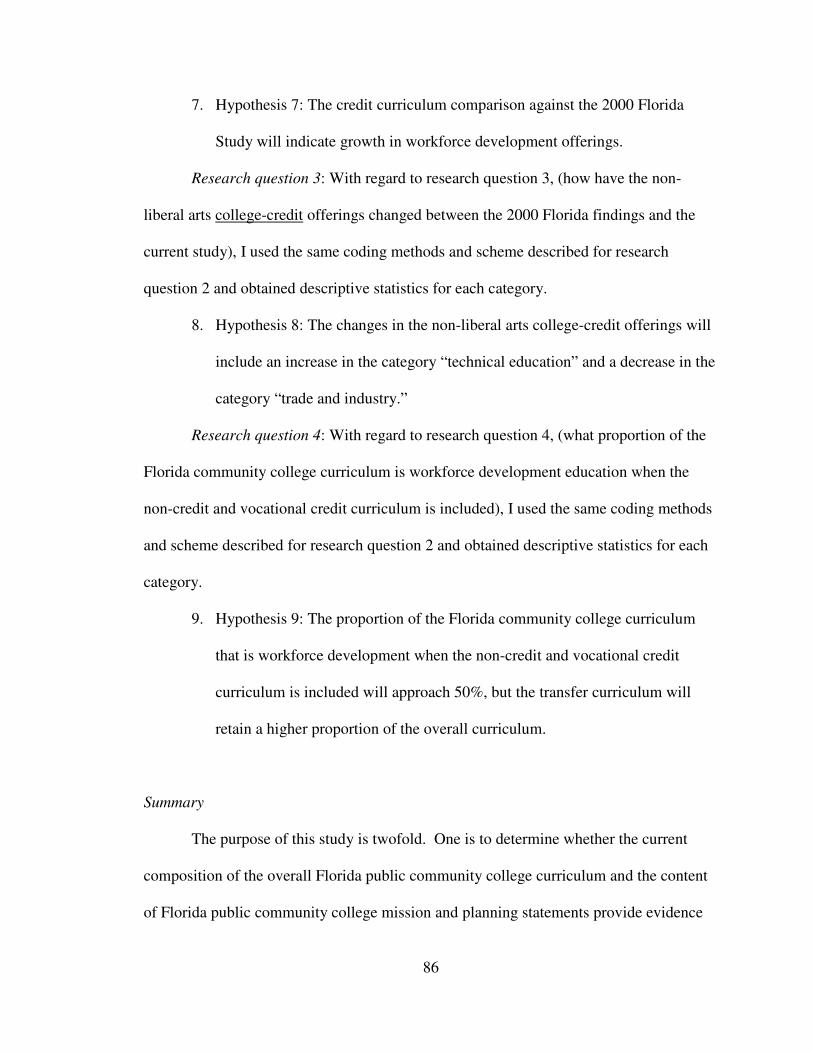
86
7. Hypothesis 7: The credit curriculum comparison against the 2000 Florida
Study will indicate growth in workforce development offerings.
Research question 3: With regard to research question 3, (how have the non-
liberal arts college-credit offerings changed between the 2000 Florida findings and the
current study), I used the same coding methods and scheme described for research
question 2 and obtained descriptive statistics for each category.
8. Hypothesis 8: The changes in the non-liberal arts college-credit offerings will
include an increase in the category “technical education” and a decrease in the
category “trade and industry.”
Research question 4: With regard to research question 4, (what proportion of the
Florida community college curriculum is workforce development education when the
non-credit and vocational credit curriculum is included), I used the same coding methods
and scheme described for research question 2 and obtained descriptive statistics for each
category.
9. Hypothesis 9: The proportion of the Florida community college curriculum
that is workforce development when the non-credit and vocational credit
curriculum is included will approach 50%, but the transfer curriculum will
retain a higher proportion of the overall curriculum.
Summary
The purpose of this study is twofold. One is to determine whether the current
composition of the overall Florida public community college curriculum and the content
of Florida public community college mission and planning statements provide evidence

87
to support Florida leadership policy statements that portray workforce development as a
primary component of the community college mission. The second is to determine
whether a longitudinal assessment of the curriculum and the content of mission and
planning statements will provide evidence that workforce development has increased as a
component of the community college mission.
Through the assumptions of legitimation theory, the overriding hypothesis of this
study is that community colleges as institutions that allocate status confer a higher status
through their transfer mission than through their workforce development mission.
Therefore, the study prediction is that the transfer mission will remain paramount in the
Florida community college curriculum. Also through the assumptions of legitimation
theory, a secondary prediction is that the longitudinal analysis will indicate growth in
workforce development education because postsecondary institutions serve to validate
the certificate and degree requirement.
To carry out this study, a content analysis was conducted of 1999/2000 and
2004/2005 mission and institutional goal statements. Comparisons were made across
time and between institutions. Size was included as a factor. The overall expectation
was that the transfer function would retain its place as the primary component of the
community college mission, institutional goals, and curriculum, but there would be
evidence that workforce development coursework increased in the college-credit
curriculum and that in the curriculum overall, it approached the transfer curriculum in
weight.

88
Chapter 4
Results
Introduction
The purpose of this study was twofold. One was to determine whether the current
composition of the overall Florida public community college curriculum and the content
of Florida public community college mission and planning statements provided evidence
to support Florida leadership policy statements that portray workforce development as a
primary component of the community college mission. The second was to determine
whether a longitudinal assessment of the curriculum and the content of mission and
planning statements provided evidence that workforce development increased as a
component of the community college mission.
Through the assumptions of legitimation theory, the overriding hypothesis of this
study was that community colleges as institutions that allocate status confer a higher
status through their transfer mission than through their workforce development mission.
Therefore, the study prediction was that transfer mission would remain paramount in the
Florida community college curriculum. Also through the assumptions of legitimation
theory, a secondary prediction was that the longitudinal analysis would indicate growth in
workforce development education because postsecondary institutions serve to validate
the certificate and degree requirement.
To carry out this study, a content analysis was conducted of 1999/2000 and
2004/2005 mission and institutional goal statements. Comparisons were made across

89
time and between institutions. Size was included as a factor. As noted in Chapter 3, the
definition in the 2000 Florida study was applied to the categories of “small,” “medium,”
and “large.” In review, the five small colleges were those with an unweighted 1999/2000
FTE less than or equal to 2,748, the seven medium colleges were those with an
unweighted 1999/2000 FTE between 2,749 and 6,410, and the 16 large colleges were
those with an FTE greater than or equal to 6,410. The reader should note that this
definition caused more than half of the colleges to be classified as large.
The overall expectation was that the transfer function would retain its place as the
primary component of the community college mission, institutional goals, and
curriculum, but there would be evidence that workforce development coursework
increased in the college-credit curriculum. Also, in the curriculum overall, the workforce
development curriculum would approach the transfer curriculum in weight.
In support of these assumptions, the specific research questions are as follows:
1. Do Florida public community college mission and planning statements
support national and state leadership policy statements with regard to the
dominance of the role of workforce development in the community college
curriculum?
2. What is the overall composition of the Florida public community college
curriculum, utilizing the classification scheme defined by the CSCC?
3. How have the non-liberal arts college-credit offerings changed between the
2000 Florida findings and the current study?

90
4. What proportion of the Florida community college curriculum is workforce
development education when the non-credit and vocational credit curriculum
is included?
Summary of Data Collection
To conduct the study, the researcher collected information from Florida’s 28
public postsecondary institutions that were classified as community colleges. The
information included the following: (a) 1999/2000 institutional mission and goal
statements; (b) 2004/2005 institutional mission and goal statements; (c) 2004/2005
strategic plans; (d) fall 2004 credit and non-credit course schedules; and (d) 2004/2005
college catalogs. The mission, goal, and strategic plans were used to respond to
research question 1, and the course schedules were used to respond to the remaining
research questions. The college catalogs guided interpretation of the data with
descriptions of program and course offerings.
Across the community college system, definitions varied with regard to missions,
goals, and strategic plans. In these cases, the researcher worked with college contacts to
determine appropriate substitutes. For example, one college had a philosophy statement
rather than a mission statement during the 1999/2000 period. Other colleges had
priorities or objectives rather than goals. A brief description of the information provided
for each college follows:
1. A: The mission changed from 1999/2000 to 2004/2005. The strategic plan
was 57 pages long, and the content analysis included descriptive paragraphs as
well as the mission and strategic objectives.

91
2. B: The mission statement remained the same for the two time periods, but the
goals changed. A two-page document contained strategic priorities.
3. C: The 2004/2005 mission differed from 1999/2000, but the goals were
similar except for minor editorial changes. The college had a 15-page annual
plan, which referenced college operational unit plans (not analyzed in this
study).
4. D: In 2004/2005, the mission changed to one sentence, and the goals changed
as well. A 24-page strategic plan was provided.
5. E: The mission became a one-sentence statement in 2004/2005, but the goals
remained substantially the same. A five-page strategic plan was provided.
6. F: The mission remained nearly identical for the two time periods, but the
goals changed. The college provided an 11-page strategic plan.
7. G: For 1999/2000 the goal statements were the purpose statements, and the
philosophy statement was analogous to a mission statement. The mission and
goals (termed “objectives”) were different for 2004/2005. The strategic plan
was not provided.
8. H: The 2004/2005 mission became a one-sentence statement, and the goals
changed as well from the 1999/2000 time period, including dropping the
references to specific degrees. The six-page strategic plan referenced unit
strategy forms (not analyzed in this study).
9. I: The mission remained the same from 1999/2000 to 2004/2005, but the
goals changed. The 30-page strategic plan included references to other plans
(not analyzed in this study).

92
10. J: The mission and goals were nearly identical for the two time periods. The
21-page strategic plan referenced other plans (not analyzed in this study).
11. K: The institutional priorities were treated as goals. In neither 1999/2000 nor
2004/2005 were the goal statements specific to transfer or workforce
development. Only minor editorial changes were made to the mission and
goals in 2004/2005 from 1999/2000. No strategic plan was provided.
12. L: The mission and goals remained nearly identical for the two time periods.
The 317-page long range plan was treated as the strategic plan; it included
more than 600 objectives.
13. M: The 2004/2005 mission and goals differed from the 1999/2000 versions.
Strategic priorities guided the strategic planning process (the full strategic
plan was provided after the fieldwork was completed and was not included in
the study).
14. N: The mission remained the same from 1999/2000 to 2004/2005, but the
goals changed. In the 10-page strategic plan, unit plans were referenced but
not provided.
15. O: The mission and strategic goals were nearly identical for the two time
periods except for the addition of the A.A.S. The five-page strategic plan
cited individual unit plans (not provided).
16. P: The mission and goals changed for the two time periods, and the strategic
plan was included in the college catalog.

93
17. Q: The mission and goals changed. The 2004/2005 mission was a one-
sentence statement. The 214-page strategic plan included 179 objectives,
which were submitted by individual units.
18. R: The mission statement was identical for the two time periods, but the goals
differed. The college had a 27-page strategic plan.
19. S: The mission remained the same during the two time periods, and the goals
remained substantially the same. The strategic plan was not available.
20. T: The mission and goals were nearly identical (with the deletion of one goal
in 2004/2005 that did not reference either transfer or workforce). The two-
page strategic plan included the mission, goals, values, and vision statements.
21. U: The mission and goals changed from 1999/2000 to 2004/2005. The
college had a 23-page strategic plan.
22. V: The 1999/2000 and 2004/2005 mission and goal statements were nearly
identical, but there was a greater emphasis on workforce in the mission
statement and more workforce options were listed in the goals. The college
had a 10-page strategic plan.
23. W: The mission changed for the two time periods, but the objectives (treated
as goals) remained similar. The 14 page strategic plan included 26 objectives.
24. X: The 2004/2005 mission, which was a one-sentence statement, differed
from the 1999/2000 mission, as did the goals. The college had a 6-page
strategic plan in effect during 1999/2000, and it remained in effect until 2005.
25. Y: The institution was not included in the mission, goal, or strategic plan
analysis because only the mission statement was available.

94
26. Z: The goals remained the same for the two time periods, but the mission
changed. The college provided a 17-page strategic plan.
27. AA: In 2004/2005, no changes were made in the mission statement from
1999/2000, and the purposes (goals) were also quite similar to 1999/2000.
The educational master plan was treated as the college’s strategic plan.
28. BB: The mission remained the same for the two time periods, but the goals
changed. The college had a 17-page strategic plan, including the detail on the
priorities.
Documents that were titled “strategic plans” ranged from two-page mission,
vision, values, and goal statements to extensive documents including more than 500
planning objectives. In the cases where colleges did not have a document titled “strategic
plan,” appropriate substitutes included documents such as educational master plans or
long-range plans. The key to the analysis was to assess the documents for priorities with
regard to the transfer and workforce functions.
Of the colleges that provided documentation, 13 revised their mission statements
from 1999/2000 to 2004/2005 (Colleges A, C, D, E, G, H, M, P, Q, V, W, X, and Z).
Fifteen revised their goals: A, B, D, F, G, H, I, M, N, P, Q, R, U, X, and BB. Four
institutions changed their mission statements to one-sentence statements for the
2004/2005 time period: D, E, H, and X.
A limitation cited in Chapter 1 was the fact that not all colleges included non-
credit course offerings in printed course schedules. The assessment of non-credit course
offerings was critical to the response to the fourth research question, and the researcher
made ongoing attempts to collect the data through alternative means, such as college-

95
specific databases. However, the efforts had only partial success. Ultimately, a Florida
Department of Education database was secured that included a complete listing of all
postsecondary adult vocational and continuing workforce education course sections that
were offered in fall 2004. Based on the fact that it was comprehensive and complete, the
research used this database in the analysis in lieu of the non-credit schedules that had
been collected.
For the purposes of the study, each college was coded alphabetically. Because of
missing data, not all colleges were included for each research question. For each research
question and its corresponding hypotheses, any colleges that were excluded from the
analysis are noted.
Results of Content Analysis
Research question 1. “Do Florida public community college mission and
planning statements support leadership policy statements with regard to the dominance of
the role of workforce development in the community college curriculum?” This research
question includes five hypotheses:
1. Hypothesis 1: There will be a greater emphasis on workforce development in
the 2004/2005 documents as compared to the 1999/2000 documents.
2. Hypothesis 2: The transfer component will retain a dominant place in the
mission and goals statements both in 1999/2000 and in 2004/2005.
3. Hypothesis 3: Small colleges will have a stronger workforce development
emphasis in their mission and goals statements for 1999/2000 and for
2004/2005.

96
4. Hypothesis 4: There will be a greater emphasis on workforce development
than on the transfer program in college strategic plans.
5. Hypothesis 5: Small colleges will include the strongest emphasis on
workforce development in their strategic plans.
The overall findings indicate that Florida public community college mission and
planning statements do support leadership policy statements with regard to the
dominance of the role of workforce development in the community college curriculum.
However, in response to Hypothesis 1, there was not a greater emphasis on workforce
development in 2004/2005 versus 1999/2000. In response to Hypothesis 2, the transfer
component does not have a dominant place for either time period in the mission and goals
statements. In response to Hypothesis 3, the relationship of workforce development
emphasis and institutional size is not a strong one, but the relationship between workforce
development emphasis and small size was stronger in 1999/2000 than in 2004/2005. In
response to Hypothesis 4, workforce development clearly has a stronger emphasis in
strategic plans, and in response to Hypothesis 5, there tends to be a stronger emphasis on
workforce development in the larger rather than the smaller colleges, although again, the
emphasis is not pronounced. More detail on the findings is provided in the paragraphs
that follow.
To respond to research question 1, the researcher conducted a content analysis on
college mission, goal, and strategic planning documents. Hypotheses 1 through 3
reference mission and goal statements only; hypotheses 4 and 5 reference strategic
planning documents only. For all hypotheses, no information was available for College
Y. For hypotheses 4 and 5, strategic plans are missing for College G and College S.

97
As noted previously, Miles and Huberman (1994) indicate that coding approaches
change during the field experience. The field experience for this study was no exception.
Along with the strategic plans, mission and goal statements ranged in length and
composition. Many were modeled after or directly copied the community college
mission as set forth in Florida Statute 1004.65 Community colleges; definition, mission,
and responsibilities: “Providing lower level undergraduate instruction and awarding
associate degrees . . .Preparing students directly for careers requiring less than
baccalaureate degrees . . . Providing student development services . . . Promoting
economic development” (2006).
The overall precept in the content analysis was that a statement or phrase had to
include specific references to concepts belonging either to the “transfer” category or the
“workforce” category. Consequently, decision rules were set forth to guide what to
include or exclude in the analysis:
1. Statements referring to “undergraduate programs” but not more specifically to
the A.A. or “transfer” degree were not included in the analysis since
“undergraduate programs” could pertain to more than the A.A. degree.
2. Statements referring to “academic and career” programs were counted in the
workforce development category but not in the transfer category, since
“career” has a specific workforce relationship, whereas “academic” does not
have a specific transfer relationship.
3. The use of the phrase “economic development” was included if there was a
specific relationship to developing educational or training programs or other
workforce development references. A statement such as “provide economic

98
development by working with other agencies and business to supply programs
and services” would not have been included because it implies workforce
development, but not directly, much in the same way that “academic” implies
the A.A. degree, but not directly.
4. Colleges included statements that pertained to general education concepts,
such as critical thinking, synthesizing knowledge, and effective
communication. However, if the mission did not specifically indicate that
these concepts were tied to a general education curriculum, they were not
included in the analysis.
5. As noted in Chapter 3, subcategories of transfer included college preparatory
instruction. Some colleges included references to pre-collegiate instruction
and combined that phrase with adult basic education. Again, if the reference
was not specific to college preparatory instruction, it was not included.
6. Unless specifically associated with an Associate in Science program, the use
of the term “transfer” was counted towards the transfer (Associate in Arts)
category. In reminder, as stated in Chapter 1, note that the A.S. degree is
considered the occupational associate’s degree in Florida, equivalent to the
A.A.S. degree in many other states (J. Ignash, November 19, 2004, personal
communication).
7. An occurrence of a category was counted based on how it was displayed. For
example, if a college mission statement included three separate statements
referencing a transfer category, each was counted independently. However, if
the references were all included in one sentence, they were counted as one

99
occurrence. The researcher’s interpretation was that an institution choosing to
emphasize a concept in separate statements or goals was placing stronger
weight on the concept that one that combined concepts in one sentence or
goal. The limitation to this interpretation lies in the fact that other factors
influence the development and display of mission and goal statements. For
example, in its last mission review, Hillsborough Community College went
from a three-paragraph mission statement to a single-sentence one – a trend
that some of the other community colleges had adopted as well.
The tables and associated information below provide a summary of the content
analysis of the college mission and goal statements and provide the data to inform the
findings on the first three hypotheses related to Research question 1. Colleges that were
classified as having strong or medium statements appear in tables with the associated key
phrases. Colleges that were classified as having weak statements are simply listed.
Mission statements are displayed in separate tables from goal statements, and
mission statements are presented first. The tables related to the transfer category appear
first and are separated by year and the “strong” and “medium” subcategory.
Mentioned earlier, overall results indicate that community colleges did place
greater emphasis on workforce development in their missions, goals, and strategic
planning documents than they did on transfer. During 1999/00, out of the 27 institutions
included in this analysis, eight have mission statements categorized as “transfer strong”
(Table 8), seven have statements categorized as “transfer medium” (Table 9), and 12
have statements categorized as “transfer weak” (A, G, I, J, K, L, P, S, T, V, X, and BB).

100
Table 8
1999/2000 institutional mission statements: Transfer strong
College
Key phrases
D (2)
(a) Associate in Arts degree; (b) college preparatory courses
E (2)
(a) Associate in Arts degree; (b) developmental education
N (3)
(a) Associate in Arts degree; (b) transfer, (c) preparatory instruction
Q (2)
(a) Transfer; (b) remedial education
U (2)
(a) Associate of arts degree programs; (b) first language is not English.
W (2)
(a) Associate in arts degree; (b) preparatory instruction
Z (2)
(a) A two-year parallel program; (b) college-preparatory courses
AA (2)
(a) First two years of a four-year curriculum through a program of general education; (b) college-preparatory instruction
Table 9 1999/2000 institutional mission statements: Transfer medium
College
Key phrases
B
C
F
H
M
O
R
Associate in arts degree Associate in arts degree The first two years of study for the bachelor’s degree Associate in arts degree University parallel programs Associate of Arts degree First two years of university studies
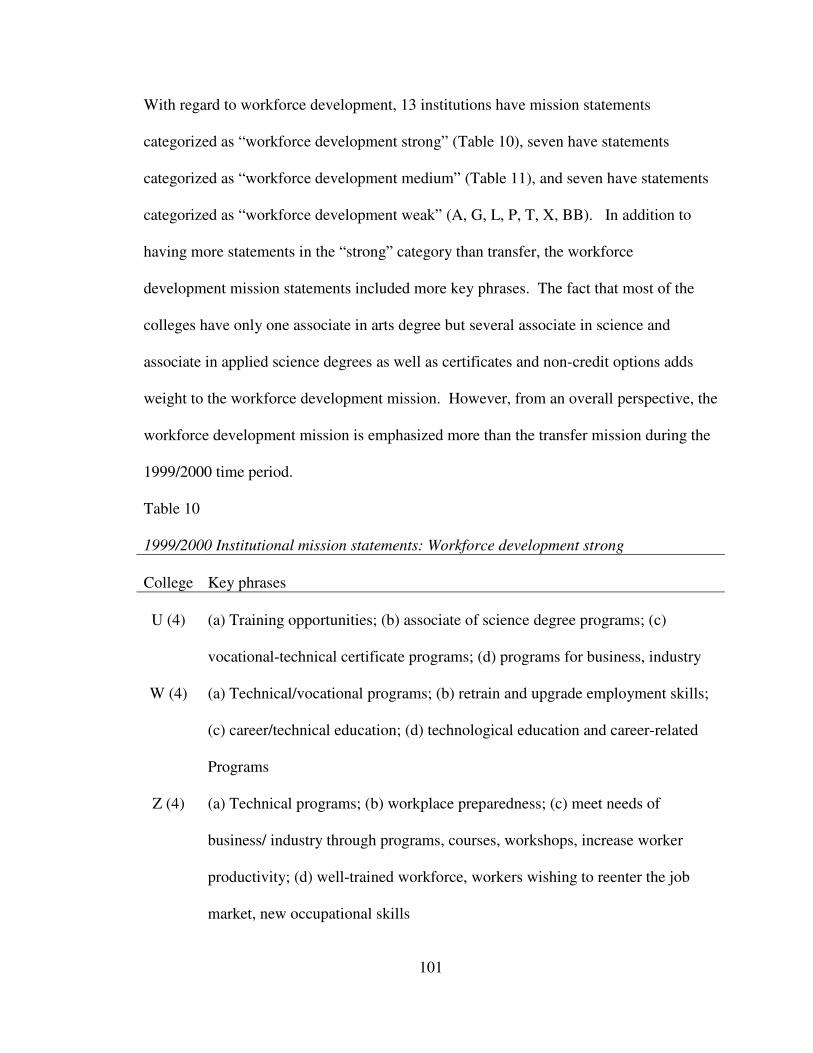
101
With regard to workforce development, 13 institutions have mission statements
categorized as “workforce development strong” (Table 10), seven have statements
categorized as “workforce development medium” (Table 11), and seven have statements
categorized as “workforce development weak” (A, G, L, P, T, X, BB). In addition to
having more statements in the “strong” category than transfer, the workforce
development mission statements included more key phrases. The fact that most of the
colleges have only one associate in arts degree but several associate in science and
associate in applied science degrees as well as certificates and non-credit options adds
weight to the workforce development mission. However, from an overall perspective, the
workforce development mission is emphasized more than the transfer mission during the
1999/2000 time period.
Table 10 1999/2000 Institutional mission statements: Workforce development strong
College
Key phrases
U (4)
(a) Training opportunities; (b) associate of science degree programs; (c) vocational-technical certificate programs; (d) programs for business, industry
W (4)
(a) Technical/vocational programs; (b) retrain and upgrade employment skills; (c) career/technical education; (d) technological education and career-related Programs
Z (4)
(a) Technical programs; (b) workplace preparedness; (c) meet needs of business/ industry through programs, courses, workshops, increase worker productivity; (d) well-trained workforce, workers wishing to reenter the job market, new occupational skills

102
Table 10, continued
College
Key phrases
AA (4)
(a) Technical educational opportunities; (b) prepare individuals for employment; (c) economic development activities to meet the needs of business; (d) maintain competencies, upgrade skills, change occupations
B (3)
(a) Workforce development programs, Associate in Science Degree; (b) retraining opportunities; (c) vocational
O (3)
(a) Career training; (b) associate of science degree programs and vocational certificate programs; (c) training and retraining
D (2)
(a) Associate in Science degree and/or certificate; (b) continuing education for vocational/technical field, advancement in occupation, career change, customized programs
E (2)
(a) High-opportunity, growth-industry vocations; (b) Supporting economic development by providing basis for skilled and educated workforce
F (2)
(a) Workforce training and retraining; (b) career and personal goals
H (2)
(a) Careers in a global economy; (b) Associate in Science degree or certificate, job skills through continuing education
N (2)
(a) Workforce development programs, associate in science, certificates; (b) educational partnerships with business, industry
Q (2)
(a) Prepares students to enter the job market; (b) two-year technical programs, vocational programs
R (2)
(a) Career and technical programs (b) continuing education for recertification

103
Table 11
1999/2000 Institutional mission statements: Workforce development medium
College
Key phrases
C I J
K
M
S
V
Workforce development programs, associate in science degrees, certificates of training Professional and vocational training Vocational Job entry and retraining Occupational-technical programs Economic and workforce development Technical education
During the 2004/2005 time period, transfer loses prominence in the mission
statements. Only two colleges are represented in the “strong” category (Table 12).
Eight colleges are represented in the medium category (Table 13), and 17 are represented
in the weak category as follows: D, E, G, H, I, J, L, M, P, S, T, U, V, X, Z, AA, BB.
From 15 institutions including “transfer” as a strong or medium category in 1999/2000,
only 10 include “transfer” as a strong or medium category in 2004/2005.
Table 12 2004/2005 Institutional mission statements: Transfer strong
College
Key phrases
N (3)
O (2)
(a) Associate in arts degree; (b) upper-division transfer; (c) preparatory (a) Associate of arts degree; (b) precollegiate studies

104
Table 13 2004/2005 Institutional mission statements: Transfer medium
College
Key phrases
A
B
C
F
K
Q
R
W
University transfer, college preparatory Associate in arts degree Associate in arts degree First two years of study for the bachelor’s degree Development of basic skills. Undergraduate studies and associate degrees to pursue a baccalaureate degree Academic curriculum that provides the first two years of university studies Associate in arts
As seen in Tables 14 and 15, six institutions are included in the “workforce
development strong” category for 2004/2005, and 12 are included in the “workforce
development medium” category. Nine colleges, E, G, L, M, P, T, X, AA, and BB, are
categorized as “workforce development weak.” In contrast with 1999/2000, 18 rather
than 20 institutions had statements categorized as strong or medium, but workforce
development still retained a more prominent place in the institutional mission statements
overall than transfer.
Mission statements followed a variety of formats, ranging from a single statement
to complex paragraphs that included college purposes. Goals also followed a variety of
formats, with some colleges affiliating each function with a separate goal, and other
colleges combining functions into goals. Among concepts included as goals are

105
objectives and priorities. A goal was counted as an occurrence if it appeared as a distinct
statement.
Table 14 2004/2005 Institutional mission statements: Workforce development strong
College
Key phrases
B (3)
(a) Workforce development programs, Associate in Science Degree; (b) retraining opportunities; (c) vocational
O (3)
(a) Career training; (b) Associate of science degree programs, associate of applied science degree programs, and vocational certificate programs; (c) training and retraining activities
F (2)
(a) Workforce training and upgrading; (b) career
N (2)
(a) Workforce development programs, associate in science, certificates; (b) educational partnerships with business, industry
R (2)
(a) Career and technical programs; (b) continuing education programs – recertification
V (2)
(a) Technical certificates, applied technology diplomas; (b) workforce development.

106
Table 15 2004/2005 Institutional mission statements: Workforce development medium
College
Key phrases
A
C
D
H I J
K
Q
S
U
W
Z
Workforce development Workforce development, associate in science degrees, associate in applied science degrees, certificates of training Career-oriented education Career Careers requiring professional and vocational training Vocational Job entry and retraining, Technical and vocational training Economic and workforce development Job training Associate in science and associate in applied science degrees, professional certificates, workforce development Workplace skills
Tables 16 and 17 display the 1999/2000 institutional goals categorized as
“transfer strong” (six institutions represented) and “transfer medium” (nine institutions
represented). Common key phrases include transfer, baccalaureate degree, associate in
arts degree, and developmental. Within this time period, 13 institutions’ goals are
categorized as “transfer weak”: D, F, H, I, K, M, R, T, W, X, Z, AA, and BB.

107
Table 16
1999/2000 Institutional goal statements: Transfer strong
College
Key phrases
V (3)
B (2)
J (2)
L (2)
N (2)
P (2)
(a) Transfer; (b) college preparatory; (c) general education (13 outcomes listed) (a) Transfer; (b) visual and performing arts fields programs (a) Courses leading to baccalaureate degrees; (b) college preparatory (a) Postsecondary instruction that leads to the baccalaureate degree; (b) college preparatory instruction (a) Meet student transfer needs . . . review the content of AA courses; (b) university transfer (a) General education; (b) foundation for study in the upper division
Table 17 1999/2000 Institutional goal statements: Transfer medium
College
Key phrases
A
B
C
E I
O
Q
S
U
Associate in Arts degree Preparatory/remedial education program Developmental Associate in Arts degree Developmental Lower division liberal arts education for transfer Freshman and sophomore level university-parallel programs Emphasis on the science, math Programs leading to transfer

108
Tables 18 and 19 portray the institutional goal statements as “workforce
development strong” (14 institutions) and “workforce development medium” (eight
institutions) respectively. Of 14 institutions included in the “workforce development
strong” category, five contain more than two goals related to workforce development.
Five institutions were categorized as “workforce development weak”: D, H, K, M, AA.
Table 18 1999/2000 Institutional goal statements: Workforce development strong
College
Key phrases
O (5)
(a) occupational programs, workplace; (b) student support services - career; (c) workforce training; (d) customized training programs; (e) workforce needs
U (5)
(a) programs leading to employment; (b) vocational-technical certificate programs; (c) cooperative education and apprenticeships; (d) well-prepared workforce; (e) customized training
P (4)
(a) Preparation for full-time employment; (b) occupational; (c) advisement services - vocational choices; (d) regional and state occupational training
L (3)
(a) career and technical education programs (b) continuing education that enhance and update the skills of individuals; (c) education and training that promote and support economic development
V (3)
(a) Associate in science, certificate programs; (b) improve employability, enhance career skills; (c) economic development through technical courses, workshops
C (2)
(a) Workforce development; (b) workforce development (repeated)
F (2)
(a) Workforce development services; (b) educational and training programs

109
Table 18, continued
College
Key phrases
G (2)
(a) Business and technical fields; (b) continuing education opportunities for business and industry, employee skills training
J (2)
(a) Occupational programs; (b) economic and workforce development
N (2)
(a) needs of the job market, respond to community and state labor market needs, internships, post secondary adult vocational programs; (b) community partnerships - educational programs for business and industry, workforce development short-term training with AS course offerings, customized training, vocational training, teacher education and recertification
Q (2)
(a) Vocational and technical programs; (b) Economic development, continuing education training: workforce readiness, special training needs
S (2)
(a) Technology education; (b) workforce development, employment, school-to- work, welfare-to-work, and one-stop career center
W (2)
(a) Workforce programs; (b) students placed in a new job, continued in employment
BB (2)
(a) Career pursuits; (b) programs and training.

110
Table 19 1999/2000 Institutional goal statements: Workforce development medium
College
Key phrases
A
B
E I
R
T
X
Z
Associate in Science degree Visiting area businesses and assessing training needs. Preparing students for direct entry into positions, attention to growth industry opportunities. Workforce development Educated, highly skilled workforce Workforce Development – provide student-centered workforce programs Workforce education provider Creating a learning workforce in a knowledge economy
For the 2004/2005 time period, just as with the mission statements, transfer loses
prominence in the goals. Table 20 includes three institutions categorized as “strong,” and
Table 21 includes the eight categorized as “medium.” With regard to the “transfer weak”
category, 16 are represented: A, B, C, E, F, H, K, L, P, Q, R, T, W, Z, AA, and BB.
Table 22 delineates the 11 institutions and key phrases included in the “workforce
development strong” category. Among these key phrases, a new note is included with the
“Teacher Education Center.” Florida community colleges were approved to provide
alternative teacher certification in 2004. This program enables students holding a
baccalaureate degree to obtain a teaching credential through non-credit alternative
certification.

111
Table 20 2004/2005 Institutional goal statements: Transfer strong
College
Key phrases
G (3)
V (3)
U (2)
(a) Associate in arts degree; (b) visual and performing arts; (c) basic academic skills (a) Associate in Arts; (b) preparatory; (c) general education [13 outcomes] (a) Associate of arts; (b) preparatory instruction
Table 21 2004/2005 Institutional goal statements: Transfer medium
College
Key phrases
D I J
M
N
O
S
X
Associate in arts degree College preparatory program College preparatory Promote the retention and success of under-prepared students. Transfer Liberal arts education for transfer Emphasis on the science, math College transfer

112
Table 22 2004/2005 Institutional goal statements: Workforce development strong
College
Key phrases
O (5)
(a) occupational programs, workplace; (b) student support services - career; (c) workforce training and retraining; (d) customized training programs; (e) workforce needs
G (4)
(a) Associate in Science degree, applied technology diploma, technical certificates; (b) vocational programs; (c) workforce development; (d) continuing workforce education and training
I (4)
(a) Occupational degree/certificate programs; (b) Teacher Education Center (c) web page - career counseling, job placement; (d) review of Corporate Training and Continuing Education to identify future market growth/declines
V (4)
(a) Associate in science; (b) Associate in Science, Associate in Applied Science, selected Technical Certificate and Applied Technology programs; (c) improve employability, enhance career skills; (d) economic development through special education and training programs
J (2)
(a) Certificate and degree programs for employment and careers; (b) economic and workforce development
U (2)
(a) Associate of science (b) training for immediate employment by offering associate of applied science, vocational-technical certificate and continuing education programs

113
Table 22, continued
College
Key phrases
D (2)
(a) Associate in Science degree, Associate in Applied Science degree, college credit certificate, Applied Technology Diploma, and Postsecondary Adult Vocational Certificate; (b) corporate training programs
F (2)
(a) Courses leading to employment; (b) training
R (2)
(a) Workforce development, training; (b) training
S (2)
(a) Technology education; (b) workforce development, employment, school-to- work, welfare-to-work, and one-stop career center
W (2)
(a) Career educational pathways, training needs (b) placed in a new job, continued in employment
Table 23 2004/2005 Institutional goal statements: Workforce development medium
College
Key phrases
C
E
H
T
X
Z
BB
Workforce development Entry into high-demand occupations Workforce education Workforce development Career workforce Creating a learning workforce in a knowledge economy Provide multiple opportunities for students to gain practical experience

114
Table 23 displays the seven institutions categorized as “workforce development
medium.” Nine institutions are categorized as “workforce development weak”: A, B, K,
L, M, N, P, Q, and AA.
With regard to Hypothesis 1 (there will be a greater emphasis on workforce
development in the 2004/2005 documents as compared to the 1999/2000 documents), the
findings do not support the hypothesis for the mission statements because 18 rather than
20 institutions have a “strong” or “medium” emphasis on workforce in 2004/2005 as
opposed to 1999/2000. The findings do not support the hypothesis for the goals
statements either because 18 rather than 22 institutions have a “strong” or “medium”
emphasis on workforce in 2004/2005 as opposed to 1999/2000.
The findings reject Hypothesis 2 (the transfer component will retain a dominant
place in the mission and goals statements both in 1999/2000 and in 2004/2005). During
neither time period did the transfer component have a dominant place, and as stated
earlier, transfer lost ground in 2004/2005 both for mission and goal statements. To
reiterate, transfer is ranked strong or medium in the mission statements of 15 institutions
in 1999/2000, and workforce development is ranked strong or medium in the mission
statements of 20 institutions during that time period. Transfer is ranked strong or
medium in 10 institutions in 2004/2005, and workforce development is ranked strong or
medium in 18 institutions. Comparable patterns occur with the goals. Transfer is ranked
strong or medium in 15 institutions’ goals in 1999/2000, and workforce development is
ranked strong or medium in 22 institutions goals. In 2004/2005, transfer is ranked strong
or medium in 11 institutions’ goals, and workforce development is ranked strong or
medium in 18 institutions’ goals.

115
For Hypothesis 3 (Small colleges will have a stronger workforce development
emphasis in their mission and goals statements for 1999/2000 and for 2004/2005), the
tables that follow indicate the patterns found among the institutions. Proportionately,
small colleges had a stronger workforce development emphasis than other colleges only
for the 1999/2000 mission statements.
Table 24 Workforce development mission patterns 1999/2000
Size of
College
Weak
Representation
Medium
Strong
Small (n=5)
A
C
B, D, E
Medium (n=7)
G, L
I, J, K
F, H
Large (n=15)
P, T, X, BB
M, S, V
O, N, Q, R, U, W, Z, AA
Table 25 Workforce development mission patterns 2004/2005
Size of
College
Weak
Representation
Medium
Strong
Small (n=5)
E
A, C, D
B
Medium (n=7)
G, L
H, I, J, K
F
Large (n=15)
M, P, T, X, AA, BB
Q, S, U, W, Z
O, N, R, V
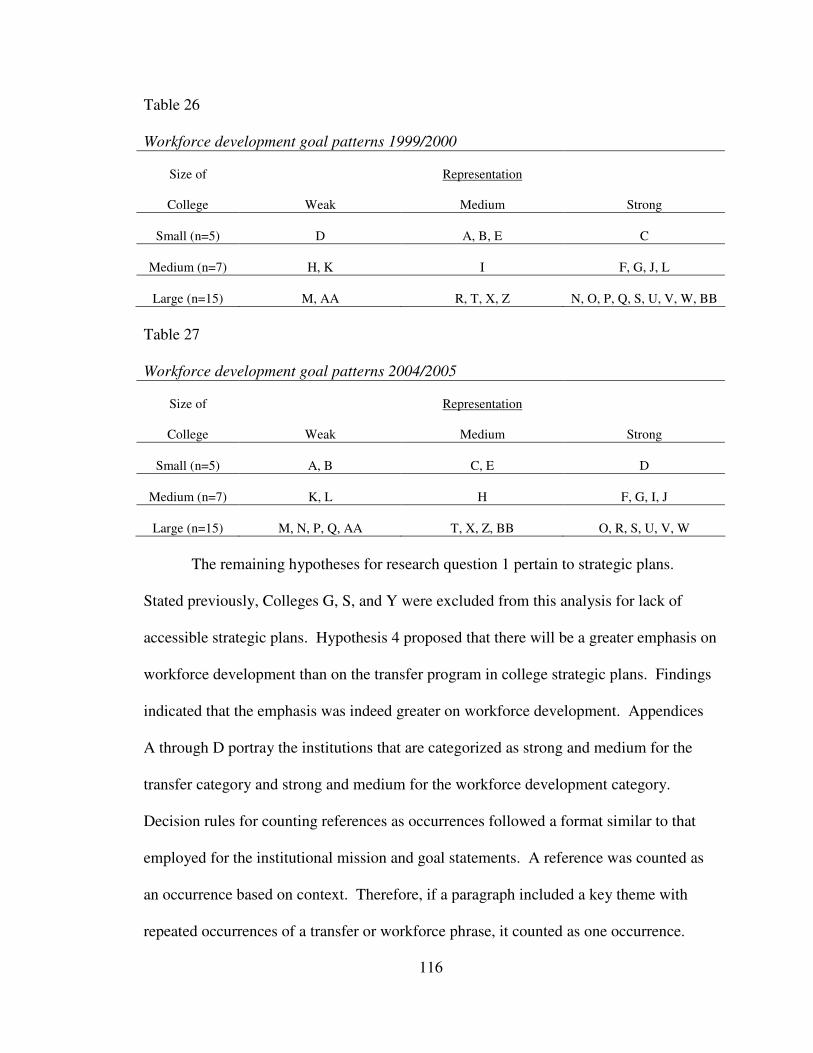
116
Table 26 Workforce development goal patterns 1999/2000
Size of
College
Weak
Representation
Medium
Strong
Small (n=5)
D
A, B, E
C
Medium (n=7)
H, K
I
F, G, J, L
Large (n=15)
M, AA
R, T, X, Z
N, O, P, Q, S, U, V, W, BB
Table 27 Workforce development goal patterns 2004/2005
Size of
College
Weak
Representation
Medium
Strong
Small (n=5)
A, B
C, E
D
Medium (n=7)
K, L
H
F, G, I, J
Large (n=15)
M, N, P, Q, AA
T, X, Z, BB
O, R, S, U, V, W
The remaining hypotheses for research question 1 pertain to strategic plans.
Stated previously, Colleges G, S, and Y were excluded from this analysis for lack of
accessible strategic plans. Hypothesis 4 proposed that there will be a greater emphasis on
workforce development than on the transfer program in college strategic plans. Findings
indicated that the emphasis was indeed greater on workforce development. Appendices
A through D portray the institutions that are categorized as strong and medium for the
transfer category and strong and medium for the workforce development category.
Decision rules for counting references as occurrences followed a format similar to that
employed for the institutional mission and goal statements. A reference was counted as
an occurrence based on context. Therefore, if a paragraph included a key theme with
repeated occurrences of a transfer or workforce phrase, it counted as one occurrence.

117
This strategy was adopted with the intent of finding a method to treat the strategic plans
in a comparable fashion even though they followed diverse formats, ranging from a one-
page mission and goal document titled “strategic plan” to a 315-page document with
multiple objectives. Note that only two institutions presented plans that included
multiple objectives in this fashion, and they are referenced in the tables below. College L
included 179 unit plans; College Q included 677 objectives. Other institutions referenced
planning at the unit level but did not provide unit plans during the duration of the field
experience.
As stated previously, just as with the mission and institutional goals, the
community colleges included more comments or key phrases related to workforce
development than to transfer. Many colleges included references to specific programs
and workforce development initiatives. The length of the strategic plan had little
relationship to size; the smallest college had one of the more complex and lengthy plans
that apparently stemmed from a recent accreditation review.
Again, the appendices include detailed notes and key phrases. Some key points
and common themes are portrayed in the following paragraphs. For example, one
holdover for retaining the perception that the transfer mission is dominant may lie with
faculty perceptions or other key stakeholder impressions. College R reported that general
education faculty viewed the historical mission of liberal arts and college transfer as
increasing in significance. College X noted that the state legislature was increasing the
emphasis in the community college mission upon workforce development and adult
vocational education. Therefore, the College needed to pursue this opportunity, but not at
the expense of its transfer program.

118
College U took somewhat of an opposing view to protecting the transfer program,
commenting that the baccalaureate would continue to be important to parents and high
school graduates but that most adults would place more value upon the acquisition of
knowledge and skills recognized by the marketplace. This same college referred to
workforce development as a hot topic – greatly supported by the fact that 18 of the
respondents used the term “workforce” specifically in their strategic plans.
Nine of the colleges included specific references to workforce development
programs in their strategic plans. Others included more generalized references to
workforce programs, including the development of new short-term certificates and
customized training for businesses and industries. Customized training programs, in fact,
may not likely be included in this research study because many are less than 45 contact
hours in duration.
Another point of interest in the strategic plans includes the emphasis on
preparatory or remedial education. As noted in the decision rules, this category was
included with the transfer category. With a growing number of students requiring
remediation, this mission component remains a priority at the state level. Out of the
responding colleges, 16 had specific references or goals related to improving success in
their preparatory programs, including vocational preparatory programs.
Returning to the more generalized findings, for the transfer category, 18
institutions are categorized as strong. In the following list, each institutional code is
followed by the number of “transfer strong” occurrences: A (11); U (10); N (9); F (8);
BB (8); D (6); X (6); C (4); L (4); Z (4 with sub-objectives); AA (4); R (3); V (3); I (2); J
(2); O (2); and W (2). As a specific example, institution A had 11 occurrences of

119
comments or key phrases related to the transfer category. Institutions E, H, and Q are
categorized as transfer medium, meaning they only had one occurrence of a transfer-
related comment or key phrase, and institutions B, K, M, P, and T are categorized as
transfer weak, meaning they had no occurrences of a transfer-related comment or key
phrase.
Twenty institutions are categorized as “workforce development strong,” and the
list that follows also includes each institutional code followed by the number of
“workforce development strong” occurrences: U (16); F (15); D (13); R (11); BB (10); J
(9); A (7); Z (7); AA (7); V (6); C (5); L (5); O (5); W (5); X (5); I (4); H (3); N (3); Q
(3); E (2). Institution T is the only one coded as “workforce development medium,” and
institutions B, K, M, and P are coded as “workforce development weak.” When
comparing the number of occurrences overall, the 18 institutions with a “transfer strong”
categorization total 88 occurrences. The 20 institutions categorized as “workforce
development strong” total 141 occurrences. Therefore, the findings support the
hypothesis indicating a greater emphasis on workforce development in the strategic plans.
Hypothesis 5 again addresses size: Small colleges will include the strongest
emphasis on workforce development in their strategic plans. Findings indicate a weak
relationship at best with size. With so few colleges categorized as “small” in this study
(Colleges A through E), the researcher looked at the proportionate emphasis of workforce
development occurrences to help answer the question. In the “workforce development
strong” list above, the median occurrence is 5.5. Of large colleges in that list, 11 out of
13 were categorized as “workforce development strong,” and six out of the 11 (0.54%)
had higher occurrences than the median occurrence. Of medium colleges, five out of six

120
were categorized as “workforce development strong,” and two out of the five (0.40%)
had higher occurrences than the median occurrence. Finally, of the small colleges, four
out of five were categorized as “workforce development strong,” and two out of the four
(0.50%) had higher occurrences than the median occurrence. Proportionately, therefore,
out of the institutions in the “workforce development strong” category, large institutions
had the highest occurrences above the median, which suggests that the findings refute the
hypothesis.
In summary, research question 1 queries, “Do Florida public community college
mission and planning statements support leadership policy statements with regard to the
dominance of the role of workforce development in the community college curriculum?”
The findings indicate that mission and planning statements do support leadership policy
statements with regard to the dominance of the role of workforce development. Although
a slight decline in workforce development emphasis occurs in 2004/2005 over
1999/2000, the transfer component does not have a dominant place for either time period
in the mission and goals statements. The relationship of workforce development
emphasis and institutional size is not a strong one, but workforce development clearly has
a stronger emphasis in strategic plans.
In the next section, the results of the curricular analysis are presented. Research
questions 2, 3, and 4 explore aspects of the curriculum that include comparisons between
colleges, between the 1999/2000 and 2004/2005 time periods, and between the credit
curriculum and the total curriculum. Size is also included in the analysis.

121
Results of Curricular Analysis
The remaining research questions examine actual curricular patterns by assessing
the numbers and types of course sections offered during the fall 2004 term. Each
research question is treated in turn in the remainder of this chapter.
Research question 2. “What is the overall composition of the Florida public
community college curriculum, utilizing the classification scheme defined by the
CSCC?” This research question includes two hypotheses:
6. Hypothesis 6: The overall presentation of the curriculum will indicate that the
ratio between transfer and workforce development coursework becomes close
to equal, but the transfer coursework will represent a larger proportion of the
overall curriculum.
7. Hypothesis 7: The credit curriculum comparison against the 2000 Florida
Study will indicate growth in workforce development offerings.
For the current study, the researcher coded 44,405 sections of credit coursework
offered in fall 2005, comparable to the 42,928 sections that were coded for the 2000
study. Colleges J and O were excluded from the current study because the researcher was
unable to obtain copies of the fall 2004 credit schedules.
Overall results indicated that neither hypothesis for research question 2 was
supported and that the proportion of the community college curriculum devoted to
transfer is actually larger than that devoted to workforce development education. Table
28 displays the percentage of credit non-liberal arts and liberal arts sections as part of the
total credit sections for the current study and the 2000 study. In the 2000 study, the non-
liberal arts represented 33.7% of the total credit curriculum. In the current study, the

122
Table 28
Percentage of credit non-liberal arts and liberal sections as part of total credit sections
Discipline
Total credit
sections in 2007 study
n=44,405
Total credit
sections in 2000 study
n=42,928
Non-liberal arts Technical education Business and office Health Personal skills/avocational Internships/practica Education Trade and industry Engineering/science technologies Marketing/distribution Criminal justice Agriculture Military science Other Totals Liberal Arts
#
3,491
2,706
2,459
1,522
643
876
973
441
245
366
128
75
186
14,111
30,294
%
7.9
6.1
5.5
3.4
1.4
2.0
2.2
1.0
0.6
0.8
0.3
0.2
0.4
31.8
68.2
#
3,541
3,109
1,999
1,756
1,003
969
867
505
337
176
112
60
16
14,450
28,478
%
8.2
7.2
4.7
4.1
2.3
2.3
2.0
1.2
0.8
0.4
0.3
0.1
0.0
33.7
66.3
Grand totals
44,405
100.0
42,928
100.0

123
non-liberal arts represent 31.8% of the study. The findings reject Hypothesis 6 in that the
ratio between transfer and workforce development coursework do not become close to
equal. In fact, the transfer coursework represents a larger proportion of the overall credit
curriculum in the current study than in the 2000 study. The findings also reject
Hypothesis 7 in that proportionately, workforce development offerings declined rather
than grew.
To investigate the research question further, institutional size was included in the
analysis. Five institutions were classified as small (an unweighted FTE less than or equal
to 2,748), six were classified as medium (an unweighted FTE between 2,749 and 6,410),
and 15 were classified as large (an FTE greater than or equal to 6,410). Again, Colleges J
and O were eliminated from the analysis because fall credit schedules were missing.
Table 29 displays a comparison of the percentages of credit non-liberal arts and
liberal arts sections as part of the total credit sections for small, medium, and large
colleges. Small colleges have the highest percentage of the curriculum devoted to the
non-liberal arts (37.6%) which contrasts with the 31.8% in the overall analysis. Medium
colleges also have a higher percentage of non-liberal arts sections (34.1%) than the
overall analysis. The next research question takes the analysis to a greater level of detail
by examining the representation of the disciplines within the non-liberal arts curriculum.

124
Table 29
Percentage of credit non-liberal arts and liberal sections as part of total credit sections:
small, medium, and large institutions
Discipline
Total credit
sections – small
n=1,849
Total credit
sections – medium
n=4,434
Total credit
sections – large
n=38,122
Non-liberal arts Technical education Business and office Health Personal skills/ avocational Internships/practica Education Trade and industry Engineering/science technologies Marketing/ distribution Criminal justice Agriculture Military science Other Totals Liberal Arts
#
157
117
95
112
32
33
37
17
7
20
51
0
17
695
1,154
%
8.5
6.3
5.1
6.1
1.7
1.8
2.0
0.9
0.4
1.1
2.8
0.0
0.9
37.6
62.4
#
325
309
357
119
95
118
69
30
18
29
19
3
19
1,510
2,924
%
7.3
7.0
8.1
2.7
2.1
2.7
1.6
0.7
0.4
0.7
0.4
0.1
0.4
34.1
65.9
#
3,009
2,280
2,007
1,291
516
725
867
394
220
317
58
72
150
11,906
26,216
%
7.9
6.0
5.3
3.4
1.4
1.9
2.3
1.0
0.6
0.8
0.2
0.2
0.4
31.2
68.8
Grand totals
1,849
100.0
4,434
100.0
38,122
100.0

125
Research question 3. “How have the non-liberal arts college-credit offerings
changed between the 2000 Florida findings and the current study?” This research
question includes one hypothesis:
8. Hypothesis 8: The changes in the non-liberal arts college-credit offerings will
include an increase in the category “technical education” and a decrease in the
category “trade and industry.”
Table 30 displays the percentage of disciplines represented within the credit non-
liberal arts sections. The findings support the first part of the hypothesis: Technical
education increases slightly from 24.5% in the 2000 study to 24.7% in the current study.
However, trade and industry also shows an increase from 6.0% to 6.9%. With regard to
other areas of growth, health represents 17.4% of the non-liberal arts sections in the
current study, as opposed to 13.8% in the 2000 study, and criminal justice increases from
1.2% to 2.6%. The growth in the latter may be attributed to the impact of 9-11, although
on a local level, the popularity of television shows such as “CSI” seem to have an
influence as well.
Research question 4. “What proportion of the Florida community college
curriculum is workforce development education when the non-credit and vocational
credit curriculum is included?” This research question includes one hypothesis:
9. Hypothesis 9: The proportion of the Florida community college curriculum
that is workforce development when the non-credit and vocational credit
curriculum is included will approach 50%, but the transfer curriculum will
retain a higher proportion of the overall curriculum.

126
Table 30
Percentage of disciplines represented in credit non-liberal arts sections
Discipline
Non-liberal arts sections in
2007 study
N=14,111
Non-liberal arts sections in
2000 study
n=14,450
Technical education Business and office Health Personal skills/avocational Internships/practica Education Trade and industry Engineering/science technologies Marketing/distribution Criminal justice Agriculture Military science Other
#
3,491
2,706
2,459
1,522
643
876
973
441
245
366
128
75
186
%
24.7
19.2
17.4
10.8
4.6
6.2
6.9
3.1
1.7
2.6
0.9
0.5
1.3
#
3,541
3,109
1,999
1,756
1,003
969
867
505
337
176
112
60
16
%
24.5
21.5
13.8
12.2
6.9
6.7
6.0
3.5
2.3
1.2
0.8
0.4
0.1
Totals
14,111
100.0
14,450
100.0

127
Table 31 displays the comparison of the total sections in the current study, non-
credit sections included, against the credit-only sections. With the addition of the non-
credit sections, the percentage of non-liberal arts sections rose from 31.8% to 36.8%.
The findings do not strongly support the hypothesis that the proportion will approach
50%, but they do support the statement that the transfer curriculum retains a higher
proportion of the overall curriculum.
In reminder, only those sections of workforce development that consisted of 45
contact hours or more were included in the analysis. Within the entire database of
postsecondary adult vocational and continuing workforce education sections offered in
fall 2004, only 36% met the criteria of 45 contact hours or above. The disciplines upon
which the addition of non-credit sections had the greatest impact were (a)
internships/practica, which includes apprenticeships, increasing from 1.4% to 2.5%, (d)
trade and industry, increasing from 2.2% to 3.8%, and criminal justice, increasing from
0.8% to 2.2%.
To examine the research question from a different perspective, size again was
included in the analysis. Table 32 displays the percentages of total sections by
institutional category: small, medium, and large. Findings reveal that the proportion of
non-liberal arts to liberal arts sections in small institutions do approach 50%, with the
non-liberal arts at 46.1% and the liberal arts at 53.9%. The greatest gains in discipline
representation were in trade and industry at 5.7% and criminal justice at 7.1% versus
2.0% and 1.1% respectively when credit curriculum alone is included in the analysis.

128
Table 31
Comparison of total sections against credit-only sections
Discipline
Total sections in 2007 study
n=48,158
Total credit sections in 2007
study
n=44,405
Non-liberal arts Technical education Business and office Health Personal skills/avocational Internships/practica Education Trade and industry Engineering/science technologies Marketing/distribution Criminal justice Agriculture Military science Other Totals Liberal Arts
#
3,763
3,201
2,866
1,545
1,219
938
1,835
482
340
1,074
134
75
252
17,724
30,434
%
7.8
6.6
6.0
3.2
2.5
1.9
3.8
1.0
0.7
2.2
0.3
0.2
0.5
36.8
63.2
#
3,491
2,706
2,459
1,522
643
876
973
441
245
366
128
75
186
14,111
30,294
%
7.9
6.1
5.5
3.4
1.4
2.0
2.2
1.0
0.6
0.8
0.3
0.2
0.4
31.8
68.2
Grand totals
48,158
100.0
44,405
100.0

129
Table 32
Comparison of total sections against credit-only sections: small, medium, and large
institutions
Discipline
Total sections –
small
n=2,140
Total sections –
medium
n=4,434
Total sections –
large
n=41,021
Non-liberal arts Technical education Business and office Health Personal skills/ avocational Internships/practica Education Trade and industry Engineering/science technologies Marketing/ distribution Criminal justice Agriculture Military science Other Totals Liberal Arts
#
181
129
124
113
32
37
122
20
8
152
51
0
17
986
1,154
%
8.5
6.0
5.8
5.3
1.5
1.7
5.7
0.9
0.4
7.1
2.4
0.0
0.8
46.1
53.9
#
349
346
442
122
143
125
252
38
34
155
21
3
43
2,073
2,924
%
7.0
6.9
8.8
2.4
2.9
2.7
5.0
0.8
0.7
3.1
0.4
0.1
0.9
41.5
58.5
#
3,233
2,726
2,300
1,310
1,044
776
1,461
424
298
767
62
72
192
14,665
26,356
%
7.9
6.0
5.3
3.2
2.5
1.9
3.6
1.0
0.7
1.9
0.2
0.2
0.5
35.7
64.3
Grand totals
2,140
100.0
4,997
100.0
41,021
100.0

130
The curricular proportions for medium institutions also become closer at 41.5%
for the non-liberal arts and 58.5% for the liberal arts. Again, the greatest gains were in
the trade and industry discipline and the criminal justice discipline. The comparisons are
5.0% versus 1.6% for trade and industry when the non-credit curriculum is included, and
3.1% versus 0.7% for criminal justice when the non-credit curriculum is included.
As would be expected with the disproportionate number of large institutions, large
institution findings are comparable to the overall findings. With the addition of the non-
credit curriculum, the non-liberal arts proportion increases from 31.2% to 35.7%. The
increase in trade and industry is from 2.3% to 3.6%, and in criminal justice is from 0.8%
to 1.9%.
Summary
The purpose of this study is twofold. One is to determine whether the current
composition of the overall Florida public community college curriculum and the content
of Florida public community college mission and planning statements provide evidence
to support Florida leadership policy statements that portray workforce development as a
primary component of the community college mission. The second is to determine
whether a longitudinal assessment of the curriculum and the content of mission and
planning statements will provide evidence that workforce development has increased as a
component of the community college mission. To achieve this study, the researcher
conducted a content analysis of institutional mission and goal statements for the time
periods of 1999/2000 and 2004/2005. Comparisons were made across the time periods
and between institutions. The researcher also conducted a content analysis of

131
institutional strategic planning documents that were in effect during the 2004/2005 time
period, and a curricular analysis of credit and non-credit course offerings for the fall 2004
term.
Findings determined the responses to four research questions:
1. Do Florida public community college mission and planning statements
support national and state leadership policy statements with regard to the
dominance of the role of workforce development in the community college
curriculum?
2. What is the overall composition of the Florida public community college
curriculum, utilizing the classification scheme defined by the CSCC?
3. How have the non-liberal arts college-credit offerings changed between the
2000 Florida findings and the current study?
4. What proportion of the Florida community college curriculum is workforce
development education when the non-credit and vocational credit curriculum
is included?
The content analysis indicated that mission and planning statements support
national and state leadership policy statements regarding the dominance of workforce
development in the community college curriculum, particularly in the strategic plans,
with almost half as many more occurrences of workforce development references as
transfer references. The evaluation of the overall composition of the Florida public
community college curriculum, however, indicates that rather than declining in
proportion, the liberal arts have grown in proportion from 66.3% to 68.2%. In terms of
change from the 2000 study to the current one, technical education, trade and industry,

132
health, and criminal justice show increases. Finally, with the addition of the non-credit
sections, the percentage of non-liberal arts sections rises from 31.8% to 36.8%, but the
liberal arts curriculum retains its dominant place in the overall curriculum. When size is
factored in, small and medium institutions do approach 50% in the proportional
representation of the non-liberal arts to the liberal arts.
The next chapter presents an overview of the findings, followed by conclusions
and implications for practice and research. Included in the chapter is a summary of the
method as well as limitations of the study and a final summary statement.

133
Chapter 5
Summary of Findings, Conclusions, and Implications for Practice and Research
The purpose of this study was twofold. One was to determine whether the current
composition of the overall Florida public community college curriculum and the content
of Florida public community college mission and planning statements provided evidence
to support Florida leadership policy statements that portray workforce development as a
primary component of the community college mission. The second was to determine
whether a longitudinal assessment of the curriculum and the content of mission and
planning statements provided evidence that workforce development has increased as a
component of the community college mission.
Through the assumptions of legitimation theory, the overriding hypothesis of this
study was that community colleges as institutions that allocate status confer a higher
status through their transfer mission than through their workforce development mission.
Therefore, the study prediction was that transfer mission would remain paramount in the
Florida community college curriculum. Also through the assumptions of legitimation
theory, a secondary prediction was that the longitudinal analysis would indicate growth in
workforce development education because postsecondary institutions served to validate
the degree requirement.
To provide background to this study, several literature threads were presented.
Theoretical perspectives were explored on the growth of workforce development
education in the community college mission. Historical and contemporary background

134
was reviewed on the growth of workforce development education in the community
college mission. A description was supplied of the new vocationalism, workforce
development, and the Florida community college and the role of vocational education.
An overview was delivered of related curriculum studies, and a discussion was provided
of the content analysis method.
Summary of Method
To achieve this study, the researcher conducted a content analysis of institutional
mission and goal statements for the time periods of 1999/2000 and 2004/2005. The year
1999/2000 was used because that was the year used in the 2000 Florida Curriculum
Study, which provided the basis for comparison in the current study. Comparisons were
made across the time periods and between institutions. Size was included as a factor.
The categories of “small,” “medium,” and “large” used the definition in the 2000 Florida
study. The five small colleges were those with an unweighted 1999/2000 FTE less than
or equal to 2,748, the seven medium colleges were those with an unweighted 1999/2000
FTE between 2,749 and 6,410, and the 16 large colleges were those with an FTE greater
than or equal to 6,410.
The researcher also conducted a content analysis of institutional strategic planning
documents that were in effect during the 2004/2005 time period, and a curricular analysis
of credit and non-credit course offerings for the fall 2004 term. In order to conduct the
content analysis, the researcher established decision rules to define the categories that
would be included in the general categories of “transfer” and “workforce development.”
These decision rules are supplied in detail in Chapter 4. In order to conduct the curricular

135
analysis, the researcher collected fall 2004 catalogs and course schedules from the
institutions that were included in the Florida public community college system and
applied a classification scheme developed and applied by researchers at the CSCC in
seven national community college curriculum studies conducted between 1975 and 1998.
The researcher coded all credit course sections listed in the schedules, excluding labs
(unless the lab was included in the course as a “C,” which meant that the course was
treated as one section). Because of difficulties in obtaining information on the non-
credit curriculum, the researcher used a database supplied by the Department of
Education which included all Florida community college postsecondary adult vocational
and continuing workforce education sections offered during the fall of 2004. Because
the three-credit hour section was used as the standard, only those non-credit sections that
were 45 contact hours or greater in length were included in the study. For the current
study, the researcher coded 44,405 sections of credit coursework offered in fall 2005,
comparable to the 42,928 sections that were coded for the 2000 study. With the addition
of non-credit sections, the total number of sections became 48,158.
Summary of Findings
Four research questions guided the study:
1. Do Florida public community college mission and planning statements
support national and state leadership policy statements with regard to the
dominance of the role of workforce development in the community college
curriculum?

136
2. What is the overall composition of the Florida public community college
curriculum, utilizing the classification scheme defined by the CSCC?
3. How have the non-liberal arts college-credit offerings changed between the
2000 Florida findings and the current study?
4. What proportion of the Florida community college curriculum is workforce
development education when the non-credit and vocational credit curriculum
is included?
Research question 1. “Do Florida public community college mission and
planning statements support leadership policy statements with regard to the dominance of
the role of workforce development in the community college curriculum?” This research
question includes five hypotheses:
1. Hypothesis 1: There will be a greater emphasis on workforce development in
the 2004/2005 documents as compared to the 1999/2000 documents.
2. Hypothesis 2: the transfer component will retain a dominant place in the
mission and goals statements both in 1999/2000 and in 2004/2005.
3. Hypothesis 3: Small colleges will have a stronger workforce development
emphasis in their mission and goals statements for 1999/2000 and for
2004/2005.
4. Hypothesis 4: There will be a greater emphasis on workforce development
than on the transfer program in college strategic plans.
5. Hypothesis 5: Small colleges will include the strongest emphasis on
workforce development in their strategic plans.

137
With regard to Hypothesis 1 (there will be a greater emphasis on workforce
development in the 2004/2005 documents as compared to the 1999/2000 documents), the
findings do not support the hypothesis for the mission statements because 18 rather than
20 institutions have a “strong” or “medium” emphasis on workforce in 2004/2005 as
opposed to 1999/2000. The findings do not support the hypothesis for the goals
statements either because 18 rather than 22 institutions have a “strong” or “medium”
emphasis on workforce in 2004/2005 as opposed to 1999/2000.
The findings also do not support Hypothesis 2 (the transfer component will retain
a dominant place in the mission and goals statements both in 1999/2000 and in
2004/2005). During neither time period did the transfer component have a dominant
place, and as stated earlier, transfer lost ground in 2004/2005 both for mission and goal
statements. To reiterate, transfer is ranked strong or medium in the mission statements of
15 institutions in 1999/2000, and workforce development is ranked strong or medium in
the mission statements of 20 institutions during that time period. Transfer is ranked
strong or medium in 10 institutions in 2004/2005, and workforce development is ranked
strong or medium in 18 institutions. Comparable patterns occur with the goals. Transfer
is ranked strong or medium in 15 institutions’ goals in 1999/2000, and workforce
development is ranked strong or medium in 22 institutions goals. In 2004/2005, transfer
is ranked strong or medium in 11 institutions’ goals, and workforce development is
ranked strong or medium in 18 institutions’ goals. For Hypothesis 3 (Small colleges will
have a stronger workforce development emphasis in their mission and goals statements
for 1999/2000 and for 2004/2005), proportionately, small colleges had a stronger

138
workforce development emphasis than other colleges only for the 1999/2000 mission
statements.
Hypothesis 4 proposes that there will be a greater emphasis on workforce
development than on the transfer program in college strategic plans. When comparing
the number of occurrences overall, the 18 institutions with a “transfer strong”
categorization total 88 occurrences. The 20 institutions categorized as “workforce
development strong” total 141 occurrences. Therefore, the findings support the
hypothesis that there is a greater emphasis on workforce development in the college
strategic plans.
Hypothesis 5 again addresses size: Small colleges will include the strongest
emphasis on workforce development in their strategic plans. In the listing of
occurrences of workforce development categories, the median occurrence is 5.5.
Proportionately, out of the institutions in the “workforce development strong” category,
large institutions had the highest occurrences above the median, which suggests that the
findings refute the hypothesis.
Research question 2. “What is the overall composition of the Florida public
community college curriculum, utilizing the classification scheme defined by the
CSCC?” This research question includes two hypotheses:
8. Hypothesis 6: The overall presentation of the curriculum will indicate that the
ratio between transfer and workforce development coursework becomes close
to equal, but the transfer coursework will represent a larger proportion of the
overall curriculum.

139
9. Hypothesis 7: The credit curriculum comparison against the 2000 Florida
Study will indicate growth in workforce development offerings.
In the current study, the non-liberal arts represent 31.8% of the curriculum. The
findings reject Hypothesis 6 in that the ratio between transfer and workforce development
coursework do not become close to equal. In fact, the transfer coursework represents a
larger proportion of the overall credit curriculum in the current study than in the 2000
study. The findings also reject Hypothesis 7 in that proportionately, workforce
development offerings declined rather than grew.
Research question 3. “How have the non-liberal arts college-credit offerings
changed between the 2000 Florida findings and the current study?” This research
question includes one hypothesis:
8. Hypothesis 8: The changes in the non-liberal arts college-credit offerings will
include an increase in the category “technical education” and a decrease in the
category “trade and industry.”
The findings support the first part of the hypothesis: Technical education
increases slightly from 24.5% in the 2000 study to 24.7% in the current study. However,
trade and industry also shows an increase from 6.0% to 6.9%. Other areas of growth
include health, which represents 17.4% of the non-liberal arts sections in the current
study, as opposed to 13.8% in the 2000 study, and criminal justice, which increased from
1.2% to 2.6%.
Research question 4. “What proportion of the Florida community college
curriculum is workforce development education when the non-credit and vocational
credit curriculum is included?” This research question includes one hypothesis:

140
9. Hypothesis 9: The proportion of the Florida community college curriculum
that is workforce development when the non-credit and vocational credit
curriculum is included will approach 50%, but the transfer curriculum will
retain a higher proportion of the overall curriculum.
With the addition of the non-credit sections, the percentage of non-liberal arts
sections rose from 31.8% to 36.8%. The findings do not support the hypothesis that the
proportion will approach 50%, but they do support the statement that the transfer
curriculum retains a higher proportion of the overall curriculum. When size is factored in
the analysis, small institutions do approach 50%, with the non-liberal arts curriculum at
46.1% and the liberal arts curriculum at 53.9%.
Conclusions
The results of this study indicate that in general, planning statements provide
support for Florida leadership policy statements that portray workforce development as a
primary component of the community college mission. Strategic plans in particular
emphasize workforce development as a priority. However, the curricular analysis
indicated growth in workforce development offerings only after the non-credit curriculum
was factored in. Without the non-credit offerings, the non-liberal arts curriculum
declined in representation in 2004/2005 as opposed to 1999/2000.
The liberal arts emphasis in the curriculum is unquestionably tied to the historical
development of Florida community colleges. Described in more detail in Chapter 2,
when the rest of the nation’s two-year higher education institutions were experiencing
growth in technical areas, trade schools covered much of Florida’s technical training, and

141
junior colleges frequently shared buildings with vocational schools (Stakenas, Mock, &
Eaddy, 1984). The director and secretary of the Community College Council, James L.
Wattenbarger, commented on the fact that vocational education was not well represented
in Florida’s existing two-year colleges (Wattenbarger, 1953).
As mentioned in Chapter 1, the emphasis on workforce development education
does depend on how the data are presented. Sections were the unit of analysis for this
study, and another study might pursue the nature of workforce development education
being provided, particularly with regard to new program development. However, looking
at enrollment versus sections still shows an emphasis on the liberal arts function and even
suggests a decline in workforce development enrollment. In Chapter 1, 2000-2001
statistics were provided that indicated approximately 38% of enrollment in workforce-
related programs. Looking at 2005-2006 enrollment statistics (FLDOE, 2007),
approximately 35% of community college students are enrolled in workforce related
programs. With regard to degree completers, which admittedly leaves out continuing
workforce education completers, the A.A. degree retains a strong position at more than
50% (FLDOE, 2007). The A.S. Degree represents about 17%, which is lower than the
2001-2002 representation of 19%, and the vocational and college credit certificates
represent approximately 32%, which is an increase from 25% in 2001-2002. This growth
in certificate awards may suggest that more focus should be placed on the certificate
credential in the workforce development arena. Expanding upon that note and
mentioned in Chapter 4, a recurring theme in the strategic plans was the generalized
statements about the development of new programs, including short-term certificates and
customized training. Based on the fact that these types of workforce development

142
activities may not have met the research study requirement of 45 contact hours,
community colleges may well be offering a higher proportion of workforce development
offerings than this study found.
Limitations
The planning documentation was not exhaustive in that not all plans referenced
were provided for the content analysis. In fact, the variety of the planning documents
affirms the independent nature of Florida’s community college system. Some of the
institutional mission, goal, and strategic plans clearly reflected planning documentation at
the state level. Others reflected regional accrediting requirements such as a focus on
learning outcomes. With the content analysis approach, the researcher attempted a
meaningful comparative analysis of documents that followed an array of patterns and
levels of depth.
Although course sections tended to follow a consistent structure, a limitation
might be the elimination from the study of non-credit sections that were not at least 45
contact hours in length. Only 4,407 out of 11,324 postsecondary adult vocational and
continuing education workforce sections met these criteria. Of that 36%, 3,867 or 96%
were sections that were greater than 45 contact hours. Under a different approach, a
researcher might have assigned more weight to sections that were twice, three times, or
more than the baseline 45 contact hours. In this study, the section was the unit of
analysis rather than the contact hours.
Mentioned in the conclusion, another limitation related to the section being used
as the unit of analysis is that workforce development programs by their nature have fewer

143
sections. In terms of looking at workforce development representation in the curriculum,
the question that has to be answered is whether the community is being adequately served
by what is being represented in the curriculum, regardless of the quantity of sections.
Finally, the study relies upon a classification scheme that, like all classification
schemes, is arbitrary in nature. Some may argue that courses developed specifically for
workforce programs, such as anatomy and physiology, should be classified as “non-
liberal arts” rather than “liberal arts.” The decision rules applied in this study categorized
courses based on the decision rules applied in past studies for the purposes of consistency
and comparison.
Implications for Theory
The researcher applied legitimation theory to hypothesize that community
colleges as institutions that allocate status confer a higher status through their transfer
mission than through their workforce development mission. In support of the theory, the
transfer mission did remain paramount in the Florida community college curriculum.
The longitudinal analysis proved not to support the secondary prediction that growth
would occur in workforce development education. The premise behind the secondary
prediction was that growth would occur because postsecondary institutions served to
validate the certificate and degree requirement. The strength of the workforce certificate
and degree validation appeared to be outweighed by the higher status conferred upon the
transfer mission, and legitimation theory would support that the transfer mission would
retain a stronger emphasis. Other factors that may have a negative impact on the strength

144
of the workforce validation include the abilities of community colleges to compete with
other institutions in providing workforce development educational and training programs.
Workforce development may gain in stature as Associate in Science degree
options become increasingly transferable: legitimation theory would support increased
status because the A.S. degree would link to baccalaureate options. However, students
need to be made aware of this growing opportunity. Noted in Chapter 2, research
suggests that many community college students are not necessarily clear on the degree
paths they are choosing.
In summary, based on the findings, legitimation theory was supported by the
strong emphasis of the transfer mission in the Florida community college curriculum.
Community colleges as institutions that allocate status confer a higher status through their
transfer curriculum – if not their transfer mission statements. However, the expected
growth that would occur in workforce development coursework did not happen. This
suggests that the workforce development mission has either not achieved sufficient
validation to students as a postsecondary option or that legitimation theory may not
sufficiently explain growth in the curriculum.
Implications for Practice
“Economic Development and Workforce” remains at the top of the list of hot
issues on the American Association of Community Colleges website (AACC, 2007).
Featured in the link are news items regarding job training, business partnerships,
workforce retraining, and community-based job training grants. In Florida, workforce
also remains a priority among policy leaders. Among its recommendations to the

145
community college council of presidents, the Performance Based Budgeting
Subcommittee proposed that the additional $10 million being requested for performance
incentive funding in 2007-08 be allocated to (a) targeted critical workforce needs, (b)
adult education, and (c) existing A.A., A.S., P.S.A.V., and apprenticeship measures
(Cisek, 2006). The category of targeted critical needs would be added and would be
intended to motivate colleges to respond to critical workforce shortages in the areas of
nursing and teacher training.
The findings from this study indicate that leadership policy directives are aligned
well with institutional mission, goal, and planning documents: workforce development
holds a dominant place. However, the findings suggest that leadership policy directives
are not aligned well with curricular patterns. Community college stakeholders should
investigate what more can be done to promote the workforce development component to
students. One critical area, again, is ensuring that community college students do have a
clear understanding of the options available to them. Are A.S. degrees being marketed
effectively? Are students aware of the “new vocationalism” approach in the shift away
from the “terminal” degree to a learner-focused, career-ladder degree?
Implications for Research
The results of this study point to additional areas for research. Noted in the
previous section, economic development and workforce development remain hot topics
for AACC and for Florida. Based on that, a more in-depth analysis could be undertaken
of workforce development programs, including the innovations that are occurring to
respond to community needs. A more comprehensive analysis of college planning

146
documentation could be undertaken by analyzing planning at the departmental level as
well as additional institutional plans such as facilities master plans. More important than
the analysis of proposed plans is the analysis of what actually is occurring. The research
could complement a study of additional planning documentation with interviews of
college leaders to assess the directions their institutions are taking.
Curricular analyses could include additional investigations of section offerings by
region or size. These analyses could be supplemented by student interviews to determine
how and why students are choosing specific programs or courses of study. Mentioned
earlier, many A.S. degrees are now articulated to the baccalaureate degree, which
expands educational pathways for students. Again, Florida’s definition of the A.S.
degree differs from many other states, and further study could take into account the
choices students make between the A.S. degree and the A.A.S. degree. In fact, the
researcher is participating in a multi-institutional research project funded by the Lumina
Foundation: Urban Transfer Research Network (UTRN). The overarching purpose of
the project is to improve transfer and success rates of students obtaining the
baccalaureate. The project will include focus group interviews of students, and
determining how and why students are choosing specific programs or courses of study
falls within the scope of the project.
Curricular analyses should also take into account the diverse range of non-credit
offerings. Mentioned previously in this study, the section was the unit of analysis, and
only those sections with greater than 45 contact hours were included. This resulted in
only 36% of the non-credit workforce development curriculum being included. Given

147
different research designs, the non-credit curriculum offerings might equal the credit
curriculum offerings.
Perhaps the most important area of research is to determine whether community
colleges are indeed meeting community needs with the volume and types of workforce
development programs being provided. All of the strategic plans included references to
meeting with key stakeholders to align programs with business and industry needs. As
part of strategic planning, community colleges do include forums with key stakeholders
to identify these needs. The question remains whether follow-through is occurring at
adequate levels. Moreover, in addition to interviewing community leaders and key
stakeholders in business and industry, the student voice plays a critical role. Again, if
students are failing to understand the opportunities being presented to them, providing
that understanding is essential.
Summary
This study undertook an investigation of intent as it related to actual practice. In
terms of the transfer and workforce development mission in Florida community colleges,
the findings were that the transfer mission remains the primary one. Although workforce
development is emphasized in planning documentation, the emphasis is much lower in
the curriculum – particularly the credit curriculum. Provided earlier in this chapter,
several factors may contribute to the lower emphasis, including the historical tradition of
Florida’s community colleges and possibly the legitimation of the transfer degree as the
degree carrying more value. However, with the growing articulation of the A.S. degree

148
to the baccalaureate, the balance may well shift in favor of a workforce development
emphasis.
The need for workforce development programs is unquestionable. Florida
continues to experience critical workforce shortages in areas such as nursing and teaching
and is continuing to feel the impact of 9-11 on its criminal justice programs and training.
Implications for practice and research include a continued need to determine whether
community colleges are meeting community needs. Most importantly, students must
have a clear understanding of program offerings and pathways. Research projects such as
UTRN are focusing on improved student success and improved student transfer rates.
The findings from this current study support the need to determine whether community
college intent is well-aligned with practice. Assuring that planning aligns well with
practice may be one of the most important factors in improved student success.
149
References
Altheide, D. (1987). Ethnographic content analysis. Qualitative Sociology, 10(1), 65-77.
American Association of Community Colleges. (n.d.). AACC Mission Statement.
Retrieved February 15, 2004, from http://www.aacc.nche.edu/Content/
NavigationMenu/AboutAACC/Mission/Our_Mission_Statement/htm.
American Association of Community Colleges. (2007). Hot issues. Retrieved January
11, 2007, from http://www.aacc.nche.edu/Template.cfm?section=HotIssues
Armstrong, D. (2004a). President Bush’s proposal to create “jobs for the 21st century.”
Community Colleges Newsletter, 2004-002. Retrieved February 2, 2004, from
http://www.fldoe.org/cc/Newsletter/default.asp?issue=21
Armstrong, D. (2004b). Career education study task force is convened. Community
Colleges Newsletter, 2004-009. Retrieved July 28, 2004, from
http://www.fldoe.org/cc/Newsletter/default.asp?issue=35
Armstrong, D. (2004c). SBOE approved community college and workforce education
budget request. Community Colleges Newsletter, 2004-009. Retrieved Septembe
12, 2004, from http://www.fldoe.org/cc/Newsletter/default.asp?issue=36
Association of College and Preparatory Schools of the Southern States. (1895).
Proceedings of the First Meeting, held in Atlanta, Georgia, November 6, 1895.
Atlanta, GA: Author.

150
Babbitt, E. (1901). “The problems of the small college in the southern states.” Paper
presented at the seventh meeting of the Association of Colleges and Preparatory
Schools of the Southern States, November, 1901Badway, N. (1998). Extent,
quality and access for integrated curriculum in community colleges. Journal of
Vocational Education Research, 23, 133-45.
Bragg, D. (1997). Grubb’s case for compromise: Can “education through occupations”
be more? Journal of Vocational Education Research, 22(2), 115-122.
Bragg, D. (2001a). Editor’s notes. New Directions for Community Colleges, 115, 1-3.
Bragg, D. (2001b). Opportunities and challenges for the new vocationalism in American
community colleges. New Directions for Community Colleges, 115, 5-15.
Brawer, F. (2000). The liberal arts. New Directions for Community Colleges, 108, 17-
29.
Breneman, D. (1994). Liberal arts colleges: Thriving, surviving, or endangered?
Washington, D.C.: The Brookings Institution
Brown, C. (2001). Two-year colleges and tech prep partnerships: A Texas perspective.
New Directions for Community Colleges (115), 51-62.
Bush, G. W. (2004). State of the Union Address. Retrieved January 21, 2004, from
http://www.news-journalonline.com/cgi-bin/printme.asp
Bush, G. W. (2004). Speeches: President George W. Bush. Retrieved September 12,
2004, from http://www.gopconvention.com/cgi-data/speeches/files/
v46q7t4op60p0109d9b8i8373arhnn0r.shtml
Cisek, E. (2006). Recommendations to the council of presidents. Retrieved January 11,
2007, from [email protected].

151
Clowes, D. (1996). Occupational education. In J.G. Gaff & J.L. Ratcliff (Eds.),
Handbook of the undergraduate curriculum (pp. 359-372). San Francisco: Jossey-
Bass Publishers.
Cohen, A., & Brawer, F. (2003) The American community college, (4th ed.). San
Francisco: Jossey-Bass.
Cohen, A. & Ignash, J. (1994). An overview of the total credit curriculum. New
Directions for Community Colleges, 86, 13-29.
Collins, R. (1971). Functional and conflict theories of educational stratification.
American Sociological Review, 36(6), 1002-1019.
Commission on Colleges of the Southern Association of Colleges and Schools. (2004).
Principles of accreditation: Foundations for quality enhancement. Decatur, GA:
Author.
Council for Education and Policy, Research and Improvement. (2004). A new emphasis
and funding methodology for adult and career education: Report and
recommendations. Tallahassee, FL: Author.
Dabney, C. (1898). “Requirements for the bachelor’s degree.” Paper presented at the
fourth meeting of the Association of Colleges and Preparatory Schools of the
Southern States, November 1-3, 1898.
Dabney, C. (1899). “Scientific and technical education.” Address presented at the fifth
meeting of the Association of Colleges and Preparatory Schools of the Southern
States, November 2-4, 1899.
Dervarics, C. (2003, August 18). President Bush praises community colleges.
Community College Week, 10.

152
Dictionary of Philosophical Terms and Names. (2005). Max Weber. Retrieved on
January 12, 2005, from http://www.philosophypages.com/dy/w.htm#webe.
Fields, E. E. (1988). Qualitative content analysis of television news: systematic
techniques. Qualitative Sociology, 11(3), 183-193.
Florida Community Colleges and Workforce Education. (2004). Our Vision – mission
and guiding principles. Retrieved October 8, 2004, from
http://www.fldoe.org/cc/Vision/our_mission.asp.
Florida Department of Education. (2004a) Workforce Definition. Retrieved October 3,
2004, from http://www.fldoe.org/cc/mindsToWork/work.asp
Florida Department of Education. (2004b). Community Colleges Facts at a Glance.
Retrieved February 15, 2004, from http://www.fldoe.org/cc/facts_glance.asp
Florida Department of Education (2007). Community Colleges Facts at a Glance.
Retrieved February 17, 2007, from http://www.fldoe.org/cc/facts_glance.asp
Florida Department of Education (2004c). Community Colleges and Workforce
Education (Microsoft® PowerPoint® Presentation). Retrieved October 1, 2004,
from http://www.fldoe.org/cc/docs/Budget.pdf
Florida State Board of Education, Administrative Rules (2004a). 6A-10.030 Other
assessment procedures for college-level communication and computation skills.
Retrieved October 31, 2004, from http://www.firn.edu/doe/rules/6a-103.htm.
Florida State Board of Education, Administrative Rules (2004b). 6A-10.033
Postsecondary credit definitions. Retrieved October 31, 2004, from
http://www.firn.edu/doe/rules/6a-105.htm.

153
Frederickson, J. (1998). Today’s transfer students: Who are they? Community College
Review, 26 (1), 43-54.
Geiger, R. (1986). To advance knowledge: The growth of American research
universities, 1900-1940. New York: Oxford University Press.
Giegerich, S. (2004, May 20). High-tech degree doesn’t guarantee jobs. Retrieved May
20, 2004, from http://e.thetimesnews.com/Repository/getFiles.asp?
Ginsberg, B., Lowi, T., & Weir, M. (2003). We the people: An introduction to American
politics (4th ed.). New York: W.W. Norton & Company.
Gleazer, E. (1998, revised). The community college: Values, vision, and vitality.
Washington, D.C.: Community College Press. (Original work published 1980)
Goodchild, L., Lovell, C., Hines, E., & Gill, J. (1997). Public policy and higher
education: ASHE Reader. Upper Saddle River, NJ: Pearson Custom Publishing.
Gregson, J. (1997). A critical response to Grubb. Journal of Vocational Education
Research, 22(2), 123-132.
Griffin, K. (2002, April). The fall 2000 Florida curriculum study: An overview of the
Florida community college credit curriculum. Paper presented at the 45th
Annual
Conference of the Council for the Study of Community Colleges, Seattle, WA.
Grubb, W. (1996). The new vocationalism: What it is, what it could be. Phi Delta
Kappan, 77, 535-6.
Grubb, W. (1997a). Not there yet: Prospects and problems for “education through
occupations.” Journal of Vocational Education Research, 22 (2), 77-94.
Grubb, W. (1997b). Finding common ground: A brief response. Journal of Vocational
Education Research, 22 (2), 133-139.

154
Grubb, W. (2001). From isolation to integration: Postsecondary vocational education
and emerging systems of workforce development. New Directions for
Community Colleges, 115, 27-37.
Hale, M. (1966). A history of Florida junior colleges. Unpublished doctoral dissertation.
Peabody College for Teachers, Vanderbilt University.
Lane, K. (2004, February 16). An honorable mention or political posturing. Community
College Week, 6-9.
Levin, J. (2000). The revised institution: The community college mission at the end of
the twentieth century. Community College Review, 28(2), 1-25.
Lynch, R. (2000). High school career and technical education for the first decade o fthe
21st century. Journal of Vocational Education Research, 25(2), 155-198.
Meyer, J (1977). The effects of education as an institution. The American Journal of
Sociology, 83(1), 55-77.
Miles, M. & Huberman, A. M. (1994). Qualitative data analysis: An expanded
sourcebook (2nd ed.). Thousand Oaks, CA: SAGE Publications, Inc.
National Commission on Excellence in Education. (1983). A nation at risk: The
imperative for educational reform. Washington, D.C.: U.S. Government Printing
Office.
Office of Program Policy Analysis and Government Accountability. (2001). Program
review: Workforce development education program. (Report No 01-56).
Tallahassee, FL: Author.
Orr, M. (2001). Community colleges and their communities: Collaboration for
workforce development. New Directions for Community Colleges, 115, 39-49.

155
Owens, T. (1997). On the way: A journey toward work-relevant education. Journal of
Vocational Education Research, 22(2), 95-106.
Palmer, J. (1987). The characteristics and educational objectives of students serviced by
community college vocational curricula. Unpublished doctoral dissertation. Los
Angeles, CA: University of California.
Palmer, J. (1999). A statistical portrait of the non-liberal arts curriculum. New
Directions for Community Colleges, 108, 31-38.
Patton, M. Q. (2001). Qualitative Research and Evaluation Methods, 3rd edition.
Thousand Oaks, CA: Sage Publications.
Patton, M. (2003). Cultivating resources: leadership summit on technological education.
(A Report from the Leadership Summit on Technological Education Sponsored
by the American Association of Community Colleges). Washington, D.C.:
Community College Press.
Phelps, L. (1997). “Education through occupations”: Challenge of developing consensus
through experience. Journal of Vocational Education Research, 22(2), 107-113.
Ratcliff, J. (1992). “First” public junior colleges in an age of reform. ASHE reader on
community colleges. Columbus, OH: Ginn Press
Richardson, R.C., Bracco, K.R., Callan, P.M., & Finney, J.E. (1999). Designing state
higher education systems for a new century. Phoenix, AZ: The Oryx Press.
Roemer, R. (1981). Vocationalism in higher education: Explanation from social theory.
The Review of Higher Education, 23(2), 23-46.
Rourke, L. & Anderson, T. Validity in quantitative content analysis. Educational
Technology Research and Development, 52(1), 5-18.

156
Rudolph, F. (1962). The American college and university. Athens, GA: The University
of Georgia Press.
Schuyler, G. (2000). A historical and contemporary view of the community college
curriculum. New Directions for Community Colleges, 108, 3-15.
Seewer, J. (2004, February 3). Bush says training needed to offset job losses. Community
College Times, 11.
Shapiro, G. & Markoff, J. (1997). A matter of definition. In C.W. Roberts (Ed.), Text
analysis for the social sciences. Mahwah, NJ: Lawrence Erlbaum Associates,
Publishers.
Smith-Hughes Act. (1917). Reproduced in History Resource Center, Farmington Hills,
MI: Gale Group. Http://galenet.galegroup.com/serviet/HistRC/
Smith-Lever Act. (1914). Reproduced in History Resource Center. Farmington Hills,
MI: Gale Group. Http://galenet.galegroup.com/serviet/HistRC/
Stakenas, R., Mock, D., and Eaddy, K. (1984). Educating hand and mind: A history of
vocational education in Florida. Lanham, NY: University Press of America.
Tampa Bay Workforce Alliance. (2004, April). Workforce estimating conference:
Florida employment projections (Microsoft® PowerPoint® Presentation). Tampa,
FL: Author.
Task Force on Interinstitutional Course/Credit Transfer. (2004). Statewide articulation
manual: AS to BA/BS and ATD to AS articulation. Tallahassee, FL: Author
Townsend, B. (2001). Blurring the lines: Transforming terminal education to transfer
education. New Directions for Community Colleges, 115, 63-71.

157
Travis, J. & D. Travis. (1999). Survey of presidents reveals new trends in community
college focus. Community College Journal, 69(4), 20-25.
The 2004 Florida Statutes. (2004a). 1004.02 Definitions. Retrieved October 3, 2004, from
http://www.flsenate.gov/Statutes/index.cfm?App_mode=Display_Statute&Search
_String=&URL=Ch1004/SEC02.HTM&Title=->2004->Ch1004-
>Section%2002#1004.02
The 2004 Florida Statutes (2004b). 1000.02 Policy and guiding principles for the Florida
K-20 education system. Retrieved October 8, 2004, from http://www.flsenate.gov/
Statutes/index.cfm?App_mode=Display_Statute&Search_String=&URL=Ch1000
/SEC02.HTM&Title=->2004->Ch1000->Section%2002#1000.02
The 2006 Florida Statutes (2006). 1004.56 Community colleges; definition, mission, and
responsibilities. Retrieved December 22, 2006, from http://www.flsenate.gov/
Statutes/index.cfm?App_mode=Display_Statute&String
Wattenbarger, J. (1950). The organization, administration, and financing of public junior
colleges in the State of Florida. Unpublished doctoral dissertation, University of
Florida, Gainesville.
Wattenbarger, J. (1953). A state plan for public junior colleges. St. Augustine, FL: The
Record Press, Incorporated.
Weber, R. (1985). Basic content analysis. Thousand Oaks, CA: SAGE Publications, Inc.
The White House. (2004). Fact Sheet: Jobs for the 21st Century. Retrieved January 22,
2004, from http://www.whitehouse.gov/news/releases/2004/01/print/
20040121.html

158
Windham, P. (2003) Who will train the labor force of 2006. (Fast Facts No. ff07).
Retrieved August 30, 2003, from http://www.flboe.org/cc/OSAS/FastFacts/
ff07.asp
Witt, A., Wattenbarger, J. Gollattscheck, J., & Suppiger, J. (1995). America’s community
colleges: The first century. Washington, D.C.: The Community College Press.
Zemsky, R., D. Shapiro, M. Iannozzi, P. Cappelli, & T. Bailey. (1998). The transition
from initial education to working life in the United States of America. NCPI
Project Paper #1. Stanford, CA: Stanford University.

159
Appendices

160
Appendix A: Strategic plan display: Transfer strong
College
Comments and key phrases
A Comment: Increase in AA degree enrollment but decline in completers – in part because AA students are transferring before completing degree. Comment: Opportunities to offer an advanced degree in the biological sciences and opportunities related to Social Sciences Department. Renovations include Fine Arts Center and Fine Arts Classroom and Lab. Key phrases:
1. university transfer, college preparatory 2. associate in arts degree
Comments: 1. Benchmarks (p. 27) references modifications to AA degree to
incorporate oral communication and show courses incorporating multi-cultural and diversity issues; revised general education requirements (of A.S. and A.A.S. degrees). A.A. degree to be reviewed in 2003-2004.
2. Assessments (p. 29) include state accountability outcome measures (transfer rates, GPA performance at senior levels, preparatory performance, CLAST).
3. Reference to decline in performance of college preparatory students (current ones are academically weaker than those in previous years – p. 30)
4. Results from graduating student interview are AA only. 5. Use of financial aid packages to recruit financial aid students for AA
program. 6. Use of assessment results indicates that Levels of English Proficiency
exam implemented, minimum cut-off scores raised, prep reading II added, prep task force established, current college practices reviewed. Action plan to measure completion rates of students who completed prep in communication and algebra. Action plan to evaluate retention rates of students in college-level courses and to implement intervention strategies for those scoring below a certain level on exit exams.
7. References math faculty development. 8. References chair position for Arts and Sciences

161
Appendix A, continued
College
Comments and key phrases
C Key phrases: 1. Engage faculty in identifying learning outcomes for the General
Education Core; college-level competencies for the general education core.
2. Beginning revision of syllabi to reflect learning outcomes . . . beginning with general education core courses
3. Increase instructional support for college-prep/remedial students. 4. Begin offering English and math courses on a trial basis in prisons
D Key phrases
1. Offers Associate in Arts (AA) 2. Leading to an Associate in Arts degree 3. Centralize Developmental Studies 4. Enhance the transfer programs through additional articulation 5. Weaknesses - lack of ESL 6. Legislative - transfer GPA, science education facility needs, high-
quality university transfer
F Key phrases 1. Associate in Arts 2. Have 75% . . . have transferred 3. Have 75% . . . who transfer 4. Have 50% . . . in college preparatory 5. Have 60% . . . pass the CLAST. 6. First two years of study for the bachelor’s degree 7. Transfer 8. Developmental education services
I Key phrases: College preparatory program Comments: Retention report relates to students with college prep needs, Fall to Spring term for first time in college students with at least one college prep need, and longitudinal tracking of students completing required college prep courses.
J Key phrases: College preparatory Comments: The Learning Support Services Committee makes recommendations regarding college preparatory and study skills curriculum and monitors student performance in college preparatory classes.

162
Appendix A, continued
College
Comments and key phrases
L Key phrases: 1. The first two years of successful postsecondary instruction that lead to
the baccalaureate degree 2. College preparatory instruction
Comments: 10 unit plans related to transfer (out of 179).
N Key phrases: 1. General and pre-professional education through the associate in arts
degree 2. Access to baccalaureate degree programs through upper-division
transfer 3. Preparatory instruction 4. Transfer 5. Identify competencies in the general education core 6. Adjust the assortment of EAP credit courses, EAP remedial courses 7. Implement Summer “Bridge” programs to move prep students through
the pipeline and into programs 8. Increase students’ awareness of existing baccalaureate transfer
opportunities, yielding year to year increases . . . and a 2% improvement in AA graduate SUS transfer rates.
O Key phrases:
1. Associate in Arts degree programs 2. Preparatory education
Q Key phrase: transferable.
Comment: Unit plans include 677 objectives, 74 of which are directly related to transfer/AA category.
R Key phrases: 1. First two years of university studies. 2. General education 3. General education faculty see the historical mission of liberal arts and
college transfer as increasing in significance

163
Appendix A, continued
College
Comments and key phrases
U Key phrases: 1. Associate of arts 2. Preparatory instruction 3. General education requirements 4. Core general education courses 5. Writing Center 6. Arts Complex 7. Expanding ESOL/bilingual instruction
Comments:
1. Appendix A includes comments on articulation; for example, why some courses are not credited for articulation at four year institutions.
2. Appendix C is the SWOT analysis and includes the honors program and the Science Building as opportunities. Threats include the majority of incoming students coming from high risk categories, including limited English proficiency.
V Key phrases:
1. Education in the visual arts; increase science and related academic opportunities
2. Maintain/improve College Prep students’ performance; continue the development of an honors college
3. Honors/service learning courses
W Key phrases: 1. Associate in arts 2. Comprehensive honors program, Honors Program Advisory Committee,
honors track, honors students, honors faculty development, enhance honors students’ activities
X Key phrases:
1. University parallel program 2. General education 3. Developmental education 4. The state legislature increasingly is moving community colleges in the
direction of workforce development and adult vocational education. [The College] must pursue this opportunity, but not at the expense of its transfer program..
5. Transfer performance data 6. College transfer

164
Appendix A, continued
College
Comments and key phrases
Z Key phrases: 1. Curriculum development in college preparatory courses in
communications and mathematics 2. Continue to increase the percentage of college prep and foundation
course sections taught by full-time career faculty, implement the new English for Academic Purposes (formerly ESL) curriculum, improve student mastery and success in preparatory courses, Level of remediation required for FTIC’s, College preparatory completion rates
3. Learning outcomes and assessment processes at the course level (Preparatory as example), CLAST Requirements, success in college prep, CLAST performance, transfer performance
4. Implement the Global Languages and Cultures Institute
AA Key phrases: 1. Examine the full breadth of university transfer programs (Goal 1
strategy) 2. Incorporates ESL programming (Goal 2 strategy) 3. College preparatory curricula (Goal 3) 4. General education offerings to identify course competencies (Goal 7
rationale)
BB Key phrases: 1. Academically underprepared for college in reading, writing, math or
English language skills 2. Academically talented students are welcomed to the Honors College 3. Unique academic transfer agreements 4. Associate in Arts 5. Degrees in liberal arts and sciences 6. Associate in Arts graduates transfer immediately . . . 7. Continuing need for remedial and English as a Second Language 8. Completion of English as a second language coursework, college
preparatory

165
Appendix B: Strategic plan display: Transfer medium
College
Comments and key phrases
E Key phrase: Develop a cohort system for college prep students H Key phrases: Positive annual trend of College Level Academic Success Skills
Test, students transferring to the University System will perform academically at a higher level than native SUS students
Appendix C: Strategic plan display: Workforce development strong
College
Comments and key phrases
A Comment: References PSAV and advanced vocational program enrollment increase but decline in AS enrollment and completers. Opportunities to offer advanced degrees in diving business technology, marine propulsion, and seamanship. Opportunities related to nursing students and the Marine Public Safety Annex and Hyperbaric Facility. Renovations include Welding Building. Key phrases:
1. Workforce development 2. Associate in Science degree, an Associate in Applied Science degree,
Certificates and Advanced Technical diplomas. Comment: Benchmarks references new Certificate in Business Data Processing and A.S. in Business Management; revised A.S., A.A.S. and Certificate programs in Marine Engineering, Management and Seamanship; new A.S. in Computer Information Technology; Revised A.S. in Computer Programming and Analysis, revised A.S. in Marine Engineering, evaluated A.A.S. and Certificates. Action Plan to review AS. and A.A.S. degrees and certificates. Comment: Assessments include statewide accountability outcome measures, including nursing and state licensure passing rates. Comment: Marketing campaign to businesses to ask what the college can do for their business. Also, intent to provide Radiology and vocational degrees. Comment: Assessment results tracks numbers of PSAV/ workforce courses offered and enrollments. Development program references nursing director and acquisition of materials to assist legal assisting program.

166
Appendix C, continued
College
Comments and key phrases
C Key phrases: 1. Retain and develop training programs, refine the integrated nursing
curriculum, revised nursing curriculum, schedule an increased number of CNA offerings, paraprofessional cohort, Workforce Development faculty, grant funding for Workforce Development programs, Workforce Development Advisory Boards, law enforcement instructors, industry needs and training requests, refine [10 AS degree/certificate programs], potential training programs [4 AS], Department of Corrections new alternative delivery system, enhance the success of Public Service programs
2. Actively promote the Teacher Education Program, student teaching experiences
3. Placement office for both completers and students seeking part-time employment
4. Training partnerships, One-Stop Center and Regional Workforce Development Board
5. Continuing Education’s training opportunities, continue training and professional development for business and industry, maintain the Regional Professional Development Center for adult and vocational educators, seek new training opportunities for new and emerging businesses and industries

167
Appendix C, continued
College
Comments and key phrases
D Key phrases: 1. Associate in Applied Science (AAS), Associate in Science degree
(AS), Applied Technology Diplomas (ATD), College Credit Certificate (CCC), and Postsecondary Adult Vocational Certificate (PSAV) programs, as well as non-credit vocational supplemental
2. Associate in Science degree, Associate in Applied Science degree, College Credit Certificate, Applied Technology Diploma, and Postsecondary Adult Vocational Certificate in vocational and technical fields for career in business, industry, and service occupations.
3. Provide continuing education and corporate training programs 4. Improve vocational program articulation and increase the number of
transfers into A.A.S. and A.S. programs. 5. The needs of the District’s law enforcement agencies, correctional
officers, firefighters, and other emergency responders 6. Continue efforts with health care providers to support and expand the
existing health-related programs, explore the addition of other allied health programs
7. Programs to serve emerging occupations, critical public need areas, and high wage/high demand occupations.
8. AS transfer programs through additional articulation 9. Workforce development 10. Corporate/Employee training, Health Sciences/Hospital Partnerships 11. Business community needs – skill upgrades, employability skills, work
ethics, career training seminars 12. More high-tech and manufacturing jobs that pay higher wages, high
priorities to crime fighting, healthcare 13. Legislative issues - licensing exams and placement, nursing shortage,
public safety personnel, early childhood education workers, emerging needs for workforce training, high-demand high-wage programs: Nursing and Electrical Distribution Technology, Nursing program expansion, fast-track Paramedic to R.N. Bridge program, Lineman training program, Early Childhood Education, demand for trained teachers, workforce development
E Key phrases:
1. Direct entry into high-demand occupations 2. Occupational programs, certificate programs, new short-term certificate
programs, occupational programs to meet regional and national employment needs in high demand fields.

168
Appendix C, continued
College
Comments and key phrases
F Key phrases: 1. Workforce training and upgrading 2. Career 3. Employment 4. Workforce 5. Associate in Science, and Associate in Applied Science, college and
occupational credit certificates, Continuing Workforce Education, Apprenticeship training, a wide variety of customized training programs
6. Have 75% . . . employed 7. State licensure exams 8. Occupational program completers
Comment: Economic and Workforce development – seven specific objectives related to workforce development, plus description of trends. Key phrases:
9. Level one program reviews of all A.S. Degree, A.A.S. Degree, College Credit Certificate, and Occupational Certificate
10. Associate degree programs – employment 11. Occupational and college credit certificate programs 12. Workforce development programs 13. Employer training needs, customized business and industry training, job
retraining, and job skills upgrading courses 14. Cooperative education, career development, clinical, internships, and
apprenticeships
H Key phrases: 1. Career 2. Accountability report in licensure and vocational placement rates 3. Workforce education, align existing and proposed career programs,
increase enrollment in present Workforce development programs I Key phrases:
1. Occupational degree/certificate programs 2. Teacher Education Center 3. Student services web page – career counseling, job placement 4. Program review of Corporate Training and Continuing Education

169
Appendix C, continued
College
Comments and key phrases
J Key phrases: 1. Vocational 2. Certificate and degree programs that prepare students for employment
and careers 3. Workforce development 4. Career and technical areas, increasing business and entrepreneurial
opportunities, partner with business and industry to fund salaries for instructors in emerging disciplines and new programs (e.g. allied health)
5. Monitor local employment trends for training needs, seek local input regarding training needs, monitor high wage/high demand job trends, monitor new program options at the state level for emerging workforce needs
6. Monitor demographic, workforce 7. Development of workforce and economic development issues 8. Dental Assisting Program, the Surgical Technology Program, the
Registered Nursing Program 9. Business and Industry workshops, classes and professional development
activities should meet or exceed that of the previous year.
L Key phrases: 1. Career and technical education programs 2. Continuing education that enhance and update the knowledge and skills
of individuals 3. Educational training, enhanced by the development of partnerships 4. Need for additional career/technical programs as warranted by
community needs and economic development Comment: 20 unit plans related to workforce development (out of 179)
N Key phrases: 1. Workforce development programs 2. Educational partnerships with business, industry 3. Identify hot jobs, regional concerns
O Key phrases:
1. Career 2. Career training 3. Associate in Science and Associate in Applied Science degree programs
and certificate programs 4. Training and activities 5. Enhance Continuing Workforce Education (CWE) programs

170
Appendix C, continued
College
Comments and key phrases
Q Key phrases 1. Career opportunities 2. Economic and workforce development
Comment: Unit plans include 677 objectives; 149 are workforce.
R Key phrases 1. New and expanding business and commercial interests, a burgeoning
market for jobs 2. More training 3. Local leaders value workplace skills 4. Workforce development programs, build collaborative relationships
with business and industry and developing programs and services to meet their needs
5. Employers identify continuing needs for training in workplace ethics, written and oral communication skills, critical thinking and teamwork
6. Career progression 7. Skilled workforce, workforce development 8. Career and technical programs 9. Continuing education programs . . . for recertification 10. Workforce development 11. Business partner for regional employers by educating and training the
skilled employees needed

171
Appendix C, continued
College
Comments and key phrases
U Key phrases: 1. Associate of science degree programs 2. Associate of applied science, vocational-technical certificate 3. Responding to critical shortages in essential fields such as nursing and
teaching 4. Articulation of the A.S. degree 5. Transitional educational programs for those seeking career alternatives 6. Curriculum in Hospitality and Culinary Arts 7. Photography/Graphic Design programs 8. Training needs of the High Tech Corridor 9. Opportunities provided by the Advanced Technology Center 10. Technological resources that will provide students with a competitive
edge in the marketplace 11. Internship program for computer students 12. Career awareness targeting students from under-represented groups 13. Serving training needs and supporting economic development, magnet
programs . . .attract new companies, programs targeted at employers seeking affordable high quality training, opportunities such as internships, classes . . . on their site if that is required by a particular target employer, specialized and emerging training needs of business and industry
Comments: 1. Appendix A includes multiple statements related to workforce; e.g.,
strengthen opportunities for training business/employers 2. Appendix B lists major influences including three related to workforce;
e.g., While a four year college degree will continue to be highly valued by parents and high school seniors, for most adults, obtaining knowledge and skills – especially those recognized by the marketplace – will be valued more than acquiring a “degree credential” and Workforce is a hot topic and driving the development of performance measures for community colleges.
3. Appendix C is the SWOT analysis and includes the Allied Health Building, the Hospitality/Tourism Building, and the television station as opportunities. Threats include the lack of high tech jobs and relatively low wage levels; competing economic growth in neighboring counties; students becoming more technologically proficient than faculty and staff, indicating a need for internal workforce training; and include competition from proprietary colleges that are able to exploit the demand for AS and certificate programs . . . by not requiring traditional courses in liberal arts

172
Appendix C, continued
College
Comments and key phrases
V Key phrases: 1. A.S., Certificate programs and noncredit programs, selected allied
health programs, new A.S. and certificate programs 2. Career counseling and employment services, certificate and special
services programs, changing marketplace needs 3. Critical healthcare programs 4. Workforce development activities and programs 5. Education and training, technical education, expansion of corporate
training, One Stop operations, critical healthcare programs 6. Extend the objectives of Project Eagle [access to workforce training]
W Key phrases:
1. Associate in science and associate in applied science degree professional certificates, workforce development . . .
2. Career educational pathways to meet the educational and training needs 3. Placed in a new job, continued in employment 4. Gainful employment or other career choices, uniform College-wide
internship and cooperative education program, internship and cooperative education programs, occupational exploration series, Career Consultants Network
5. Career pathway, workforce education and training needs
X Key phrases: 1. Technical programs 2. The state legislature increasingly is moving community colleges in the
direction of workforce development and adult vocational education. 3. Trend in the community college mission includes an increased focus on
workforce development 4. Programs responding to workforce needs, partnering with business and
industry to develop job-skill improvement programs 5. Career workforce

173
Appendix C, continued
College
Comments and key phrases
Z Key phrases: 1. Workplace program created to provide faculty with the opportunity to
work for a semester in a business . . . related to their discipline 2. Partnerships for community and workforce development 3. Workplace skills 4. Associate degree, certificate, and continuing professional education
programs that prepare learners for entering and progressing in the workforce
5. Learning workforce in a knowledge economy, economic and workforce development mission, emerging workforce needs, collegiate and continuing education programs in workforce skills, design, delivery, and evaluation of all corporate, continuing, and technical education programs, major provider of high skill/high wage education and training, achieve specific workforce education and training outcomes, integrate workforce development into the culture and curriculum of the college.
Comment: Action Agenda – 8 action items related to workforce development programs/training Key phrases:
6. Success rates for licensure, wages and placement of leavers, including measures of the business model and satisfaction of corporate clients
AA Key phrases:
1. Vehicle of choice for training Comment – three strategies to carry out this goal. Key phrases:
2. Educator Preparation Institute 3. Collegewide review of all AS and technical programs 4. Increase visibility of advisory committees to include business CEO’s 5. Create externship and internship opportunities 6. Corporate training, workforce development

174
Appendix C, continued
College
Comments and key phrases
BB Key phrases: 1. Career 2. Training programs 3. Associate in Science, technical, scientific and research areas including
aviation, allied health and nursing, entertainment, information technology, engineering, education
4. Vocational Credit Certificates 5. 24.4 million credit and non-credit hours of learning embodied in the
workforce 6. Associate degrees in nursing 7. Occupational and professional graduates are working in their field 8. New business ventures in information technology, entertainment,
biomedical, tourism and more are opening new workforce opportunities 9. Opportunities for students to gain practical experience, enhance co-op
and intern opportunities, explore an “interns for resources” partnership, developing new intern opportunities
10. Labor, high-skill/high-wage occupational training, development of program and faculty for identified fastest-growing industries and occupations, increased level of cooperative work experiences, field placements, and internships
Appendix D: Strategic plan display: Workforce development medium
College
Comments and key phrases
T
Workforce Development – Provide student-centered workforce programs

About the Author
Karen L. Griffin received a Bachelor of Arts degree in anthropology in
1982 and a Master of Arts degree in anthropology in 1985 from the University of
Florida. With more than 18 years in the Florida community college system, her
early professional background includes serving as a program coordinator for the
Florida Comprehensive Council on Environmental Education and for the Used Oil
Recycling Grant. From the Manager of Special Studies at Hillsborough
Community College, she was promoted to SACS Accreditation Liaison Manager
and subsequently to Director of Associate in Arts Program. In her current
capacity as the Director, she helps develop and implement college-wide policy
related to the Associate in Arts program, the college preparatory curriculum, the
dual enrollment program, the libraries, and faculty development.