transfer pricing aggressiveness and nancial derivatives ...wps.fep.up.pt/wps/wp583.pdftransfer...
TRANSCRIPT

n. 583 November 2016
ISSN: 0870-8541
Transfer pricing aggressiveness and �nancial derivatives
practices: Empirical evidences from United Kingdom
Ricardo Santos1
1 FEP-UP, School of Economics and Management, University of Porto

i
TRANSFER PRICING AGGRESSIVENESS AND FINANCIAL
DERIVATIVES PRACTICES: EMPIRICAL EVIDENCES FROM
UNITED KINGDOM
by
RICARDO JORGE SEBASTIÃO DOS SANTOS
MASTER IN FINANCE AND TAXATION
FACULDADE DE ECONOMIA – UNIVERSIDADE DO PORTO
SUPERVISED BY:
P.H.D., SAMUEL CRUZ ALVES PEREIRA.
P.H.D., ELÍSIO FERNANDO MOREIRA BRANDÃO.
SEPTEMBER 2016

ii
ABSTRACT
Multinational corporations (MNCs) have long taking consideration into transfer pricing as a
critical aspect of their tax management policies. The present study aims to identify the influence
of intra-group financing using derivatives instruments on transfer pricing aggressiveness. Based
on a selective sample of 117 publicly listed U.K. multinational enterprises over 2006 and 2014
(1053 firms years observations), the regression model indicates derivatives to be significantly
associated with transfer pricing aggressiveness behaviors. More specifically, interest rates and
foreign exchange rates volatility have a positive contribution on magnifying international transfer
pricing aggressiveness. Additionally, the multinationality of MNCs also exhibits a significant
impact on entities tax governance. The overall empirical findings present reasonable results
augmented by an additional analysis with recourse to effective tax measures.
Keywords: Transfer Pricing, Derivative Instruments, Multinationality, Aggressiveness and
Tax Avoidance

1
ABBREVIATIONS
BEPS – Based Erosion Profit Shifting
EC – European Commission
ERM – Enterprise Risk Management Practices
FASB – Financial Accounting Standard Board
GAO – Government Accountability Office
HMRC – HM Revenue & Customs
HSGA – Homeland Security and Governmental Affairs
ICTA – Income and Corporation Tax Act
JCT – Joint Committee on Taxation
MNCs’ – Multinational Companies
OECD – Organization for Economic Co-Operation
TIOPA – Taxation (International and other provisions) Act

2
1 INTRODUCTION
Nowadays the use of financial derivative instruments is the foremost reason for corporate
tax noncompliance practiced by MNCs to avoid or evade tax obligations. (United States
Government Accountability Office [GAO], 2011), (Organization for Economic Co-
Operation [OECD], 2010), and (HM Revenue & Customs [HMRC], 2016). Tax experts
have identified the ease which derivatives can be restructured to allow taxpayers to take
advantages of country tax rules on financial derivatives (GAO, 2011).
Under this context, governmental departments such as, the HRMC and the Senate
Committee on Homeland Security and Governmental Affairs (HSGA) claim the transfer
pricing legislation addressing derivatives instruments to be on the top of the priorities on
the international tax enforcement challenge for governmental tax offices. Moreover, a
recent survey demonstrates that tax authorities are continuing to increase their transfer
pricing resources, which in turn are leading to a general increase in the number of inquiries
and audits. No individual tax authority surveyed has reduced its resources over the last two
years (Ernst & Young, 2014). This increased scrutiny from tax departments have resulted in
many court cases on aggressive transfer pricing arrangements carried out by well-known
MNCs (i.e., Shell, Starbucks, Apple Inc.) showing the provision of substantial tax benefits
and advantages that these MNCs take over the law, tax rates differences between
jurisdictions, and the non-arm’s length principle of services, goods and funds transferred
amongst the intra-group companies (Levin, 2012).
Another important factor contributing for such scenarios relates the financial crisis and
credit restriction from external lenders which increased the flow and dimension of
intragroup financing throughout the application of derivatives, loans, guarantees and hybrid
instruments arrangements (Van der Breggen, 2007). Hanlon and Heitzman (2010), call up
attention for offshore financial centers, strategically set up for ease the flow of capital
amongst different tax jurisdictions and finance business activities that are intensely driven
by the cost of capital. Moreover, Dyreng and Lindsey (2009) and Gravelle (2013), stated
about the incorporation of MNCs treasuries in favorable tax jurisdictions which likely

3
increases the flow of capital amongst MNCs associates and still manages to comply with
narrowed regulation and enforcements procedures about information disclosure on capital
management requirements. An economic analysis presented by the GAO detected that 34%
and 24% of overseas and U.S.A. controlled companies, respectively, have reported no tax
liabilities over the period of 1998-2005, where the major explanation for such evidence
relates for the abuse of transfer pricing rules. (GAO, 2011).
In order to attempt these inconsistences, as well as, to further assist MNCs and tax
authorities with the compliance of the arm’s length principle1, the OECD has developed a
number of extensive guidelines that are at the core of the modern transfer pricing regulation
in the most of the developed nations. The latest OECD initiative, the so called Based
Erosion Profit Shifting (BEPS), published in October 2015, attempts to ensure that transfer
pricing rules are not misused and the results are accordingly aligned with value creation.
For example, George Osborne upon the delivery of his budget for 2016 announced the first
introduction of BEPS measures to be implemented in the U.K. from 2017, where the
estimation is to raise about £1.3 billion a year by limiting tax deductions for interest and
finance costs.
Despite some academic studies (Richardson and Taylor, 2015; Donohoe, 2015;
Hanlon and Heitzam, 2010; and Taylor et al., 2015) and governmental reports (GAO, 2011;
HMRC, 2013, HASGA, 2012) make clear that derivatives practices have an impact on tax
avoidance, none of these, from the best of my knowledge, have looked closely how the
association between financial derivatives and transfer pricing aggressiveness is determined.
Under this context, this study aims to evaluate how derivative instruments, frequently used
for hedging practices, determine the level of transfer pricing aggressiveness for publicly
1 The OECD Transfer Pricing Guidelines makes reference in section B.1 to the arm’s length principle as: [Where] conditions are made or imposed between the two [associated] enterprises in their commercial or
financial relations which h differ from those which would be made between independent enterprises, then
any profits which would, but for those conditions, have accrued to one of the enterprises, but, by reason of
those conditions, have not so accrued, may be included in the profits of that enterprise and taxed
accordingly.

4
listed multinational companies in the United Kingdom, bearing in mind these companies
can get into favorable market conditions agreements which allows a reduction on their
corporate tax liabilities.
This study main contribution concerns the development of a transfer pricing aggressiveness
dependent variable which comprises, simultaneously, the HRMC transfer pricing risk
assessment regulation and thin capitalization rules. According to Hanlon and
Heitzman (2010), past transfer pricing indexes tend to consider inappropriate measurement
rules, which may distort the overall research. By having this into consideration, the present
study adds to modern literature an alternative, appropriate and effective measure of transfer
pricing by providing both conceptual and methodological improvement and developing a
case for the measurement of thin capitalization rules and transfer pricing aggressiveness for
British incorporated multinational enterprises. Since the United Kingdom does not practice
“safe harbors” 2
measures, the development of this proxy becomes more relevant, once it
assures reliability and comparability on determining the allowed interest deduction
according to the arm’s length principle stated by the OECD.
Secondly, this research contributes to the extent of important literature on transfer pricing
aggressiveness and tax avoidance (Taylor et al., 2015; Richardson and Taylor, 2015; and
Taylor and Richardson, 2011; Hanlon and Heitzman, 2010; and Donohoe, 2015). Further to
prior studies that identified intangibles and tax havens to have a significant impact on
transfer pricing aggressiveness and tax avoidance, this study, sizes and complements such
research articles by identifying how derivatives instruments (includes exposures to interest
rate and foreign exchange rate) promote tax aggressive behaviors from the transfer pricing
perspective.
2 The HRMC dismisses the idea of having ‘safe harbors’ ratios as this measure offers a simplistic method of
determining tax consequences by reference to publicly-stated formulae, rather than by a precise application of
the OECD principles.

5
Thirdly, and from the conceptual and methodological perspective this research paper
includes important recommendations, practices and methodologies suggested by the most
recent literature issued by OECD/G20 on Limiting Base Erosion Involving Interest
Deductions and Other Financial Payments, 2015, (BEPS: action 4), which from the best of
my knowledge have been scarcely applied and considered in most recent transfer pricing
scientific papers.
Fourthly, this study decentralizes the majority of the scientific researches being developed
under the transfer pricing umbrella of the United States of America and Australia, and
comprises a sample of multinational companies publicly listed in the London Stock
Exchange, which allows investors, researches and student community in general to have a
broader perspective and an additional comparable factor on how European multinational
entities, more specifically in the U.K., (i) comply with the OECD transfer pricing
legislation, and (ii) structure their capital intensity.
The structure of this research study is organized in the following manner, section 2
examines the background literature on transfer pricing aggressiveness, financial derivative
instruments and risk management strategies combining both concepts (transfer pricing and
derivatives), section 3 develops the hypotheses, section 4 explores the research design and
presents the base regression model, section 5 reports the empirical results, as well as,
identifies robustness checks on the model and develops additional analysis on the
dependent variable, section 6 concludes.

6
2 BACKGROUND LITERATURE
The Transfer Pricing regulation in the United Kingdom has well established procedures and
was intentionally developed to be consistent with the OECD Guidelines practices. Over the
past year, the UK Transfer Pricing rules/guidance have remained unchanged, although the
recent reports published by the OECD regarding the BEPS actions plans have caught the
UK Government attention for a reflexive position on tackling aggressive tax planning
strategies in the global economy.
2.1 Transfer Pricing Aggressiveness Background
The most of the OECD countries have harmonized Transfer Pricing regulation which is
designed to assure that prices in operations taken by related parties have the appropriate
allocation of profits across jurisdictions (Joint Committee on Taxation [JCT], 2010).
However, the UK considers the current transfer pricing legislation to simplify the allocation
of certain level of profits to low-tax jurisdictions in an inappropriate manner.
Under the international context the perception of transfer pricing aggressiveness refers to
the downward management of tax paid by transferring profits or losses amongst group
associates incorporated in different tax jurisdictions through deliberate manipulation of
intercompany transfer prices. Bartelsman and Beetsma (2003), present different ways of
profits shifting, such as the financing of new subsidiaries in high tax jurisdictions with debt
instead equity. Furthermore, transfer pricing aggressiveness can be characterized by the
raise of tax benefits for MNCs, as a whole, resulting from mispricing of services, products,
interest, loan, and royalties among related parties. It thus considers transfer pricing
behaviors falling into the gray area of tax compliance, as well as, activities that are clearly
illegal (Hanlon and Heitzman, 2010).

7
Eden and Smith (2011), considers the transfer pricing aggressiveness to be a tax or
financial advantage successfully taken by MNCs resulting from financial, economic or
legislative arbitrage differences between jurisdictions. On the top of these jurisdictions are
tax havens, which according to Drucker (2011)3 represented to be a common denominator
presented on the largest tax audits undertaken or completed in the U.S.A., concerning
transfer pricing aggressive operations.
Usmen (2012) and the OECD (2013) public consultation draft on Transfer Pricing
Risk Assessment argues that the use of tax havens jurisdictions by MNCs does not have in
mind only its transfer pricing aggressive strategies, additionally it aims to engage in
financial arbitrage procedures in order to manage their foreign currency cash flows as well
as regulatory risk exposure.
Levin (2012) compares the profits to be artificially inflated in low tax jurisdictions and
deflated in high tax jurisdictions as a result of aggressive transfer pricing techniques carried
out by related parties with no consideration of the arm’s length principle. The author further
states that transfer pricing aggressiveness infers from the lack of assurance, with particular
relevance for the arm’s length nature on intercompany prices of goods or services, transfer
funds (i.e., dividends, royalties, interest), and the all methodology on the application of the
appropriate transfer pricing method.
2.2 Financial Derivatives Instruments Background
A financial instrument or derivative is the result of any contractual terms agreed by at least
two parties giving rise to financial asset of one entity and financial liability or equity
instruments of another entity. In other words, a derivative instrument can be defined as a
3 Please see the “double Irish Dutch Sandwish” for evidence on these transfer pricing activities resulting from
arrangements of U.S.A. groups (Facebook and Google) where the tax haven incorporated subsidiary plays an
important role on the group structure (Drucker, 2011; Smyth, 2013).

8
contract which its value derives from its relation with something else, commonly referred
as the “underlying” (Stulz, 2004).
The underlying term under a derivative contract can be almost anything, however very
often this is identified as other financial instrument or economic good.4
Bodnar et al., (2003) and Bartram et al., (2009), considers the uses of derivatives by MNCs
to be often motivated by the insulation effect that it provides to earnings and cash flow risk
exposure resulting from changes in interest rates, foreign exchange rates and commodity
prices. Such example is given on Maynard (2008), which refers to Southwest Airlines as a
well-known enterprise for using derivatives instruments to lock in jet fuel prices. Despite
this common use of derivatives, MNCs very frequently adopt derivatives strategies for
many other reasons, such as tax avoidance (Donohoe, 2015), earnings management
(Barton, 2001), financial distress mitigation (Mayers and Smith, 1982), amongst others.
Another important element to take into account under the financial derivate instruments
practices relates to its accounting standards and MNCs reporting measurements. According
to the Financial Accounting Standard Board (FASB, 2016), a worldwide institution
responsible for the monitoring and standardize of financial accounting policies, derivatives
instruments held for trading purposes shall be measured at their fair value in the balance
sheet, while the unrealized holding gain/loss should be recognized in the statement of
comprehensive income. On other hand, derivatives held for hedging purposes, should be
measured at the fair value in the financial statement, while the unrealized holding gain/loss
available for hedging strategies (including those classified as current assets) should not be
considered in the earnings, instead it should be reported in other comprehensive income
until realized.
4 In the majority of the times derivatives tend to follow three kinds of instruments: (i) options, (ii) futures and
forwards, and (iii) swaps. Options involve the right, but not the obligation, to buy or sell an underlying at a set
price within a specified period. A futures or forward contract involves an obligation to exchange an
underlying at a future date for a specific price, and swaps are agreements to exchange a stream of payments
based on an underlying over a predefined period.

9
2.3 Risk Management Background
After the financial downturn in 2007/2008 the global economy, in overall, has focused its
attention on how MNCs can more effectively increase their management policies for risk
exposures reduction. On the top priorities of governments and tax authorities is transfer
pricing risk, which according to Borkowski and Gaffney (2014) have increased as more tax
authorities worldwide implement or strengthen transfer pricing regulations and impose
harsher penalties for infractions.
In this context, managers and CEOs’ of multinational enterprises have put into practice
innovative forms of risk management tools, such as enterprise risk management practices
(ERM), which allows MNCs to identify specific risks exposures on their industry and
economic environment, as well as, implement on time strategies to manage and reduce any
form of external or uncontrollable management risk.
On other hand, many of theories being published nowadays regarding risk management
strategies suggest that hedging activities are becoming the most common practice of
manage short term risk. In addition, some of those theories, for instance, Froot et al. (1993),
highlight the cost of external financial borrow as the main aspect to put into practice a
decent plan for hedging any volatility in foreign exchange volatility. Moreover, the authors
further states that, if the cost of financing abroad is likely to be higher than internal
financing, the recourse to hedging activities can represent an extreme value added benefit
for MNCs, especially if it matches fund inflows with outflows, which consequently allows
for lowering the chances that an MNC needs to access capital markets.
Additionally, Smith and Stulz (1985), claim attention for the probability of potential tax
motivations to hedge the volatility of cash flows and income. Furtherly, the author’s present
evidence on the reduction of taxes for MNCs with a U-shaped tax function as a result of an
effective monitoring and reduction in taxable income volatility. In addition, Stulz (1996)
and Leland (1998) call up researcher’s attention for the reduction in cash-flow volatility
through hedging to potentially increase debt capacity and produce greater tax advantages
for MNCs.

10
3 HYPOTHESES DEVELOPMENT
This section considers the development of hypotheses regarding the impact of derivatives
instruments and multinationality on MNCs transfer pricing aggressiveness. According to
important literature, as previously presented, these variables argued to be relevant on the
transfer pricing aggressiveness behaviors.
3.1 Financial Derivatives
The question to be imposed from this study perspective is “Why derivatives are so valuable
for corporate tax aggressiveness?
In the spotlight for derivatives practices nowadays is MNCs tax avoidance (JCT, 2011), in
other words, the reduction of their tax liability. According to Lisowsky et al., (2013), and
from a wide perspective, tax avoidance represents the continuum use of planned tax
strategies to extremely and aggressively avoid tax responsibilities. Some of the literature
addressing this subject, in one hand, documents tax aggressiveness to be the result of
hedging strategies (byproduct perspective), while the other hand, reports the ambiguity in
derivative taxation to be at the forefront for tax aggressiveness behaviors (tax law literature
perspective). The figure below addresses both perspectives (byproduct vs tax law
literature) by describing the useful of derivatives for corporate tax aggressiveness.
Table 1 - The valuable usage of derivatives for MNCs tax aggressiveness
The complexity of derivatives instruments and transactions
Byproduct Tax Law
Hedge Fundamentals
Hedging risk reduces taxable income volatility, which
allows MNCs to lower its expected tax expense
(Simth and Stulz 1985).
Ambiguity in Derivatives Taxation
The ambiguity on derivatives taxation procedures
allows MNCs to harmonize the timing and source
of taxable income/deduction via transactional form
and tax reporting choices. Some of these behaviors
are legally valid, while others push the envelope of
tax law.
Adapted from Donohoe (2014)

11
Hedge Fundamentals
According to Modigliani and Miller (1958), risk management strategies developed by
MNCs do not increase their value in perfect capital markets. On the other hand of the
spectrum, Aretz and Bartram (2010), explained why imperfections presented in the market,
such as taxes, drive MNCs to a devoted allocation of resources, in order to reduce their
financial risk. The main characteristic of a derivative instrument relates to his aptitude to
reduce risk exposure. Thus, bearing in mind that the most tax legislations across OECD
countries are relatively harmonized, successful hedge positions able MNCs to reduce the
volatility risk of their taxable income (Keyes, 2008). Additionally, Froot et al., (1993)
identified the cost of external financing to be more costly when compared to intra-group
financing, which predicts that hedging practices represent a fair solution and a value-
increasing activity if it matches the inflow and outflow of funds, and consequently lowers
the probability of MNCs needs to access capital markets. At the same hand,
Smith and Stulz (1985) stated that cash flows and earnings stability via an accurate
monitoring for volatility constitutes an extra motivation for hedging activities.
Ambiguity in Derivatives Taxation
The transactional form reflects tax aggressiveness to be closely attributable to ambiguity in
derivative transactions, mainly concerning (i) fragmented reporting treatments rules, (ii)
provision of minimal guidance for determine accurate tax treatments on complex
instruments, Weisbach (2005) and, (iii) the complexity of derivatives represents another
advantage for MNCs, once, finance and economist professionals, in somehow, may
struggle to accurately interpret derivatives, then considering the ambiguous derivative
taxation treatments, it is not surprising the tax authorities to struggle as well (Raghavan
2007, 2008).
In conclusion, if derivatives instruments represent an important factor of risk management
strategies as stated in the literature above, any prospective changes in multinational
enterprises derivatives portfolio position may be economically significant when compared

12
to potential hedging objectives such as, MNCs underlying risk exposure. Under this
context, the present study estimates the exposure of MNCs market values to interest rates
and currency exchange rates and the extent to which MNCs derivatives instruments
potentially aim to hedge these exposures. By this means, the exposure is measured by
estimating the effects of interest rate and exchange rates using exposure coefficients from
MNCs monthly stock returns regression on changes in interest rates and exchange rates. To
assess market exposure, the study assumes derivatives contracts to be held by the holding
company (MNC) which subsequently serves its controlled companies according to the
intragroup financing policies. Thus MNCs with significant exposure to interest rates and
exchange rates have higher market value sensibility which subsequently increases their
likelihood for aggressive transfer pricing behaviors.
H1: All else remaining constant, derivatives instruments practices are significantly
associated with transfer pricing aggressiveness.
3.2 Multinationality
Nowadays the success of MNCs international globalization and market diversification axes
on the parent company abilities to manage and monitor the wider spectrum of economic,
cultural and political risks across countries. As a result of these events, it is not surprising
for MNCs to developed complex organizational structures that very frequently lack for
transparency.
Jacob’s (1996), one of the first transfer pricing studies, examined that MNCs sited in
different tax jurisdictions have greater tax opportunities and resources not only to shift
income (i.e., royalty income, interest and dividend) to favorable tax jurisdictions, but as
well to assign important allowable tax expenses (for instance, debt interest paid) to high tax
jurisdictions.

13
At the same hand, various research papers (Clausing, 2009; and Klassen and Laplante,
2012a) reported the existence of income shifting, as well as, predicted the high possibility
of income shifting between related party companies located in different tax jurisdictions, to
be preferably developed via (i) strategic debt location, (ii) transfer pricing transactions and
(iii) preferential cost allocation.
Rego (2003) and Dyreng et al. (2008) concluded that MNCs tend to be more capable and
have higher chances to reduce their corporate tax liability when compared against those
corporations operating purely in the internal market. The author’s further identified that
MNCs relying intensively in foreign transactions or deriving higher income from external
sources have greater reasons and scope to engage in income shifting behaviors.
Desai et al., (2006a) further concluded that higher international MNCs exposure, extensive
intercompany operations and greater R&D expenditure, preferred the use of tax haven
vehicles to avoid their liabilities. The authors additionally found that MNCs effective tax
rates (ETRs) usually reflect a combination of transactions in either higher or lower tax
regimes which reflects this way their aggressiveness in exploring tax havens jurisdictions to
support their income shifting schemes.
H2: All else remaining constant, the multinationality of MNCs is significantly
associated with transfer pricing aggressiveness.

14
4 RESEARCH DESIGN
4.1 Data selection and sample design
The present study considers the largest 200 stock enterprises (highest stock capitalization)
publicly listed at the London Stock Exchange for the period of 2006-2014. I have focused
on the largest stocks enterprises because previous studies (Nance et al., 1993; Graham and
Rogers, 2002; and Hentschel and Kothari, 2001) have provided strong evidence that large
enterprises are more likely to incur in derivative instruments contracts, as well as, the
largest 200 enterprises economically represent a significant fraction of the portfolio value
of the U.K. market stock capitalization. In this context, the sample size was reduced to 117
enterprises, after exclude, (i) enterprises falling into finance and insurance sector (section
K – three digit UK SIC codes 641-663), (ii) enterprises operating in the electricity, gas,
steam and air conditioning supply (section D – three digit UK SIC codes 351-353), (iii)
firms with activities in water supply, sewerage, waste management and remediation
activities (section E – three digit UK SIC codes 360-390), (iv) enterprises with no overseas
subsidiaries, (v) corporations exempt from transfer pricing rules, this is classified as
small/medium sized enterprises5, and (vi) multinational enterprises with no derivatives
instruments in their annual reports from 2006 to 2014. Regarding the enterprises falling
into a specific industry category (K, D and E), their exclusion concerns not only the
significant differences in accounting policies and derivation in accounting estimates,
additionally, it considers particularities in legislation and regulatory constraints on
reporting which certain industries, e.g., utilities, are subject for. The full sample consists in
1053 firm-year observations over the period of 9 years. Financial information was obtained
from recognized database sources such as, Amadeus from Bureau Van Dijk and Eikon
Datastream from Thomson Reuters.
5 The HRMC, based on the European Commission (2003/361/EC), defines micro, small and medium sized
enterprises as “an entity that qualifies as either small or medium if it meets the staff headcount ceiling (less
than 250 employees) for that class and one (or both) of the financial limits (annual turnover less than €50
million and/or balance sheet less than €43 million). Where the entity is a member of a group, or has an
associated entity, these limits apply to the whole group and not the specific entity”.

15
The following table presents the criteria’s adopted on the exclusion of some enterprises
sectors in the study sample.
Table 2 - Sample descriptive criteria’s
Description Selection/Exclusion criteria
London Stock Exchange 200th
largest Stock Capitalized Enterprises;
Time Period 2006-2014;
Type of accounts Consolidated accounts only;
Sector Industry
Sectors excluded:
financial and insurance (section K – three
digit UK SIC codes 641-663);
electricity, gas, steam and air conditioning
supply (section D – three digit UK SIC codes
351-353);
water supply, sewerage, waste management
and remediation activities (section E – three
digit UK SIC codes 360-390).
Other reason for exclusion
enterprises with no overseas subsidiaries;
corporations exempt from transfer pricing
rules, this is classified as small/medium sized
enterprises; and,
multinational enterprises with no derivatives
instruments in their annual reports from 2006
to 2014.
Final Set (firms) 117 multinational enterprises
Final Set observations (firms-year) 1053 firm-years observations
4.2 Dependent variable
The BEPS (2015) initiatives and the OECD thin capitalization legislation (2012) defines
the profit shifting through interest as one of the preferred practices used by MNCs to
structure their financing arrangements and maximize their tax benefits (increased deduction
in interest paid and reduction in taxable profit, consequently). The U.K. thin-capitalization
and intra-group funding legislation6 defines the procedures which enterprises shall follow
6 The thin-capitalization and intra-group funding legislation is considered in the Act 2010 (TIOPA10),
previously in Schedule 28AA ICTA 1988, commits HMRC to interpreting transfer-pricing transactions in
accordance with the principles set down by the OECD. This commitment centers on Article 9 of the OECD
Model Tax Convention and the OECD Transfer Pricing Guidelines. The legislation, applies the arm’s length

16
when assessing the maximum interest-bearing debt that can give rise for interest deductions
for each tax year. Specifically, the section INTM 515010 of HRMC internal manual,
defines that covenants7 applied at intervals allows for identification of whether or not the
enterprises maintain the ability to service and repay the borrowing debt. The breach of this
terms and conditions by the borrower usually triggers attention from the lender and signals
for an aggressive tax behavior, and perhaps avoidance.
Since the U.K does not operate “safe harbors”8, the British tax legislation applies the
OECD guidance by taking debt and earnings ratios as the appropriate measure of the arm’s
length principle to calculate the allowed interest deduction. Based on the conceptual thin
capitalization approach9 presented in Richardson and Taylor (2015), the present study
contributes for the extent transfer pricing literature by developing a new proxy measure
based on the disallowed interest expense defined by the British tax authorities’, i.e., the
HRMC thin capitalization manual for U.K. entities10
. Since the U.K. legislation does not
applied static thin capitalization measures, in other words, “safe harbors”, the development
of this new transfer pricing proxy presents relevance and a unique contribution for the
transfer pricing literature, since it addresses complexity and accuracy on defining a more
reliable arm’s length principle.
To determine whether a MNC uses excessive interest deduction, the dependent variable
was measured through the ratios EBITDA/interest paid and debt/EBITDA, and thereafter
matched against a benchmarking inter-quartile range (IQR), specifically designed for each
principle to lending and borrowing transactions - treating parties to a transaction as if they were independent
of each other.
7 A loan covenant commonly includes a maximum ratio of debt to earnings and a minimum ratio of earnings
to interest costs. The latter ratio is known as ‘interest cover’. Interest cover covenants are common in third
party loan agreements and are a mainstay of thin capitalization agreements. Thus a borrower’s interest cover
is a measure of its ability to service its debt - to pay the interest and other regular costs of borrowing - rather
than of its ability to repay the principal.
8 According to HMRC “a safe harbor in this context is a legislative limit on interest deduction by reference to
fixed ratios, such as a debt:equity ratio of 3:1 applicable to all company funding.”
9 The thin capitalization proxy developed in Richardson and Taylor (2015) considers the U.S tax legislation,
as well as, all the terms and conditions framed in the US thin capitalization legislation, largely different from
the U.K. framework.
10 According to the HMRC the “interest cover covenants have been adopted for use in Advance Thin Cap
Agreements to measure arm’s length interest for each year of the agreement. In the event of a breach of
covenant, enough interest is disallowed to restore the ratio”.

17
UK Standard Industry Classification (SIC) code section. The transfer pricing
aggressiveness variable (TPAGG) is measured as a dummy variable, code as 1 if a MNC
EBITDA/interest paid is below its UK SIC benchmarking IQR or debt/EBITDA is above
its UK SIC benchmarking IQR, and 0 otherwise.
4.3 Independent variables
The independent variables are comprised by financial derivatives instruments (FDI) and
multinationality (MULTI). In order to gain additional clearance and perspective on firms
risk management practices and transfer pricing aggressiveness, the present study extends
and sizes the present transfer pricing literature by including the FDI variables as a measure
for risk management incentive (hedging risk) that influences the use of financial derivatives
instruments and consequently the transfer pricing aggressiveness. Thus, financial derivative
instruments (FDI) is defined by two sub-variables, the interest rate (IR) which stands for
entities with interest rates derivatives, and the foreign exchange rate (FER) which
represents multinational enterprises with exchange rate derivatives. Both measures (IR and
FER) represent the market value exposure to financial prices and aim to estimate accurately
the transfer pricing aptitudes for aggressive behaviors.
Having this into context, the IR variable is calculated as the estimated coefficient from a
regression of a MNC monthly holding period stock returns on the monthly percentage
change in the 6 months London Interbank Offered Rate (LIBOR), (Guay, 1999;
Zhang, 2009).
The FER is measured as the foreign currency exchange rate, defined as the estimated
coefficient from a regression monthly holding period stock returns on the monthly
percentage change in the sterling ERI trade weighted index (Guay, 1999; Zhang, 2009).
On other hand, the MULTI variable takes into consideration relevant literature findings
from Harris et al., (1993), Rego (2003), Mills and Newberry (2004), which states that
MNCs with a substantial number of foreign business subsidiaries are likely to behave more
aggressively than MNCs operating domestically. By having this results into context the

18
MULTI is calculated as a dummy variable, coded as 1 for firms reporting current or
deferred foreign income taxes, and 0 otherwise.
4.4 Control variables
The control variables included in the present study are represented by profitability
(PROFIT), MNCs size (SIZE), leverage (LEV), cash flow from operating activities
(CFOA), year effects (YEAR) and industry (INDS).
According to Jacob (1996), profitable (PROFIT) MNCs have greater reasons to engage in
aggressive transfer pricing behaviors to finally avoid significant corporate taxes. Nowadays
many MNCs, for instance, Microsoft, Google and Apple, have been able to practice
aggressive tax strategies by favorably locating their profits in low tax jurisdictions and
increase their taxable deductible expenditure in high tax jurisdictions in order to
significantly reduce their taxable profits (Duhigg et al., 2012; Womack et al., 2011; Mutti
et al., 2009). The PROFIT control variable is measured via pretax income divided by total
assets as defined in Gupta and Newberry (1997).
The size variable (SIZE) takes into consideration both resources and incentives that MNCs
have in hand to efficiently apply planned and aggressive transfer pricing behaviors across
the group subsidiaries. MNCs with multiple foreign entities have greater opportunities to
exploit tax legislations in different countries which able them to plan tax strategies and shift
income from high to low tax jurisdictions by locating their operations in these favorable
locations (Slemrod, 2001; Rego, 2003). SIZE is measured by the natural logarithm of total
assets as presented in Stickney and McGee (1982).
The leverage variable (LEV), according to Hines (1996), Newberry and Dhaliwal (2001),
and Rego (2003), has a great potential to identify high leveraged MNCs exploiting tax
deductions opportunities resulting from interest payments and loan fees and shifting debt
amongst low tax jurisdictions. Additionally, many other studies on tax avoidance presented
evidence on how MNCs with high debt to equity ratios tend to behave in a more aggressive
manner than highly capitalized MNCs, Bernard et al., 2006, Dyreng et al., 2008, and Blouin

19
et al., 2013. The LEV control variable is measured according to Gupta and Newberry
(1997), by dividing long term debt from the total assets.
The CFOA variable will be considered in the regression model to control and monitor for
the flow of funds occurring from operations and MNCs performances (Dechow et al.,
1998). Further, Hanlon (2005) states that some of the tax favorable jurisdictions, e.g., tax
shelters, frequently provide information on the persistence of underlying cash flow streams
and earning persistence of MNCs. At the same hand, Kim et al., 2011, presents evidence
that CFOA has a significant association with tax avoidance. Under this context, the CFOA
variable is measured by the cash flow from operating activities scaled by total assets.
On other hand, the industry (INDS) which MNCs operate is very likely to positively affect
their transfer pricing aggressiveness behaviors, with certain sectors of activity offering
greater propensity to this final end (Oyelere, 1998; Bernard et al., 2006). Thus, the INDS11
control variable is defined as a dummy, coded as 1, as it controls for the UK Standard
Industry Classification (UK SIC) sections, such as: (i) mining and quarrying (section B),
(ii) manufacturing (section C), (iii) construction (section F), (iv) wholesale and retail trade
(section G), (v) information and communication (section G), and (vi) professional scientific
and technical services (section M).
The YEAR variable controls for time fixed effects of any change, development or initiative
in transfer pricing or linked legislation between the periods of 2006-2014. As a natural
reaction, each of the years comprehended between 2006 and 2014 have had their own
specificities, which directly or indirectly may influence MNCs to put into practice
aggressive tax planning strategies and incentives. Thus, YEAR is classified as a dummy
variable, coded as 1, if any specific year ranged between 2006 and 2014 have seen the
introduction, development or change in transfer pricing or linked legislation, otherwise is 0.
11 Consistent with the HRMC (2014) “tax planning structures and arrangements which result in BEPS are
generic and can be utilized by multinational groups in all sectors”. Thus, the UK Standard Industry
Classification code (UK SIC) identified under the INDS variable considers the six most aggressive transfer
pricing sectors as defined in the TPAGG variable (excludes transportation and storage).

20
4.5 Base Regression Model
In order to verify the influence of financial derivatives practices (IR and FER) and
multinationality (MULTI) on transfer pricing aggressiveness (TPAGG) behaviors, the
present study considers a logistic regression model since the dependent variable is
classified as a dichotomous variable, and the independent and control variables assume,
simultaneously, quantitative and qualitative values in the model. According to Marôco
(2014), this method provides the most effective way to identify and estimate the
significance of the independent variables in the model, when compared to other statistical
methods such as, for example, the discriminant analysis. The logistic regression model
presents a broader field for application since (i) it accepts qualitative and quantitative
predictors, (ii) does not assume the dependent variable and independent variables to be
linear correlated, (iii) does not require the independent variables to be normal distributed,
and (iv) is less sensitive to outliers.
In this context, the logistic regression model is stated as follows:
TPAGG*it = αit + β1 IRit + β2 FERit + β3 MULTIit + β4 PROFITit + β5 SIZEit + β6 LEVit +
β7 CFOAit + β8 INDSit + β9 YEARit + εit (4.1)
where, TPAGG*it, represents the latent variable associated to the observable variable, being
TPAGG equal to 1 (one) when TPAGG* > 0, otherwise, TPAGG equals 0 (zero) when
TPAGG* ≤ 0, additionally i = stands for each MNCs ranged from 1 to 117, and
t = represents the financial period considered in present study ranging from 2006 to 2014,
inclusive, ε stands for the error term.
In order to clarify the base regression model (4.1), the following table provides a summary
description on the measurement of the dependent, independent and controls variables in the
study.

21
Table 3 - Variables Description
Dependent Variable Description
Transfer Pricing Aggressiveness (TPAGG)
Dummy variable, code as 1 if:
EBITDA/interest paid < UK SIC benchmarking
IQR; or
Debt/EBITDA > UK SIC benchmarking IQR,
0 otherwise.
Independent Variables
Financial Derivatives Instruments
Interest Rate Exposure (IR)
IR: the estimated coefficient from a regression of a
MNCs monthly holding period stock returns on the
monthly percentage change in the 6M Libor.
Foreign Exchange Rate (FER)
FER: the estimated coefficient from a regression of
monthly holding period stock returns on the
monthly percentage change in ERI trade weighted
index.
Multinationality (MULTI)
MULTI: dummy variable, coded as 1 for firms
reporting current or deferred foreign income taxes,
and 0 otherwise.
Control Variables
Profitability (PROFIT) PROFIT: Pretax income divided by total assets.
Size (SIZE) SIZE: natural logarithm of total assets.
Leverage (LEV) LEV: long term debt divided the total assets.
Cash Flow from Activities (CFOA) CFOA: cash flow from operating activities divided
by total assets.
Industry (INDUS)
INDS: dummy variable, coded as 1, if the UK SIC
sections equals: (i) mining and quarrying (section
B), (ii) manufacturing (section C), (iii) construction
(section F), (iv) wholesale and retail trade (section
G), (v) information and communication (section G),
and (vi) professional scientific and technical
services (section M).
Year (YEAR)
YEAR: a dummy variable, coded as 1, if any specific
year ranged between 2006 and 2014 have seen the
introduction, development or change in transfer
pricing or linked legislation, otherwise is 0.

22
5 EMPIRICAL RESULTS
5.1 Descriptive Statistics
Table 4, present’s important descriptive statistics for the different variables considered in
the present study, i.e., the dependent variable (TPAGG), independent variables (IR, FER,
and MULTI) and the control variables (PROFIT, SIZE, LEV, CFOA, INDS, and YEAR).
As the results show in table 4, the TPAGG mean (0,701) indicates that approximately 70%
of MNCs are above the allowed interest deduction legibility for income tax purposes in the
UK. On other hand, regarding the financial derivatives instruments, the IR mean (0,533)
indicates that MNCs have, approximately, 53% of their market value of equity exposed to
interest rate changes in financial markets. At the same time, despite the FER variable
(0,014) present less sensitivity of MNCs (1,4%) market value exposure to exchange rates,
is still reasonable to argue that there is a positive sign and motivation to risk-averse CEO’s
and tax managers to reduce/mitigate the stock price exposure to volatile exchange rates and
subsequently ease the volatility in MNCs stock base portfolio wealth.
In addition, another important result links the incorporation of subsidiaries in abroad
jurisdictions as shown by the MULTI variable mean (0,872). Representing about 87% of the
MNCs in the sample, the MULTI indicates that at least 1 subsidiary runs a business in a
non-domestic jurisdictions, which definitely increases the probability of tax aggressive
behaviors of MNCs.
Finally, the statistics presented for skewness and kurtosis allow to conclude a data set
reasonably normally distributed. More specifically, from the skewness results we can verify
that all variables, except the MULTI variable, present modest symmetry distribution to
mean, as coefficients registered results close to 0, this is, between ] -0,5 and +0,5 [, as
defined by Runyon et al. (1996, cited in Marôco, 2014, pp.22). Regarding the kurtosis, the
overall distribution results coefficients remain within the range of ] -0,5 and +0,5 [,
exception made to TPAGG, FER and MULTI that show slightly higher values, indicating a
sharper peak. Despite these higher kurtosis coefficients registered, Westfall (2014) argues

23
that higher kurtosis means more of the variance is the result of infrequent extreme
deviations, as opposed to frequent modestly sized deviations.
Table 4 - Descriptive statistics - Variables Summary
Variable Summary
Variables Mean STD.DEV Skewness Kurtosis
TPAGG 0,701 0,458 -0,879 -1,230
IR 0,533 1,790 0,396 0,634
FER 0,014 6,337 -0,038 1,438
MULTI 0,872 0,334 -2,227 2,967
LEV 0,210 0,137 0,348 -0,414
PROFIT 0,080 0,061 0,424 -0,114
CFOA 0,098 0,060 0,318 -0,080
SIZE 15,218 1,292 0,308 -0,171
Valid N (listwise) 1053
Table 5, reports industry summary descriptive statistics according to UK SIC codes.
Considering the sample distribution (1053 firm-years), we verify that manufacturing
industry counts with the greater fraction of MNCs included in the present study (25,641%),
wholesale and retail trade counts with (14,530%), construction and information &
communication (11,966%) and (10,256%), respectively. Professional, scientific and
technical activities (9,402%) and mining and quarrying (7,692%) close the top six UK SIC
codes industries with the highest contribution for the present sample data set.
Moreover, table 5 reports descriptive statistics on MNCs with transfer pricing
aggressiveness behaviors only, per UK SIC codes. Consistent with the observations in the
sample distribution, the TPAGG per industry classification presents the manufacturing
(22,493%), wholesale and retail trade (12,195%) and construction (11,653%) as the
industries in the UK with the highest number of MNCs frequently concurring with
disallowed interest expenses for tax purposes, according to HMRC thin capitalization rules.
In addition, information & communication (10,705%), professional, scientific and technical
activities (10,569%), and mining and quarrying (7,182%) follow the tendency, although

24
with less frequency. Standard deviation for the majority of the variables shows a central
tendency with the median results.
Table 5 - Descriptive statistics - Industry Summary
Industry summary statistics
UK Standard Industry
Classification (SIC)
Codes
Sample distribution TPAGG per industry classification
No. of
MNCs -Years
Relative Frequency
(%)
No. of
MNCs -Years
Relative Frequency
(%)
Section B - Mining and
Quarrying 81 7,692% 53 7,182%
Section C - Manufacturing 270 25,641% 166 22,493%
Section F - Construction 126 11,966% 86 11,653%
Section G - Wholesale and
retail trade 153 14,530% 90 12,195%
Section H - Transportation
and storage 63 5,983% 61 8,266%
Section I -
Accommodation and food
service activities
36 3,419% 27 3,659%
Section J - Information
and communication 108 10,256% 79 10,705%
Section L - Real estate
activities 9 0,855% 5 0,678%
Section M - Professional,
scientific and technical
activities
99 9,402% 78 10,569%
Section N -
Administrative and
support service activities
54 5,128% 43 5,827%
Section O - Public
administration and
defence; compulsory
social security
27 2,564% 24 3,252%
Section R - Arts,
entertainment and
recreation
18 1,709% 18 2,439%
Section S - Other service
activities 9 0,855% 8 1,084%
Total 1053 100% 738 100%
25
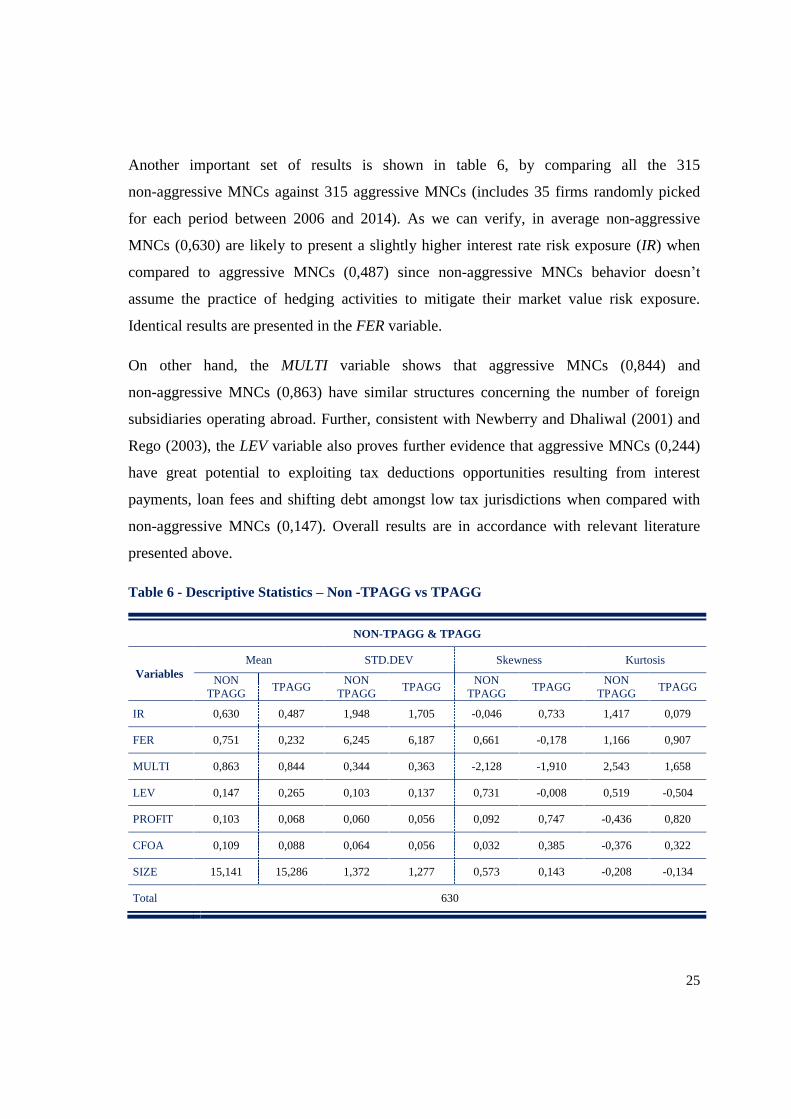
Another important set of results is shown in table 6, by comparing all the 315
non-aggressive MNCs against 315 aggressive MNCs (includes 35 firms randomly picked
for each period between 2006 and 2014). As we can verify, in average non-aggressive
MNCs (0,630) are likely to present a slightly higher interest rate risk exposure (IR) when
compared to aggressive MNCs (0,487) since non-aggressive MNCs behavior doesn’t
assume the practice of hedging activities to mitigate their market value risk exposure.
Identical results are presented in the FER variable.
On other hand, the MULTI variable shows that aggressive MNCs (0,844) and
non-aggressive MNCs (0,863) have similar structures concerning the number of foreign
subsidiaries operating abroad. Further, consistent with Newberry and Dhaliwal (2001) and
Rego (2003), the LEV variable also proves further evidence that aggressive MNCs (0,244)
have great potential to exploiting tax deductions opportunities resulting from interest
payments, loan fees and shifting debt amongst low tax jurisdictions when compared with
non-aggressive MNCs (0,147). Overall results are in accordance with relevant literature
presented above.
Table 6 - Descriptive Statistics – Non -TPAGG vs TPAGG
NON-TPAGG & TPAGG
Variables
Mean STD.DEV Skewness Kurtosis
NON
TPAGG TPAGG
NON
TPAGG TPAGG
NON
TPAGG TPAGG
NON
TPAGG TPAGG
IR 0,630 0,487 1,948 1,705 -0,046 0,733 1,417 0,079
FER 0,751 0,232 6,245 6,187 0,661 -0,178 1,166 0,907
MULTI 0,863 0,844 0,344 0,363 -2,128 -1,910 2,543 1,658
LEV 0,147 0,265 0,103 0,137 0,731 -0,008 0,519 -0,504
PROFIT 0,103 0,068 0,060 0,056 0,092 0,747 -0,436 0,820
CFOA 0,109 0,088 0,064 0,056 0,032 0,385 -0,376 0,322
SIZE 15,141 15,286 1,372 1,277 0,573 0,143 -0,208 -0,134
Total 630

26
5.2 Correlation results
Table 7 summarizes the Spearman matrix results for the correlation coefficients. We find
the presence of significant correlations between TPAGG and LEV, PROFIT, CFOA, at the
1% level, and SIZE at the 5% level of significance. Additionally, the study finds TPAGG to
have a negative association with IR (-0,045) and FER (-0,039), in other words, as the
aggressiveness in TPAGG behaviors increases, the sensibility of MNCs market value of
equity to interest rates and foreign exchange rates volatility tends to decrease. These types
of multinationals frequently recur to hedging contracts in order to reduce the risk exposure
of their subsidiaries, increasing this way their appetite for aggressive behaviors amongst the
group transactions. Other important conclusion to be made from the Spearman matrix
relates the significant association between TPAGG and LEV (0,312; P > 0,01), presenting
further evidence on how MNCs with high debt to equity ratios tend to behave more
aggressively compared to high capitalized MNCs.
Further, significant association between TPAGG, PROFIT and CFOA at (-0,253; P > 0,01)
and (-0,126; P > 0,01), respectively, comply with the great potential that MNCs have to
explore tax opportunities in high tax jurisdictions in order to reduce their taxable profits in
the home country. Multicollinearity between exogenous variables is moderate, representing
mid-low levels, in fact the highest correlation coefficients occurred between PROFIT and
CFOA (0,403; P > 0,01), which for the sake of the present study does not affect the
legitimacy of the model results.

27
Table 7 - Spearman/Kendall's Matrix Correlation
TPAGG IR FER MULTI LEV PROFIT CFOA SIZE
TPAGG - 0,16
IR - 0,045 - 0,000
FER - 0,039 0,059 - 0,035
MULTI - - - -
LEV 0,312*** 0,023 0,041 - 0,062** -
PROFIT - 0,253*** - 0,017 0,002 - 0,025 -0,107*** -
CFOA - 0,126*** 0,047 - 0,014 0,001 0,044 0,403*** -
SIZE 0,067** 0,041 - 0,033 0,086*** 0,140*** - 0,077** -0,121*** -
*** indicates significance at 0,01 level and ** indicates significance at 0,05 level.
The p-values are 2-tailed, once it aims to test for the possibility of the relationship in both directions.
5.3 Regression results
The logistic regression results presented in table 8 shows the probability of the exogenous
variables influence transfer pricing aggressiveness behaviors at different significance levels
of association. The IR coefficient (X2Wald = 2,921; p = 0,087) shows significant evidence
(p < 0,10) that exposure to interest rates volatility boosts aggressive transfer pricing
behaviors to be adopted by MNCs, thus supports H1. Consistent with Guay et al., (2003)
and Keyes (2008) equity value exposure to interest rate volatility increases the usage of
hedging instruments by MNCs, which consequently reflects their appetite to incur in
aggressive transfer pricing behaviors across group transactions. Regarding the FER
coefficient (X2Wald = 7,725; p = 0,005), the results keep the IR variable tendency, this is, a
significant coefficient at 1% level (p < 0,01), which fully supports H1. Consistent with
Zhang (2009) and Donohoe (2015) foreign exchange risk exposure incurred by MNCs
subsidiaries enhances the MNCs likelihood for tax aggressiveness, since the high volume of
daily transactions in different currencies may result in a loss, economically significant for
the firm financial results.
On other hand, the MULTI variable coefficient (X2Wald = 1,883; p = 0,170) in the model
presents a result slightly above the level of significance of 10%, which does not supports
H2. Despite this result, is reasonable to say that multinational corporations are still likely to

28
behave aggressively from the transfer pricing perspective. In other words, as supported by
other important research articles (Hanlon et al., 2007 and Rego, 2003), the greater the level
of MNCs multinational operations the greater the likelihood of those MNCs incur in
transfer pricing aggressiveness transactions.
Regarding the control variables in the model, the coefficients results for LEV and PROFIT
are significantly associated to aggressive transfer pricing behaviors at 1 % level. The LEV
(X2Wald = 78,454; p = 0,000), and PROFIT (X
2Wald = 28,056; p = 0,000), are statically
significant at 1% level, which shows a strong linkage to transfer pricing aggressive
behaviors as stated in Richardson and Taylor (2015) and Taylor et al., (2015). On other
hand, regardless the CFOA variable does not present a statically significant result (X2Wald
= 1,679; p = 0,195), seems appropriate to make reference for this variable significance due
to its capacity to monitor the flow of funds to favorable tax jurisdictions (Dechow et al.,
1998; and Hanlon, 2005).
Another important set of results to be considered in this study relates the odds ratio12
(OR)
as given by Exp (B). The OR predicts the chances of non-aggressive (group 1) vs aggressive
(group 2) transfer pricing behaviors occur given its exposure to each independent variable
unit at a 95% confidence interval. As shown in table 8, the IR variable conditions
(Exp (B) = 0,932 < 1) presents a lower probability to occur in non-aggressive MNCs
compared to aggressive MNCs, whom frequently recur to derivative instruments to reduce
their interest rate exposure. In addition, the results for FER and MULTI variables,
(Exp (B) = 0,968 < 1) and (Exp (B) = 0,737 < 1), respectively, present similar results, in
other words, the conditions imposed in these two variables are more likely to occur in
aggressive transfer pricing MNCs when compared to non-transfer pricing aggressive
MNCs. Regarding the control variables (PROFIT, CFOA and SIZE) the results remains
12 According to Szumilas (2010), “an odds ratio (OR) is a measure of association between an exposure and
an outcome. The OR represents the odds that an outcome will occur given a particular exposure, compared to
the odds of the outcome occurring in the absence of that exposure. Odds ratios are most commonly used in
case-control studies, however they can also be used in cross-sectional and cohort study designs as well (with
some modifications and/or assumptions). An odds ratio of 1(one) indicates that the condition or event under
study is likely to occur in both groups, at the same hand, a ratio greater than 1 (one) indicates the likelihood
that the condition or event is more likely to occur in the first group. Finally, an odd ratio lesser than 1 (one)
indicates that the probability is lower in the first group than in the second “.

29
consistent with the independent variables odds ratio predictions, exception made to LEV
variable (Exp (B) = 267,658 > 1), which presents an OR above 1, indicating that leverage
MNCs have higher chances to occur in non-aggressive MNCs. The McFadden pseudo
R2 (0,141) shows a reasonable result, consistent with Richardson and
Taylor (2011 and 2015) and Taylor et al., (2015).
To conclude, the overall regression indicates that MNCs have been employing aggressive
behaviors from the transfer pricing perspective, given the significant coefficients obtained
from the model. More specifically, MNCs with high market value exposure to interest rates
and exchange rates tend to practice derivatives contracts to hedge intragroup volatility
amongst controlled companies’ activities. Multinationality also presents empirical evidence
that higher number of related parties spread across favorable debt locations enhances
transfer pricing aggressiveness.
Table 8 - Logistic regression results - TPAGG
B S.E. X2 Wald Exp(B)
95% C.I.for EXP(B)
Lower Upper
IR -0,070 0,041 2,921* 0,932 0,860 1,010
FER -0,032 0,012 7,725*** 0,968 0,947 0,991
MULTI -0,305 0,222 1,883 0,737 0,477 1,140
LEV 5,590 0,631 78,454*** 266,658 77,697 922,049
PROFIT -6,965 1,315 28,056*** 0,001 0,000 0,012
CFOA -1,744 1,346 1,679 0,175 0,013 2,445
SIZE -0,020 0,059 0,119 0,980 0,873 1,100
YEAR Yes
INDUS Yes
Constant 0,583 0,937 0,386 1,791 - -
Pseudo R2
McFadden 0,140
N 1053
*** indicates significance at the 0,01 level, ** indicates significance at 0,05 level and * indicates
significance at the 0,10 level;
The p-values are 2-tailed, once it aims to test for the possibility of the relationship in both directions.

30
5.4 Robustness checks
In order to assess the regression model reliability and consistency, several robustness
checks were performed to regression results in table 8. Firstly, it was executed a diagnostic
to detect the presence of outliers and influent observations in the model, whereby a diagram
for studentized residuals of the estimated probabilities and the analog of Cook’s influence
statistics were performed. The results obtained, present a reduced number of outliers above
the reference, i.e., |rj| > 2 (appendix 1), with no significant influence values over the
regression coefficient. In addition, the analog of Cook’s influences presents a few
observations above the reference value, i.e., DX2 > 4 (appendix 2) 13
, however none of the
Cook’s distance points are above 1, which denotes the absence of influent observations on
the model coefficients.
Secondly, it was developed an efficiency classification table which defines the sensibility
and the specificity of the model. As shown in appendix 3, the model sensibility (0,897)
classifies accurately in approximately 90% the MNCs with transfer pricing aggressiveness
behaviors. Regarding the model specificity (0,286), it indicates that about 29% of MNCs
securely present no transfer pricing aggressiveness behaviors. Globally, the model includes
robust observations by properly classifying 71,4% firm-year observations, approximately.
Thirdly, it was performed robustness checks in the regression model capacity to
discriminate TP Aggressive MNCs vs TP Non-Aggressive MNCs, using for this purpose the
ROC curve analysis. As registered in appendix 4, the area under the curve (AUC = 0,775)
is considerable above the reference value of 0.5 (p < 0.01), which represents a significant
capacity of the logistic regression model to discriminate firms with aggressive transfer
pricing behaviors from those with no aggressive transfer pricing practices.
13
DX2 represents the Hosmer and Lemeshow (2000) information about the influente observations in the
model in function of the estimated probabilities given by ∆X 2J.

31
5.5 Additional analysis
In order to assess consistency on the dependent variable, the study considered the inclusion
of alternative aggressive tax measures existent in the literature (Dyreng et al., 2008;
Manzon and Plesko, 2002; Shevlin, 2010; and Lisowsky et al., 2013.,) denoted by ETRs,
such as, the cash effective tax rate (CASHETR), the accounting effective tax rate
(ACCETR), as well as, the book tax gap (BTGETR) from Manzon and Plesko, 2002. In fact,
Dharmapala (2008) and Desai and Hines (2002) make reference for the intensity to which
MNCs increase their international tax avoidance through transfer pricing activities.
Moreover, very frequently these intragroup transactions take the form of financing schemes
settled between MNCs treasury centers and its controlled subsidiaries where the main
purpose is to explore, for instance, derivatives taxation inconsistency across jurisdictions
since different tax treatments is a common practice. By having this into context I have
extent the empirical analysis by considering relevant tax avoidance measures in the present
literature denoted as follows:
(2) ACCETR: a dummy variable coded as 1 if the income tax expense registered (current
and deferred taxes) divided by the pretax accounting income indicates a tax value below its
market reference, and 0 otherwise;
(3) CASHETR: a dummy variable coded as 1 if the cash tax paid divided by the pretax
accounting income is below to its reference and 0 otherwise;
(4) BTGETR: a dummy variable coded as 1 if the pretax accounting income less taxable
income, divided by the total assets indicates a tax difference below to its reference, and 0
otherwise.
All three MNCs effective tax rates measures are classified as a dummy variable, which
takes into consideration a benchmarking reference. Thus, MNCs presenting effective tax
rates below the eligible reference are classified as aggressive tax players. The base logistic
regression for the model is designed to include all three ETR’s, separately, and is estimated
as follows:

32
ETR’s it = αit + β1 IRit + β2 FERit + β3 MULTIit + β4 PROFITit + β5 SIZEit + β6 LEVit + β7 CFOAit
+ β8 INDSit + β9 YEARit + εit (5.2; 5.3; or 5.4, respectively)
Table 9 presents the additional regression X2Wald coefficient results. In general I found
consistency and evidence amongst the tax avoidance ETR’s (ACCETR, CASHETR and
BTGETR) and the transfer pricing aggressive measure as presented in model one (1). By
considering the ACCETR, the relevant conclusion to be made against the results obtained
from table 8 concerns the MULTI variable, which shows a positive and significant
coefficient (X2Wald = 3,316; p = 0,069) at 10% level. Additionally, I found the IR
coefficient (X2Wald = 3,038; p = 0,081) and FER coefficient (X
2Wald = 12,147; p = 0,000)
to have a significant association to ACCETR at 10% and 1% levels, respectively, which
denotes reliability and robustness for the result obtained in model (1). Similar conclusions
applied to LEV coefficient (X2Wald = 15,002; p = 0,000) and PROFIT coefficient
(X2Wald = 15,226; p = 0,000).
Regarding the CASHETR, the results presented less significant coefficients for the
generality of the variables, however, the IR, FER and LEV variables, (X2Wald = 3,514;
p = 0,061), (X2Wald = 8,977; p = 0,003) and (X2Wald = 3,954; p = 0,047) respectively,
remain a significant tendency association between tax aggressiveness/avoidance behaviors,
interest rates, foreign exchange rates and high leveraged MNCs..
Finally, the BTETR measure reinforces the significance association registered between tax
avoidance and the IR variable (X2Wald = 2,933; p = 0,087) at 10% level. Additionally it
brings evidence that sizable, i.e., SIZE (X2Wald = 8,212; p = 0,004), MNCs are has
significant influence on tax aggressiveness/avoidance behaviors since their robust structure
is more capable to raise capital at lower costs and distribute across related parties in
favorable circumstances.

33
Table 9 - Logistic regression results – ETR’s
ACCETR (LOGIT) CASHETR (LOGIT) BTETR (LOGIT)
X2 Wald X
2 Wald X
2 Wald
IR 3,038* 3,514* 2,933*
FER 12,147*** 8,977*** 0,469
MULTI 3,316* 0,081 1,697
LEV 15,002*** 3,954** 9,539***
PROFIT 15,266*** 0,527 1,925
CFOA 1,214 0,016 0,135
SIZE 0,773 0,041 8,212***
YEAR Yes Yes Yes
INDUS Yes Yes Yes
Constant 5,085 3,153 12,850
Pseudo R2
McFadden 0,078 0,019 0,061
N 1053
ETR’s variables definition: ACCETR is defined as the income tax expense (current and deferred taxes)
divided by the pretax accounting income. CASHETR is measured by the cash tax paid divided by the pretax
accounting income. BTETR is calculated as a pretax accounting income less taxable income, divided by the
total assets.
*** indicates significance at the 0,01 level, ** indicates significance at 0,05 level and * indicates
significance at the 0,10 level;
The p-values are 2-tailed, once it aims to test for the possibility of the relationship in both directions.

34
6 CONCLUSION
The present study identifies the influence of derivatives instruments on transfer pricing
aggressiveness behaviors of public listed multinational firms in the U.K. In line with
relevant literature, I found empirical evidence on derivative instruments practices to be
significantly associated with transfer pricing aggressiveness, contributing this way for one
of the leading source of corporate tax noncompliance. By this means, having the previous
results into context, is appropriate to certify the TPAGG proxy contribution for future
research projects, since it revealed significance and reliance on the logistic regression of
derivatives instruments on transfer pricing aggressiveness. Moreover, additional
contribution is given by including important practices and methodologies as suggested in
BEPS action plans.
Despite the reliable results achieved in regression model one (4.1), consistent with the
additional analysis models (5.2, 5.3 and 5.4), the study is subject to several limitations such
as, (i) the sample considers only publicly listed MNCs in the UK since data for private
MNCs are not available for consultation, (ii) the transfer pricing aggressiveness variable
takes into account aggregated financial information at the group level, not individually by
treasury center, (iii) an MNCs decision to use derivatives is, in the majority, defined by
unobservable factors, so further approaches should be considered in order to mitigate
potential concerns, e.g., document whether tax savings increases with aggressive transfer
pricing behaviors.
In the future, transfer pricing aggressiveness researches could take into consideration
different aspects, capable to contribute for the extent and sophistication of the theme. For
instance, (i) explore how the different accounting treatment on derivatives across countries
influence the MNCs tax behaviors on financing subsidiaries, (ii) measure the impact of the
recent transfer pricing BEPS initiatives on countries (OECD and non-OECD) tax
compliance and governance, and (iii) extent literature on corporate tax avoidance and
financial instruments, other than derivatives, such as, special purpose vehicles and hybrid
mismatch arrangements on intragroup financing.

35
APPENDICES
Appendix 1 - Diagram for studentized residuals

36
Appendix 2 - Analog of Cook’s influence statistics

37
Appendix 3 - Efficiency classification table

38
Appendix 4 - ROC curve analysis

39
BIBLIOGRAPHY
Aretz, K., Bartram, S., 2010. Corporate hedging and shareholder value. Journal of
Financial Research, Vol.33, Nº4, pp.317-371.
Bartelsman, E. J., and Beetsma, R. M. W. J., 2003. Why pay more? Corporate tax
avoidance through transfer pricing in OECD countries. Journal of Public Economics,
Vol.87, Nº 9-10, pp.2225-2252.
Barton, J., 2001. Does the use of financial derivatives affect earnings management
decisions? The Accounting Review, Vol.76, Nº1, pp.1-26.
Bartram, S., Brown, G.W., Fehle, F., 2009. International evidence on financial derivatives
usage. Financial Management, Vol.38, Nº1, pp.185-206.
Bernard, A.B., Jensen, J.B., Schott, P.K., 2006. Transfer Pricing by U.S.-Based
Multinational Firms. Working Paper, Nº12493, The National Bureau of Economic
Research (NBER).
Blouin, J., Huizinga, H., Laeven, L., and Nicodeme, G., 2013. Thin capitalization rules and
multinational firm capital structure. Working paper, Nº12/27, Oxford University.
Bodnar, G., de Jong, A., Macrae, V., 2003. The impact of institutional differences on
derivatives usage: A comparative study of U.S. and Dutch firms. European Financial
Management, Vol.9, Nº 3, pp.271-297.
Borkowski, Susan C., and Gaffney, Mary Anne, 2014. Proactive Transfer Pricing Risk
Management in PATA Countries. Journal of International Accounting Research, Vol.13,
Nº2, pp. 25-55.
Chen, S., X. Chen, Q. Cheng, and T. Shevlin., 2010. Are family firms more tax aggressive
than non-family firms? Journal of Financial Economics, Vol.95, Nº1, pp.41-61.
Clausing, K. A., 2009. Multinational firm tax avoidance and tax policy. National Tax
Journal, Vol.62, Nº4, pp.703-25.
Dechow, P. M., Kothari, S. P., & Watts, R. L., 1998. The relation between earnings and
cash flows. Journal of Accounting and Economics, Vol.25, Nº 2, pp.133-168.
Desai, M. A., Foley, C. F., and Hines, J. R., 2006a. The demand for tax haven operations.
Journal of Public Economics, Vol.90, Nº 3, pp.513-531.

40
Dharmapala, D., 2008. What problems and opportunities are created by tax havens? Oxford
Review of Economic Policy, Vol.24, Nº4, pp.661-679.
Donohoe, Michael P., 2015. The economic effects of financial derivatives on corporate tax
avoidance. Journal of Accounting and Economics, Vol.59, Nº1, pp. 1-24.
Drucker, J., 2011. IRS Auditing How Google Shifted Profits Offshore to Avoid Taxes.
Available at: www.bloomberg.com [Accessed January 2016]
Duhigg, C., and D. D. Kocieniewski, 2012. How Apple Sidesteps Billions in Taxes. New
York Times, April 28. Available at: www.nytimes.com [Accessed January 2016]
Dyreng, S., and Lindsey, B., 2009. Using financial accounting data to examine the effect of
foreign operations located in tax havens and other countries on US multinational firms' tax
rates. Journal of Accounting Research, Vol. 47, Nº 5, pp. 1283-1316.
Eden, L., and Smith, L. M., 2011. The ethics of transfer pricing. Working paper. College
Station, TX: Texas A&M University.
Ernst & Young, 2014. Global transfer pricing tax authority survey. Available at:
www.ey.com [Accessed February 2016]
Froot, K., Scharfstein, D., Stein, J., 1993. Risk management: Coordinating corporate
investment and financing policies. The Journal of Finance Vol.48, Nº 5, pp.1629-1658.
Graham, John R., and Rogers, Daniel A., 2002. Do firms hedge in response to tax
incentives? The Journal of Finance, Vol.57, Nº2. pp. 815-839.
Gravelle, J. G., 2013. Tax havens: International tax avoidance and evasion. CRS Report for
Congress. Available at: www.fas.org [Accessed January 2016]
Guay, W., 1999. The impact of derivatives on firm risk: An empirical examination of new
derivative users. Journal of Accounting and Economics, Vol.26, Nº 1-3, pp.319-351.
Hanlon, M., 2005. The persistence and pricing of earnings, accruals, and cash flows when
firms have large book tax differences. The Accounting Review, Vol.80, Nº1, pp.137-166.
Hanlon, M., and Heitzman, S., 2010. A review of tax research. Journal of Accounting and
Economics, Vol.50, Nº 2-3, pp.127-178.

41
Harris, D., Morck, R., Slemrod, J., & Yeung, B., 1993. Income shifting in US multinational
firms. Studies in International Taxation, pp. 277-302. Chicago: University of Chicago
Press.
Hentschel, L., Kothari, S.P., 1997. Are corporations reducing or taking risks with
derivatives? Journal of Financial and Quantitative Analysis, Vol.36, Nº1, pp.93-118.
Hines, J. R., 1996. Tax policy and the activities of multinational corporations. Working
Paper, Nº5589, The National Bureau of Economic Research (NBER).
HM Revenue & Customs (HMRC), 2016. Tackling tax evasion: legislation and guidance
for a corporate offence of failure to prevent the criminal facilitation of tax evasion.
London: HRMC Publishing. Available at: www.gov.uk [Accessed May 2016]
Homeland Security and Governmental Affairs (HSGA), 2012a. Subcommittee Hearing to
Examine Billions in U.S. Tax Avoidance by Multinational Corporations. Washington:
HSGA Publishing. Available at: www.hsgac.senate.gov [Accessed February 2016]
Jacob, J., 1996. Taxes and transfer pricing: income shifting and the volume of intrafirm
transfers. Journal of Accounting Research, Vol.34, Nº2, pp.301-313.
Joint Committee on Taxation (JCT), 2010. Present Law and Background Related to
Possible Income Shifting and Transfer Pricing, Washington: House Committee on Ways
and Means.
Keyes, K.M., 2008. Federal Taxation of Financial Instruments and Transactions. Boston:
Warren, Gorham, & Lamont Publishing.
Kim, J. B., Li, Y., & Zhang, L., 2011. Corporate tax avoidance and stock price crash risk:
Firm-level analysis. Journal of Financial Economics, Vol.100, Nº3, pp.639-662.
Klassen, K., & Laplante, S., 2012a. The effect of foreign reinvestment and financial
reporting incentives on cross-jurisdictional income shifting. Contemporary Accounting
Research, Vol.29, Nº3, pp.928-955.
Leland, H.E., 1998. Agency cost, risk management and capital structure. Journal of
Finance, Vol.53, Nº4, pp.1213-1243.
Lennox, C., Lisowsky, P., and Pittman, J., 2013. Tax aggressiveness and accounting fraud.
Journal of Accounting Research, Vol.51, Nº4, pp.739-778.

42
Levin, C., 2012. Statement of Senator Cal Levin (D-Michigan) before U.S. Senate
Permanent Subcommittee on Investigations in Offshore Profit Shifting and the U.S. Tax
Code. Available at: www.hsgac.senate.gov [Accessed February 2016]
Manzon, G., and G. Plesko., 2002. The relation between financial and tax reporting
measures of income. Tax Law Review, Vol.55, Nº2, pp.175-214.
Marôco, João., 2014. Análise Estatística com o SPSS Statistics. 6th ed. Sintra:
ReportNumber
Mayers, D., Smith, C., 1982. On the corporate demand for insurance. Journal of Business,
Vol.55, Nº2, pp.281-296.
Mills, L. F., & Newberry, K. J. (2004). Do foreign multinationals' tax incentives influence
their US income reporting and debt policy? National Tax Journal, Vol.57, Nº1, pp.89-107.
Modigliani, F., Miller, M., 1958. The cost of capital, corporation finance and the theory of
investment. American Economic Review, Vol.48, Nº3, pp.261-297.
Mutti, J., Grubert, H., 2009. The effect of taxes on royalties and the migration of intangible
assets abroad. In: Reinsdorf, M., Matthew, J. (Eds.), International Trade in Services and
Intangibles in the Era of Globalization. Chicago; University of Chicago Press.
Nance, D.R., Smith, C.W. Jr., Smithson, C.W., 1993. On the determinants of corporate
hedging. Journal of Finance, Vol.48, Nº3, pp.267-284.
Newberry, K.Y., Dhaliwal, D.S., 2001. Cross-jurisdictional income shifting by U.S.
multinationals: evidence from international bond offerings. Journal of Accounting
Research, Vol.39, Nº3, pp.643-662.
Organization for Economic Co-Operation (OECD), 2010. OECD Transfer Pricing
Guidelines for Multinational Enterprises and Tax Administrations. Paris: OECD
Publishing.
Organization for Economic Co-Operation (OECD), 2011. Corporate Loss Utilization
Through Aggressive Tax Planning. Paris: OECD Publishing.
Organization for Economic Co-Operation (OECD), 2015. Base Erosion and Profit Shifting
Project – Aligning Transfer pricing Outcome with Value Creation Action 8-10. Paris:
OECD Publishing.

43
Oyelere, P. B., and C. R. Emmanuel., 1998. International transfer pricing and income
shifting: Evidence from the U.K. The European Accounting Review, Vol.7, Nº4,
pp.623-635.
Raghavan, A., 2007. IRS probes tax goal of derivatives. Wall Street Journal, July 19.
Avaliable at: www.wsj.com [Accessed January 2016]
Raghavan, A., 2008. The tax dodge derivatives. Wall Street Journal, September 11.
Avaliable at: www.wsj.com [Accessed January 2016]
Rego, S., 2003. Tax avoidance activities of US multinational corporations. Contemporary
Accounting Research, Vol.20, Nº4, pp.805-833.
Richardson, G., and Taylor, G., 2015. Income shifting Incentives and Tax Haven
utilization: Evidence from Multinational U.S. Firms. The International Journal of
Accounting, Vol.50, Nº4, pp. 458-485.
Slemrod, J., 2001. A general model of the behaviour response to taxation. International Tax
and Public Finance, Vol.8, Nº2, pp.119-128.
Smith, C.W., Stulz, R.M., 1985.The determinants of firms’ hedging policies. Journal of
Financial and Quantitative Analysis, Vol.20, Nº 4, pp.391-405.
Smyth, J., 2013. Double Irish' limits Facebook's tax bill to €1.9m in Ireland. Available at:
www.ft.com [Accessed January 2016]
Stickney, C., McGee, V., 1982. Effective corporate tax rates: the effect of size, capital
intensity, leverage, and other factors. Journal of Accounting and Public Policy, Vol.1, Nº2,
pp.125-152.
Stulz, R.M., 2004. Should we fear derivatives? Journal of Economic Perspectives, Vol.18,
Nº3, pp.173-192.
,Szumilas, Magdalena., 2010. Explaining Odds Ratios. Journal of the Canadian Academy
for Child and Adolescent Psychiatry, Vol.19, Nº3, pp.227-229.
Taylor, G., and Richardson, G., 2015. International Corporate Tax Avoidance practices:
Evidence from Australian Firms. The International Journal of Accounting, Vol.50, Nº4,
pp.469-496.

44
Taylor, G., et al., 2015. Multinationality, Tax Havens, Intangible Assets, and Transfer
Pricing Aggressiveness: An Empirical Analysis. Journal of International Accounting
Research, Vol.14, Nº1, pp. 25-57.
United States Government Accountability Office (GAO), 2011. Financial derivatives:
Disparate tax treatment and information gaps create uncertainty and Potential abuse.
Washington: Report to Congressional Requesters.
Usmen, N., 2012. Transfer prices: A financial perspective. Journal of International
Financial Management and Accounting, Vol.23, Nº1, pp.1-22.
Van der Breggen et al. 2007. Tax controversy and intragroup financial transactions: An
emerging battleground. Available at: www.pwc.com [Accessed February 2016]
Weisbach, D.A., 2005. Problems with the Taxation of Financial Instruments. Working
paper. University of Chicago Law School.
Westfall, Peter H., 2014. Kurtosis as Peakedness, 1905–2014. R.I.P. The American
Statistician, Vol. 68, Nº3, pp.191–195.
Womack, B., Drucker, J., 2011. Google questioned by SEC over earnings in low-tax
countries. Bloomberg News, March 21. Available at: www.bloomberg.com [Accessed
January 2016]
Zhang, H., 2009. Effect of derivative accounting rules on corporate risk-management
behavior. Journal of Accounting and Economics, Vol.47, Nº3, pp.244-264.

Editorial Board ([email protected])Download available at: http://wps.fep.up.pt/wplist.php
also in http://ideas.repec.org/PaperSeries.html
48
