transducers00150199508018449.pdf
TRANSCRIPT

This article was downloaded by: [Universitara M Emineescu Iasi]On: 29 April 2013, At: 07:30Publisher: Taylor & FrancisInforma Ltd Registered in England and Wales Registered Number: 1072954 Registeredoffice: Mortimer House, 37-41 Mortimer Street, London W1T 3JH, UK
FerroelectricsPublication details, including instructions for authors andsubscription information:http://www.tandfonline.com/loi/gfer20
PVDF polymers: Imaging transducers andultrasonic hydrophone probesQian Zhang a & Peter A. Lewin aa Department of Electrical and Computer Engineering andBiomedical Engineering and Science, Institute, Drexel University,Philadelphia, PA 19104, USAPublished online: 26 Oct 2011.
To cite this article: Qian Zhang & Peter A. Lewin (1995): PVDF polymers: Imaging transducers andultrasonic hydrophone probes, Ferroelectrics, 171:1, 381-403
To link to this article: http://dx.doi.org/10.1080/00150199508018449
PLEASE SCROLL DOWN FOR ARTICLE
Full terms and conditions of use: http://www.tandfonline.com/page/terms-and-conditions
This article may be used for research, teaching, and private study purposes. Anysubstantial or systematic reproduction, redistribution, reselling, loan, sub-licensing,systematic supply, or distribution in any form to anyone is expressly forbidden.
The publisher does not give any warranty express or implied or make any representationthat the contents will be complete or accurate or up to date. The accuracy of anyinstructions, formulae, and drug doses should be independently verified with primarysources. The publisher shall not be liable for any loss, actions, claims, proceedings,demand, or costs or damages whatsoever or howsoever caused arising directly orindirectly in connection with or arising out of the use of this material.

Ferroelernics. 1995. Vol. 171. pp. 381-403 Reprints available directly from the publisher Photocopying permitted by license only
0 1995 OPA (Overseas Publishers Association) Amsterdam B.V. Published under license by Gordon and Breach Science Publishers SA
Printed in Malaysia
PVDF POLYMERS: IMAGING TRANSDUCERS AND ULTRASONIC HYDROPHONE PROBES
QIAN ZHANG and PETER A. LEWIN Department of Electrical and Computer Engineering and Biomedical Engineering
and Science Institute, Drexel University, Philadelphia, PA 19104, U S A
(Received September 19, 1994; in final form December 29, 1994)
This paper presents practical applications of PVDF polymers in biomedical ultrasonics. The applications discussed entail both miniature hydrophone probes for sensing ultrasonic fields and a new generation of non-resonant pulse-echo imaging transducers, which use multilayer polymer films. The multilayer PVDF transducer structure discussed here represents a relatively unconventional approach to the pulse- echo imaging transducer design. The non-resonant design provides exceptionally wide bandwidth and is suitable for operation at the clinically relevant frequencies. The design described uses multiple active piezopolymer layers arranged according to a Barker code pattern and is adapted for pulse echo imaging. The operation principle of the switchable Barker code transducer (SBCT) is outlined and it is shown that not only SBCTs pulse-echo sensitivity is on a par with that achievable with the resonant PZT or PZT composite transducer design but also the bandwidth achievable with SBCTs is twice as large as that exhibited by the conventional imaging scanheads. Also, it is demonstrated that the SBCT can be driven by virtually any excitation signal. This allows a potential improvement in clinical diagnosis by optimizing image resolution at a given penetration depth. To verify the computer simulation results, several three and seven layer Barker code transducers were fabricated and tested. The experimental results were found to be in good agreement with the theoretical predictions.
Keywords: PVDF hydrophones, wideband PVDF sources, multilayer imaging transducers.
1. INTRODUCTION
The availability of piezoelectic plastic materials which followed Dr. Kawai’s dis- covery of remanent polarization in polyvinylidene fluoride has revolutionized the field of ultrasonics. In particular, the wideband properties of the PVDF material have dramatically improved the overall acoustic performance of piezoelectric hy- drophones used for sensing ultrasonic fields. At present the calibrated PVDF hy- drophones are not only preferred over ceramic probes but are also recommended by international organizations for precise field measurements. The available band- width of the miniature PVDF hydrophone probes helped to provide evidence that the nonlinear acoustic propagation phenomena cannot be ruled out in both diag- nostic and therapeutic applications of ultrasound.
Wideband properties of a piezoelectric material are also of significant interest in ultrasonic imaging applications. This is because image resolution improves with increasing frequency. In addition, wide bandwidth material allows design and con- struction of a transducer which can operate well below its fundamental resonance frequency. Such non-resonant transducer would be able to provide an image at virtually any clinically relevant frequency. This, in turn, would increase the flexi- bility of ultrasound diagnosis by providing the operator with a possibility of trading image resolution with penetration depth.
While PVDF material’s wideband properties are excellent, its use in the field of
381
Dow
nloa
ded
by [
Uni
vers
itara
M E
min
eesc
u Ia
si]
at 0
7:30
29
Apr
il 20
13

382 Q. ZHANG and P. A. LEWIN
imaging transducer technology appears to be largely limited to special applications. Thus, Brown reviewed the use of PVDF transducers in ultrasonic intravenous catheter applications.' Sherar et al. used PVDF transducers for high frequency skin and eye imaging,*.' and Lewin and Schafer described wideband PVDF sources for Time Delay Spectrometry measurement^.^.^
This limited use of PVDF in ultrasound imaging is primarily due to the relatively low electromechanical coupling coefficient and dielectric constant which contribute to poor pulse-echo sensitivity of the PVDF source.
This work examines an alternative design of a pulse-echo PVDF transducer which addresses these deficiencies. In section 2, a succinct review of the current state-of- the art in the field of miniature PVDF hydrophone probes is given. This is done partly because such probes are indispensable in testing and quantitative evaluation of the imaging transducer's characteristics, and partly because the review dem- onstrates the impact which the discovery of piezoelectric properties in PVDF ma- terial had in the past two decades in the field of ultrasonic exposimetry. In section 3, the application of PVDF material in imaging transducer design is examined. Also, the operation principle of a viable multilayer transducer design approach, namely switchable Barker code transducer (SBCT) design is discussed. Further, computer simulations of electrical impedance, pulse-echo sensitivity and two-way insertion loss of the SBCT are presented and the simulation results are compared with those obtained with an optimized PZT transducer. In section 4, the pulse- echo responses of the SBCT obtained with different excitation signals are shown, and the behavior of the SBCT and PZT transducers in tissue-like medium is ex- amined. To verify the computer simulation results, a few prototypes of the Barker code transducer were constructed and tested. Section 5 describes the details of a prototype construction and presents the results of transducer testing in water. Also, in this section, a comparison of the experimental results and theoretical predictions is given. Finally, in section 6, the advantages and disadvantages of the SBCT design are pointed out, and recommendations for future work are outlined.
2. WIDEBAND PVDF ULTRASONIC HYDROPHONE PROBES
One of the most important applications of the piezopolymer film lies in the ultra- sonic hydrophone probe design. PVDF material has certain characteristics that make it well suited for hydrophone design, such as good mechanical flexibility and an acoustic impedance close to that of water. Since PVDF has a low planar coupling coefficient, it can provide a very wide uniform frequency response. Also, unlike the conventional piezoelectric ceramics, PVDF material is extremely flexible and can be conveniently formed into desired shapes. In addition, PVDF material is available in the form of sheets as thin as 9 pm which allows a potential bandwidth in excess of 100 MHz to be obtained. Several early designs of PVDF hydrophone probes which have been reported in the literature, have been summarized in Ref- erences 6 and 7. At present, two basic designs are being used: the needle-type,6 and the membrane design originally suggested in Reference 8 and later described in References 9 and 10. Since these two designs are recommended by international organizations for precise field measurement^"-'^ and were also used to test the
Dow
nloa
ded
by [
Uni
vers
itara
M E
min
eesc
u Ia
si]
at 0
7:30
29
Apr
il 20
13

PVDF TRANSDUCERS AND PROBES 383
performance of the multilayer non-resonant transducers, the hydrophone config- urations along with their key electroacoustical parameters are briefly described in the following.
2.1. Hydrophone Configurations
There are two well established sensor configurations which are widely used in measurement practice. Figure 1 shows the design principle of both sensors.
2.1.1. Membrane design. The first configuration uses the membrane approach originally suggested in Reference 8. In this configuration thin PVDF film is stretched out across an annular frame approximately 5-10 cm in diameter. Polyvinylidene film is available in sheets as thin as 9 pm. For a sensor operating in a half wavelength thickness mode (as is clearly the case for membrane configuration), 9 pm corre- sponds to a resonant frequency of approximately 110 MHz. l4 Only a selected portion of the PVDF film is made piezoelectrically active (spot Sensitive element radius ranges from 0.1-0.5 mm, and is located in the center of the membrane. Electrodes are usually made of gold and are vacuum deposited. The PVDF polymer sheet is thin enough that it is essentially transparent to the sound waves in the 1-15 MHz
The frequency response of a well designed membrane hydrophone is generally flat below the resonance frequency and falls off beyond the resonance. End-of- cable voltage sensitivity of the membrane hydrophones terminated into 1 MR and 30 pF varies depending on the thickness of the PVDF film and the diameter of the active element. Typically, 0.4 mm dia., 9 pm PVDF membrane exhibits sensitivity on the order of -278 dB re 1 V/pPa. The sensitivities of 0.5 mm dia., 25 pm co- planar membrane and 50 pm, bilaminar membrane are - 270 and - 266 dB re 1 V/pPa, respectively. These values assume coaxial cable length of approximately 0.5 m. Due to the complexity of the task, the absolute calibration is seldom carried out beyond 15 MHz.
2.1.2. Needle-type hydrophone. The second configuration of the PVDF hydro- phone is shown in Figure lb . It illustrates the needle-type sensor described in detail in Reference 6. Briefly, this hydrophone consists of a 9-24 pm thick circular PVDF film, typically 0.5-1 mm diameter, attached to an insulating layer at the end of a hypodermic needle (Figure lb). The backing material behind the element has a higher acoustical impedance than water, and, as a result, the resonance corresponds roughly to a quarter wavelength thickness of the PVDF film. l4 This construction is particularly useful for spatial field plotting and near field (CW measurements). Also, since the physical dimensions of the hydrophone probe are virtually the same as the dimensions of the active sensor element, the disturbance of the acoustic field is minimized. The design shown in Figure l b has a built-in preamplifier which boosts the end-of-cable sensitivity and minimizes the transmission line phenomena. The preamplifier features 14 dB gain which is externally controlled using a magnetic relay. This feature is particularly useful when signal-to-noise ratio is critical and in studying non-linear propagation effects. The advantages and disadvantages of an integrated preamplifier are further discussed in section 2.4. An example of the
Dow
nloa
ded
by [
Uni
vers
itara
M E
min
eesc
u Ia
si]
at 0
7:30
29
Apr
il 20
13

384 0. ZHANG and P. A. LEWlN
FIGURE I Schematic construction of two PVDF hydrophone configurations: a) membrane-type (cour- tesy of Sonic Technologies. Hathoro, PA. USA). b) Lewin- or needle-type (courtesy of Force Institute, Copenhagen-Brondby. Denmark).
frequency response of a needle-type hydrophone with an integrated preamplifier is shown in Figure 2 .
2.2.
In ultrasonic field measurement practice the choice between the membrane- and the needle hydrophone configuration depends on particular application and on the
Selecting and Using a Hydrophone
Dow
nloa
ded
by [
Uni
vers
itara
M E
min
eesc
u Ia
si]
at 0
7:30
29
Apr
il 20
13

385
Frequency in MHz FIGURE 2 Calibrated end-of-cable frequency response of a modified Lewin (needle-type) PVDF hydrophone probe measured in water. Integrated preamplifier minimizes the transmission line phe- nomena.
limitations associated with the hydrophone parameters such as end-of-cable sen- sitivity, uniformity or flatness of frequency response, and angular response. I 6 , l 7
Since the precision of ultrasonic field measurements is critically dependent on the effective diameter of the active sensor element and associated angular response, these parameters are discussed in more detail. Also, a few comments on linearity of the hydrophone, which is of particular importance, especially when character- izing high pressure amplitude fields, are included.
Effective diameter: As already mentioned, the smaller the element diameter, the more omnidirectional the hydrophone’s angular response becomes. There are, however, two factors that limit the minimum practical element size in the membrane design. One is the tradeoff between element area and end-of-cable sensitivity. This factor is not especially critical because it can be easily overcome by including a preamplifier in the immediate vicinity of the active element. The second factor is due to “fringing” effects associated with spot poling the PVDF film.9J8 During the poling process, the electrical field spreads outside the area where the electrodes overlap. This results in an asymmetrical sensitive element and hence asymmetrical angular response. It has been shown9.’* that the “fringing” effect becomes partic- ularly significant for element diameters less than 1 mm.
Angular response: It is appropriate to point out that there is a difference between the geometrical and effective diameter of the probe. Since, in general, and in the case of membrane design in particular, the effective diameter is larger than the geometrical ~ne~,’’~’* it has to be determined separately. This can be conveniently done through a careful measurement of directivity pattern or angular response in connection with an absolute calibration of the hydrophone probes. A more detailed discussion of those calibration methods can be found in References 19 and 20.
A comprehensive comparison of angular responses for different hydrophone designs can be found in Reference 17. It appears, that the Lewin-type hydrophone directivity patterns are close to those predicted by a simple piston model. In con- trast, the membrane-type designs exhibit accentuated side lobes and, in general, the membrane directivity patterns cannot be predicted using the simple uniform
Dow
nloa
ded
by [
Uni
vers
itara
M E
min
eesc
u Ia
si]
at 0
7:30
29
Apr
il 20
13

Q. ZHANG and P. A . LEWIN 386
circular receiver model. This is due to the generation of membrane (Lamb) waves when the sound field is incident at the critical angle (approximately 50°)."'.17
Linearity: Another noteworthy hydrophone parameter is linearity. Modern di- agnostic imaging equipment is capable of generating instantaneous pressure am- plitudes on the order of 10 MPa." Such amplitudes are only an order of magnitude lower than those encountered in the focal region of the extracorporeal shock wave generators (lithotripters). The l i th~t r ip te rs '~ . '~ are widely used as the devices for removal of kidney and gallstones without the need for open surgery. Therefore, a faithful reproduction of these highly distorted pressure pulses is important for quantitative acoustic field measurements. Currently available evidence seems to indicate that the PVDF polymer material is linear up to extremely high pressures (100 MPa).22,23 Additional evidence supporting linear response of the PVDF pol- ymer material emerges from the recent testing of the specially designed PVDF hydrophones for underwater acoustic application^.^^ Negligible changes in the fre- quency response of the hydrophones were observed up to hydrostatic pressures of 6900 MPa.24
The choice of particular configuration depends on the applications o r given measurement task. The membrane design exhibits wider bandwidth due to its pure half wavelength resonance configuration, however its angular response is inferior to the one achievable with a well designed needle-type hydrophone .I7 Since the membrane hydrophone exhibits accentuated sidelobes, a needle-type hydrophone may be preferable for measurements of CW fields such as those produced by a CW Doppler device. This is because standing waves may be generated by reflections from the membrane hydrophone. In addition, the membrane design is not well suited for CW fields, and whenever measurements have to be carried out in confined spaces. For in-vivo measurements, the classical membrane design is impractical and a needle design or its modification must be ~ s e d . ~ ~ . ~ ~ The most severe limitation of the currently available piezoelectric hydrophones is due to their finite aperture. Current experience indicates that fabrication of 0.2 mm effective radius hydrophone is feasible. Further improvements in spatial resolution can be offered by fiber optic hydrophones2' at the expense of simplicity of the basic measurement arrangement.
2.3. Other Hydrophone Designs Although the discussion previously was focused primarily on the needle-and-mem- brane type hydrophone probes, a few other designs have been reported. A mul- tielement (array) membrane design can be made by spot poling a number of ele- ments along the axis.* Such construction has been suggested for rapid lateral electronic scanning of the field generated from diagnostic transducers, however, it requires specially designed electronic circuitry for retrieving the signals from individual elements.=
An interesting modification of the needle-type probe has been suggested in Reference 29. In this design the liquefied polymer material is corona polarized on a convex backing support and hence the probe shape corresponds to a fraction of a sphere. This construction reportedly exhibits further improvement in directivity patterns in comparison with the original needle design6 and brings them closer to
Dow
nloa
ded
by [
Uni
vers
itara
M E
min
eesc
u Ia
si]
at 0
7:30
29
Apr
il 20
13

PVDF TRANSDUCERS AND PROBES 387
the more desirable spherical characteristics. However, this is done at the expense of the uniformity of the frequency response.
Another modification of the membrane designs described in section 2.2.1 has been described in Reference 30. In this design PVDF sensor element is mounted on a heavily absorbing backing and protected from the environment by a thin layer of (usually gold) metallized film. This hydrophone has also a built-in preamplifier. A comprehensive discussion of the advantages and disadvantages associated with the use of integrated preamplifiers is given in Reference 31. Briefly, the most important reason for inclusion of an integrated preamplifier is that, when properly designed, it can exclude cable resonances and associated wave distortion. Those effects are particularly troublesome at high pressure amplitudes but, since they are dependent on cable length, they can be minimized by the shortest possible cable length for a given measurement bandwidth. They can also be minimized by limiting the bandwidth of the oscilloscope used for the recording of the pressure time waveforms.18 In addition, a preamplifier may be desirable to make overall fre- quency response unif01-m.~~ It is well known that due to finite amplitude effects in water, pressure-time waveforms generated by diagnostic ultrasound equipment often exhibit spectral content well beyond 50 MHz.lR Therefore, the IEC recom- mendations call for hydrophone bandwidth to be approximately an order of mag- nitude larger than the center frequency of the measured pressure pulse.” This, in turn, leads to requirements on the overall frequency response of the hydro- phone/preamplifier assembly. To minimize the intensity measurement errors, in particular those caused by the hydrophone’s resonance response , a preamplifier should be designed as a low pass filter in such a way that the overall frequency response of the preamplifier hydrophone assembly is made as flat as possible.
3. MULTILAYER PIEZOPOLYMER TRANSDUCERS
In contrast to the significant advances made in the ultrasonic hydrophone probe design, the impact of PVDF film on ultrasonic imaging transducers is much less impressive. As mentioned previously, this apparent lack of interest in the design of PVDF pulse-echo imaging transducers is primarily due to the low electrome- chanical coupling coefficient of the PVDF, which results in a poor pulse-echo sensitivity. Also, a low dielectric constant and a high dielectric loss make it difficult to match PVDF transducers with the associated electronics. To overcome these problems, several piezopolymer multilayer structures have been ~uggested.~*-~’ Prior to discussion of the multilayer design analyzed in this work, a brief review of the existing multilayer polymer transducers and their operation principles is given. This review provides a useful background for a discussion of a non-resonant pulse-echo multilayer PVDF transducer described in the following.
3.1. Folded Multilayer Transducer
The folded multilayer transducer design has been investigated by several research groups.32.33.3x While in Reference 32 this approach was used to improve the trans- mitting properties of a piezopolymer transducer, in Reference 38 attention was
Dow
nloa
ded
by [
Uni
vers
itara
M E
min
eesc
u Ia
si]
at 0
7:30
29
Apr
il 20
13
388 0. ZHANG and P. A. LEWIN
l"i
C= eA C = N Y t
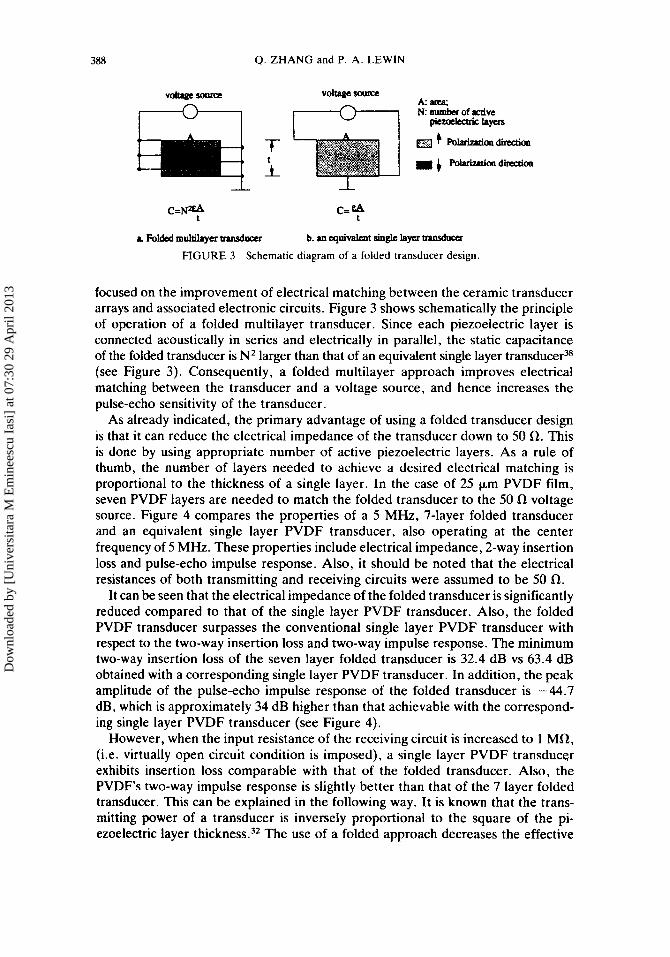
a FolW rnultilaycr transducer b. an cquinlent single l a p transduca FIGURE 3 Schematic diagram of a folded transducer design.
focused on the improvement of electrical matching between the ceramic transducer arrays and associated electronic circuits. Figure 3 shows schematically the principle of operation of a folded multilayer transducer. Since each piezoelectric layer is connected acoustically in series and electrically in parallel, the static capacitance of the folded transducer is N2 larger than that of an equivalent single layer transducer38 (see Figure 3). Consequently, a folded multilayer approach improves electrical matching between the transducer and a voltage source, and hence increases the pulse-echo sensitivity of the transducer.
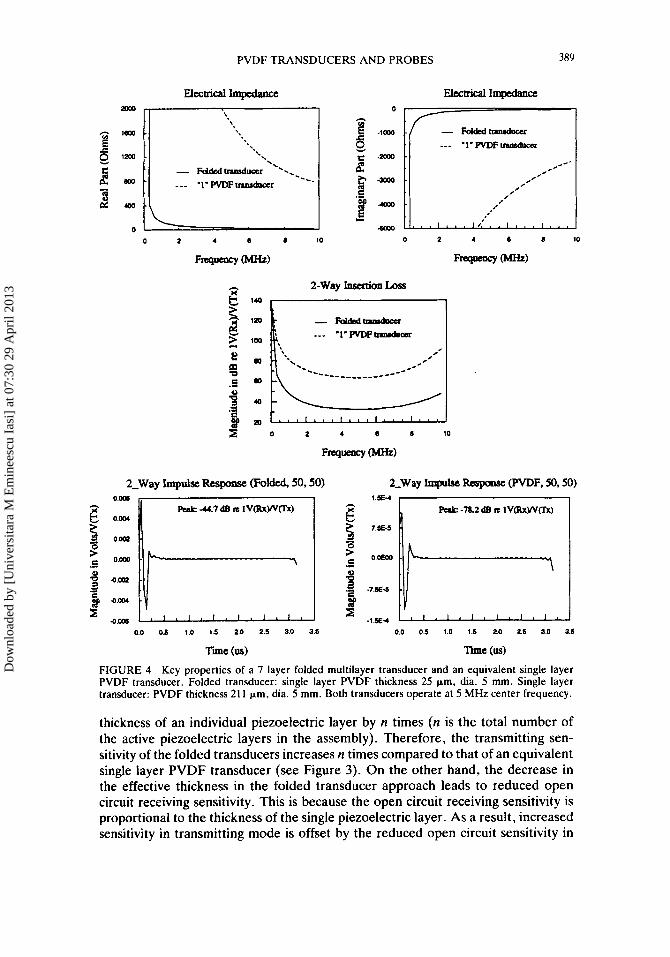
As already indicated, the primary advantage of using a folded transducer design is that it can reduce the electrical impedance of the transducer down to 50 R. This is done by using appropriate number of active piezoelectric layers. As a rule of thumb, the number of layers needed to achieve a desired electrical matching is proportional to the thickness of a single layer. In the case of 25 pm PVDF film, seven PVDF layers are needed to match the folded transducer to the 50 R voltage source. Figure 4 compares the properties of a 5 MHz, 7-layer folded transducer and an equivalent single layer PVDF transducer, also operating at the center frequency of 5 M E . These properties include electrical impedance, 2-way insertion loss and pulse-echo impulse response. Also, it should be noted that the electrical resistances of both transmitting and receiving circuits were assumed to be 50 R.
It can be seen that the electrical impedance of the folded transducer is significantly reduced compared to that of the single layer PVDF transducer. Also, the folded PVDF transducer surpasses the conventional single layer PVDF transducer with respect to the two-way insertion loss and two-way impulse response. The minimum two-way insertion loss of the seven layer folded transducer is 32.4 dB vs 63.4 dB obtained with a corresponding single layer PVDF transducer. In addition, the peak amplitude of the pulse-echo impulse response of the folded transducer is -44.7 dB, which is approximately 34 dB higher than that achievable with the correspond- ing single layer PVDF transducer (see Figure 4).
However, when the input resistance of the receiving circuit is increased to 1 MR, (i.e. virtually open circuit condition is imposed), a single layer PVDF transducer exhibits insertion loss comparable with that of the folded transducer. Also, the PVDFs two-way impulse response is slightly better than that of the 7 layer folded transducer. This can be explained in the following way. It is known that the trans- mitting power of a transducer is inversely proportional to the square of the pi- ezoelectric layer thicknes3* The use of a folded approach decreases the effective
Dow
nloa
ded
by [
Uni
vers
itara
M E
min
eesc
u Ia
si]
at 0
7:30
29
Apr
il 20
13
PVDF TRANSDUCERS AND PROBES 389
- Ism
c 2 o_
0
c .C
0 h
B -low
Oy c
E --
n m
P 3 .- c
1.e-4 , 1
0.0 05 1.0 1.5 2.0 2.8 3.0 3.5 0.0 0.5 1.0 1.5 2.0 25 3.0 3.5
rim (US) Time (us) FIGURE 4 Key properties of a 7 layer folded multilayer transducer and an equivalent single layer PVDF transducer. Folded transducer: single layer PVDF thickness 25 pm, dia. 5 mm. Single layer transducer: PVDF thickness 21 1 pm, dia. 5 mm. Both transducers operate at 5 MHz center frequency.
thickness of an individual piezoelectric layer by n times (n is the total number of the active piezoelectric layers in the assembly). Therefore, the transmitting sen- sitivity of the folded transducers increases n times compared to that of an equivalent single layer PVDF transducer (see Figure 3). On the other hand, the decrease in the effective thickness in the folded transducer approach leads to reduced open circuit receiving sensitivity. This is because the open circuit receiving sensitivity is proportional to the thickness of the single piezoelectric layer. As a result, increased sensitivity in transmitting mode is offset by the reduced open circuit sensitivity in
Dow
nloa
ded
by [
Uni
vers
itara
M E
min
eesc
u Ia
si]
at 0
7:30
29
Apr
il 20
13

0. ZHANG and P. A . LEWIN 390
receiving mode. Consequently, the pulse-echo sensitivity of the folded multilayer transducer and the equivalent single layer PVDF transducer are almost identical.
Also, it is worth noting that the resonance frequency of the folded transducer is determined by the overall thickness of the multilayer stack rather than by that of a single piezoelectric
To improve the pulse-echo characteristics of the polymer transducers while re- taining wideband properties of the PVDF film, a Barker code transducer design was considered and its operation principles are given in the next section.
3.2. Barker Code Multilayer Transducers
The behavior of multilayer Barker code transducers was originally investigated by a group of researchers at the University of Aachen about a decade ag0.”.”7.~” The work presented here is a further extension of the results published in References 36 and 37. The data published in Reference 39 focused primarily on the application of ultrasound pulse compression technique and have been obtained using PZT ceramics. Also, since the transducer design described in Reference 39 required the use of a separate transmitter and receiver, the results presented were not imme- diately applicable in the medical imaging field. While the work described in Ref- erences 36, 37 and 39 focused mainly on the experimental approach, the work presented here provides a more systematic insight into the factors governing Barker code transducer performance. Attention is given to a systematic, step-by-step ap- proach including design, construction and testing of the Barker code transducers. In particular, the principle of operation of the multilayer Barker code transducers (both separated3” and pu l se -e~ho~‘ .~~) is thoroughly explained. Also, a development of a transducer model especially suited to simulate the performance of a complex, multilayer transducer is described. The model takes into account the losses in PVDF material and allows key electromechanical parameters including two-way insertion loss, impulse response and electrical impedance of the multilayer transducer to be calculated. Moreover, by using the model developed, the performance of the mul- tilayer transducer both in water and in tissue-like medium can be predicted. Finally, the relationship between folded, Barker code and pulse-echo Barker code trans- ducers termed here as switchable Barker code transducers (SBCTs) is carefully examined and it is shown that the SBCT approach combines advantages of both the folded and the Barker code transducer design.
3.2.1. Principle of a Barker code transducer. The term Barker code transducers used here refers to a specially assembled multilayer structure in which the individual piezoelectric layers are arranged in such a way that their polarization pattern is consistent with a Barker code pattern.40 The maximum length of the Barker code is 13.
Barker codes exhibit two important properties: First, the sidelobes of the au- tocorrelation function contain the minimum energy and this energy is uniformly distributed among the side lobe^.^^ Second, the complementary code can be ob- tained by reversing the sign of every other element in the original
Figure 5 shows a schematic diagram of a 7 layer Barker code transmitter and receiver. As illustrated in Figure 5a. the first three layers in the utter right of the
Dow
nloa
ded
by [
Uni
vers
itara
M E
min
eesc
u Ia
si]
at 0
7:30
29
Apr
il 20
13

PVDF TRANSDUCERS AND PROBES 391
Backing Multiple Piezoelectric Material Polymer Layers
a. 7 Layer Ba~k.e$ Code Transmitter
Multiple Piezoelcchic Backing Polymer Layers Matcrial
SUIfaCe L T l b. 7 Layer Barker Code Rccciw
FIGURE 5 Schematic diagram of a 7 layer Barker code transducer: a) transmitter, b) receiver.
transmitter assembly (see Figure 5a) represent the three positive digits in the Barker code pattern of length 7.4’ The next two layers with the opposite polarization direction correspond to the two negative digits in the code pattern. Further ex- amination of Figure 5 indicates that the polarization pattern of this 7 layer Barker code transmitter is consistent with the Barker code pattern of length 7. Figure 5b shows a corresponding 7 layer Barker code receiver. It is clear that the polarization pattern of the receiver mirrors that of the transmitter.
Figure 6 illustrates the operation principle of the Barker code transducer. More specifically, when an excitation voltage is applied to the transmitter, an acoustic wave is generated in each individual piezoelectric layer (see Figure 6; all layers have identical thickness). To simplify the analysis, it is assumed that the interrogated medium is linear and lossless. The generated acoustic pulses are launched into the medium with a delay governed by the propagation time of an acoustic wave through a given number of piezoelectric layers. When the transmitted waves arrive at the surface of the Barker code receiver, they sequentially generate electrical voltage in each individual piezoelectric layer in the receiving assembly. Since the polari-
Dow
nloa
ded
by [
Uni
vers
itara
M E
min
eesc
u Ia
si]
at 0
7:30
29
Apr
il 20
13

392 0. ZHANG and P. A. LEWIN
Barker Code Transmitter
BarkcrCode Receiver
zation pattern of the receiver mirrors that of the transmitter (see Figure 6), there will be a time, say t = t p , when each of the individual acoustic waves or pulses launched will reach its corresponding receiving layer. When this occurs, the voltage generated in each individual layer will exhibit the same polarity. Consequently, the output voltage produced at the terminals of the Barker code receiver will be n times larger than that generated within a single layer (see Figure 6). At all other times, the voltage generated in each individual layer exhibits different polarity and some of the voltages will be canceled out. The remaining voltages will manifest themselves as ripples in the output waveform of the Barker code transducer (see Figure 6).
It is worth noting that in the Barker code transducer, the multiple piezoelectric layers are connected electrically in series (see Figure 6). Hence, the static capac- itance observed from the electrical port of the Barker code transducer is approx- imately Co/n, where n is the number of active PVDF layers and Co is the static capacitance of a single PVDF layer in the assembly. Consequently, the electrical impedance of a Barker code transducer is approximately n times higher than that of a single layer PVDF transducer.
Also, it should be pointed out that in the Barker code transducer, the excitation voltage is applied across the stack of the multiple films. Consequently, the electrical field across the transducer structure decreases with increasing number of the layers. Since the acoustic pressure generated by an individual piezoelectric layer is directly proportional to the electrical field applied, such decrease will result in reduced transmitting sensitivity. Therefore, the gain in sensitivity achieved using Barker code approach is offset partly due to the reduced electrical field across the multilayer structure and partly because of the poor electrical matching between Barker code transducer and the voltage excitation source.
Despite the drawbacks discussed previously Barker code transducer design is
Dow
nloa
ded
by [
Uni
vers
itara
M E
min
eesc
u Ia
si]
at 0
7:30
29
Apr
il 20
13

PVDF TRANSDUCERS AND PROBES 393
attractive because the resonance frequency of the transducer assembly is deter- mined by the thickness of a single piezopolymer layer, and transducer operates in the off-resonance mode.34,35 This feature was utilized in the development of a wideband pulse-echo imaging transducer described in the next section.
3.3. Switchable Barker Code Transducers
In the following, it will be shown that a modified or switchable Barker code trans- ducer combines the advantages of both folded and Barker code transducers. As a result, the transducer design examined exhibits twice the bandwidth of that achiev- able with a conventional resonant PZT transducer design. Also, the modified Barker code transducer provides pulse-echo sensitivity comparable to that achiev- able with the optimized conventional PZT or PZT composite transducers.
As already mentioned in section 3.2.1, a Barker code can be converted into its complementary code by reversing the sign of every other element in the original
This feature forms the basis of the switchable pulse-echo Barker code transducer described here. Figure 7 illustrates schematically the operation principle of such transducer. As shown in Figure 7, the multiple piezoelectric layers are
I-
a Switchable Barkcr Codc Transducer
Equivalent Transmimr Equivalent Receiver - b. Equivalent polarization pattern
of a SBCT transmiFtcr c. Equivalent polarization pattern
of a SBCI' receiver
polarizationdirection Vt - excitation voltage , Vr - received voltage
FIGURE 7 A schematic diagram of a 7 layer switchable Barker code transducer (SBCT).
Dow
nloa
ded
by [
Uni
vers
itara
M E
min
eesc
u Ia
si]
at 0
7:30
29
Apr
il 20
13

394 0. ZHANG and P. A. LEWIN
stacked according to a Barker code pattern; again, Barker code of length 7 is used. The switches are connected to each individual piezoelectric layer in the following way. During the transmitting period, the switches are set to “on” position. The resulting equivalent polarization pattern of the transducer is shown in Figure 7b. Since each individual piezoelectric layer is connected electrically in parallel and acoustically in series, the electrical impedance of the transmitter is similar to that of a folded transducer. Also, because the excitation voltage is applied directly to each individual piezoelectric layer, the overall electrical field applied to the trans- mitter is n times higher compared to that experienced by a Barker code transmitter described in section 3.2.1. Hence, the transmitting sensitivity of the switchable Barker code transducer is proportional to the number of layers in the assembly. In the receiving mode, the switches are set to ”off” position, and the equivalent transducer configuration is shown in Figure 7c. It is worth noting that the multiple piezoelectric layers are connected electrically in series during the receiving period. Therefore, the transducer presents a high impedance to the receiving circuit. Ac- cordingly, in the following discussion, to ensure maximum pulse-echo sensitivity, it was assumed that the switchable Barker code transducer was excited by a 50 i2 voltage source and loaded with a 1 Mi2 resistance. In practice, 1 Mi2 input resistance can be easily obtained by inserting a voltage follower circuit between the transducer assembly and connecting cable. This solution is further discussed in the concluding section.
It is well known that in the conventional, resonant transducer design, the use of lossy backing material improves the transducer’s bandwidth at the expense of its sensitivity. To examine the influence of the backing material on the SBCT’s per- formance, simulations were carried out using light (acoustic impedance Z = 2.3 MR), matched (Z = 4.5 MR) and heavy (Z = 30 MR) backing materials. The simulation results indicated that the acoustic impedance of the backing material had no influence on the sensitivity of the switchable Barker code transducer. How- ever, the use of light and heavy backing resulted in distortions in the pulse-echo waveform and prolonged the pulse duration. Therefore, the simulation results of SBCTs presented later were obtained using matched backing material, i.e. the acoustic impedance of the backing material was identical to that of the piezo- electrically active PVDF material (Z = 4.5 MR).
Since the use of the resonant PZT ceramic transducers is, at present, predominant in diagnostic ultrasound imaging, the performance of the SBCT was compared with that of an optimized PZT transducer. In particular, the switchable Barker code transducer simulated here used eleven P(VDF-TrFE) copolymer layers and was backed by a piezoelectrically inactive P(VDF-TrFE) rod. The thickness of a single copolymer layer was 120 p n which corresponds to 10 MHz resonance frequency. It is worth noting that the switchable Barker code transducer operates in off- resonance mode, and its center frequency is 5 MHz. In addition, the Barker code transducer simulated was excited by a 50 R voltage source and terminated with a 1 Ma resistance in the receiving mode to maximize its pulse-echo sensitivity.
The resonant PZT transducer simulated was air backed and used two quarter wavelength front matching layers for optimum performance. The acoustic imped- ance of these matching layers was chosen based on the procedure suggested in Reference 42. To facilitate direct comparison between the two designs considered,
Dow
nloa
ded
by [
Uni
vers
itara
M E
min
eesc
u Ia
si]
at 0
7:30
29
Apr
il 20
13

PVDF TRANSDUCERS AND PROBES 395
the PZT transducer operated at the center (resonance) frequency of 5 MHz and was excited by a 50 R voltage source and loaded with the identical resistance in receiving mode.
Figure 8 compares the computer simulations of electrical impedance, two-way insertion loss and pulse-echo impulse response of switchable Barker code transducer and the optimized PZT transducer. 'The simulations were carried out for the fol-
= 20. It can be seen that both PZT and SBCT transducers exhibit the electrical impedance on the order of 50 R in the vicinity of the center frequency of 5 MHz (see Figure 8a). It should be noted that the - 6 dB bandwidth of the SBCT is much wider than that of the PZT transducer (7.8 MHz vs 2.8 MHz). In addition, the peak amplitude of the pulse-echo impulse response of the SBCT transducer is about 6 dB higher than that of the PZT transducer ( - 15.6 dB re lV(Rx)/V(Tx) vs -21.9 dB re lV(Rx)/V(Tx)). However, the minimum insertion loss of the SBCT appears to be 4 dB higher in comparison with that of the optimized PZT transducer. This is because the PZT transducer used matched electrical loads (50 R, 50 R), while the SBCT was loaded with 50 R in the transmitting and 1 MR in the receiving mode, respectively. Further reduction of the insertion loss of the SBCT is possible by inserting a voltage follower circuit in the immediate vicinity of the transducer assembly.
In conclusion, the computer simulation results presented here indicate that the
lowing data set: ~ . P Z T = 0.497 kr.P(VDF-TrFE) = 0.33 Q ~ . P Z T = 7 6 . 9 7 Qm.P(VDF-TrFE)
Electrical Impedance
h 2-Way Insation Loss
h
Electlid Impedance
2-Way Impulse Response 0.20 I
- mtlmudwu
0.10 O ' l 5 I i --- SBCT
-0.15 ' Y ' 1 ' 1 " " ' I ' 0.0 0.5 1.0 1.5 2.0 2.5 3.0 3.5
T'= (us) FIGURE 8 Properties of 11-layer SBCT and an optimized PZT transducer: a) electrical impedance, b) two-way insertion loss, c) pulse-echo impulse response.
Dow
nloa
ded
by [
Uni
vers
itara
M E
min
eesc
u Ia
si]
at 0
7:30
29
Apr
il 20
13

396 Q. ZHANG and P. A. LEWIN
020
015 . I P d - 1 4 d B r e l V -6dB pw: 0.1- p 010 - -2odB Fw: 1.0 01
C .-
a o w
410
- 4 * ' ' ' I ' I ' I . I ' -
switchable Barker code transducers exhibit sensitivity comparable to that achievable with the optimized PZT transducer and bandwidth equivalent to that of a single layer PVDF transducer. In the following, the pulse-echo characteristics of the switchable Barker code transducers obtained with different excitation signals are presented. The results are compared with those obtained from the optimized PZT transducer.
OW
h M - m a r e i v
L I ddB PW: 0.4s-
-mdBpw: 1.1sw
$ O M - om - i o m 4
5 402 1 -
2 4- I " * ' 1 ' ' a ' 1
4. COMPUTER SIMULATIONS
As already mentioned, the use of a wideband transducer allows frequency tailored operation. In the following, the feasibility of using a SBCT with both spike and multiple frequency excitation is examined, and the performance of the switchable Barker code transducer is compared with that achievable with an equivalent, op- timized PZT transducer. Also, a behavior of these transducers in both lossy and lossless media is analyzed.
Spike excitation: Since spike excitation is widely used in ultrasound imaging sys- tems, this excitation was simulated first. Figure 9 presents the SBCT and PZT transducer pulse-echo responses when a spike excitation was used. It can be seen that SBCT's - 6 dB pulse duration is 4.5 times shorter (0.1 ps vs 0.45 ps) and - 20 dB pulse duration is 15% shorter (1 ~s vs 1.15 ps) in comparison with the one achievable with the resonant PZT transducer. Consequently, SBCT characteristics are more advantageous for medical imaging applications than those of the PZT transducer. It is worth noting that the overall sensitivity of the SBCT is approxi- mately 12 dB higher than that of the PZT transducer, which appears to be somewhat inconsistent with the corresponding data discussed in section 3. There, the peak amplitude of SBCT's impulse response was only 6 dB higher in comparison with that of the resonant PZT transducer. This apparent inconsistency can be explained with reference to Figure 10 which shows a relevant set of computer predicted data. As shown in Figure 10a, a large amount of excitation energy is comprised in the low frequency range, where the spectrum of the PZT transducer shows significantly lower sensitivity (see right side of the Figure lob). Therefore, the PZT transducer
Dow
nloa
ded
by [
Uni
vers
itara
M E
min
eesc
u Ia
si]
at 0
7:30
29
Apr
il 20
13

PVDF TRANSDUCERS AND PROBES 397
20
16
10
5
0
-5
-10
Excitation Spectrum (Spike)
7
Two-way Transfa Function (SBCT)
+ I I I . , , I , I , I . . . I , . I
0 2 4 e 8 10
0 2 4 6 a 10
FIGURE 10 Comparison of the SBCT and PZT transducers: a) spectrum of spike-like excitation signal, b) two-way transfer function of SBCT (left) and PZT (right) transducer, respectively and c) pulse-echo spectrum of SBCT (left) and PZT (right) transducer, respectively.
generates lower output voltage. In contrast, the switchable Barker code transducer exhibits much wider bandwidth and the low frequency content of the spike spectrum falls within the SBCT bandwidth. Consequently, the SBCT produces higher output.
Monocycle sine wave excitation: Figure 11 illustrates the pulse-echo responses of the SBCT and PZT transducers obtained with monocycle sine wave excitations. The 3.5 MHz, 5 MHz and 7.5 MHz frequencies were chosen as they represent the most often used frequencies in medical ultrasound imaging.
Examination of the plots presented in Figure 11 shows that the sensitivity of the
Dow
nloa
ded
by [
Uni
vers
itara
M E
min
eesc
u Ia
si]
at 0
7:30
29
Apr
il 20
13

398 Q. ZHANG and P. A . LEWIN
UI -
who response (SBCT, 3.5MHz)
Pesk: -10.2 dB R 1v
-2CdB PW: 0.4 US g 02 4dB P W 0.2 ma
.B 01
1 Peak -213 dB R 1v 0.3 I
- ' OW - 8
0.10
0.05
om
40s
4.10
4.15
-6dE PW: 0.28 us -2odB pw: 0.82 us
- Pealc -16.9 re 1V \ -6dE PW: 0.45 us - -2odB Pw: 1.1s lJs
- -
I > I I I . I , I , I , _ 0.0 0.6 1.0 1.5 2.0 2.6 3.0 3.6
c .- 4 om a g 4c6 - .- - 4
1
Time (us)
Pulse echo response m - 5 & 5MHz) 0 16
0 10 - palc -16.4dBn 1V 4dB FW 0.3 IM Y
.B om
- - 2 o d ~ pw: aas M 8 om
-
.- - 4 4 1 s -
420 ' ' ' ' 1 ' I ' 1 ' 0 0 05 10 1 5 LO 2 5 30 3 5
Time (us)
4 1 0 3 I ' I ' 1 3 I ' I 9 1 '
FIGURE I 1 Pulse-echo responses of SBCT and PZT transducers at 3.5, 5.0 and 7.5 MHz monocycle sine wave excitation: a) SBCT vs PZT at 3.5 MHz, b) SBCT vs PZT at 5.0 MHz and c) SBCT vs PZT at 7.5 MHz.
SBCT stays practically constant (approximately, - 10 dB) when the frequency of the monocycle excitation signal increases from 3.5 to 7.5 MHz. In contrast, for the same excitation, the peak output of the PZT transducer decreases from - 16.4 dB to -21.3 dB. Also, it appears that the SBCT can be used in the 2-10 MHz frequency range while the PZT transducer cannot be operated below 2 MHz and above 8 MHz (see Figure lob). Finally, the SBCT exhibits a shorter pulse duration than that produced by the PZT transducer (see Figure 11). It is worth noting that this shorter pulse duration would result in a better axial resolution of the ultrasound image. Accordingly, the switchable Barker code transducer is more suitable for
Dow
nloa
ded
by [
Uni
vers
itara
M E
min
eesc
u Ia
si]
at 0
7:30
29
Apr
il 20
13

PVDF TRANSDUCERS AND PROBES 399
O W
{ h& -433 dBn 1V
-2odB pw: 1.05 m d d ~ p w : a z m 9 0- .
> om . - 0
.- c Ti:- l b (1-w)
/ P " 1
OaaD .-
j Q . O O Z \ /
4.004 - ' I ' ' ' I ' ' ' ' ' I *
onm - Fuk -58.2 dB le 1 v -6dBrnOA5W -2068 PW: 1.4s m
r - m ~~ 0 - v )
4- I " ' I ' I ' ' '
frequency tailored operation. Such operation allows a potential improvement in clinical diagnosis by optimizing image resolution and penetration depth.
Tksue influence: Since tissue is the medium of immediate interest in the medical ultrasonic applications, the performance of the SBCT and the PZT transducer was also examined when a 10 cm thick tissue layer was loading the front plate of the SBCT transducer. The excitation signal used was a 5 MHz monocycle sine wave and attenuation coefficient of tissue was assumed to be 0.5 dB/cmMHz. The sim- ulation results are presented in Figure 12.
The results of Figure 12 indicate that the sensitivity of the SBCT is approximately 15 dB higher in comparison with that obtained from the PZT transducer. This can be readily explained based on the difference in the bandwidth of the transducers (see Figure 10). It is well known that the frequency dependent attenuation in tissue causes the acoustic spectrum to be shifted to the lower frequencies. This spectrum shift dramatically decreases the acoustic energy detected by the PZT transducer. In contrast, the wide bandwidth of the SBCT allows full reception of the down shifted acoustic spectrum. Therefore, the output of the SBCT is much higher than that of the PZT transducer.
In conclusion, it was shown that the switchable Barker code transducer can be driven by a variety of excitation signals such as spike-like pulse and monocycle sine waves. The SBCT exhibits uniform sensitivity independent of driving signal frequency, while the PZT transducer shows frequency dependent sensitivity in the 3.5-7.5 MHz frequency range. Also, the SBCT shows much shorter pulse duration than that obtained with the PZT transducer, which facilitates an improvement in the axial resolution of the ultrasound image. Finally, the switchable Barker code transducer shows excellent performance when the tissue layer is included.
The results of the simulations presented previously support the notion that the proposed switchable Barker code transducer may form a viable alternative to currently used PZT ceramic or composite transducers. In the next section, con- struction and testing results of the prototypes of the Barker code transducers are presented.
Dow
nloa
ded
by [
Uni
vers
itara
M E
min
eesc
u Ia
si]
at 0
7:30
29
Apr
il 20
13
400 0. ZHANG and P. A. LEWIN
0.8 0.8
5 . CONSTRUCTION AND TESTING
- vertical: normrlizadvalut
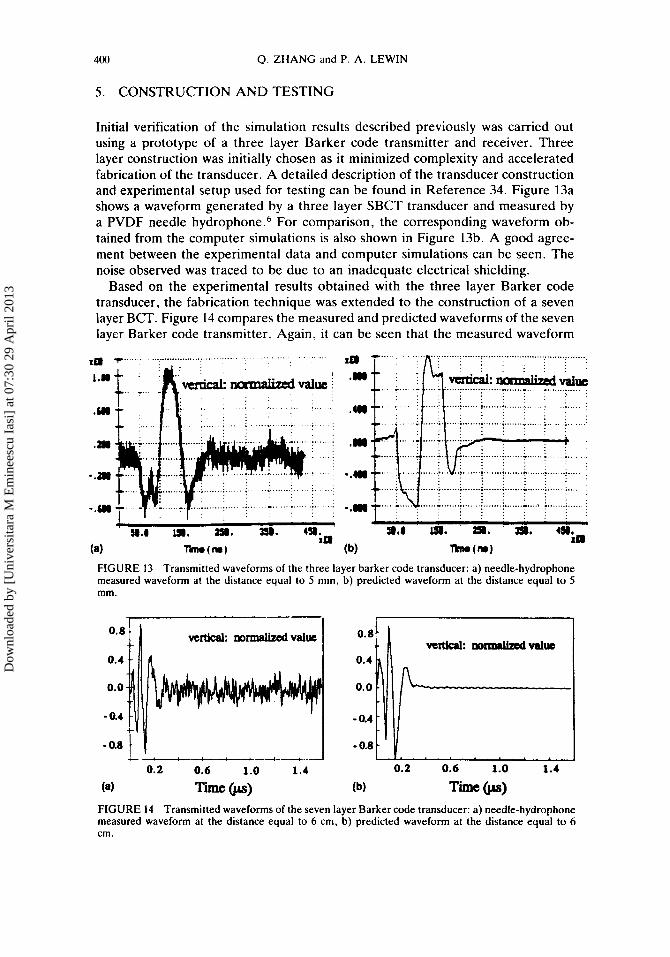
Initial verification of the simulation results described previously was carried out using a prototype of a three layer Barker code transmitter and receiver. Three layer construction was initially chosen as it minimized complexity and accelerated fabrication of the transducer. A detailed description of the transducer construction and experimental setup used for testing can be found in Reference 34. Figure 13a shows a waveform generated by a three layer SBCT transducer and measured by a PVDF needle hydrophone .6 For comparison, the corresponding waveform ob- tained from the computer simulations is also shown in Figure 13b. A good agree- ment between the experimental data and computer simulations can be seen. The noise observed was traced to be due to an inadequate electrical shielding.
Based on the experimental results obtained with the three layer Barker code transducer, the fabrication technique was extended to the construction of a seven layer BCT. Figure 14 compares the measured and predicted waveforms of the seven layer Barker code transmitter. Again, it can be seen that the measured waveform
- a4 - 0.4
- 0.8 -0.8 c... ' c
.... ................................ . ...... . . . . . . .
- -
FIGURE 13 Transmitted waveforms of the three layer barker code transducer: a) needle-hydrophone measured waveform at the distance equal to 5 mm, b) predicted waveform at the distance equal to 5 mm.
Dow
nloa
ded
by [
Uni
vers
itara
M E
min
eesc
u Ia
si]
at 0
7:30
29
Apr
il 20
13

PVDF TRANSDUCERS AND PROBES 401
is in a good agreement with the one predicted by the simulations. As mentioned previously, the noise observed is due to the inadequate electrical shielding.
In the next section, conclusions of this work are presented together with the suggestions for the future work.
6. DISCUSSION AND CONCLUSIONS
Practical applications of PVDF polymers in biomedical ultrasonics were presented. The applications discussed encompass both miniature hydrophone probes for sensing ultrasonic fields and a new generation of non-resonant pulse-echo imaging transducers. The miniature PVDF ultrasonic hydrophone probes are already well established in the ultrasonic exposimetry applications in the frequency range 1-20 MHz. However, the finite aperture of the hydrophone probes affects precision of the measurements due to the spatial averaging effects. At present, it appears that the minimization of these effects would require use of pressure sensors employing fiber optic techno log^.^^
The multilayer PVDF transducer structure discussed here represents a relatively new approach to the pulse-echo imaging transducer design. This non-resonant design provides exceptionally wide bandwidth and is suitable for operation at the clinically relevant frequencies. The design describes uses multiple active piezo- polymer layers arranged according to a Barker code pattern and was adapted for pulse-echo imaging. The operation principle of the switchable Barker code trans- ducer (SBCT) was outlined and the computer simulation results indicated that not only SBCT's pulse-echo sensitivity is on a par with that achievable with the resonant PZT or PZT composite transducer design but also the bandwidth achievable with SBCTs is twice as large as that exhibited by the conventional imaging scanheads. Also, it was demonstrated that the SBCT can be driven by virtually any excitation signal. In particular, the SBCT exhibits uniform pulse-echo response when driven by different frequencies of monocycle sine wave. This indicates that in comparison with the currently used imaging transducers, the SBCTs are more suitable for frequency tailored operation. Such operation allows a potential improvement in clinical diagnosis by optimizing image resolution at a given penetration depth. In addition, simulations which examined the influence of tissue layer showed that the SBCT would outperform the ceramic PZT transducer in terms of axial resolution and sensitivity. This is because the wide bandwidth of the SBCT would allow full reception of the downshifted acoustic spectrum.
To verify the computer simulation results, several three and seven layer Barker code transducers were fabricated and tested. The experimental results were found to be in good agreement with the theoretical predictions.
A high electrical impedance of the SBCT in the receive mode of the operation can be effectively addressed by placing a voltage follower in the immediate vicinity of the transducer. This voltage follower will convert high transducer impedance into 50 R output impedance to match that of the coaxial cable.
Once optimized, the non-resonant switchable Barker code transducers could provide an attractive alternative to the conventional resonant design of PZT ceramic or PZT composite scanheads. In particular, the availability of such non-resonant
Dow
nloa
ded
by [
Uni
vers
itara
M E
min
eesc
u Ia
si]
at 0
7:30
29
Apr
il 20
13

402 Q. ZHANG and P. A. LEWIN
wideband transducers would allow the image resolution and penetration depth to be tailored to the clinical needs, and thus provide a basis for the more accurate diagnosis.
ACKNOWLEDGEMENT
This work was supported in part by the NIH grant 2 PO1 CA52823-04Al.
REFERENCES
1. L. F. Brown, “New Developments in Ultrasonic Transducers and Transducer Systems,” Proc. of
2. M. D. Sherar and F. S. Foster, Ultrasonic Imaging, 11, 75-94 (1989). 3. M. D. Sherar, B. G. Starkoski, W. B. Taylor and F. S. Foster, Ultrasonic Imaging, 11, 95-105. 4. P. A. Lewin and M. E. Schafer, IEEE Ultrasonics Symposium, pp. 721-4, 1987. 5. P. A. Lewin and M. E. Schafer, IEEE Trans. UFFC, 35, 175-84 (1988). 6. P. A. Lewin, Ultrasonics, 19,213-6 (1981). 7. P. A. Lewin and M. E. Schafer. MD&DI, 40-5, 1986. 8. A. S. DeReggi, S. Edelman, S. C. Roth et al., J . Acoust. SOC. Am. , 61, S17 (1977). 9. G. R. Hams, IEEE Tram. Son. Ultrason., SU-29,370-7 (1982).
10. R. C. Preston, D. R. Bacon, A. J. Livett et al., 1. fhys. Sci. Instr., 16, 786-96 (1983). 11. Safety Standard for Diagnostic Ultrasound Equipment, AIUMNEMA Standard Publication UL-
12. The Characteristics and Calibration of Hydrophones for Operation in the Frequency Range 0.5-
13. S l q k ) Guide for Measuring and Reporting Acoustic Output of Diagnostic Ultrasound Devices,
14. P. A. Lewin and M. E. Schafer, J. Lithotripsy and Stone Direase, 3, 3-17 (1991). , 15. P. A. Lewin, J. M. Gilmore and M. E. Schafer, Proc. Ultrasonics International ’89,vpp. 548-53,
16. G. R. Hams and D. Shombert. IEEE Trans. Son. Ultrason., SU-32,802-8 (1985). 17. D. G. Shombert, S. W. Smith and G. R. Hams, Med. fhys . , 9, 484-92 (1982). 18. G. R. Hams, IEEE Tran. UFFC., 35,81-101 (1988). 19. K. Brendel and G. Ludwig, “Ultrasonic Exposimetry,” CRC Press, Inc., 1993, pp. 115-25. 20. M. E. Schafer, “Ultrasonic Exposimetry,” CRC Press, Inc., 1993, pp. 217-55. 21. P. A. Lewin and B. B. Goldberg, “Gynecology and Obstetrics,” J.B. Lippincott Co., 1989, pp.
22. P. A. Lewin, Proc. WFUMB 1985, Sydney, Australia, Pergamon Press, 1985, pp. 35. 23. S. Meeks and R. Ting, 1. Acorcst. SOC. Am., 74, 1010-2 (1984). 24. R. H. Tancrell, D. T. Wilson and D. Rickets, Proc. IEEE Ultrasonic Symposium, pp. 624-9,
25. C. M. W,Daft, T. A. Siddiqi, D. W. Fitting, R. A. Meyer and W. D. O’Brien, Jr,., IEEE Tram.,
26. P. A. Lewin and F. Jensen, Proc. Ultrasonics International ‘79, pp. 279-86, 1979. 27. H. L. W. Chan and K. S. Chiang, “Ultrasonic Exposimetry,” CRC Press, Inc., 1993, pp. 283-
28. R. C. Preston, IEEE Trans., UFFC-35, 122-39 (1988). 29. A. Platte, Ulfrasonics, 23, 113-8 (1985). 30. P. A. Lewin and A. S. DeReggi, “The Applications of Ferroelectric Polymers,” New York, The
31. P. A. Lewin. M. E. Schafer and R. C. Chivers, Ultrasound in Med. Biol.. 13, 141-8 (1987). 32. R. G. Swam and J. D. Plummer, IEEE Tram. on Sonia and Ultrasonics, SU-27,295-303 (1980). 33. M. R. Smith and A. K. Dunhill, IEEE Ultrasonics Symposium, 675-9 (1987). 34. P. A. Lewin, 0. Zhang and P. E. Bloomfield, “New Developments in Ultrasonic Transducers and
35. 0. Zhang and P. A. Lewin, Proc. Ultrasonics International ’93, pp. 427-30, 1993. 36. M. Platte. Acustica, 56, 29-33 (1984). 37. M. Platte, Ferroelecrrics, 75, 327-37 (1987). 38. S. W. Smith and R. L. Goldberg, Proc. Ultrasonics International ’93, pp. 117-20, 1993.
the S f I E , 1733, 27-36 (1992).
1-1981, Washington D.C., National Electrical Manufacturers. Association, 1981.
15 MHz. IEC Publication 866, 1985.
Washington, D.C., Food and Drug Administration, 1985.
1989.
1-14.
1985.
UFFc-37,501-5 (1990).
314.
Blackie Group Publishers, 1988, pp. 162-89.
Transducer Systems,” hoc. of the SPIE, Vol. 1733, pp. 297-306. 1992.
Dow
nloa
ded
by [
Uni
vers
itara
M E
min
eesc
u Ia
si]
at 0
7:30
29
Apr
il 20
13

PVDF TRANSDUCERS AND PROBES 403
39. K. M. Sung, Ultrasonics, 22, 61-8 (1984). 40. R. H. Barker, “Communication Theory,” Butterworth, London, 1953, pp. 273-87. 41. M. N. Cohen, “Principles of Modern Radar,” Van Nostrand Reinhold, New York. 1987, pp. 465-
42. G . S. DeSilets, J . D. Fraser and G. S. Kino, IEEE Trans. on Sonics and Ultrasonics, SU-25, 115- 501.
25 (1978).
Dow
nloa
ded
by [
Uni
vers
itara
M E
min
eesc
u Ia
si]
at 0
7:30
29
Apr
il 20
13