transcriptome and biomineralization responses of … and biomineralization responses of the pearl...
TRANSCRIPT
Transcriptome and biomineralization responses of the pearl
oyster Pinctada fucata to elevated CO2 and temperature
Shiguo Li1, Chuang Liu1,2, Jingliang Huang1, Yangjia Liu1, Shuwen Zhang1, Guilan Zheng1, Liping Xie1* &
Rongqing Zhang1*
1Institute of Marine Biotechnology, Collaborative Innovation Center of Deep Sea Biology, School of Life Sciences, Tsinghua University,
Beijing 100084, China, 2Tsinghua-Peking Joint Center for Life Sciences, School of Life Sciences, Tsinghua University, Beijing 100084, China.
*Corresponding authors:
Dr. Rongqing Zhang
Dr. Liping Xie
1
Methods
Liquid chromatography-tandem mass spectrometry (LC-MS/MS) A standard solution was prepared by dissolving the amino acid standards in acetonitrile. All the standards and other reagents were obtained from Sigma-
Aldrich (St. Louis, MO, USA, ≥99.99% purity). The stock standard mixture (10 μg mL-1) was prepared by diluting the standard solutions, from which the
calibration standards with a range of 5–2500 ng.mL-1 were prepared by serially diluting the mixture with acetonitrile.
The mantles from 10 pearl oysters in each tank were collected and pooled together to obtain one biological replicate. A homogeneous 1.0 g sample was
hydrolyzed by 6 M hydrochloric acid (HCl) at 110°C for 14 h. The hydrolysate was cooled to room temperature and HCl was added to obtain a total
volume of 10 mL. One mL of the hydrolysate was lyophilized, redissolved by 2.0 mL of 0.1 M HCl, and stored at 4°C until analysis. Before determination,
the sample was mixed for 3 min and centrifuged at 10,000 × g for 5 min at room temperature. The amino acid content was determined with a 1290
analytical HPLC system connected to a 6460 triple quadrupole mass spectrometer (LC-MS/MS, Agilent Technologies, Santa Clara, CA, USA). A 10-μL
sample was injected through an auto sampler. The separation was collected with a C18 column (Perkin-Elmer, 4.6 mm × 250 mm, 5 μm). The mobile phase
was composed of (A) acetonitrile and (B) acetic acid sodium acetate buffer (0.03 M sodium acetate, 0.15% triethylamine, pH 5.2). The column
temperature was 40°C and the determination wavelength was 360 nm. The equation obtained from the standard solutions was used for the sample analysis.
The results were presented as amino acids mg/g mantle ± SD.
Microarray experiment
Total RNA of the mantle samples that were collected from pearl oysters at 72 h in the two CO2 treatments (P78 and P75), the two temperature treatments
(T25 and T31) and the control were extracted using TRIZOL Reagent (Life technologies, Carlsbad, CA, US) following the manufacturer’s instructions and
further purified using the NucleoSpin RNA clean-up kit (Macherey-Nagel, Duren, Germany). The RNA samples were quantified by measuring absorbance
ratios using a ND-1000 spectrophotometer (NanoDrop Technologies, Wilmington, DE, USA) and electrophoresed on a 1.0% formaldehyde-denatured
agarose gel to determine their integrity. RNA labelling and microarray hybridization were conducted by the CapitalBio Corp (Beijing, China) following
2
the previously reported protocol 1. Dye-labeled cDNA was created using Cy3 dye (GE Healthcare Cat. No. PA53021), and then hybridized with the
microarray at 45 °C for 15 h. After hybridization, the slides were rinsed with washing solution (0.2% SDS, 2 × SSC) for 5 min at 42 °C and washed again
with washing solution (2 × SSC) for 5 min at room temperature. The dried slides were scanned using an Agilent G2565CA microarray scanner system
(Agilent technologies, Berkshire, UK). Agilent's Feature Extraction Software was used for the microarray image analyses in order to convert the image
signal into the digital signal. Signal intensity of each microarray was normalized using GeneSpring GX version 11.0.2 software (Agilent Technologies)
with the percentile shift method.
To validate the microarray results, a set of 14 unigenes were selected randomly in the microarray for real-time quantitative PCR (RT-qPCR) analyses.
Total RNA of the mantle samples was extracted using the protocol as described above. The RT-qPCR was performed with 1 μL of cDNA, 0.4 μM of each
primer and 2 × SYBR Green Master Mix using SYBR® Premix Ex Taq™ II (Takara, Japan) to obtain a total volume of 20 μL. All PCR reactions were run
as follows: 1 cycle of 95 °C for 30 s, 40 cycles of 95 °C for 5 s, 60 °C for 30 s, 1 cycle of 95 °C for 15 s, 60 °C for 1 min and 95 °C for 15 s. The
fluorescent products were detected using StepOnePlus™ Real-Time PCR system (Applied Biosystems, Foster, CA, US). The reference housekeeping gene
ACTIN 2 was used as the internal control and the 2−ΔΔCT method 3 was used to analyze the relative fold change in gene expression. The correlation
coefficients (R2) between the results of gene expression levels of microarray and RT-qPCR were calculated. Information regarding these unigenes, primers
and accession numbers in RT-qPCR is listed in Supplementary Table 1.
3
Supplementary tables
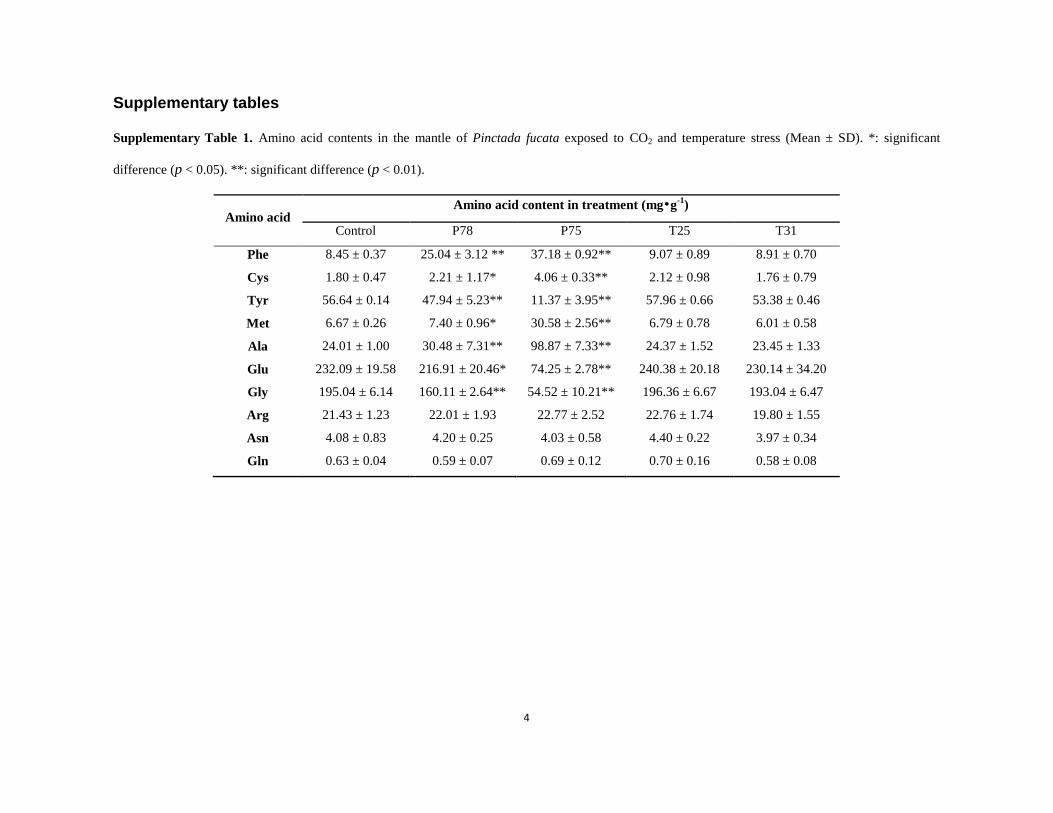
Supplementary Table 1. Amino acid contents in the mantle of Pinctada fucata exposed to CO2 and temperature stress (Mean ± SD). *: significant
difference (p < 0.05). **: significant difference (p < 0.01).
Amino acid Amino acid content in treatment (mg•g-1)
Control P78 P75 T25 T31
Phe 8.45 ± 0.37 25.04 ± 3.12 ** 37.18 ± 0.92** 9.07 ± 0.89 8.91 ± 0.70
Cys 1.80 ± 0.47 2.21 ± 1.17* 4.06 ± 0.33** 2.12 ± 0.98 1.76 ± 0.79
Tyr 56.64 ± 0.14 47.94 ± 5.23** 11.37 ± 3.95** 57.96 ± 0.66 53.38 ± 0.46
Met 6.67 ± 0.26 7.40 ± 0.96* 30.58 ± 2.56** 6.79 ± 0.78 6.01 ± 0.58
Ala 24.01 ± 1.00 30.48 ± 7.31** 98.87 ± 7.33** 24.37 ± 1.52 23.45 ± 1.33
Glu 232.09 ± 19.58 216.91 ± 20.46* 74.25 ± 2.78** 240.38 ± 20.18 230.14 ± 34.20
Gly 195.04 ± 6.14 160.11 ± 2.64** 54.52 ± 10.21** 196.36 ± 6.67 193.04 ± 6.47
Arg 21.43 ± 1.23 22.01 ± 1.93 22.77 ± 2.52 22.76 ± 1.74 19.80 ± 1.55
Asn 4.08 ± 0.83 4.20 ± 0.25 4.03 ± 0.58 4.40 ± 0.22 3.97 ± 0.34
Gln 0.63 ± 0.04 0.59 ± 0.07 0.69 ± 0.12 0.70 ± 0.16 0.58 ± 0.08
4
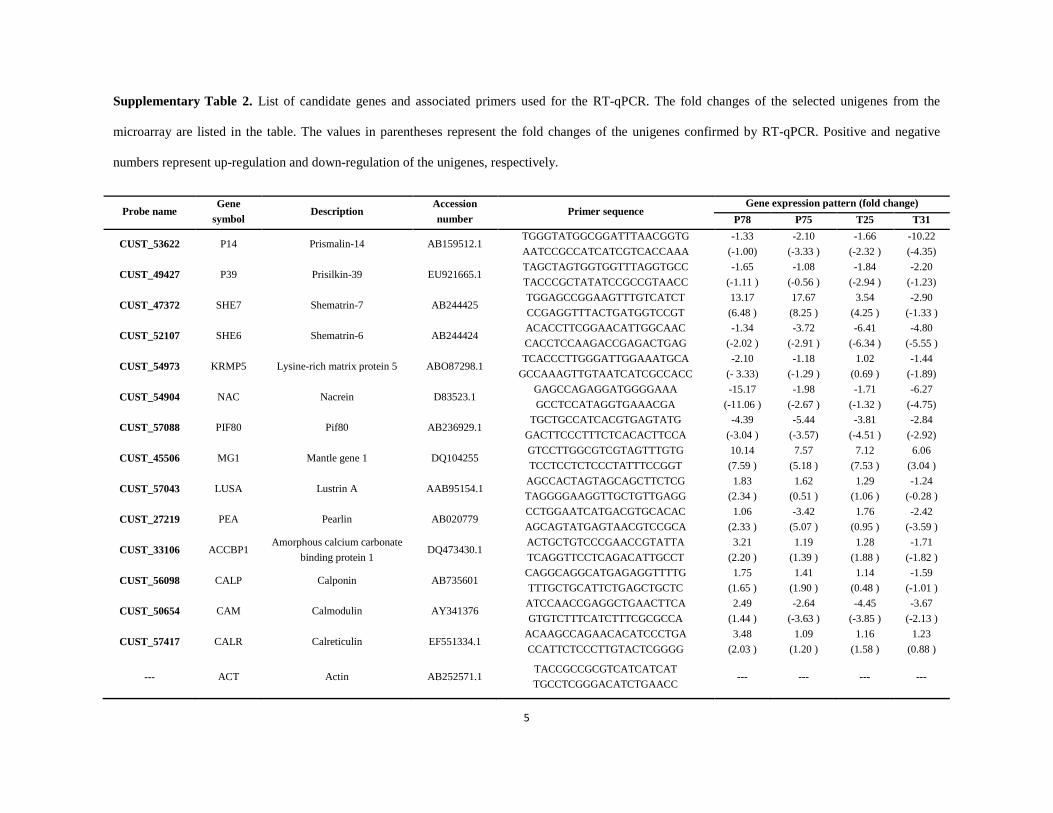
Supplementary Table 2. List of candidate genes and associated primers used for the RT-qPCR. The fold changes of the selected unigenes from the
microarray are listed in the table. The values in parentheses represent the fold changes of the unigenes confirmed by RT-qPCR. Positive and negative
numbers represent up-regulation and down-regulation of the unigenes, respectively.
Probe name Gene
symbol Description
Accession number
Primer sequence Gene expression pattern (fold change)
P78 P75 T25 T31
CUST_53622 P14 Prismalin-14 AB159512.1 TGGGTATGGCGGATTTAACGGTG AATCCGCCATCATCGTCACCAAA
-1.33 (-1.00)
-2.10 (-3.33 )
-1.66 (-2.32 )
-10.22 (-4.35)
CUST_49427 P39 Prisilkin-39 EU921665.1 TAGCTAGTGGTGGTTTAGGTGCC TACCCGCTATATCCGCCGTAACC
-1.65 (-1.11 )
-1.08 (-0.56 )
-1.84 (-2.94 )
-2.20 (-1.23)
CUST_47372 SHE7 Shematrin-7 AB244425 TGGAGCCGGAAGTTTGTCATCT CCGAGGTTTACTGATGGTCCGT
13.17 (6.48 )
17.67 (8.25 )
3.54 (4.25 )
-2.90 (-1.33 )
CUST_52107 SHE6 Shematrin-6 AB244424 ACACCTTCGGAACATTGGCAAC CACCTCCAAGACCGAGACTGAG
-1.34 (-2.02 )
-3.72 (-2.91 )
-6.41 (-6.34 )
-4.80 (-5.55 )
CUST_54973 KRMP5 Lysine-rich matrix protein 5 ABO87298.1 TCACCCTTGGGATTGGAAATGCA
GCCAAAGTTGTAATCATCGCCACC -2.10
(- 3.33) -1.18
(-1.29 ) 1.02
(0.69 ) -1.44
(-1.89)
CUST_54904 NAC Nacrein D83523.1 GAGCCAGAGGATGGGGAAA GCCTCCATAGGTGAAACGA
-15.17 (-11.06 )
-1.98 (-2.67 )
-1.71 (-1.32 )
-6.27 (-4.75)
CUST_57088 PIF80 Pif80 AB236929.1 TGCTGCCATCACGTGAGTATG
GACTTCCCTTTCTCACACTTCCA -4.39
(-3.04 ) -5.44
(-3.57) -3.81
(-4.51 ) -2.84
(-2.92)
CUST_45506 MG1 Mantle gene 1 DQ104255 GTCCTTGGCGTCGTAGTTTGTG TCCTCCTCTCCCTATTTCCGGT
10.14 (7.59 )
7.57 (5.18 )
7.12 (7.53 )
6.06 (3.04 )
CUST_57043 LUSA Lustrin A AAB95154.1 AGCCACTAGTAGCAGCTTCTCG TAGGGGAAGGTTGCTGTTGAGG
1.83 (2.34 )
1.62 (0.51 )
1.29 (1.06 )
-1.24 (-0.28 )
CUST_27219 PEA Pearlin AB020779 CCTGGAATCATGACGTGCACAC AGCAGTATGAGTAACGTCCGCA
1.06 (2.33 )
-3.42 (5.07 )
1.76 (0.95 )
-2.42 (-3.59 )
CUST_33106 ACCBP1 Amorphous calcium carbonate
binding protein 1 DQ473430.1
ACTGCTGTCCCGAACCGTATTA TCAGGTTCCTCAGACATTGCCT
3.21 (2.20 )
1.19 (1.39 )
1.28 (1.88 )
-1.71 (-1.82 )
CUST_56098 CALP Calponin AB735601 CAGGCAGGCATGAGAGGTTTTG TTTGCTGCATTCTGAGCTGCTC
1.75 (1.65 )
1.41 (1.90 )
1.14 (0.48 )
-1.59 (-1.01 )
CUST_50654 CAM Calmodulin AY341376 ATCCAACCGAGGCTGAACTTCA GTGTCTTTCATCTTTCGCGCCA
2.49 (1.44 )
-2.64 (-3.63 )
-4.45 (-3.85 )
-3.67 (-2.13 )
CUST_57417 CALR Calreticulin EF551334.1 ACAAGCCAGAACACATCCCTGA CCATTCTCCCTTGTACTCGGGG
3.48 (2.03 )
1.09 (1.20 )
1.16 (1.58 )
1.23 (0.88 )
--- ACT Actin AB252571.1 TACCGCCGCGTCATCATCAT TGCCTCGGGACATCTGAACC
--- --- --- ---
5
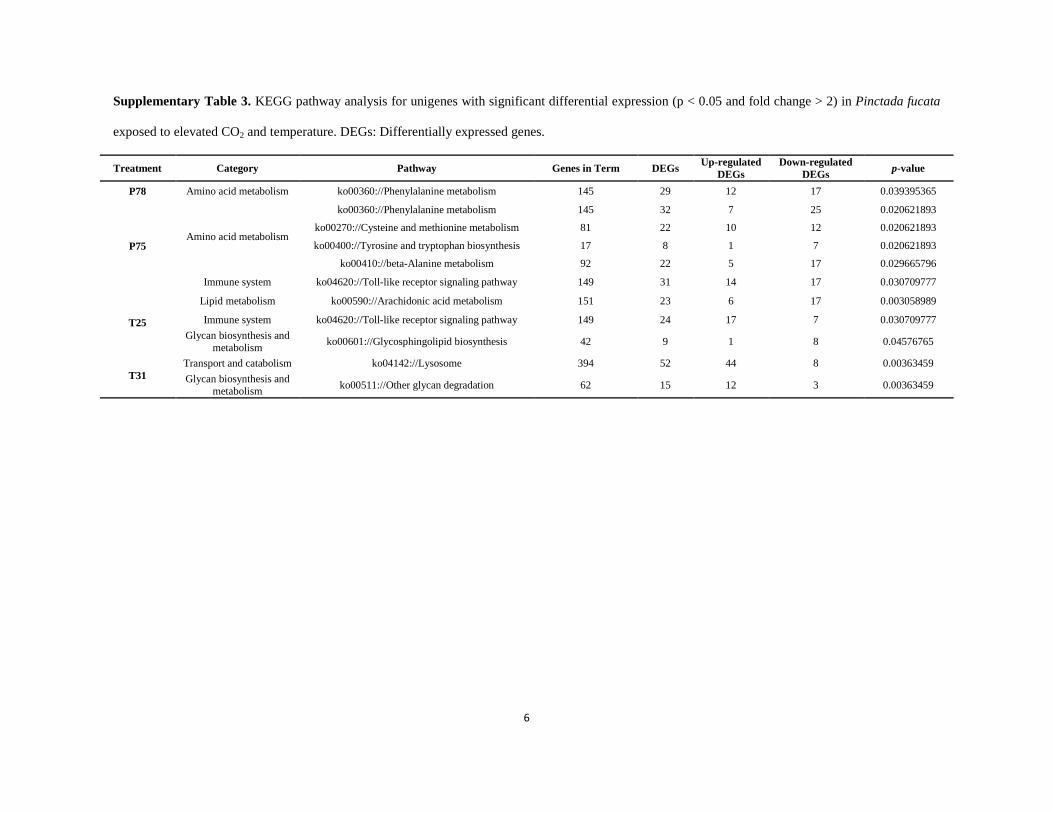
Supplementary Table 3. KEGG pathway analysis for unigenes with significant differential expression (p < 0.05 and fold change > 2) in Pinctada fucata
exposed to elevated CO2 and temperature. DEGs: Differentially expressed genes.
Treatment Category Pathway Genes in Term DEGs Up-regulated DEGs
Down-regulated DEGs p-value
P78 Amino acid metabolism ko00360://Phenylalanine metabolism 145 29 12 17 0.039395365
P75 Amino acid metabolism
ko00360://Phenylalanine metabolism 145 32 7 25 0.020621893
ko00270://Cysteine and methionine metabolism 81 22 10 12 0.020621893
ko00400://Tyrosine and tryptophan biosynthesis 17 8 1 7 0.020621893
ko00410://beta-Alanine metabolism 92 22 5 17 0.029665796
Immune system ko04620://Toll-like receptor signaling pathway 149 31 14 17 0.030709777
T25
Lipid metabolism ko00590://Arachidonic acid metabolism 151 23 6 17 0.003058989
Immune system ko04620://Toll-like receptor signaling pathway 149 24 17 7 0.030709777 Glycan biosynthesis and
metabolism ko00601://Glycosphingolipid biosynthesis 42 9 1 8 0.04576765
T31 Transport and catabolism ko04142://Lysosome 394 52 44 8 0.00363459 Glycan biosynthesis and
metabolism ko00511://Other glycan degradation 62 15 12 3 0.00363459
6

Supplementary Table 4. Fold changes in gene expressions of specific interest in Pinctada fucata exposed to elevated CO2 and temperature. The asterisk
indicates the genes that expressed no significant change (fold change < 2 or p > 0.05).
Category Probe Name Unigene Gene symbol Function-Description
Gene expression (fold change > 2 and p < 0.05)
P78 P75 T25 T31
Ion and acid-base regulation
CUST_18035_PI429347424 Unigene18045_TP V-ATPase V-type proton ATPase subunit E 1 7.27 6.25 * *
CUST_18034_PI429347424 Unigene18044_TP V-ATPase V-type proton ATPase subunit E 1 2.86 6.25 * *
CUST_39438_PI429347424 Unigene39466_TP V-ATPase V-type proton ATPase catalytic subunit A 2.87 3.21 * *
CUST_45016_PI429347424 Unigene45050_TP V-ATPase V-type proton ATPase 16 kDa proteolipid subunit * 2.60 * *
CUST_48645_PI429347424 Unigene48682_TP V-ATPase V-type proton ATPase subunit c 2.46 2.04 * *
CUST_50619_PI429347424 Unigene50658_TP V-ATPase V-type proton ATPase catalytic subunit A 3.15 2.65 * *
CUST_54425_PI429347424 Unigene54465_TP V-ATPase V-type proton ATPase subunit C 1-A 2.18 3.54 * *
CUST_55456_PI429347424 Unigene55496_TP V-ATPase V-type proton ATPase catalytic subunit A 3.46 7.21 * *
CUST_55635_PI429347424 Unigene55675_TP V-ATPase V-type proton ATPase 21 kDa proteolipid subunit 2.49 3.01 * *
CUST_56391_PI429347424 Unigene56431_TP V-ATPase V-type proton ATPase 16 k Da proteolipid subunit 2.18 2.42 * *
CUST_57255_PI429347424 Unigene57295_TP V-ATPase V-type proton ATPase subunit C 1-A * 2.20 * *
CUST_43429_PI429347424 Unigene43460_TP V-ATPase V-type proton ATPase subunit F 1 2.93 * * *
CUST_54640_PI429347424 Unigene54680_TP V-ATPase V-type proton ATPase subunit E 2.59 2.06 * *
CUST_55387_PI429347424 Unigene55427_TP V-ATPase V-type proton ATPase catalytic subunit A 3.01 * * 2.96
CUST_45926_PI429347424 Unigene45960_TP NKA Sodium/potassium-transporting ATPase subunit alpha 2.51 * * 2.48
CUST_21437_PI429347424 Unigene21452_TP NKA Sodium/potassium-transporting ATPase subunit alpha * * * 2.58
CUST_15255_PI429347424 Unigene15263_TP NHE5 Sodium/hydrogen exchanger 5 2.50 2.82 3.17 *
CUST_28238_PI429347424 Unigene28257_TP NHE3 Sodium/hydrogen exchanger 3 4.76 4.89 7.80 *
CUST_31582_PI429347424 Unigene31603_TP CLC Similar to CLC chloride channel 4.70 * * *
CUST_26096_PI429347424 Unigene26113_TP NCKX1 Similar to sodium/potassium/calcium exchanger 1 2.30 2.81 * *
CUST_4924_PI429347424 Unigene4926_TP NCKX1 Sodium/potassium/calcium exchanger 1 * 4.01 * *
CUST_35_PI429347424 Unigene35_TP NCKX6 Sodium/potassium/calcium exchanger 6 2.90 * * *
CUST_54840_PI429347424 Unigene54880_TP NBC1 Sodium bicarbonate cotransporter 1 * * * *
CUST_55044_PI429347424 Unigene55084_TP NBC3 Sodium bicarbonate cotransporter 3 * * * *
CUST_51999_PI429347424 Unigene52038_TP NBC1 Sodium bicarbonate cotransporter 1 * * * * 7
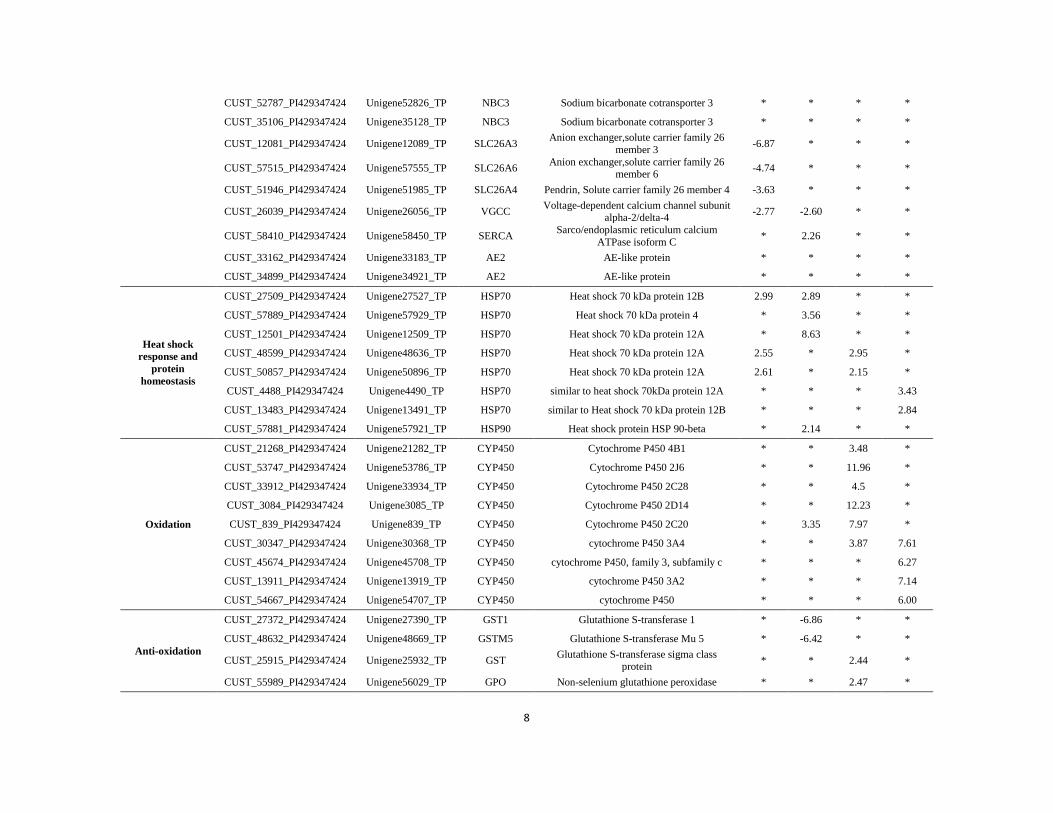
CUST_52787_PI429347424 Unigene52826_TP NBC3 Sodium bicarbonate cotransporter 3 * * * *
CUST_35106_PI429347424 Unigene35128_TP NBC3 Sodium bicarbonate cotransporter 3 * * * *
CUST_12081_PI429347424 Unigene12089_TP SLC26A3 Anion exchanger,solute carrier family 26 member 3 -6.87 * * *
CUST_57515_PI429347424 Unigene57555_TP SLC26A6 Anion exchanger,solute carrier family 26 member 6 -4.74 * * *
CUST_51946_PI429347424 Unigene51985_TP SLC26A4 Pendrin, Solute carrier family 26 member 4 -3.63 * * *
CUST_26039_PI429347424 Unigene26056_TP VGCC Voltage-dependent calcium channel subunit alpha-2/delta-4 -2.77 -2.60 * *
CUST_58410_PI429347424 Unigene58450_TP SERCA Sarco/endoplasmic reticulum calcium ATPase isoform C * 2.26 * *
CUST_33162_PI429347424 Unigene33183_TP AE2 AE-like protein * * * *
CUST_34899_PI429347424 Unigene34921_TP AE2 AE-like protein * * * *
Heat shock response and
protein homeostasis
CUST_27509_PI429347424 Unigene27527_TP HSP70 Heat shock 70 kDa protein 12B 2.99 2.89 * *
CUST_57889_PI429347424 Unigene57929_TP HSP70 Heat shock 70 kDa protein 4 * 3.56 * *
CUST_12501_PI429347424 Unigene12509_TP HSP70 Heat shock 70 kDa protein 12A * 8.63 * *
CUST_48599_PI429347424 Unigene48636_TP HSP70 Heat shock 70 kDa protein 12A 2.55 * 2.95 *
CUST_50857_PI429347424 Unigene50896_TP HSP70 Heat shock 70 kDa protein 12A 2.61 * 2.15 *
CUST_4488_PI429347424 Unigene4490_TP HSP70 similar to heat shock 70kDa protein 12A * * * 3.43
CUST_13483_PI429347424 Unigene13491_TP HSP70 similar to Heat shock 70 kDa protein 12B * * * 2.84
CUST_57881_PI429347424 Unigene57921_TP HSP90 Heat shock protein HSP 90-beta * 2.14 * *
Oxidation
CUST_21268_PI429347424 Unigene21282_TP CYP450 Cytochrome P450 4B1 * * 3.48 *
CUST_53747_PI429347424 Unigene53786_TP CYP450 Cytochrome P450 2J6 * * 11.96 *
CUST_33912_PI429347424 Unigene33934_TP CYP450 Cytochrome P450 2C28 * * 4.5 *
CUST_3084_PI429347424 Unigene3085_TP CYP450 Cytochrome P450 2D14 * * 12.23 *
CUST_839_PI429347424 Unigene839_TP CYP450 Cytochrome P450 2C20 * 3.35 7.97 *
CUST_30347_PI429347424 Unigene30368_TP CYP450 cytochrome P450 3A4 * * 3.87 7.61
CUST_45674_PI429347424 Unigene45708_TP CYP450 cytochrome P450, family 3, subfamily c * * * 6.27
CUST_13911_PI429347424 Unigene13919_TP CYP450 cytochrome P450 3A2 * * * 7.14
CUST_54667_PI429347424 Unigene54707_TP CYP450 cytochrome P450 * * * 6.00
Anti-oxidation
CUST_27372_PI429347424 Unigene27390_TP GST1 Glutathione S-transferase 1 * -6.86 * *
CUST_48632_PI429347424 Unigene48669_TP GSTM5 Glutathione S-transferase Mu 5 * -6.42 * *
CUST_25915_PI429347424 Unigene25932_TP GST Glutathione S-transferase sigma class protein * * 2.44 *
CUST_55989_PI429347424 Unigene56029_TP GPO Non-selenium glutathione peroxidase * * 2.47 *
8
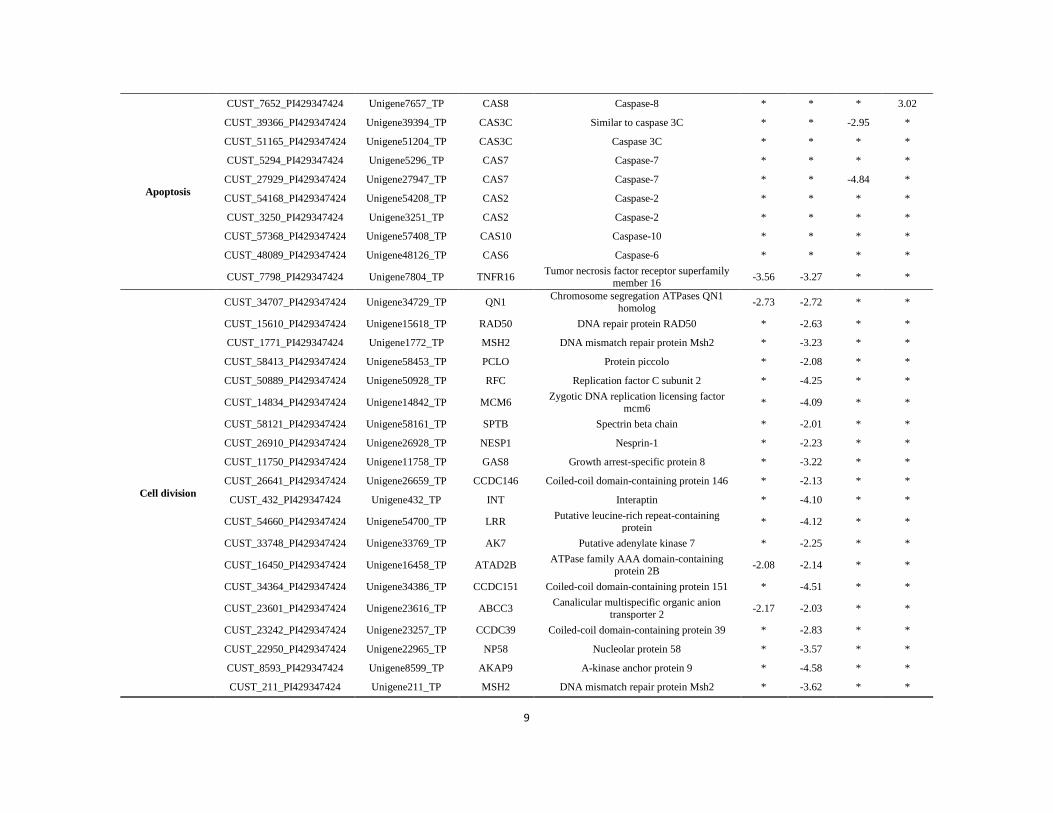
Apoptosis
CUST_7652_PI429347424 Unigene7657_TP CAS8 Caspase-8 * * * 3.02
CUST_39366_PI429347424 Unigene39394_TP CAS3C Similar to caspase 3C * * -2.95 *
CUST_51165_PI429347424 Unigene51204_TP CAS3C Caspase 3C * * * *
CUST_5294_PI429347424 Unigene5296_TP CAS7 Caspase-7 * * * *
CUST_27929_PI429347424 Unigene27947_TP CAS7 Caspase-7 * * -4.84 *
CUST_54168_PI429347424 Unigene54208_TP CAS2 Caspase-2 * * * *
CUST_3250_PI429347424 Unigene3251_TP CAS2 Caspase-2 * * * *
CUST_57368_PI429347424 Unigene57408_TP CAS10 Caspase-10 * * * *
CUST_48089_PI429347424 Unigene48126_TP CAS6 Caspase-6 * * * *
CUST_7798_PI429347424 Unigene7804_TP TNFR16 Tumor necrosis factor receptor superfamily member 16 -3.56 -3.27 * *
Cell division
CUST_34707_PI429347424 Unigene34729_TP QN1 Chromosome segregation ATPases QN1 homolog -2.73 -2.72 * *
CUST_15610_PI429347424 Unigene15618_TP RAD50 DNA repair protein RAD50 * -2.63 * *
CUST_1771_PI429347424 Unigene1772_TP MSH2 DNA mismatch repair protein Msh2 * -3.23 * *
CUST_58413_PI429347424 Unigene58453_TP PCLO Protein piccolo * -2.08 * *
CUST_50889_PI429347424 Unigene50928_TP RFC Replication factor C subunit 2 * -4.25 * *
CUST_14834_PI429347424 Unigene14842_TP MCM6 Zygotic DNA replication licensing factor mcm6 * -4.09 * *
CUST_58121_PI429347424 Unigene58161_TP SPTB Spectrin beta chain * -2.01 * *
CUST_26910_PI429347424 Unigene26928_TP NESP1 Nesprin-1 * -2.23 * *
CUST_11750_PI429347424 Unigene11758_TP GAS8 Growth arrest-specific protein 8 * -3.22 * *
CUST_26641_PI429347424 Unigene26659_TP CCDC146 Coiled-coil domain-containing protein 146 * -2.13 * *
CUST_432_PI429347424 Unigene432_TP INT Interaptin * -4.10 * *
CUST_54660_PI429347424 Unigene54700_TP LRR Putative leucine-rich repeat-containing protein * -4.12 * *
CUST_33748_PI429347424 Unigene33769_TP AK7 Putative adenylate kinase 7 * -2.25 * *
CUST_16450_PI429347424 Unigene16458_TP ATAD2B ATPase family AAA domain-containing protein 2B -2.08 -2.14 * *
CUST_34364_PI429347424 Unigene34386_TP CCDC151 Coiled-coil domain-containing protein 151 * -4.51 * *
CUST_23601_PI429347424 Unigene23616_TP ABCC3 Canalicular multispecific organic anion transporter 2 -2.17 -2.03 * *
CUST_23242_PI429347424 Unigene23257_TP CCDC39 Coiled-coil domain-containing protein 39 * -2.83 * *
CUST_22950_PI429347424 Unigene22965_TP NP58 Nucleolar protein 58 * -3.57 * *
CUST_8593_PI429347424 Unigene8599_TP AKAP9 A-kinase anchor protein 9 * -4.58 * *
CUST_211_PI429347424 Unigene211_TP MSH2 DNA mismatch repair protein Msh2 * -3.62 * *
9
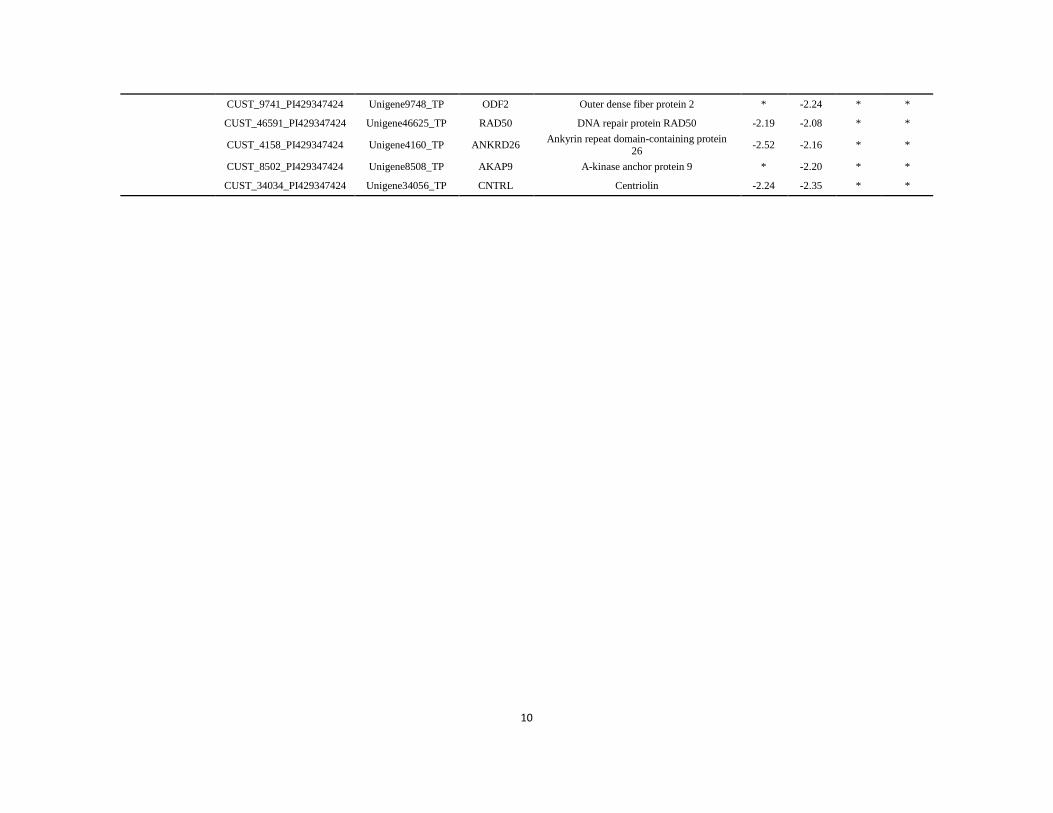
CUST_9741_PI429347424 Unigene9748_TP ODF2 Outer dense fiber protein 2 * -2.24 * *
CUST_46591_PI429347424 Unigene46625_TP RAD50 DNA repair protein RAD50 -2.19 -2.08 * *
CUST_4158_PI429347424 Unigene4160_TP ANKRD26 Ankyrin repeat domain-containing protein 26 -2.52 -2.16 * *
CUST_8502_PI429347424 Unigene8508_TP AKAP9 A-kinase anchor protein 9 * -2.20 * *
CUST_34034_PI429347424 Unigene34056_TP CNTRL Centriolin -2.24 -2.35 * *
10
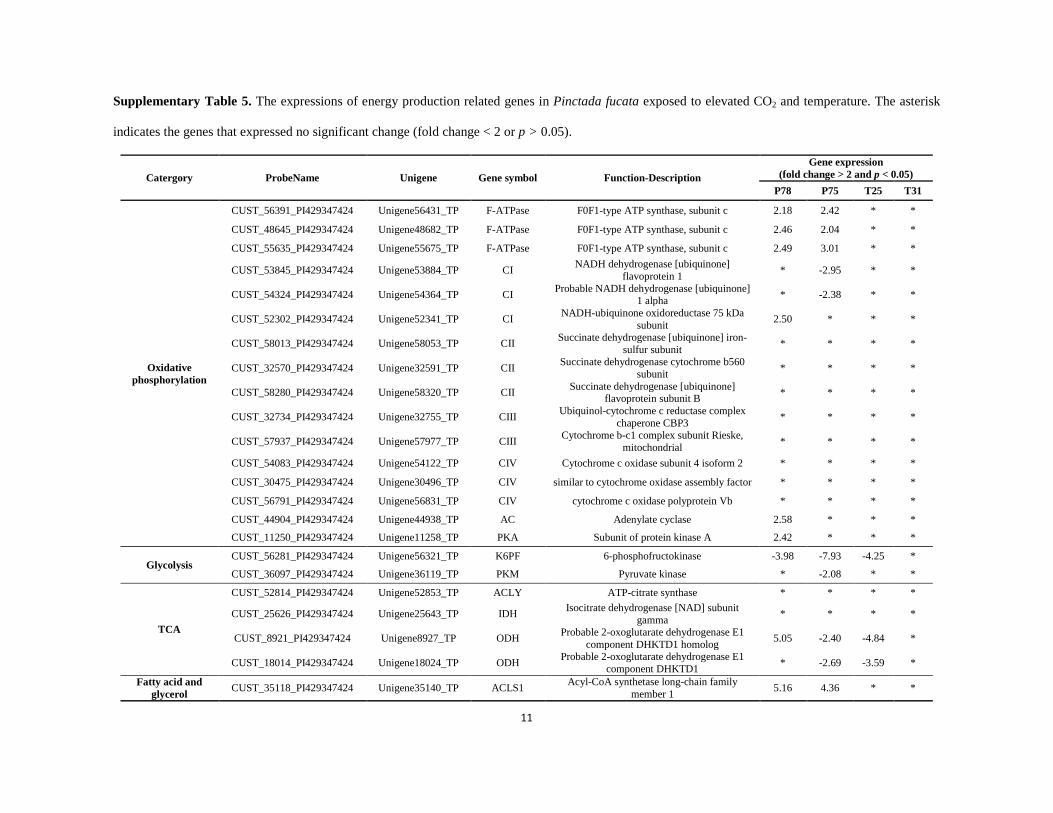
Supplementary Table 5. The expressions of energy production related genes in Pinctada fucata exposed to elevated CO2 and temperature. The asterisk
indicates the genes that expressed no significant change (fold change < 2 or p > 0.05).
Catergory ProbeName Unigene Gene symbol Function-Description Gene expression
(fold change > 2 and p < 0.05) P78 P75 T25 T31
Oxidative phosphorylation
CUST_56391_PI429347424 Unigene56431_TP F-ATPase F0F1-type ATP synthase, subunit c 2.18 2.42 * *
CUST_48645_PI429347424 Unigene48682_TP F-ATPase F0F1-type ATP synthase, subunit c 2.46 2.04 * *
CUST_55635_PI429347424 Unigene55675_TP F-ATPase F0F1-type ATP synthase, subunit c 2.49 3.01 * *
CUST_53845_PI429347424 Unigene53884_TP CI NADH dehydrogenase [ubiquinone] flavoprotein 1 * -2.95 * *
CUST_54324_PI429347424 Unigene54364_TP CI Probable NADH dehydrogenase [ubiquinone] 1 alpha * -2.38 * *
CUST_52302_PI429347424 Unigene52341_TP CI NADH-ubiquinone oxidoreductase 75 kDa subunit 2.50 * * *
CUST_58013_PI429347424 Unigene58053_TP CII Succinate dehydrogenase [ubiquinone] iron-sulfur subunit * * * *
CUST_32570_PI429347424 Unigene32591_TP CII Succinate dehydrogenase cytochrome b560 subunit * * * *
CUST_58280_PI429347424 Unigene58320_TP CII Succinate dehydrogenase [ubiquinone] flavoprotein subunit B * * * *
CUST_32734_PI429347424 Unigene32755_TP CIII Ubiquinol-cytochrome c reductase complex chaperone CBP3 * * * *
CUST_57937_PI429347424 Unigene57977_TP CIII Cytochrome b-c1 complex subunit Rieske, mitochondrial * * * *
CUST_54083_PI429347424 Unigene54122_TP CIV Cytochrome c oxidase subunit 4 isoform 2 * * * *
CUST_30475_PI429347424 Unigene30496_TP CIV similar to cytochrome oxidase assembly factor * * * *
CUST_56791_PI429347424 Unigene56831_TP CIV cytochrome c oxidase polyprotein Vb * * * *
CUST_44904_PI429347424 Unigene44938_TP AC Adenylate cyclase 2.58 * * *
CUST_11250_PI429347424 Unigene11258_TP PKA Subunit of protein kinase A 2.42 * * *
Glycolysis CUST_56281_PI429347424 Unigene56321_TP K6PF 6-phosphofructokinase -3.98 -7.93 -4.25 *
CUST_36097_PI429347424 Unigene36119_TP PKM Pyruvate kinase * -2.08 * *
TCA
CUST_52814_PI429347424 Unigene52853_TP ACLY ATP-citrate synthase * * * *
CUST_25626_PI429347424 Unigene25643_TP IDH Isocitrate dehydrogenase [NAD] subunit gamma * * * *
CUST_8921_PI429347424 Unigene8927_TP ODH Probable 2-oxoglutarate dehydrogenase E1 component DHKTD1 homolog 5.05 -2.40 -4.84 *
CUST_18014_PI429347424 Unigene18024_TP ODH Probable 2-oxoglutarate dehydrogenase E1 component DHKTD1 * -2.69 -3.59 *
Fatty acid and glycerol CUST_35118_PI429347424 Unigene35140_TP ACLS1 Acyl-CoA synthetase long-chain family
member 1 5.16 4.36 * *
11

metabolism CUST_27687_PI429347424 Unigene27705_TP ACO3 Acyl-coenzyme A oxidase 3/Acyl-CoA dehydrogenases 2.43 * * *
CUST_22524_PI429347424 Unigene22539_TP ACOX Palmitoyl-CoA oxidase 2.33 * * *
CUST_222_PI429347424 Unigene222_TP ACOX3 Pristanoyl acyl-Coenzyme A oxidase 3 2.53 * * *
CUST_24288_PI429347424 Unigene24304_TP LCAD Long-chain acyl-CoA dehydrogenase 3.24 * * *
CUST_37384_PI429347424 Unigene37408_TP GK Glycerol kinase -2.42 * * *
12
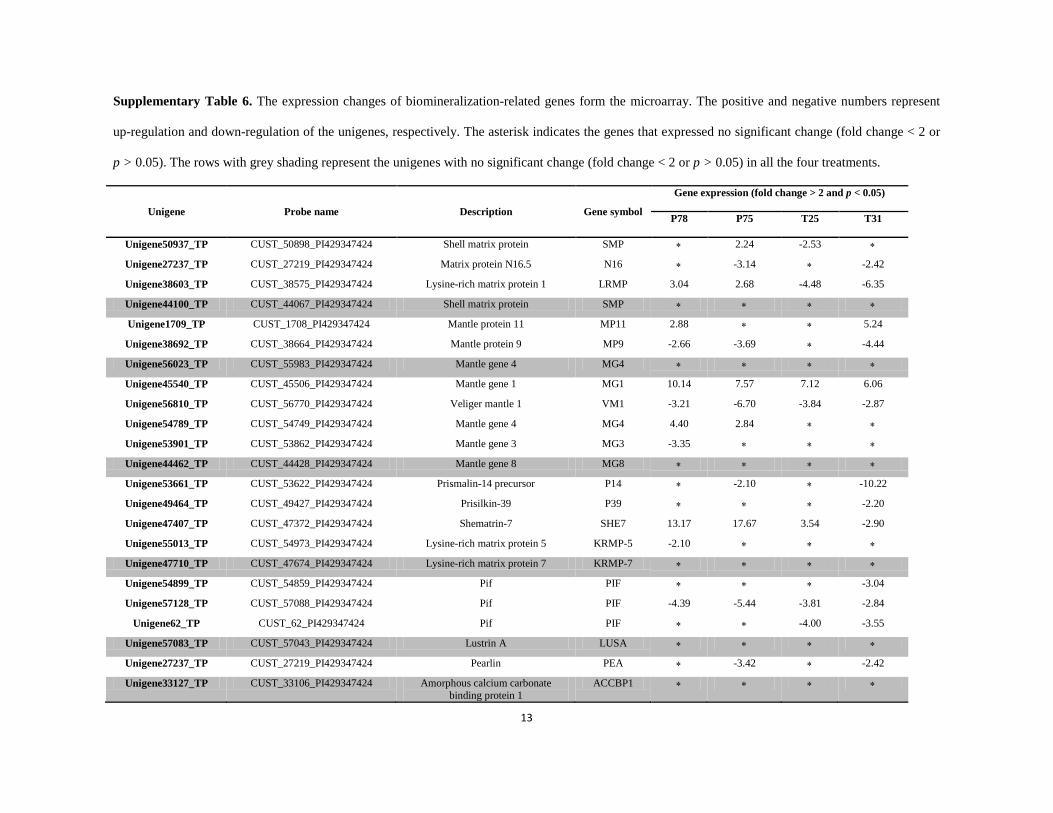
Supplementary Table 6. The expression changes of biomineralization-related genes form the microarray. The positive and negative numbers represent
up-regulation and down-regulation of the unigenes, respectively. The asterisk indicates the genes that expressed no significant change (fold change < 2 or
p > 0.05). The rows with grey shading represent the unigenes with no significant change (fold change < 2 or p > 0.05) in all the four treatments.
Unigene Probe name Description Gene symbol
Gene expression (fold change > 2 and p < 0.05)
P78 P75 T25 T31
Unigene50937_TP CUST_50898_PI429347424 Shell matrix protein SMP ∗ 2.24 -2.53 ∗
Unigene27237_TP CUST_27219_PI429347424 Matrix protein N16.5 N16 ∗ -3.14 ∗ -2.42
Unigene38603_TP CUST_38575_PI429347424 Lysine-rich matrix protein 1 LRMP 3.04 2.68 -4.48 -6.35
Unigene44100_TP CUST_44067_PI429347424 Shell matrix protein SMP ∗ ∗ ∗ ∗
Unigene1709_TP CUST_1708_PI429347424 Mantle protein 11 MP11 2.88 ∗ ∗ 5.24
Unigene38692_TP CUST_38664_PI429347424 Mantle protein 9 MP9 -2.66 -3.69 ∗ -4.44
Unigene56023_TP CUST_55983_PI429347424 Mantle gene 4 MG4 ∗ ∗ ∗ ∗
Unigene45540_TP CUST_45506_PI429347424 Mantle gene 1 MG1 10.14 7.57 7.12 6.06
Unigene56810_TP CUST_56770_PI429347424 Veliger mantle 1 VM1 -3.21 -6.70 -3.84 -2.87
Unigene54789_TP CUST_54749_PI429347424 Mantle gene 4 MG4 4.40 2.84 ∗ ∗
Unigene53901_TP CUST_53862_PI429347424 Mantle gene 3 MG3 -3.35 ∗ ∗ ∗
Unigene44462_TP CUST_44428_PI429347424 Mantle gene 8 MG8 ∗ ∗ ∗ ∗
Unigene53661_TP CUST_53622_PI429347424 Prismalin-14 precursor P14 ∗ -2.10 ∗ -10.22
Unigene49464_TP CUST_49427_PI429347424 Prisilkin-39 P39 ∗ ∗ ∗ -2.20
Unigene47407_TP CUST_47372_PI429347424 Shematrin-7 SHE7 13.17 17.67 3.54 -2.90
Unigene55013_TP CUST_54973_PI429347424 Lysine-rich matrix protein 5 KRMP-5 -2.10 ∗ ∗ ∗
Unigene47710_TP CUST_47674_PI429347424 Lysine-rich matrix protein 7 KRMP-7 ∗ ∗ ∗ ∗
Unigene54899_TP CUST_54859_PI429347424 Pif PIF ∗ ∗ ∗ -3.04
Unigene57128_TP CUST_57088_PI429347424 Pif PIF -4.39 -5.44 -3.81 -2.84
Unigene62_TP CUST_62_PI429347424 Pif PIF ∗ ∗ -4.00 -3.55
Unigene57083_TP CUST_57043_PI429347424 Lustrin A LUSA ∗ ∗ ∗ ∗
Unigene27237_TP CUST_27219_PI429347424 Pearlin PEA ∗ -3.42 ∗ -2.42
Unigene33127_TP CUST_33106_PI429347424 Amorphous calcium carbonate binding protein 1
ACCBP1 ∗ ∗ ∗ ∗
13

Unigene28008_TP CUST_27989_PI429347424 Calponin CALP ∗ -2.98 ∗ ∗
Unigene56138_TP CUST_56098_PI429347424 Calponin-like protein CALPL ∗ ∗ ∗ ∗
Unigene51236_TP CUST_51197_PI429347424 Calponin-like protein CALPL ∗ ∗ ∗ ∗
Unigene50693_TP CUST_50654_PI429347424 EF hand family protein EF ∗ -2.20 ∗ ∗
Unigene57457_TP CUST_57417_PI429347424 Calreticulin CALR 3.48 ∗ ∗ ∗
Unigene38419_TP CUST_38391_PI429347424 Tyrosinase TYR ∗ -7.04 -4.11 -9.97
Unigene57981_TP CUST_57941_PI429347424 Tyrosinase TYR ∗ -7.54 -3.69 -8.29
Unigene47447_TP CUST_47412_PI429347424 Tyrosinase TYR ∗ ∗ ∗ ∗
Unigene13528_TP CUST_13520_PI429347424 Tyrosinase TYR ∗ -29.87 -4.82 -5.09
Unigene31962_TP CUST_31941_PI429347424 Tyrosinase-like protein 1 TYRL1 2.43 2.81 ∗ ∗
Unigene11160_TP CUST_11152_PI429347424 Tyrosinase-like protein 1 TYRL1 2.77 3.62 ∗ ∗
Unigene58124_TP CUST_58084_PI429347424 Tyrosinase-like protein 2 TYRL2 4.51 3.54 ∗ ∗
Unigene7580_TP CUST_7575_PI429347424 Tyrosinase-like protein 2 TYRL2 ∗ ∗ ∗ 2.10
Unigene27084_TP CUST_27066_PI429347424 Shell protein 10 SP10 ∗ 8.12 2.55 ∗
Unigene47469_TP CUST_47434_PI429347424 Tyrosinase-like protein TYRL ∗ ∗ ∗ ∗
Unigene54944_TP CUST_54904_PI429347424 Nacrein NAC -15.17 ∗ -6.27 ∗
Unigene24820_TP CUST_24804_PI429347424 Shematrin-4 SHE4 13.29 4.51 -4.58 ∗
Unigene31_TP CUST_31_PI429347424 Shematrin-5 SHE5 ∗ -5.74 -11.28 -30.88
Unigene52146_TP CUST_52107_PI429347424 Shematrin-6 SHE6 ∗ -3.72 -6.41 -4.80
Unigene32248_TP CUST_32227_PI429347424 Alkaline phosphatase ALP -2.25 -3.27 ∗ -2.18
Unigene58009_TP CUST_57969_PI429347424 Carbonic anhydrase precursor CA -11.57 -27.34 ∗ ∗
Unigene56730_TP CUST_56690_PI429347424 Galectin GAL 2.18 2.89 ∗ ∗
Unigene57196_TP CUST_57165_PI429347424 Astacin-like prtein ASLP -2.01 -4.11 ∗ -2.54
Unigene58007_TP CUST_57967_PI429347424 Carbonic anhydrase 12 CA12 ∗ ∗ -4.31 -7.23
Unigene1622_TP CUST_1621_PI429347424 Chitin synthase CHS -19.52 -7.02 ∗ -5.58
Unigene47913_TP CUST_4791_PI429347424 Calcineurin A CALA -5.08 -11.84 -3.04 -4.60
Unigene50693_TP CUST_50654_PI429347424 Calmodulin CAM -2.49 -2.64 -4.45 -3.67
Unigene31411_TP CUST_31390_PI429347424 Calmodulin-2 CAM2 ∗ -2.01 ∗ ∗
Unigene29790_TP CUST_29769_PI429347424 Calmodulin-1b CAM1B ∗ -2.02 ∗ ∗
14
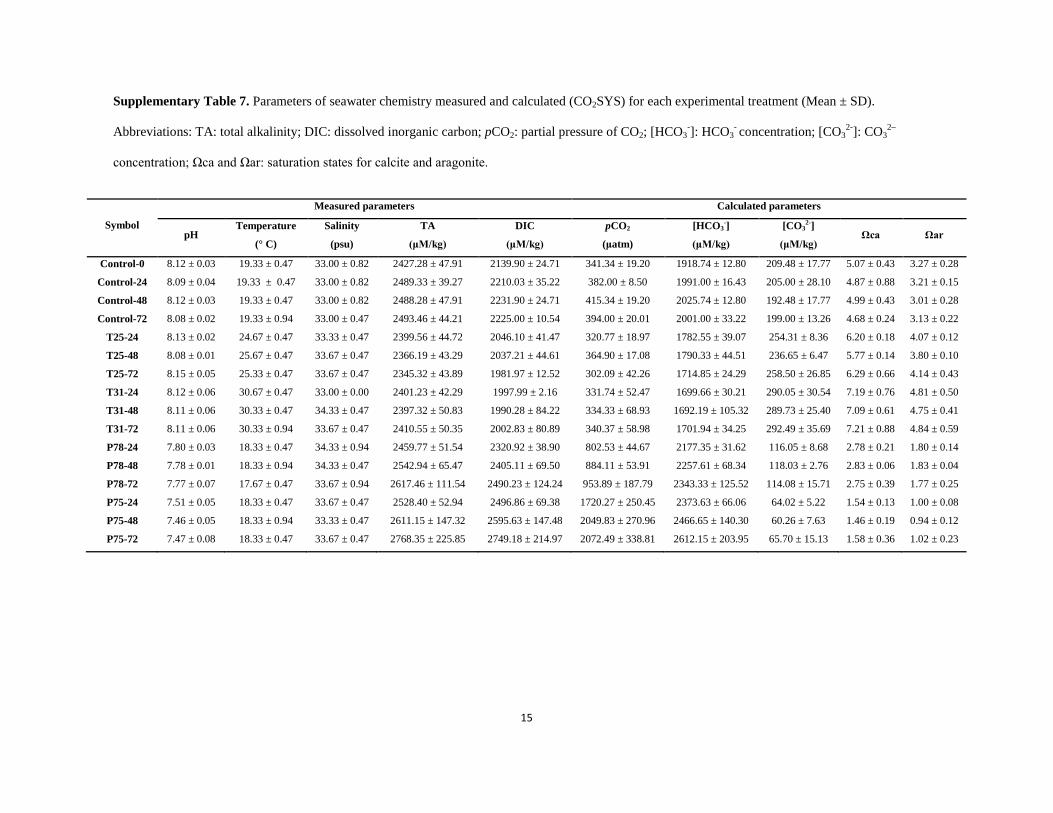
Supplementary Table 7. Parameters of seawater chemistry measured and calculated (CO2SYS) for each experimental treatment (Mean ± SD).
Abbreviations: TA: total alkalinity; DIC: dissolved inorganic carbon; pCO2: partial pressure of CO2; [HCO3-]: HCO3
- concentration; [CO32-]: CO3
2–
concentration; Ωca and Ωar: saturation states for calcite and aragonite.
Symbol
Measured parameters Calculated parameters
pH Temperature
(° C)
Salinity
(psu)
TA
(μM/kg)
DIC
(μM/kg)
pCO2
(μatm)
[HCO3-]
(μM/kg)
[CO32-]
(μM/kg) Ωca Ωar
Control-0 8.12 ± 0.03 19.33 ± 0.47 33.00 ± 0.82 2427.28 ± 47.91 2139.90 ± 24.71 341.34 ± 19.20 1918.74 ± 12.80 209.48 ± 17.77 5.07 ± 0.43 3.27 ± 0.28
Control-24 8.09 ± 0.04 19.33 ± 0.47 33.00 ± 0.82 2489.33 ± 39.27 2210.03 ± 35.22 382.00 ± 8.50 1991.00 ± 16.43 205.00 ± 28.10 4.87 ± 0.88 3.21 ± 0.15
Control-48 8.12 ± 0.03 19.33 ± 0.47 33.00 ± 0.82 2488.28 ± 47.91 2231.90 ± 24.71 415.34 ± 19.20 2025.74 ± 12.80 192.48 ± 17.77 4.99 ± 0.43 3.01 ± 0.28
Control-72 8.08 ± 0.02 19.33 ± 0.94 33.00 ± 0.47 2493.46 ± 44.21 2225.00 ± 10.54 394.00 ± 20.01 2001.00 ± 33.22 199.00 ± 13.26 4.68 ± 0.24 3.13 ± 0.22
T25-24 8.13 ± 0.02 24.67 ± 0.47 33.33 ± 0.47 2399.56 ± 44.72 2046.10 ± 41.47 320.77 ± 18.97 1782.55 ± 39.07 254.31 ± 8.36 6.20 ± 0.18 4.07 ± 0.12
T25-48 8.08 ± 0.01 25.67 ± 0.47 33.67 ± 0.47 2366.19 ± 43.29 2037.21 ± 44.61 364.90 ± 17.08 1790.33 ± 44.51 236.65 ± 6.47 5.77 ± 0.14 3.80 ± 0.10
T25-72 8.15 ± 0.05 25.33 ± 0.47 33.67 ± 0.47 2345.32 ± 43.89 1981.97 ± 12.52 302.09 ± 42.26 1714.85 ± 24.29 258.50 ± 26.85 6.29 ± 0.66 4.14 ± 0.43
T31-24 8.12 ± 0.06 30.67 ± 0.47 33.00 ± 0.00 2401.23 ± 42.29 1997.99 ± 2.16 331.74 ± 52.47 1699.66 ± 30.21 290.05 ± 30.54 7.19 ± 0.76 4.81 ± 0.50
T31-48 8.11 ± 0.06 30.33 ± 0.47 34.33 ± 0.47 2397.32 ± 50.83 1990.28 ± 84.22 334.33 ± 68.93 1692.19 ± 105.32 289.73 ± 25.40 7.09 ± 0.61 4.75 ± 0.41
T31-72 8.11 ± 0.06 30.33 ± 0.94 33.67 ± 0.47 2410.55 ± 50.35 2002.83 ± 80.89 340.37 ± 58.98 1701.94 ± 34.25 292.49 ± 35.69 7.21 ± 0.88 4.84 ± 0.59
P78-24 7.80 ± 0.03 18.33 ± 0.47 34.33 ± 0.94 2459.77 ± 51.54 2320.92 ± 38.90 802.53 ± 44.67 2177.35 ± 31.62 116.05 ± 8.68 2.78 ± 0.21 1.80 ± 0.14
P78-48 7.78 ± 0.01 18.33 ± 0.94 34.33 ± 0.47 2542.94 ± 65.47 2405.11 ± 69.50 884.11 ± 53.91 2257.61 ± 68.34 118.03 ± 2.76 2.83 ± 0.06 1.83 ± 0.04
P78-72 7.77 ± 0.07 17.67 ± 0.47 33.67 ± 0.94 2617.46 ± 111.54 2490.23 ± 124.24 953.89 ± 187.79 2343.33 ± 125.52 114.08 ± 15.71 2.75 ± 0.39 1.77 ± 0.25
P75-24 7.51 ± 0.05 18.33 ± 0.47 33.67 ± 0.47 2528.40 ± 52.94 2496.86 ± 69.38 1720.27 ± 250.45 2373.63 ± 66.06 64.02 ± 5.22 1.54 ± 0.13 1.00 ± 0.08
P75-48 7.46 ± 0.05 18.33 ± 0.94 33.33 ± 0.47 2611.15 ± 147.32 2595.63 ± 147.48 2049.83 ± 270.96 2466.65 ± 140.30 60.26 ± 7.63 1.46 ± 0.19 0.94 ± 0.12
P75-72 7.47 ± 0.08 18.33 ± 0.47 33.67 ± 0.47 2768.35 ± 225.85 2749.18 ± 214.97 2072.49 ± 338.81 2612.15 ± 203.95 65.70 ± 15.13 1.58 ± 0.36 1.02 ± 0.23
15
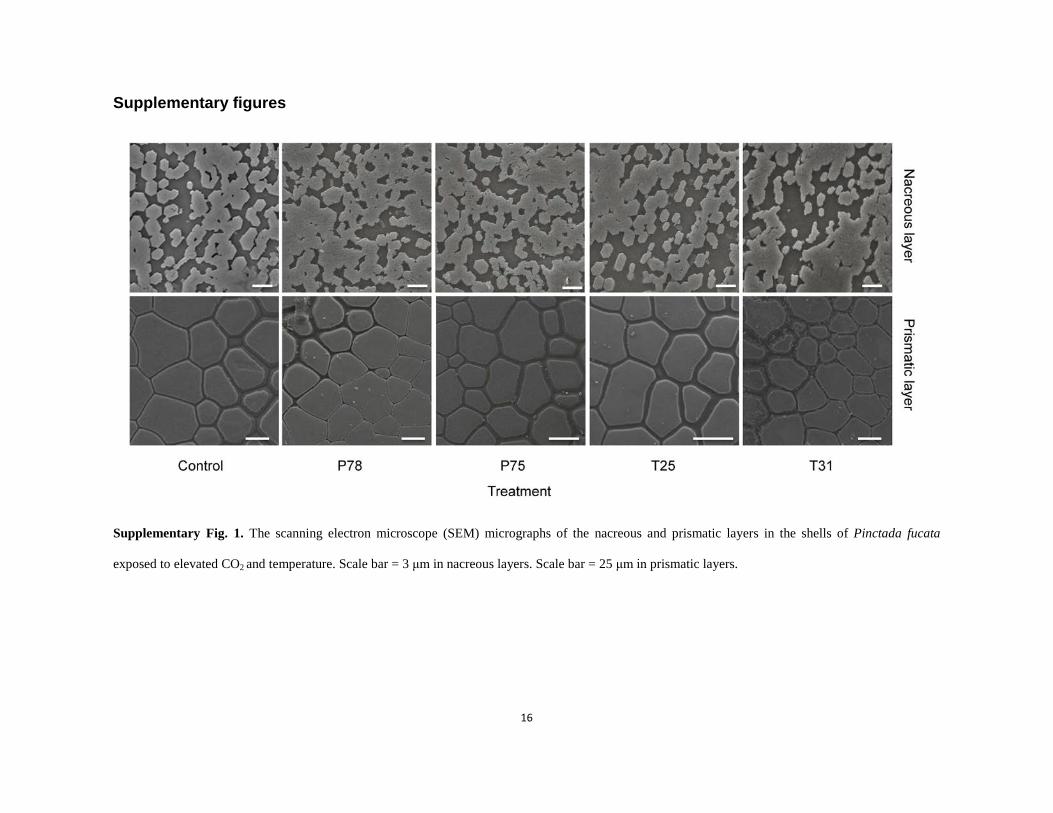
Supplementary figures
Supplementary Fig. 1. The scanning electron microscope (SEM) micrographs of the nacreous and prismatic layers in the shells of Pinctada fucata
exposed to elevated CO2 and temperature. Scale bar = 3 μm in nacreous layers. Scale bar = 25 μm in prismatic layers.
16
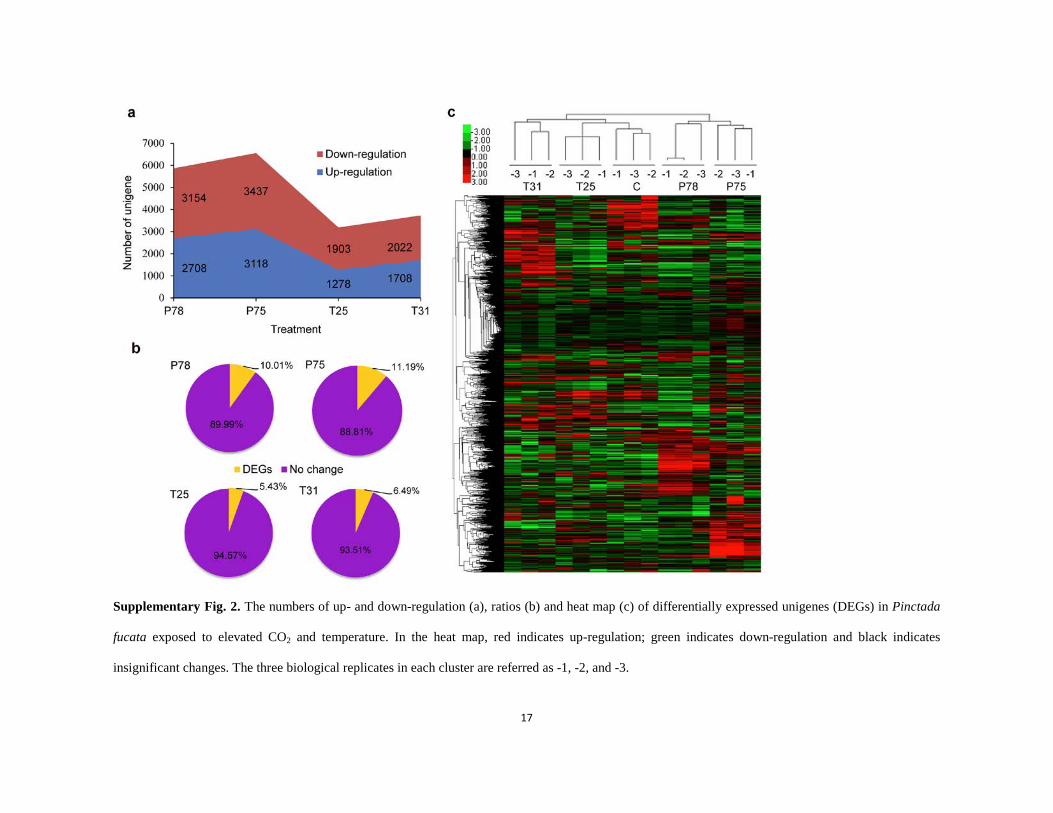
Supplementary Fig. 2. The numbers of up- and down-regulation (a), ratios (b) and heat map (c) of differentially expressed unigenes (DEGs) in Pinctada
fucata exposed to elevated CO2 and temperature. In the heat map, red indicates up-regulation; green indicates down-regulation and black indicates
insignificant changes. The three biological replicates in each cluster are referred as -1, -2, and -3.
17
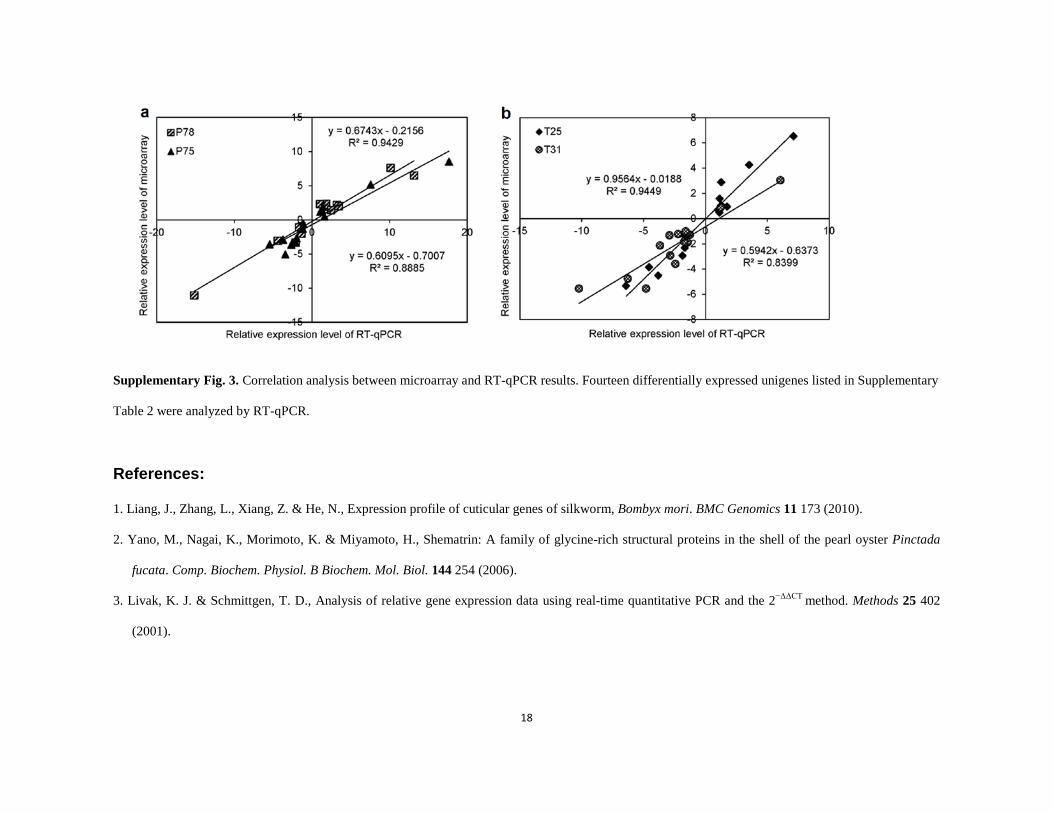
Supplementary Fig. 3. Correlation analysis between microarray and RT-qPCR results. Fourteen differentially expressed unigenes listed in Supplementary
Table 2 were analyzed by RT-qPCR.
References:
1. Liang, J., Zhang, L., Xiang, Z. & He, N., Expression profile of cuticular genes of silkworm, Bombyx mori. BMC Genomics 11 173 (2010).
2. Yano, M., Nagai, K., Morimoto, K. & Miyamoto, H., Shematrin: A family of glycine-rich structural proteins in the shell of the pearl oyster Pinctada
fucata. Comp. Biochem. Physiol. B Biochem. Mol. Biol. 144 254 (2006).
3. Livak, K. J. & Schmittgen, T. D., Analysis of relative gene expression data using real-time quantitative PCR and the 2−ΔΔCT method. Methods 25 402
(2001).
18