transcriptional changes induced by the tumor dormancy ... · in all dormant tumors analyzed....
TRANSCRIPT

www.landesbioscience.com Transcription 177
Transcription 4:4, 177–191; July/August 2013; © 2013 Landes Bioscience
RESEARCH PAPER RESEARCH PAPER
*Correspondence to: Nava Almog; Email: [email protected]: 04/04/13; Revised: 06/19/13; Accepted: 06/26/13http://dx.doi.org/10.4161/trns.25558
Introduction
Tumor dormancy often occurs early in cancer progression. In this stage, small cancerous lesions remain occult and asymptom-atic until they eventually switch to become fast-growing, clini-cally apparent and potentially lethal cancer. Dormant cancerous lesions are highly prevalent in the asymptomatic normal popula-tion1 and the majority of these lesions never progress to the stage of exponential tumor growth. This implies that dormant tumors rarely succeed in overcoming the inherent defense mechanisms against tumor development. Such mechanisms include the immune response of the host, hormonal control, signals from the extracellular matrix and microenvironment, induction of tumor cell quiescence, or the insufficiency of tumors to recruit new blood vessels.2-11 Of particular clinical importance are dormant clusters of tumor cells left after primary tumor removal or treat-ment that might contribute to tumor relapse and are often refrac-tory to cancer therapies.2 Although the dormant phase of tumor progression is a promising therapeutic target, it is still one of the most neglected areas in cancer research. This is mainly due to a lack of suitable experimental models and to limited clinical acces-sibility to dormant tumors.
We have successfully established in vivo models of human cancer in immunocompromised mice,12,13 which include breast carcinoma (MDA-MB-436), glioblastoma multiforme (GBM, T98G), osteosarcoma (KHOS-24OS) and liposarcoma (SW872)
Tumor dormancy is a highly prevalent stage in cancer progression. We have previously generated and characterized in vivo experimental models of human tumor dormancy in which micro-tumors remain occult until they spontaneously shift into rapid tumor growth. We showed that the dormant micro-tumors undergo a stable microRNA (miRNA) switch during their transition from dormancy to a fast-growing phenotype and reported the identification of a consensus signature of human tumor dormancy-associated miRNAs (DmiRs). MiRNA-190 (miR-190) is among the most upregulated DmiRs in all dormant tumors analyzed. Upregulation of miR-190 led to prolonged tumor dormancy in otherwise fast-growing glioblastomas and osteosarcomas. Here we investigate the transcriptional changes induced by miR-190 expression in cancer cells and show similar patterns of miR-190 mediated transcriptional reprogramming in both glioblastoma and osteosarcoma cells. The data suggests that miR-190 mediated effects rely on an extensive network of molecular changes in tumor cells and that miR-190 affects several transcriptional factors, tumor suppressor genes and interferon response pathways. The molecular mechanisms governing tumor dormancy described in this work may provide promising targets for early prevention of cancer and may lead to novel treatments to convert the malignant tumor phenotype into an asymptomatic dormant state.
Transcriptional changes induced by the tumor dormancy-associated microRNA-190
Nava Almog*, Christine Briggs, Afshin Beheshti, Lili Ma, Kathleen P. Wilkie, Edward Rietman and Lynn Hlatky
Center of Cancer Systems Biology; GeneSys Research Institute; Tufts University School of Medicine; Boston, MA USA
Keywords: tumor dormancy, microRNA, glioblastoma, osteosarcoma, transcriptional reprogramming
human tumor cell lines. In these models, micro-tumors remain dormant for a prolonged period of time until they spontaneously switch to the fast-growing angiogenic phenotype. Re-injection of cell lines that were generated from these ‘switched’ tumors into new mice results in fast-growing, angiogenic tumors exhibiting no dormancy lag time. For each tumor type, the dormant and the fast-growing tumors were shown to maintain their character-istics when cultured in vitro.12,13 Therefore, when grown in mice, dormant micro-tumors undergo a stable genetic ‘programming’ during their transition from dormancy to fast growth.14 Although the mechanisms triggering the switch of dormant tumors remain to be elucidated, pathways promoting tumor dormancy and the transcriptional switch of dormant tumors to the fast-growing phenotype were recently deciphered by genome-wide expression analysis.14
In a hierarchical manner, a single microRNA (miRNA) can regulate the expression level of multiple target genes and, as a result, act as a ‘master regulator’ of gene expression.15-17 MiRNAs are known to play critical roles in many physiological, as well as pathological processes, including cancer.18 We therefore aimed to characterize the ‘master regulators’ of tumor dormancy by pro-filing miRNA expression patterns in the in vivo models estab-lished in our lab. We reported the identification of a consensus miRNA signature that is uniquely expressed during tumor dor-mancy.19 A concerted shift in expression of miRNAs was found to correlate with the conversion of four dormant tumor types

178 Transcription Volume 4 Issue 4
bearing miR-190 overexpressing fast-growing glioblastomas and ‘naturally’ dormant glioblastomas13 remained asymptomatic for significantly prolonged periods of time as compared with mice bearing the control fast-growing glioblastoma cells. Therefore, the tumor dormancy effect of miR-190 expression on otherwise fast-growing glioblastoma is observed in both subcutaneous and intracranial injection sites.
To test possible dormancy inducing effects of miR-190 on other tumor cell lines (cell lines that were not used for the identification of dormancy-associated miRNAs), miR-190 was overexpressed in the glioblastoma U87-MG cell line. U87-MG cells were infected with viral particles containing the miR-190 expressing or control vector. Stable positive clones were selected and injected into mice. Overexpression of miR-190 in U87-MG cells significantly, but transiently, inhibited the growth of tumors (Fig. 1C). Tumors generated from U87-MG-miR-190 cells reached an average volume greater than 100 mm3 in 26 d, while tumors generated from the parental U87-MG or control cells reached that average volume in 10 d.
After 24 d, however, the tumors generated from U87-MG-miR-190 cells eventually ‘escaped’ from dormancy and grew as rapidly as tumors generated by the parental U87-MG and control cells (Fig. 1C). To better understand the molecular changes fol-lowing the ‘escape’ of U87-MG-miR-190 tumors from dormancy, we injected these cells into 4 new mice and collected the tumors 43 d after injection (Fig. 1D). We generated cell lines from these tumors (named U87–190–1, 2, 3 and 4), extracted RNA from the tumor cells and compared miR-190 levels in these cells to the level in the parental U87-MG and the original U87-MG-190 cells that were used for the injection. RT-PCR analysis revealed that miR-190 levels had significantly dropped in U87–190–1, 2, 3 and 4 as compared with the original U87-MG-190 cells that were used for the injection (Fig. 1D). This strongly suggests that the ‘escape’ of U87-MG-190 from dormancy is associated with the loss of miR-190 in the tumor cells.
Inhibition of tumor growth could result from blockage of cell proliferation. We therefore further investigated the possible effects of miR-190 on in vitro proliferation of both glioblastoma and osteosarcoma cells. An in vitro proliferation assay shows that miR-190 expression does not block tumor proliferation of either glioblastoma or osteosarcoma cells (Fig. 1E). Moreover, high prevalence of proliferating cells is evident in dormant micro-scopic tumors generated by glioblastoma (T98G) cells expressing miR-190 (Fig. 1F). Dormancy of miR-190-expressing tumors, therefore, is not associated with cell cycle blockage.
Identification of miR-190 downstream targets. MiRNAs are known to repress expression of downstream
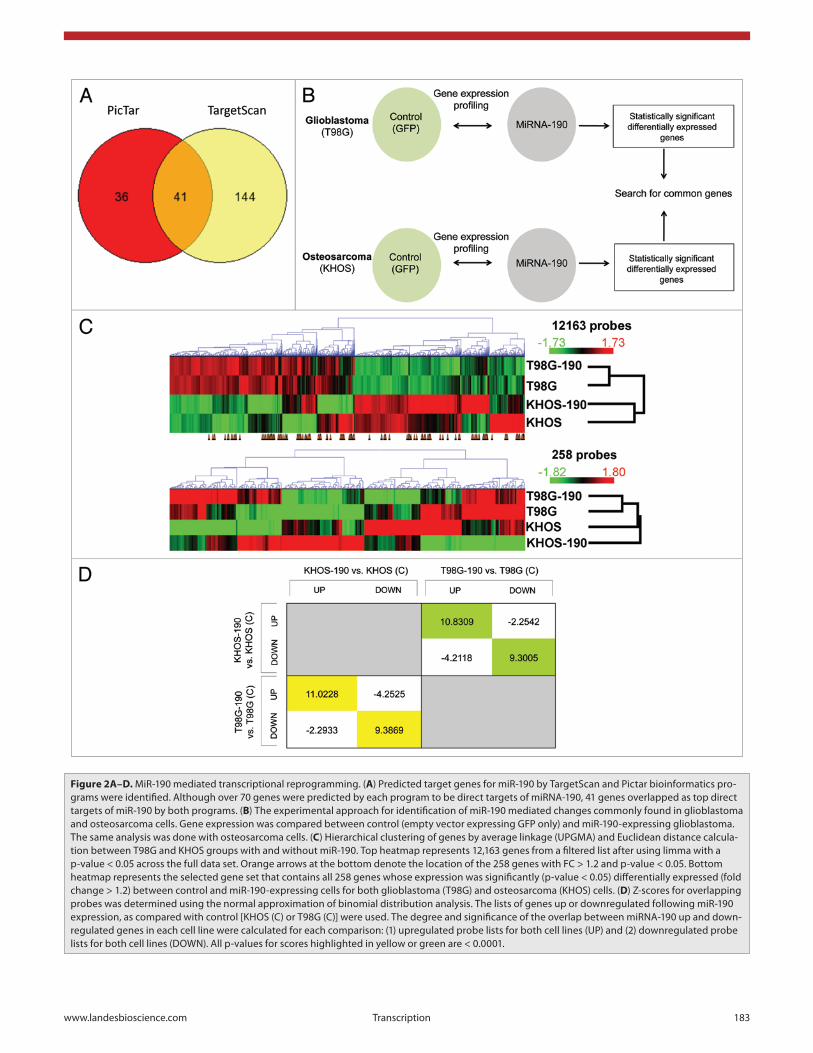
genes. Two bioinformatics programs were used to identify direct targets of miR-190: TargetScan and Pictar (Fig. 2A). 185 genes were predicted by TargetScan to have conserved binding sites for miR-190 or miR-190b, and 104 were predicted by PicTar. From these possible target genes, 41 were found as direct targets by both programs (Table 1). Out of these 41 genes, 9 genes encode for transcription factors (either activators or repressors: BACH2, CLOCK, FOXP2, HOXC5, NEUROD1, TCF4 and ZIC3) or for proteins that modulate transcription (BCL11A and EPC2).
to the fast-growing phenotype. Furthermore, we showed that the fast growing tumor phenotype could be reverted by recon-stituting a single tumor dormancy-associated miRNA (DmiR). Overexpression of miRNA-190, the most differentially regulated DmiR, led to inhibition of tumor growth and to prolonged dor-mancy periods in otherwise fast growing glioblastoma and osteo-sarcoma. Interestingly, expression of miR-190 has been shown to correlate with disease stage in glioma patients.19 To our knowledge, this was the first report on the intricate involvement of a single miRNA acting as a master regulator of human tumor dormancy.
The role of miR-190 in tumor biology is still unclear. Previous reports show that it is downregulated in neuroblastomas (NB) and that it is differentially expressed in high- vs. low-risk NB.20-22 These reports fit with our data showing upregulation of miR-190 in dormant vs. fast growing tumors. Here, we investigate the cel-lular and molecular effects mediated by miR-190 expression in tumor cells and focus on downstream transcriptional changes. We show that miR-190 does not affect cell proliferation rate in vitro, that miR-190-expressing glioblastoma or osteosarcoma cells form dormant micro-tumors and that miR-190 blocks intra-cranial glioblastoma progression. miR-190 expression results in similar transcriptional changes in both glioblastoma and osteo-sarcoma cells. These include changes of transcriptional factors and tumor suppressor gene levels, as well as changes in several interferon response pathways. This data may provide molecular clues to help address the unmet medical need to block tumor progression at an early stage and to develop novel early tumor dormancy biomarkers.
Results
Reconstitution of miR-190 in fast-growing tumors blocks tumor progression.
To functionally test the potential role of miR-190 in tumor dormancy, miR-190 was overexpressed in cells that form fast growing T98G glioblastomas and KHOS osteosarcomas. We have previously shown that overexpression of miR-190 in these fast-growing glioblastoma and osteosarcoma cell lines blocks tumor progression, induces dormancy,19 and as a result, leads to a clear reversal of the tumor phenotype. Glioblastoma and osteosarcoma tumors overexpressing miR-190 remained dormant and undetectable by gross examination for more than 120 d. Although the tumors remained occult, miR-190-expressing glio-blastoma and osteosarcoma cells maintained viability at the site of injection and formed asymptomatic micro-tumors (Fig. 1A). A dormant miR-190-expressing glioblastoma with a diameter of 1.3 mm was found 88 d following tumor cell injection. A dor-mant miR-190-expressing osteosarcoma was found at the site of injection with a diameter of 1.1 mm 125 d following injection. Dormancy of miR-190-expressing tumors is associated, there-fore, with persistence of tumors that remain at a microscopic size at the site of injection.
Inhibition of tumor growth was also observed when miR-190-expressing glioblastoma cells were injected orthotopically. Intracranial tumor growth of glioblastoma cells was monitored and analyzed as survival of tumor bearing mice (Fig. 1B). Mice

www.landesbioscience.com Transcription 179
upregulated genes in miR-190 KHOS and T98G than expected by chance (p-value < 0.0001). Similarly, in the lists of downregu-lated genes in both miR-190 expressing cell lines Z = 9.3869 and p-value < 0.0001, which suggests that there is more overlap than expected by chance amongst the downregulated genes of the two miR-190 expressing cell lines. A negative Z-score means there is less overlap than expected by chance.
Out of 47,264 probes on the Illumina chips, 5,221 probes (11%) had an absolute fold change value equal to or greater than 1.2 between control and miR-190-expressing cells in the glio-blastoma (2,628 probes downregulated and 2,593 probes upreg-ulated). In the osteosarcoma KHOS cells, 7,578 probes (16%) had an absolute value of fold change greater than or equal to 1.2 between control and miR-190-expressing cells (3,443 probes downregulated and 4,135 probes upregulated). Importantly, 258 probes with T-test nominal p-values of less than 0.05 were found to be differentially regulated (absolute value of fold change greater than or equal to 1.2) between control and miR-190-expressing cells in the same pattern (up or downregulated) in both the glio-blastoma and osteosarcoma cells Fig. 2C bottom heatmap). This
To identify genes whose transcription is affected by miR-190 expression, differences in gene expression profiles between control and miR-190-expressing cells were analyzed. Since the most pro-nounced effects of miR-190 were observed in glioblastoma and osteosarcoma tumors,19 we used these cells to search for miR-190 targets. We compared miR-190 gene expression profiles between control and miR-190-expressing cells in both glioblastomas and osteosarcomas cells (Fig. 2B). As expected, major transcriptional changes were observed between KHOS osteosarcoma and T98G glioblastoma cells. Only milder effects were observed following miR-190 expression in each tumor type (Fig. 2C).
We employed normal approximation of binomial distribu-tion analysis to compare miR-190 up and downregulated genes in both cell lines (Fig. 2D). Z-scores were calculated for overlap of genes. Each Z-score has a p-value indicating the probability of the observed Z-score by chance alone. A positive Z-score means bigger overlap than expected by chance. For example, the Z-score for genes common in both lists of upregulated (FC > 1.2) genes in miR-190 expressing KHOS and T98G (highlighted in yellow in the table) is 11.0228. Therefore, there is more overlap between the
Figure 1A–C. Overexpression of miR-190 reversed tumor phenotype. (A) Dormant tumors expressing miR-190. Representative H&E images of dormant miR-190-expressing glioblastoma (left panel) and osteosarcoma (right panel) 88 and 125 d post implantation, respectively. Scale bar represents 0.1 mm. (B) Kaplan Meier analysis of tumor-bearing mice survival. Three clones of human glioblastoma T98G were analyzed: the parental dormant T98G clone (blue line), fast growing glioblastoma infected with control (green line) or with miR-190 (red) vectors. A statistically significant difference (p-value = 0.0288) was observed between control (GFP) and miR-190-expressing tumors. (C) Tumor growth kinetics of U87-MG cells. Parental U87-MG (labeled in red line) n = 5, U87-MG cells infected with control GFP only viral vector (labeled in green line) n = 5, U87-MG cells infected with miR-190 viral vector (labeled in gray line) n = 5. Differences in average tumor size between miR-190- and GFP-expressing cells was statistically significant between days 17–28 (asterisk labels p-values < 0.05).

180 Transcription Volume 4 Issue 4
From these 244 genes, 138 were upregulated and 106 were downregulated. Table 2 includes the top 20 upregulated and top 20 downregulated genes (the greatest fold change between control and miR-190 expressing cells). Interestingly, three genes that are related to the major histocompatibility complex class I (HLA-F, HLA-H and HLA-A29.1) were found among the top downregu-lated genes. This could suggest that miR-190 expression is associ-ated with reduced antigen presentation to the immune system. Two different probes for the gene ETV4 were found as down-regulated. ETV4 encodes for a transcriptional activator known as
implies that these miR-190-induced changes in gene expression are not cancer type specific, but constitute a common phenom-enon occurring in both cancer types. Therefore, miR-190 expres-sion affected the gene expression level of about 0.5% (258 out of 47,264) of the probes present on the Illumina chip in a cancer type independent manner (changes that occurred in both cancer types). In cases where there were multiple probes for the same gene in this list of 258 probes, one probe was randomly selected and the others discarded from the list leaving 244 unique gene ID’s with FC > 1.2 and T-test nominal p-values < 0.05.
Figure 1D–F. Overexpression of miR-190 reversed tumor phenotype. (D) Tumor growth kinetics of U87-MG cells expressing miR-190 and real-time PCR analysis of miR-190 levels. MiR-190 levels were analyzed in U87-MiR-190 cell lines generated from four tumors (U87–190–1, U87–190–2, U87–190–3 and U87–190–4) that ‘escaped’ dormancy and compared with the level in the ‘parental’ U87–190 clone. (E) In vitro proliferation assay indicated that the dormancy promoting effect of miR-190 expression was not attributed to impaired proliferation kinetics of miR-190-expressing tumor cells in vitro. There were no statistically significant differences in growth rate kinetics of either osteosarcoma (KHOS cells, upper graph) or glioblastoma (T98G cells, lower graph) with or without control vector or miR-190-expressing vector. (F) In-vivo proliferation analysis of glioblastoma expressing miR-190. T98G glioblastoma cells expressing miR-190 were injected sub-cutaneously into SCID mice. Tumors were collected 88 d following injection. In-vivo prolifera-tion is evident following Ki-67 staining. Tumor diameter is 1.4 mm. Bar scale represents 0.1 mm.

www.landesbioscience.com Transcription 181
(GSEA) (www.broadinstitute.org/gsea) to search for the enrich-ment of groups of genes that share common biological function (pathways) in glioblastoma and osteosarcoma cells expressing
an oncoprotein. It belongs to the PEA3 subfamily of ETS tran-scription factors, is often found to be involved in chromosomal translocations, and may be implicated in tumorigenesis of many cancer types.23 Moreover, the collagen XVIII gene was among the 35 most upregulated genes. Endostatin, a known inhibitor of angiogenesis, is a naturally occurring 20-kDa C-terminal frag-ment derived from type XVIII collagen.24 Upregulation of colla-gen VXIII might imply, therefore, an increase in endostatin levels following miR-190 expression.
The 41 genes that were predicted as direct targets by the two bioinformatics programs (Fig. 2A) showed a partial downregula-tion or were below the background threshold of our expression analysis, suggesting only a modest difference in expression level.
Previously, we characterized the consensus gene expression signature of tumor dormancy.14 We identified genes that are specifically upregulated in all dormant tumors that were investi-gated. Since miR-190 expression induces tumor dormancy,19 we searched for tumor dormancy-associated genes that are upregu-lated following miR-190 expression. From the list of 244 genes that were significantly differentially regulated following miR-190 expression, 138 genes were upregulated (see above). From that list we found 3 genes that were previously found as dormancy-associ-ated (Table 3). The observation that these genes are upregulated in dormant tumors and following miR-190 expression in tumor cells strongly supports a possible role for miR-190 in the mainte-nance or regulation of tumor dormancy.
The changes in expression levels of miR-190 modulated genes were confirmed by RT-PCR (Figs. 2E and F). We focused on genes that were downregulated following miR-190 expression in both glioblastoma and osteosarcoma cells and that could affect a relatively large number of additional genes or the activity of their encoded proteins. For example, nuclear factor I/B (NFIB), which binds to DNA and acts as a transcription factor, was found to be downregulated following miR-190 expression in glioblastoma and osteosarcoma cell lines and is predicted to be a direct target of miR-190 by TargetScan. When analyzed by RT-PCR, miR-190 mediated effect on NFIB expression was evident not only in glioblastoma and osteosarcoma miR-190 tumor cells, but also in breast carcinoma (MDA-MB-436) and liposarcoma (SW872) miR-190-expressing cells (Fig. 2E). The most significant effect was seen in the miR-190-expressing glioblastoma cells. This further supports the observation that the effects of miR-190 are independent of cancer type.
Tax1 (human T-cell leukemia virus type I) binding protein 3 (TAX1BP3) may play a role in the Rho and Wnt signaling pathways and indirectly affects transcription of additional genes. This gene was found to be downregulated in dormant tumors of different tumor types.14 TAX1BP3 is also downregulated in dormant osteosarcoma, glioblastoma, breast carcinoma, and liposarcoma cells that express miR-190 (Fig. 2F). Therefore, repression of TAX1BP3 expression is associated with dormancy of micro-tumors.
Identification of biological pathways affected by miR-190 expression.
We next aimed to see which pathways are affected by miR-190 expression. To that end, we used Gene Set Enrichment Analysis
Table 1. Predicted direct targets of miR-190 shared by TargetScan and PicTar.
ARPC5 actin related protein 2/3 complex, subunit 5, 16 kDa
BACH2BTB and CNC homology 1, basic leucine zipper transcrip-
tion factor 2
BCL11A B-cell CLL/lymphoma 11A (zinc finger protein)
C20orf112 chromosome 20 open reading frame 112
CACNA1D calcium channel, voltage-dependent, L type, α 1D subunit
CALCR calcitonin receptor
CDH2 cadherin 2, type 1, N-cadherin (neuronal)
CHD7 chromodomain helicase DNA binding protein 7
CLOCK clock homolog (mouse)
DAG1 dystroglycan 1 (dystrophin-associated glycoprotein 1)
DMD dystrophin
EPC2 enhancer of polycomb homolog 2 (Drosophila)
FOXP2 forkhead box P2
GPHN gephyrin
HAS2 hyaluronan synthase 2
HECA headcase homolog (Drosophila)
HOXC5 homeobox C5
KCNA4potassium voltage-gated channel, shaker-related subfam-
ily, member 4
KCNQ5potassium voltage-gated channel, KQT-like subfamily,
member 5
KPNA4 karyopherin α 4 (importin α 3)
MYO5A myosin VA (heavy chain 12, myoxin)
NBEA neurobeachin. Lysosomal-trafficking regulator 2
NEUROD1 neurogenic differentiation 1
NLGN1 neuroligin 1
PANX2 pannexin 2
PAPOLG poly(A) polymerase gamma
PLCB4 phospholipase C, β 4
PPP3R1 protein phosphatase 3, regulatory subunit B, α
PTHLH parathyroid hormone-like hormone
SLITRK1 SLIT and NTRK-like family, member 1
STC1 stanniocalcin 1
STK35 serine/threonine kinase 35
SYNJ1 synaptojanin 1
TBC1D14 TBC1 domain family, member 14
TCF4 transcription factor 4
TP53INP1 tumor protein p53 inducible nuclear protein 1
TRPS1 trichorhinophalangeal syndrome I
WSB1 WD repeat and SOCS box containing 1
XPO1 exportin 1 (CRM1 homolog, yeast)
YTHDF3 YTH domain family, member 3
ZIC3 Zic family member 3

182 Transcription Volume 4 Issue 4
profile comparisons between control and miR-190-expressing glioblastoma and osteosarcoma (Fig. 2B) and using the Curated Gene Sets C2 collection provided by GSEA (which includes pathway databases, publications in PubMed, and knowledge of
miR-190. GSEA uses published information about biochemical pathways or co-expression in previous experiments and searches for statistical enrichment of such data sets in the given genome-wide mRNA expression profiles.25 Based on the gene expression
Table 2. Top 20 genes either up- or downregulated following miR-190 expression
T98G
190 vs. control
KHOS
190 vs. control
Target ID FC P-val FC P-val
TXNIP −1.46 0.0110 −13.66 1.39E−20 Thioredoxin-binding protein
HLA-F −1.30 0.0311 −2.33 5.57E−11 major histocompatibility complex, class I, F
PLLP −1.38 0.0463 −2.22 8.26E−11 plasmolipin. plasma membrane proteolipid
COL6A1 −1.36 0.0077 −2.12 3.69E−10 collagen, type VI, α 1
SLC15A3 −1.25 0.0415 −2.05 6.56E−10 solute carrier family 15, member 3
C7ORF59 −1.35 0.0119 −1.97 3.72E−09 chromosome 7 open reading frame 59
FHL1 −1.28 0.0354 −1.94 4.75E−09 four and a half LIM domains 1
HLA-H −1.41 0.0067 −1.94 2.95E−09 major histocompatibility complex, class I, H
LDLR −1.27 0.0200 −1.89 4.66E−09 low density lipoprotein receptor
ITPA −1.29 0.0245 −1.88 5.55E−09 inosine triphosphatase
PLIN2 −1.24 0.0454 −1.85 8.12E−09 perilipin 2
TUBG2 −1.32 0.0390 −1.83 1.29E−08 tubulin, gamma 2
ETV4 −1.29 0.0271 −1.82 2.27E−08 ets variant gene 4 (E1A enhancer-binding protein)
ETV4 −1.56 0.0005 −1.80 6.65E−08 ets variant gene 4 (E1A enhancer-binding protein)
TSPAN17 −1.23 0.0490 −1.80 3.33E−08 tetraspanin 17
MRPS26 −1.34 0.0186 −1.77 9.75E−08 mitochondrial ribosomal protein S26
HLA-A29.1 −1.38 0.0164 −1.74 3.39E−07 HLA-A29 (A29) is a leukocyte antigen serotype
SPATA20 −1.34 0.0076 −1.68 2.63E−07 spermatogenesis associated 20
MTX1 −1.40 0.0316 −1.66 3.17E−07 metaxin 1
PLIN2 −1.37 0.0066 −1.64 3.72E−07 perilipin 2
AMY1B 1.33 0.0407 1.68 3.01E−07 amylase, α 1B (salivary)
LOC100130516 1.42 0.0015 1.70 1.14E−07 hypothetical protein LOC100130516
CEP135 1.32 0.0145 1.73 7.08E−08 centrosomal protein 135 kDa
UAP1 1.31 0.0351 1.77 1.22E−07 UDP-N-acteylglucosamine pyrophosphorylase 1
CCDC99 1.32 0.0392 1.78 6.35E−06 coiled-coil domain containing 99
NAP1L1 1.52 0.0008 1.78 1.60E−07 nucleosome assembly protein 1-like 1
LOC645638 1.36 0.0175 1.83 3.54E−08 WDNM1-like pseudogene
NGF 1.35 0.0113 1.85 1.62E−08 nerve growth factor (β polypeptide)
PVRL3 1.32 0.0131 1.86 1.44E−08 poliovirus receptor-related 3
COL8A1 1.63 0.0060 1.91 7.03E−09 collagen, type VIII, α 1
SSFA2 1.29 0.0209 1.91 4.84E−08 sperm specific antigen 2.
TMEM47 1.49 0.0195 1.92 2.66E−09 transmembrane protein 47
AMY1A 1.51 0.0040 1.95 4.21E−09 amylase, α 1A (salivary)
TMSB15A 1.44 0.0107 2.00 1.34E−09 thymosin β 15a
C4ORF49 1.26 0.0498 2.14 2.24E−10 mitochondria-localized glutamic acid-rich protein
SNTB1 1.46 0.0148 2.21 1.42E−10 syntrophin, β 1
ALCAM 1.40 0.0078 2.26 8.33E−11 activated leukocyte cell adhesion molecule
SACS 1.31 0.0278 2.27 2.75E−08 spastic ataxia of Charlevoix-Saguenay (sacsin)
COL8A1 1.67 0.0004 2.94 1.97E−13 collagen, type VIII, α 1
OXTR 1.27 0.0257 3.09 3.67E−13 oxytocin receptor
www.landesbioscience.com Transcription 183
Figure 2A–D. MiR-190 mediated transcriptional reprogramming. (A) Predicted target genes for miR-190 by TargetScan and Pictar bioinformatics pro-grams were identified. Although over 70 genes were predicted by each program to be direct targets of miRNA-190, 41 genes overlapped as top direct targets of miR-190 by both programs. (B) The experimental approach for identification of miR-190 mediated changes commonly found in glioblastoma and osteosarcoma cells. Gene expression was compared between control (empty vector expressing GFP only) and miR-190-expressing glioblastoma. The same analysis was done with osteosarcoma cells. (C) Hierarchical clustering of genes by average linkage (UPGMA) and Euclidean distance calcula-tion between T98G and KHOS groups with and without miR-190. Top heatmap represents 12,163 genes from a filtered list after using limma with a p-value < 0.05 across the full data set. Orange arrows at the bottom denote the location of the 258 genes with FC > 1.2 and p-value < 0.05. Bottom heatmap represents the selected gene set that contains all 258 genes whose expression was significantly (p-value < 0.05) differentially expressed (fold change > 1.2) between control and miR-190-expressing cells for both glioblastoma (T98G) and osteosarcoma (KHOS) cells. (D) Z-scores for overlapping probes was determined using the normal approximation of binomial distribution analysis. The lists of genes up or downregulated following miR-190 expression, as compared with control [KHOS (C) or T98G (C)] were used. The degree and significance of the overlap between miRNA-190 up and down-regulated genes in each cell line were calculated for each comparison: (1) upregulated probe lists for both cell lines (UP) and (2) downregulated probe lists for both cell lines (DOWN). All p-values for scores highlighted in yellow or green are < 0.0001.

184 Transcription Volume 4 Issue 4
downregulated following miR-190 expression in either osteo-sarcoma (all with FDR < 0.05) or glioblastoma cells. We then searched for pathways that were downregulated in both miR-190-expressing osteosarcoma and glioblastoma cells. Nineteen pathways were downregulated following miR-190 expression in both cancer types. The pathways are listed in Table 4. Seven of the 19 (36.8%) pathways identified are associated with response
domain experts), we found several pathways that were downregu-lated in either miR-190-expressing glioblastoma or osteosarcoma. Importantly, the glioblastoma exhibited smaller changes in gene expression (fewer genes with FC > 1.2, t-test p-value < 0.05) than the osteosarcoma cell line and only a single geneset in the glioblas-toma cell line had an FDR < 0.05. We picked the top 100 path-ways (out of the 4850 gene sets in the C2 collection) that were
Figure 2E and F. MiR-190 mediated transcriptional reprogramming. (E, F) Differential expression of genes in miR-190-expressing tumor cells. Tran-scriptional changes observed using Illumina profiling in osteosarcoma and glioblastoma cells was verified for two representing genes and were shown to be common in additional tumor types. Expression levels of genes in control and in miR-190 overexpressing tumor cells were analyzed by RT-PCR. Expression in control was normalized according to expression in miR-190-expressing cells. Downregulation of nuclear factor I/B (NFIB) (E) and TAX1BP3 (F) was observed in glioblastoma, osteosarcoma, breast carcinoma and liposarcoma cells. Statistical significance was assessed using Student’s t-test. P value smaller than 0.05 was considered statistically significant: *** denotes p < 0.01, ** denotes p < 0.03 and * denotes p < 0.05.

www.landesbioscience.com Transcription 185
Identification of potential upstream regulators affected by miR-190 expression.
We next aimed to identify possible regulators whose activa-tion or repression could lead to the gene expression profile found following miR-190 expression. For this purpose we used the Ingenuity Pathway Analysis (IPA) (www.ingenuity.com/index.html) Upstream Regulator Analysis tool. An upstream regula-tor is defined as any molecule that affects the expression or func-tion of another molecule. This includes transcription regulators, growth factors, cytokines, enzymes, transmembrane receptors, and kinases. IPA Upstream Regulator Analysis uses expected causal effects calculated from the empirical gene expression data com-piled in large gene expression profile analyses and correlates with a comprehensive database of known upstream regulators compiled from the literature. The activation state of each upstream regulator culled from the experimental data set is determined by calculat-ing the activation z-score. For z-scores ≥ 2, the activation state of the upstream regulator is predicted to be activated and for z-scores ≤ −2, the activation state is predicted to be inhibited.
IPA Upstream Regulator Analysis found that the expression pattern of the 244 genes differentially regulated between miR-190-expressing and control osteosarcoma and glioblastoma cells could result from repression of 6 (Table 6, negative Z-score), or activation of 2 (Table 6, positive Z-score), upstream regulators. The upstream regulators found in this analysis, or their direct targets, could be indirectly affected by miR-190 expression. For example, activation of upstream regulators following miR-190 expression could result from miR-190 mediated inhibition of a repressor of these regulators.
Interestingly, 3 out of 6 (50%) regulators that are predicted to be inhibited are associated with interferon pathways (labeled in bold in Table 6). These include: IFNG (interferon, gamma), IFNA2 (interferon, α 2) and IL6 (interleukin 6, interferon, β 2). A network map of the predicted interferons with the genes used to make the predictions from the filtered 244 genes is presented in Figure 3C. These results are consistent with our findings through GSEA, showing an enrichment of interferon response pathways following miR-190 expression (Table 4).
Discussion
We report here the identification of cellular and molecular effects mediated by the tumor dormancy-inducing miR-190. In our previous study, miR-190 was found to be consistently and spe-cifically upregulated in dormant tumors. Overexpression of miR-190 in otherwise fast-growing tumors resulted in inhibition of tumor progression and induction of dormancy. It is intriguing that overexpression of a single miRNA was sufficient to achieve such effects. We found that in vitro tumor cell proliferation was
to interferon (INF). These include INF-inducible genes upregu-lated in (1) lung cancer cells infected with RSV that had their NS1 gene knocked down by RNAi, (2) skin tumors treated with Imiquimod (an immune response modifier), (3) five primary endothelial cell types, (4) primary hepatocytes and Hep3B cells, (5) osteosarcoma cells upon ectopic expression of ILF3 (about 50% are known interferon α/β-stimulated genes), (6) HT1080 cells fibrosarcoma and (7) primary fibroblast culture.
Other pathways downregulated by miR-190 expression were associated with tumor cell biology, including: (1) genes involved in response to radiation in MCF7 (breast), DU145 (prostate), and SF539 (gliosarcoma) cells; (2) genes upregulated in pancre-atic cancer cell lines (AsPC1, Hs766T, MiaPaCa2, Panc1) but not in the non-neoplastic cells (HPDE) by TSA (deacetylase inhibi-tor trichostatin A); (3) genes within amplicon 7p22 identified in a copy number alterations study of 191 breast tumor samples; (4) genes upregulated in hepatocellular carcinoma of ACOX1 knockout mice and (5) downregulated genes in hepatocellular carcinoma (HCC) subclass G3.
An additional group of pathways downregulated by miR-190 expression is related to the immune system and includes gene sets of the following pathways: (1) graft- vs. -host disease, (2) antigen processing and presentation and (3) allograft rejection.
Not all the genes that are included in the gene sets identified using GSEA are necessarily found as differentially regulated in the arrays studied. Based on the GSEA results for each cell line, Leading Edge (LE) analysis was used to extract a list of genes that contributed to the enrichment scores for the 19 GSEA gene sets we selected. This produced a list of 244 genes that were downregulated following miR-190 in the osteosarcoma cells and a list of 398 genes downregulated in the glioblastoma cells (Fig. 3A).
Since the subset of genes identified by Leading-Edge analysis can be interpreted as the core of a gene set (or pathway) that accounts for the enrichment signal,25 we then searched for genes that appear in both the glioblastoma and the osteosarcoma Leading Edge gene lists. We found 102 genes that were downregulated following miR-190 expression in both cancer types (Fig. 3A). Since several response-to-interferon pathways were identified as shared by both cancer types, we aimed to identify the genes in these pathways that contribute to the significance of enrichment. To this end, we com-bined all genes in the seven response-to-interferon pathways (from Table 4) and searched for genes that were identified by Leading Edge analysis as major contributors to the pathway enrichment (Fig. 3B). Between the 203 genes belonging to the response-to-interferon pathways and the 102 genes identified by the Leading Edge analysis (Fig. 3A), 30 genes were found on both lists. These genes, therefore, are the significant contributors to the enrichment of response-to-interferon pathways following miR-190 expression and are downregulated following miR-190 expression in both can-cer types. The genes are listed in Table 5. Several of these genes encode for proteins that: (1) affect the immune system in general and the presentation of antigens in particular (HLAs, CX3CL1, IFITM1, IL6 and TRAFD1), (2) affect transcription of other genes (CALR, IFI16, IRF1 and IRF7) and (3) are involved in induction of apoptosis (CASP1, IFI6, IFITM2 and OAS1).
Table 3. Tumor dormancy-associated genes which are upregulated fol-lowing miR-190 expression.
CBLB Cbl proto-oncogene, E3 ubiquitin protein ligase B
PDCD4 Programmed cell death 4 (neoplastic transformation inhibitor)
SNTB1 Syntrophin, β 1.

186 Transcription Volume 4 Issue 4
low-risk NB and to be associated with clinical cases without fea-tures of aggressive NB and high survival outcomes.20,22,29 miR-190 was also found to be downregulated in rectal cancer tissue compared with normal mucosa.30 These observations fit with our data showing an elevated miR-190 expression in dormant and non-aggressive tumors from various cancer types.
Trivalent arsenic (As31), an established human carcinogen, was recently found as a potent inducer of miR-190 expression in human bronchial epithelial cells.31 miR-190 overexpression led to enhanced cell proliferation in vitro and increased anchorage inde-pendent growth. This could suggest that miR-190 affects differ-ent downstream genes during initial transformation of cells than during tumor progression, and that while miR-190 facilitates proliferation and anchorage independent growth, it also blocks expression of other genes which are necessary for the progression of dormant micro-tumors into rapid mass expansion. miR-190 was also shown to be involved in several biological processes in the central nervous systems32,33 and to have an increased expres-sion level in human pancreatic cancer tissues and cell lines,34 in hepatocellular carcinomas (HCCs)35 and granulocytes isolated from patients with primary myelofibrosis (PMF).36 In a search for miRNA signatures that accurately predict marker status of breast cancer patients, miR-190 was found to correlate with estrogen receptor (ER) status.37
Since a single miRNA can regulate the expression levels of a large number of genes,38,39 we hypothesized that miR-190 might be involved in the regulation of the switch of dormant tumors to exponential growth by affecting a large group of downstream genes crucial for the maintenance of tumor dormancy. The identification of potential miRNA targets still relies mostly on bioinformatics prediction. Such programs can identify poten-tial direct targets by matching complementary sequences with
not significantly affected by overexpression of miR-190. This is in line with observations from other experimental models of tumor dormancy in which tumor cell proliferation is balanced by cell death which results in the persistence of a constant tumor size.8,12,13,26-28 In these models, tumor dormancy is associated with impaired angiogenic capacity. Importantly, gene set enrichment analysis support the observation that miR-190 expression does not affect cell cycle or proliferation related genes. Indeed, high prevalence of proliferating cells is observed in microscopic dor-mant tumors that express miR-190. Moreover, miR-588, a tumor dormancy associated microRNA, was previously shown to have no effect on proliferation rate of tumor cells in vivo. Rather, miR-588 expression was associated with an increase in the apoptotic rate.19
miR-190 overexpression in U87 human glioblastoma cells resulted in a significant but transient inhibition of tumor pro-gression (Fig. 1C). A possible explanation to the transient effect of miR-190 expression on U87-MG tumor growth patterns could be that miR-190 expression in U87-MG cells induces cellular stress (death or quiescence). This could lead to the selection of cells that lost or repressed miR-190 expression, or alternatively, upregulated compensatory mechanisms that circumvent miR-190 effects. In order to differentiate between these two scenarios, we generated cell lines from U87-miR-190 tumors that ‘escaped’ dormancy and became fast-growing and aggressive tumors. miR-190 levels were clearly lower than in the ‘parental’ U87-miR-190 cell line. This supports the hypothesis that miR-190 was lost or repressed in the tumor cells that ‘escaped’ dormancy.
Knowledge on the functional roles of miR-190 is currently limited. Its expression profile was found to be significantly cor-related with clinical and biological features of neuroblastoma (NB): miR-190 was found as differentially expressed in high- vs.
Table 4. Pathways downregulated following miR-190 expression.
Interferon response interferon-inducible genes upregulated in lung cancer infected with RSV
Response to Imiquimod interferon cluster genes upregulated in skin tumors treated with Imiquimod
Response to IFNG (up) genes upregulated in five primary endothelial cell types by IFNG
Response to IFNA1 (up) genes upregulated in primary hepatocyte in response to IFNA
ILF3 targets (up) upregulated in osteosarcoma upon ectopic expression of ILF3
IFN α response (up) genes upregulated in fibrosarcoma by treatment with INF α
Interferon responsive genes genes upregulated in primary fibroblast culture after treatment with INF α
Response to radiation therapy genes upregulated in response to both single dose and fractionated radiation
Silenced by deacetylation genes upregulated in pancreatic cancer cell lines by TSA
Breast cancer amplicon genes within amplicon 7p22 with a copy number alterations in breast tumors
Regulated by methylation genes upregulated in pancreatic cancer after treatment with decitabine
Liver cancer ACOXI (up) genes upregulated in hepatocellular carcinoma of ACOX1 knockout mice
UV response via ERCC3 genes upregulated in fibroblasts expressing mutant forms of ERCC3 after UV IR
ERCC3 allele XPCS vs. TTD genes upregulated in fibroblasts expressing different mutant forms of ERCC3
Stromal stimulation (up) genes upregulated in multiple myeloma cells co-cultured with stromal cells
Liver cancer subclass G3 (down) downregulated genes in hepatocellular carcinoma (HCC) subclass G3
Graft-vs.-host disease genes involved in graft-vs.-host disease
Antigen processing and presentation genes involved in antigen processing and presentation
Allograft rejection genes involved in allograft rejection

www.landesbioscience.com Transcription 187
and miR-190-expressing osteosarcoma and glioblastoma cells were only minor (below threshold), or their downregulation was not consistent in all samples. Nine out of the 41 genes encode for either transcription factors (such as HOXC5 and TCF4) or for proteins involved in the transcription process (such as the
specific miRNAs. When taking the best hits from two different predicting programs, only 41 common genes were found. These genes were found to be differentially regulated between control and miR-190 overexpressing cells in gene expression profiling analysis, but these differences in expression between control
Figure 3. Leading Edge analysis of genes contributing to pathway enrichment. (A) Genes that contribute to the significance enrichment of the 19 pathways shared by KHOS and T98G cancer types following miR-190 expression. A total of 254 genes were found in the KHOS miR-190-expressing cells, while 398 genes were found in the T98G miR-190-expressing cells. 102 genes were found as shared between the two cancer types. (B) Interferon response genes constitute a major part of the genes that contribute to the shared pathways. Thirty genes are found in both the 102 genes identified above as shared between the two cancer types and 203 genes that are part of the interferon related pathways. (C) Interferon related genes network. Gene network depiction of interferon upstream regulators predicted to be inhibited (blue) determined by IPA software. Specific upregulated (red) and downregulated (green) genes from the experimental data set involved in determining the activation state of the upstream regulator are shown with direct (solid lines) and indirect (dashed lines) relationships to the upstream regulators. A predicted relationship is color coded to indicate whether it leads to activation (orange) or inhibition (blue). Relationships that are inconsistent with the prediction (yellow) or have an undetermined effect (gray) are also shown. The darker the shade of green or red, the greater the fold change.

188 Transcription Volume 4 Issue 4
critical role in maintenance of dormancy of micro-tumors. The effect of miR-190 on these additional targets can occur during the translation process and therefore will not be detected by gene expression profiling.
The miR-190 target genes affected in both the glioblastoma and osteosarcoma cells (miR-190 shared targets) encode for proteins that are involved in a variety of cellular processes. Interestingly, several shared target genes, such as NFI/B, encode DNA binding proteins or can affect DNA binding of transcription factors that in turn can affect expression of other downstream genes. Other shared target genes are involved in central signaling and cellular processes. These results indicate that miRNA-190s effect might be indirectly mediated by modulation of various cellular ‘cen-tral hubs’. By affecting ‘central cellular hubs’ and transcription factors, miR-190 effects are multiplied, the signaling cascade is amplified and the final phenotypic outcome (induction of tumor dormancy) is strengthened.
NFI/B belongs to the Nuclear Factor I (NFI) family of tran-scription factors and was shown to affect cell proliferation.40 NFI/B was recently described as an oncogenic transcription factor whose levels are increased in small cell lung cancer41 and is overex-pressed as an oncogenic fusion product, MYB-NFIB in adenoid cystic carcinomas.42 Loss of NFI/B in lung cells was associated with extracellular matrix, cell adhesion and FGF signaling.40 It is intriguing that miR-190 expression resulted in significant loss of NFI/B (Fig. 2E): loss of an oncogenic transcription factor can fit well with the fact that miR-190 expression leads to induction of dormancy. These observations suggest a possible role for NFI/B in mediating the biological effects of miR-190.
Collagen XVIII appears among the top 35 genes that are upregulated following miR-190 expression. Endostatin, a 20 kDa fragment from the C-terminus of collagen XVIII, is known to inhibit endothelial proliferation and therefore, inhibit angio-genesis and tumor growth.24 The observation that endostatin precursor is upregulated in dormant tumors generated by miR-190 expression supports our previous reports that dormancy of micro-tumors is associated with impaired tumor angiogenesis. Moreover, several major histocompatibility complex, class I genes are observed among the top 20 genes that are downregulated following miR-190 expression. This could imply that miR-190s effect on tumor progression might be associated with perturba-tions in antigen presentation to the immune system.
Both GSEA and IPA analyses suggest that interferons are enriched pathways and possible upstream regulators of the gene expression profiles observed following miR-190 expression. Interferons (IFNs) belong to a large class of glycoproteins known to be involved in a wide variety of biological responses, particu-larly in the immune system.43 They are known to ‘interfere’ with viral replication within host cells, as well as activate immune cells, increase recognition of infection or tumor cells by upregu-lating antigen presentation and increase the ability of uninfected host cells to resist new infection by virus. In addition to antivi-ral, antibacterial and anti-parasitic host-defense functions they are now also recognized as crucial regulators of cell proliferation, differentiation, survival and death. Interferon therapy is used (in combination with chemotherapy and radiation) as a treatment
transcription activator NEUROD1). By directly affecting tran-scription factors and transcription activator levels, miRNAs can amplify the number and level of possible indirect targets and therefore the final outcome of the biological response.
MiRNAs repress expression of their target genes by affecting the mRNA stability or their translation. In this study, we focused on the genes whose mRNA levels are affected by miR-190 expres-sion. We were able to identify a large set of miR-190-mediated transcriptional changes that are shared in both glioblastoma and osteosarcoma cells. The transcripts of 244 genes were shown to be significantly downregulated following miR-190 expression in both glioblastoma and osteosarcoma cells. These are, therefore, most likely to be the common indirect transcriptional targets of miR-190 and not part of a tumor specific response. These changes consist of large networks of genes that include transcrip-tion factors, tumor suppressor genes and members of the inter-feron response pathways. These observations, however, do not exclude the possibility that additional targets of miR-190 play a
Table 5. Interferon-response genes that contribute to the pathway enrichment.
APOBEC3G
CALR
CASP1
COL16A1
CX3CL1
GMPR
HLA-B
HLA-C
HLA-E
HLA-F
IFI16
IFI30
IFI35
IFI6
IFITM1
IFITM2
IL6
IRF1
IRF7
ISG20
MX2
OAS1
PARP14
PSMB10
RARRES3
RBCK1
RFC2
SAMD9L
TAP1
TRAFD1

www.landesbioscience.com Transcription 189
suspended in 10 μl of serum free media was slowly injected. After retracting the needle, the skin incision was closed with sutures.
Total-RNA isolation and quality control. Total-RNA, including miRNAs, was isolated using TRIzol
(Invitrogen) according to the manufacturer’s protocol. RNA integrity and concentration was determined using RNA 6000 Nano Lab on Chip kits and Agilent 2100 Bioanalyzer (Agilent).
microRNA expression analysis. Real-time quantitative miRNA expression analysis was per-
formed using TaqMan assays (Applied Biosystems, ABI). First, miRNAs were converted into cDNA via sequence-specific reverse transcription (RT) reactions using Multiplex RT MicroRNA Kit (ABI). C-DNA was then loaded into the low density (384 well) micro fluidic cards that were pre-loaded with TaqMan probes (Human MicroRNA Panel v1.0, ABI) and microRNA expression levels were analyzed using a 7900HT Fast Real-Time PCR System (ABI) according to the manufacturer’s protocol. Verification of gene expression levels was done by quantitative real-time PCR. After total RNA isolation using TRIzol (Invitrogen) and cDNA synthesis, quantitative PCR was performed on 7500 Real-Time PCR System (ABI, CA). After normalization to a multiplexed 18S housekeeping probe, gene expression for the target was cal-culated using the 2−ΔΔCt method relative to the control. Probes for all genes were purchased from Applied Biosystems. RT-PCR data are presented as mean ± SD unless otherwise noted. Statistical significance was assessed using Student’s t-test. A value of p < 0.05 was considered statistically significant. All statistical tests were two-tailed.
Genome-wide gene expression profiling and analysis. Samples obtained from tumor cells grown in vitro were ana-lyzed for genome-wide gene expression using the Illumina iScan instrument platform (www.illumina.com), allowing for genome-wide direct hybridization profiling. Human HT-12 bead array chips (Illumina) were interrogated with amplified (Ambion) and labeled total RNA from all samples; duplicate biological samples were assayed for each condition. Following hybridization and imaging of the arrays (iScan, Illumina), the data was extracted using GenomeStudio (Illumina Inc.) and analyzed using the Bioconductor Limma package.45-47 The data was preprocessed using log2 transformation (variance stabilization) followed by quantile normalization. For each probe/gene, differential expres-sion (fold change) analysis was performed using the linear model-ing algorithm in Limma (linear modeling for microarray data). Limma also calculates a modified T-test statistic with the corre-sponding T-test p-value for each probe/gene. The resulting gene list was then filtered in Excel by excluding probes/genes with
for many cancers, due to the antiproliferative, anti-angiogenic and pro-apoptotic effects induced by INFs, and their ability to modulate an immune response.44 The exact correlation between miR-190, interferons and their responses and downstream genes, and maintenance of tumor dormancy is still to be elucidated. However, the significant enrichment of IFN response pathways and the prediction that IFNs can act as upstream regulators leading to the gene expression pattern observed following miR-190 expression, strongly suggest an active role for IFN in medi-ating the tumor dormancy-inducing capacity of miR-190.
In summary, using genome-wide profiling analyses of tran-scriptional changes, we successfully identified a large set of genes whose expression is modulated following the expression of the tumor dormancy-inducing miR-190. Our data indicate that alteration of tumor transcriptome and modulation of central cel-lular processes by miR-190 expression may constitute a promising strategy to prevent cancer or reverse malignant tumors into an asymptomatic dormant stage.
Materials and Methods
Cell lines, tissue culture and surgical specimens. Human breast adenocarcinoma (MDA-MB-436), osteosar-
coma (KHOS-24OS), glioblastoma (T98G), and liposarcoma (SW872) cell lines were obtained from the American Type Culture Collection (ATCC). Dormant and angiogenic fast-growing populations were generated and maintained as previ-ously described.12-14 Cell proliferation assay was performed using CyQUANT NF Cell Proliferation Assay Kit (Molecular Probes, Invitrogen,) according to manufacturer’s instructions.
Animals and tumor cell inoculation. Tumor cells were injected subcutaneously into the lower right
quadrant of the flank of each mouse as previously described.13 Male SCID mice aged 6–8 weeks (Charles River Laboratories) were cared for in accordance with the standards of the St. Elizabeth’s Medical Center Institutional Animal Care and Use Committee (IACUC). Tumor volume was calculated using the standard formula: length x width2 x 0.52. Orthotopic tumor cell injections were conducted as follows: subsequent to disinfection of the skin on the top of the head with Betadine and 70% etha-nol, the skin was cut along the midline for approximately 0.5 cm to expose coronal and sagittal sutures. At a point on the right site 2 mm dorsal to the coronal suture and 2 mm lateral to the sagittal suture, a 28-Gauge needle on a 0.3 mL insulin syringe (Becton, Dikinson and Company) was inserted into the right cerebral hemisphere to a depth of 2 mm. One million tumor cells
Table 6. Predicted upstream regulators.
Upstream regulator Molecule type z-score Upstream regulator Molecule type z-score
IFNG cytokine −3.892 NKX2–3 transcription regulator 2.236
IFNA2 cytokine −3.825 CD24 other 2.000
F2 peptidase −3.592
IL6 cytokine −3.341
NFkB (complex) complex −3.034
HNF4A transcription regulator −2.828

190 Transcription Volume 4 Issue 4
0.05 rather than (adjusted p-values) adj-p-values, which are cor-rected for multiple hypothesis testing.
Upstream regulator analysis data was performed using Ingenuity Pathway Analysis (IPA) (Ingenuity® Systems, www.ingenuity.com). The gene expression data set correspond-ing to the 244 differentially expressed genes was uploaded to IPA and upstream regulator analysis was performed.
Disclosure of Potential Conflicts of Interest
No potential conflicts of interest were disclosed.
Acknowledgments
Authors wish to thank Janusz Weremowicz and Clare Lamont for assisting with animal work, Dr Giannoula Klement for per-forming the orthotopic injections of glioblastoma cells, Dr J Tyson McDonald for assistance with processing the Illumina data, and Melissa Klumpar for critically reading and editing the manuscript. This work was supported by the National Aeronautics and Space Administration under NSCOR grant no. NNJ06HA28G issued through the Human Research Program (to LH) and by Award Number U54CA149233 from the National Cancer Institute (to LH). The content is solely the responsibility of the authors and does not necessarily rep-resent the official views of the National Cancer Institute or the National Institutes of Health.
T-test p-values greater than 0.05 and fold change values between −1.2 and 1.2. Data was submitted to GEO and can be found using series record GSE44713 at www.ncbi.nlm.nih.gov/geo/query/acc.cgi?acc=GSE44713.
In order to evaluate the degree of the overlap between miR190 up and downregulated genes in each cell line and determine the statistical significance of the overlap, we employed the method of normal approximation to the binomial distribution (VennMapper software48). For this analysis, we used the entire set of 47,320 probes on the array and selected a foldchange cutoff of 1.2. Z-scores (number of standard deviations from the expected degree of overlap by chance) were calculated for each comparison: (1) upregulated probe lists for both cell lines and (2) downregulated probe lists for both cell lines. Positive Z-scores indicate greater overlap than expected by chance while negative Z-scores indicate less overlap than expected. A Z-score of 1.96 corresponds to a p-value of 0.05 that the observed degree of overlap (number of gene/probes common to both cell lines) occurred by chance.
Gene Set Enrichment Analysis (GSEA) of the full data set was performed as an alternative to the fold change analysis because it is expected that the gene pathways perturbed by miR-190 expression are comprised of numerous genes, each exhibit-ing small changes. Therefore, when evaluating individual genes based upon the fold change and T-test analysis described here, we applied the less stringent nominal p-value threshold of less than
References1. Folkman J, Kalluri R. Cancer without disease. Nature
2004; 427:787; PMID:14985739; http://dx.doi.org/10.1038/427787a
2. Aguirre-Ghiso JA. Models, mechanisms and clini-cal evidence for cancer dormancy. Nat Rev Cancer 2007; 7:834-46; PMID:17957189; http://dx.doi.org/10.1038/nrc2256
3. Naumov GN, Folkman J, Straume O. Tumor dorman-cy due to failure of angiogenesis: role of the microenvi-ronment. Clin Exp Metastasis 2008; PMID:18563595
4. Uhr JW, Scheuermann RH, Street NE, Vitetta ES. Cancer dormancy: opportunities for new therapeutic approaches. Nat Med 1997; 3:505-9; PMID:9142117; http://dx.doi.org/10.1038/nm0597-505
5. Brackstone M, Townson JL, Chambers AF. Tumour dormancy in breast cancer: an update. Breast Cancer Res 2007; 9:208; PMID:17561992; http://dx.doi.org/10.1186/bcr1677
6. Gimbrone MA Jr., Leapman SB, Cotran RS, Folkman J. Tumor dormancy in vivo by prevention of neovascularization. J Exp Med 1972; 136:261-76; PMID:5043412; http://dx.doi.org/10.1084/jem.136.2.261
7. Holmgren L, O’Reilly MS, Folkman J. Dormancy of micrometastases: balanced proliferation and apopto-sis in the presence of angiogenesis suppression. Nat Med 1995; 1:149-53; PMID:7585012; http://dx.doi.org/10.1038/nm0295-149
8. Almog N. Molecular mechanisms underlying tumor dormancy. Cancer Lett 2010; 294:139-46; PMID:20363069; http://dx.doi.org/10.1016/j.can-let.2010.03.004
9. Bissell MJ, Hines WC. Why don’t we get more cancer? A proposed role of the microenvironment in restrain-ing cancer progression. Nat Med 2011; 17:320-9; PMID:21383745; http://dx.doi.org/10.1038/nm.2328
10. Kenny PA, Bissell MJ. Tumor reversion: correction of malignant behavior by microenvironmental cues. Int J Cancer 2003; 107:688-95; PMID:14566816; http://dx.doi.org/10.1002/ijc.11491
11. Lu X, Mu E, Wei Y, Riethdorf S, Yang Q, Yuan M, et al. VCAM-1 promotes osteolytic expansion of indo-lent bone micrometastasis of breast cancer by engag-ing α4β1-positive osteoclast progenitors. Cancer Cell 2011; 20:701-14; PMID:22137794; http://dx.doi.org/10.1016/j.ccr.2011.11.002
12. Almog N, Henke V, Flores L, Hlatky L, Kung AL, Wright RD, et al. Prolonged dormancy of human liposarcoma is associated with impaired tumor angio-genesis. FASEB J 2006; 20:947-9; PMID:16638967; http://dx.doi.org/10.1096/fj.05-3946fje
13. Naumov GN, Bender E, Zurakowski D, Kang SY, Sampson D, Flynn E, et al. A model of human tumor dormancy: an angiogenic switch from the nonangio-genic phenotype. J Natl Cancer Inst 2006; 98:316-25; PMID:16507828; http://dx.doi.org/10.1093/jnci/djj068
14. Almog N, Ma L, Raychowdhury R, Schwager C, Erber R, Short S, et al. Transcriptional switch of dormant tumors to fast-growing angiogenic phenotype. Cancer Res 2009; 69:836-44; PMID:19176381; http://dx.doi.org/10.1158/0008-5472.CAN-08-2590
15. Bartel DP. MicroRNAs: genomics, biogenesis, mechanism, and function. Cell 2004; 116:281-97; PMID:14744438; http://dx.doi.org/10.1016/S0092-8674(04)00045-5
16. Carthew RW, Sontheimer EJ. Origins and Mechanisms of miRNAs and siRNAs. Cell 2009; 136:642-55; PMID:19239886; http://dx.doi.org/10.1016/j.cell.2009.01.035
17. Guo H, Ingolia NT, Weissman JS, Bartel DP. Mammalian microRNAs predominantly act to decrease target mRNA levels. Nature 2010; 466:835-40; PMID:20703300; http://dx.doi.org/10.1038/nature09267
18. Kasinski AL, Slack FJ. Epigenetics and genetics. MicroRNAs en route to the clinic: progress in vali-dating and targeting microRNAs for cancer therapy. Nat Rev Cancer 2011; 11:849-64; PMID:22113163; http://dx.doi.org/10.1038/nrc3166
19. Almog N, Ma L, Schwager C, Brinkmann BG, Beheshti A, Vajkoczy P, et al. Consensus micro RNAs governing the switch of dormant tumors to the fast-growing angiogenic phenotype. PLoS One 2012; 7:e44001; PMID:22952847; http://dx.doi.org/10.1371/journal.pone.0044001
20. Lin RJ, Lin YC, Chen J, Kuo HH, Chen YY, Diccianni MB, et al. microRNA signature and expression of Dicer and Drosha can predict prognosis and delin-eate risk groups in neuroblastoma. Cancer Res 2010; 70:7841-50; PMID:20805302; http://dx.doi.org/10.1158/0008-5472.CAN-10-0970
21. Buckley PG, Alcock L, Bryan K, Bray I, Schulte JH, Schramm A, et al. Chromosomal and microR-NA expression patterns reveal biologically distinct subgroups of 11q- neuroblastoma. Clin Cancer Res 2010; 16:2971-8; PMID:20406844; http://dx.doi.org/10.1158/1078-0432.CCR-09-3215
22. De Preter K, Mestdagh P, Vermeulen J, Zeka F, Naranjo A, Bray I, et al. miRNA expression profiling enables risk stratification in archived and fresh neuroblastoma tumor samples. Clin Cancer Res 2011; 17:7684-92; PMID:22031095; http://dx.doi.org/10.1158/1078-0432.CCR-11-0610
23. Oh S, Shin S, Janknecht R. ETV1, 4 and 5: an onco-genic subfamily of ETS transcription factors. Biochim Biophys Acta 2012; 1826:1-12; PMID:22425584
24. O’Reilly MS, Boehm T, Shing Y, Fukai N, Vasios G, Lane WS, et al. Endostatin: an endogenous inhibitor of angiogenesis and tumor growth. Cell 1997; 88:277-85; PMID:9008168; http://dx.doi.org/10.1016/S0092-8674(00)81848-6
25. Subramanian A, Tamayo P, Mootha VK, Mukherjee S, Ebert BL, Gillette MA, et al. Gene set enrichment analysis: a knowledge-based approach for interpreting genome-wide expression profiles. Proc Natl Acad Sci U S A 2005; 102:15545-50; PMID:16199517; http://dx.doi.org/10.1073/pnas.0506580102

www.landesbioscience.com Transcription 191
42. Stenman G, Andersson MK, Andrén Y. New tricks from an old oncogene: gene fusion and copy num-ber alterations of MYB in human cancer. Cell Cycle 2010; 9:2986-95; PMID:20647765; http://dx.doi.org/10.4161/cc.9.15.12515
43. Schoggins JW, Rice CM. Interferon-stimulated genes and their antiviral effector functions. Curr Opin Virol 2011; 1:519-25; PMID:22328912; http://dx.doi.org/10.1016/j.coviro.2011.10.008
44. Dunn GP, Koebel CM, Schreiber RD. Interferons, immunity and cancer immunoediting. Nat Rev Immunol 2006; 6:836-48; PMID:17063185; http://dx.doi.org/10.1038/nri1961
45. Smyth GK. Limma: linear models for microarray data. Bioinformatics and Computational Biology Solutions using R and Bioconductor 2005; Gentleman R, Carey V, Dudoit S, Irizarry R, Huber W (eds): 397-420.
46. Gentleman RC, Carey VJ, Bates DM, Bolstad B, Dettling M, Dudoit S, et al. Bioconductor: open software development for computational biol-ogy and bioinformatics. Genome Biol 2004; 5:R80; PMID:15461798; http://dx.doi.org/10.1186/gb-2004-5-10-r80
47. Du P, Kibbe WA, Lin SM. lumi: a pipeline for processing Illumina microarray. Bioinformatics 2008; 24:1547-8; PMID:18467348; http://dx.doi.org/10.1093/bioinformatics/btn224
48. Smid M, Dorssers LC, Jenster G. Venn Mapping: clustering of heterologous microarray data based on the number of co-occurring differentially expressed genes. Bioinformatics 2003; 19:2065-71; PMID:14594711; http://dx.doi.org/10.1093/bioinformatics/btg282
34. Zhang Y, Li M, Wang H, Fisher WE, Lin PH, Yao Q, et al. Profiling of 95 microRNAs in pancreatic cancer cell lines and surgical specimens by real-time PCR analysis. World J Surg 2009; 33:698-709; PMID:19030927; http://dx.doi.org/10.1007/s00268-008-9833-0
35. Kutay H, Bai S, Datta J, Motiwala T, Pogribny I, Frankel W, et al. Downregulation of miR-122 in the rodent and human hepatocellular carcinomas. J Cell Biochem 2006; 99:671-8; PMID:16924677; http://dx.doi.org/10.1002/jcb.20982
36. Guglielmelli P, Tozzi L, Pancrazzi A, Bogani C, Antonioli E, Ponziani V, et al.; MPD Research Consortium. MicroRNA expression profile in gran-ulocytes from primary myelofibrosis patients. Exp Hematol 2007; 35:1708-18; PMID:17976522; http://dx.doi.org/10.1016/j.exphem.2007.08.020
37. Lowery AJ, Miller N, Devaney A, McNeill RE, Davoren PA, Lemetre C, et al. MicroRNA signatures predict oestrogen receptor, progesterone receptor and HER2/neu receptor status in breast cancer. Breast Cancer Res 2009; 11:R27; PMID:19432961; http://dx.doi.org/10.1186/bcr2257
38. Zhang B, Pan X, Cobb GP, Anderson TA. microR-NAs as oncogenes and tumor suppressors. Dev Biol 2007; 302:1-12; PMID:16989803; http://dx.doi.org/10.1016/j.ydbio.2006.08.028
39. Ventura A, Jacks T. MicroRNAs and cancer: short RNAs go a long way. Cell 2009; 136:586-91; PMID:19239879; http://dx.doi.org/10.1016/j.cell.2009.02.005
40. Hsu YC, Osinski J, Campbell CE, Litwack ED, Wang D, Liu S, et al. Mesenchymal nuclear factor I B regulates cell proliferation and epithelial differentiation during lung maturation. Dev Biol 2011; 354:242-52; PMID:21513708; http://dx.doi.org/10.1016/j.ydbio.2011.04.002
41. Dooley AL, Winslow MM, Chiang DY, Banerji S, Stransky N, Dayton TL, et al. Nuclear factor I/B is an oncogene in small cell lung cancer. Genes Dev 2011; 25:1470-5; PMID:21764851; http://dx.doi.org/10.1101/gad.2046711
26. Achilles EG, Fernandez A, Allred EN, Kisker O, Udagawa T, Beecken WD, et al. Heterogeneity of angiogenic activity in a human liposarcoma: a proposed mechanism for “no take” of human tumors in mice. J Natl Cancer Inst 2001; 93:1075-81; PMID:11459868; http://dx.doi.org/10.1093/jnci/93.14.1075
27. Udagawa T. Tumor dormancy of primary and secondary cancers. APMIS 2008; 116:615-28; PMID:18834406; http://dx.doi.org/10.1111/j.1600-0463.2008.01077.x
28. Udagawa T, Fernandez A, Achilles EG, Folkman J, D’Amato RJ. Persistence of microscopic human cancers in mice: alterations in the angiogenic balance accompa-nies loss of tumor dormancy. FASEB J 2002; 16:1361-70; PMID:12205027; http://dx.doi.org/10.1096/fj.01-0813com
29. Bray I, Bryan K, Prenter S, Buckley PG, Foley NH, Murphy DM, et al. Widespread dysregulation of MiRNAs by MYCN amplification and chromosomal imbalances in neuroblastoma: association of miRNA expression with survival. PLoS One 2009; 4:e7850; PMID:19924232; http://dx.doi.org/10.1371/journal.pone.0007850
30. Gaedcke J, Grade M, Camps J, Søkilde R, Kaczkowski B, Schetter AJ, et al. The rectal cancer microRNAome--microRNA expression in rectal cancer and matched normal mucosa. Clin Cancer Res 2012; 18:4919-30; PMID:22850566; http://dx.doi.org/10.1158/1078-0432.CCR-12-0016
31. Beezhold K, Liu J, Kan H, Meighan T, Castranova V, Shi X, et al. miR-190-mediated downregulation of PHLPP contributes to arsenic-induced Akt activation and carcinogenesis. Toxicol Sci 2011; 123:411-20; PMID:21750348; http://dx.doi.org/10.1093/toxsci/kfr188
32. Zheng H, Zeng Y, Zhang X, Chu J, Loh HH, Law PY. mu-Opioid receptor agonists differentially regulate the expression of miR-190 and NeuroD. Mol Pharmacol 2010; 77:102-9; PMID:19854889; http://dx.doi.org/10.1124/mol.109.060848
33. Zheng H, Chu J, Zeng Y, Loh HH, Law PY. Yin Yang 1 phosphorylation contributes to the differential effects of mu-opioid receptor agonists on microR-NA-190 expression. J Biol Chem 2010; 285:21994-2002; PMID:20457614; http://dx.doi.org/10.1074/jbc.M110.112607