transboundary diagnostic analysis of the lake chad …
TRANSCRIPT

1
TRANSBOUNDARY DIAGNOSTIC ANALYSIS OF THE LAKE CHAD BASIN
PREPARED FOR
THE L.C.B.C. – G.E.F. PROJECT ON THE REVERSAL OF LAND AND WATER RESOURCES DEGRADATION
BY
DR HASSAN HARUNA BDLIYA,
FEDERAL MINISTRY OF ENVIRONMENT AND HOUSING
FEDERAL SECRETARIAT
MAITAMA, ABUJA
AND
DR MARTIN BLOXOM

2

3
1 EXECUTIVE SUMMARY
For about four decades today recurring droughts, a general decline in rainfalls, and degradation of the vegetation cover have led to drastic changes in the environmental conditions of the Lake Chad Basin. The drying up of Lake Chad, the encroachment of the desert, and the decline of agriculture, livestock and fisheries, threatens the social and economic well-being of the over 22 million people living in the Lake Chad Basin.
This basin is of strategic importance, covering about 8% of the surface area of the African continent, and shared between the countries of Algeria, Cameroon, Central African Republic (CAR), Chad, Libya, Niger, Nigeria, Sudan, Algeria and Libya. It constitutes an important freshwater source for the countries.
Considering the threats, the African Ministerial conference on Environment, AMCEN, decided at its inaugural meeting in 1985 to support "the Lake Chad Basin Commission for the integrated development of Lake Chad Basin, in order to halt the drying up of Lake Chad and use its waters and ecosystems rationally" as one of the "priority sub-regional activities". This decision culminated in the diagnostic study of the Lake Chad Basin completed by Kindle et al (1989) in 1989.
Since then, and sprouting from this, the Lake Chad Basin Commission has acquired the assistance of the Global Environment Facility (GEF) to move forward the programme of reversing the land and water resources degradation trends prevalent in the Lake Chad Basin, through the LCBC-GEF programme on the reversal of degradation trends in the land and water resources of the LCB.
This Transboundary Diagnostic Analysis, a key output of the the LCBC-GEF programme, is centred on the transboundary environmental problems that need to be addressed jointly by the international community and the LCBC member states, if the degradation trends are to be reversed. The analysis is intended to form the basis for the preparation of a strategic action program (SAP) for the LCB. It was also done in fulfilment of a requirement for most projects intended to be financed from the GEF International Waters Focal Area, from which support for the implementation of the proposed SAP will be sought by the LCBC.
The analysis was conducted through a participatory process (Chapter 2) designed to engender stakeholder ownership of the output, as well as underpin the strategic action programme (SAP) that the LCBC stakeholders will formulate during the next stage of the project. Members of the Project Steering Committees (PSC) and the Technical Task Team (TTT) in each member country constituted the bulk of stakeholder representatives who undertook the participatory identification, prioritisation and analysis of the transboundary problems, first in their respective countries as national teams, and then collectively for the region as a combined regional team.
Chapter three of the report presents base line information on the Lake Chad Basin. It outlines the defining and unique characteristics of the lake, key among which is its

4
importance as a source of fresh water for a population of about 22 million spread across five countries (Cameroon, CAR, Chad, Niger, Nigeria), The chapter also outlines eight diagnostic (sub) basins of the LCB, that make more sense from development, conservation and planning points of view. The following are the diagnostic basins:
1. Lake Chad: With a maximum surface area of 25,000km2, it is made up of distinct morphological pools that become fully visible at a water surface elevation of about 279 meters. Although it is a closed basin within ana arid zone, it has relatively low salinity. A major water resources concern of the lake is its shrinkage, with the present expanse being less than 3,000 km2. The shrinkage has impacted negatively on large scale irrigation schemes in Nigeria, among other things. It is strategic for global biodiversity, being the home to 120 species of fish, as well supporting 372 bird species. The sitatunga, a swamp adopted antelope found in the lake, is of conservation concern. The lake is a threatened major regional fishery, that supports a major livestock industry., among other things.
2. Lower Chari: This is the most important collecting area for the waters that feed the lake, having the largest permanent river. This diagnostic basin spans the Sahelo-Sudanien zone and the Sudano-Sahelian zone. There is one national park (Dougia) and one Faunal Reserve (Mandelia), within this sub basin, both of which have questionable protection status. The population have traditionally faced resources constraints related mainly to water scarcity. Economic diversification (cultivation of hydrophilic sorghums and millet, seasonal hunting and fishing, intensive livestock rearing) has been the traditional response.
3. The Flood plains of the Logone: The flood plains occupy about 25,000 km2, with the most significant one among them beingnthe Grand Yaeres, which is about 5,000Km2 in area. The major water resources concern here is the Maga Dam. Constructed primarily to support large scale rice production, which is now moribund, it also has had a very disruptive effect on the ecology and economy of the Grand Yaeres and the Waza National Park, The flood plains are major fisheries, fish spawning grounds, in addition to supporting large numbers of seasonally grazed livestock.
4. The Mayo Kebbi: This is a unique watershed divide filled with a string of lakes, which can flow to the Logone River or to the Niger River. This is a unique landscape feature in the LCB, and a remarkable landscape feature for the planet. Ther is a wildlife reserve (Binder Lere), within which there is the Lake Lere, the only known home to Manatee in the LCB.
5. The Komadugu Yobe: The river system draining this 148,00Km2 sub basin is a classical example of a tapering stream, loosing a large part of its total annual flow by infiltration and evapo-transpiration. With the largest number of dams and population, poor management of the river system and dam operations have altered the regime of the river system. The international strategic Hadejia Nguru Wetlands, home to Nigeria’s premier Ramsar site, is in this sub basin. The Kouri breed of cattle, which is unique to the LCB, is found in this sub basin.

5
6. The Borno Drainages: This is a featureless plain drained by three rivers (Yedseram, Ngadda, Gobio) that make a very negligible contribution to the lake’s inflow. The Sambisa Game Reserve (important for elephant conservation), the Chingurimi Duguma and the Lake Chad Game Sanctuary Sectors of the Chad Basin National Park are situated in this sub basin. It is also home to the largest irrigation scheme that has gone moribund due to the lake’s shrinkage.
7. Northern Diagnostic Basin: Noted for its Oasis, this is the largest diagnostic basin (807,360 Km2). It supplies no inflow for the lake, as it is also the most arid sub basin. Major resources use concerns here include the mobilisation of dunes by trampling livestock and the over harvesting of the scarce trees.
8. Lake Fitri: This is a miniature version of Lake Chad. It is a rich source of pasture in a zone of scarcity. There is an intensified competition for the resources amongst the indigenous populations, resulting in the over turning of the old rules of use fixed by custom and habits.
Chapter three also highlights the climatic features of the basin, emphasising the catalytic role being played by climate change in resources degradation. The chapter also discusses the current institutional and legal settings for managing the basin, and highlights that existing agencies, laws and regulations, policies and programs are not adequate for addressing the challenges.
Chapter four presents the transboundary problems as identified and prioritised by the basin stakeholders. These are, in a declining order of significance, as follows:
1. Variability of hydrological regime and fresh water availability: This pertains to the dramatic decrease in fresh water availability in the LCB, the best illustration of which is the decrease in the lake’s volume by 95% from 1963 to date. It also pertains to a marked variability in the hydrological regimes of the rivers that feed it, as well as rainfall regimes in the region, at the root of which is population pressure, low environmental awareness levels and the absence of sustainable development in the political programs of the riparian countries. This has led to continuing decline in local access to water, crop failures, livestock deaths, collapsed fisheries and wetlands services, etc. The socio-economic consequences of the impacts include food insecurity and declining health status of the populace. It is rated as the most significant problem not only due to the above impacts and consequences, but also because it drives or contributes towards all the other six problems.
2. Water Pollution: The relatively high rating of this problem is based on foreseeable trends, rooted mainly in the absence of working regulations and standards for environmental protection. Commercial cotton and rice production, known to use large quantities of agro chemicals are on the increase, and will lead to inorganic chemical pollution and eutrophication. There is also the issue of increasing oil exploitation in Chad, which will give rise to increased urbanization, and the pollution of water bodies from oil spills. When water pollution becomes prevalent it will contribute to fisheries depletion and the prevalence of invasive species.

6
3. Decreased Viability of biological resources: This pertains to the inability of the regenerative rates of the plant and animal resources to keep apace with exploitation and disturbances (Disappearance of tree seedlings, collapsing of fisheries, sterilization of soils, etc), at the root of which is population pressure, low environmental awareness levels and the absence of sustainable development in the political programs of the riparian countries. This phenomena has a spiralling effect, as the shortages cause more unsustainable resources harvesting and thus more degradation. The net socio-economic consequence is deepening poverty due to resources shortages. It also contributes to biodiversity loss and increasing variability of hydrological regime and fresh water availability.
4. Loss of biodiversity: This is about the loss of plant and animal species, as well as damages to ecosystem health, rooted in population growth, absence of sustainable development in political programs, and low environmental awareness. This reduces ecosystem productivity and thus resources availability, resulting in deepening poverty. It also contributes to the decreasing viability of biological resources.
5. Loss and modification of ecosystems: Extensive habitat and community modification has been experienced in the lake and the river environment. The lake, for example, has changed from an open water to a marshy environment, and about 50% of wetlands have been destroyed. This has been due mainly to reduced flows rooted mainly in the lack of sustainable development in the political agenda of the member countries, as well as a low level of environmental awareness. The impact of this phenomenon is most felt in the collapse of some fisheries and recessional rice cultivation, as well as biodiversity loss and the decreased viability of biological resources.
6. Sedimentation in rivers and water bodies: This has led to changes in channel flow patterns as well as a reduction in the inflows to the lake through channel diversion, as well as the colonisation of the silted sites by invasive species. It is driven mainly by unsustainable farming practices on marginal lands rooted in low environmental awareness, population pressure, and absence of sustainable development on the political agenda of the member countries.
7. Invasive species: The lake itself is being invaded by typha grass and water hyacinth. Typha is also a major problem in the Komadugu Yobe Basin, and quelea birds are a major plant pest invasive prevalent all over the basin. The invasives, to a large extent, are the functions of poor water resources management, poor enforcement of environmental regulations and standards, and the absence of resources use planning. The typha grass blocks river channels and diverts flows, while the quelea destroys crops, both contributing to poverty through the loss of livelihoods.
Three overarching root causes of the transboundary problems are presented at the end of the chapter. These are: the absence of sustainable development on the political agenda of the riparian countries, low standard of environmental education and awareness, and population pressure.

7
A sample stakeholder analysis, based on the Nigerian sector, is presented in chapter five. The analysis identified three categories of stakeholders whose supportiveness and powerfulness need to be worked upon if the interventions for reversing the degradational trends in the basin are to work. These are:
1. primary stakeholders, mostly resources users who tend to be supportive but lack the power to effect changes;
2. secondary stakeholders, characterised mainly by regulatory and service providing government agencies, as well as the donor community and the projects funded by them, who tend to be moderately supportive and powerful, but need to be worked upon to get committed;
3. key stakeholders, consisting mainly of powerful decision makers, who are not usually supportive, but whose support need to be won if the interventions are to work.
Chapter six presents a governance analysis, which highlights that most of the member countries have been tinkering with their institutional, legal and policy frameworks to improve on water governance in the region, but the efforts still fall short of what is required.
Chapter seven is a conclusion that highlights the need for a special attention to paid to institutional reforms as the bedrock for arresting the degradation trends in the LCB.

8
2 CONTENTS
1 EXECUTIVE SUMMARY ................................................................................................................................. 3
2 CONTENTS ......................................................................................................................................................... 8
3 TABLES ............................................................................................................................................................. 13
4 LIST OF FIGURES .......................................................................................................................................... 14
5 ANNEXES ......................................................................................................................................................... 15
6 ACRONYMS ..................................................................................................................................................... 16
1 INTRODUCTION ............................................................................................................................................ 18
1.1 Context .................................................................................................................................................... 18
1.2 Lake Chad Conventional Basin...................................................................................................... 20
1.3 The need for a Common Vision ..................................................................................................... 21
1.4 Objectives of the TDA ....................................................................................................................... 22
2 TDA APPROACH ............................................................................................................................................ 24
2.1 TDA methodology .............................................................................................................................. 24
2.2 Coordination and Consultation process .................................................................................... 25
2.3 Integration of the results of ongoing activities undertaken by the LCBC and its partners in the Basin ....................................................................................................................................... 27
3 BASELINE INFORMATION ON THE LAKE CHAD BASIN .............................................................. 29
3.1 Geographical scope ............................................................................................................................ 29
3.2 Characteristics of Lake Chad sub-Basins .................................................................................. 30
3.2.1 Lake Chad Diagnostic Basin .................................................................................................. 32
3.2.2 Lower Chari Diagnostic Basin ............................................................................................. 35
3.2.3 Flood Plains of the Logone .................................................................................................... 37
3.2.4 The Mayo Kebbi Diagnostic Basin ...................................................................................... 41
3.2.5 Komadugu Yobe Diagnostic Basin ..................................................................................... 41
3.2.6 The Borno Drainages ............................................................................................................... 43
3.2.7 Northern Diagnostic Basin (includes Termit Sud, Bahr el Ghazal) ...................... 45

9
3.2.8 Lake Fitri Diagnostic Basin ................................................................................................... 47
3.3 Climatic Features and Climate Change ...................................................................................... 47
3.4 Natural Resources .............................................................................................................................. 52
3.5 Unique Ecological Communities and Protected Areas ........................................................ 53
3.6 Water resources .................................................................................................................................. 65
3.7 Human resources ............................................................................................................................... 67
3.8 Institutional and Legal Aspects .................................................................................................... 73
3.8.1 Introduction ................................................................................................................................ 73
3.8.2 CAR ................................................................................................................................................. 76
3.8.3 Cameroon ..................................................................................................................................... 77
3.8.4 Chad ................................................................................................................................................ 78
3.8.5 Niger ............................................................................................................................................... 78
3.8.6 Nigeria ........................................................................................................................................... 79
4 PRIORITY TRANSBOUNDARY PROBLEMS ........................................................................................ 81
4.1 Introduction to the transboundary problems and priority scores ................................ 81
4.2 Variability of hydrological regime and fresh water availability ..................................... 82
4.2.1 Description of the problem and justification of its transboundary importance 82
4.2.2 Major environmental impacts and social-economic consequences .................... 86
4.2.3 Linkages with other transboundary problems............................................................. 87
4.2.4 Immediate, underlying and root causes .......................................................................... 88
4.2.5 Knowledge gaps ........................................................................................................................ 91
4.3 Water pollution (oil, microbiological, organic, inorganic, mineral etc.) ...................... 91
4.3.1 Description of the problem and justification of its transboundary importance 91
4.3.2 Major environmental impacts and social-economic consequences .................... 92
4.3.3 Linkages with other transboundary problems............................................................. 92
4.3.4 Immediate, underlying and root causes .......................................................................... 92

10
4.3.5 Knowledge gaps ........................................................................................................................ 95
4.4 Decreased viability of biological resources (including fish stocks) .............................. 95
4.4.1 Description of the problem and justification of its transboundary importance 95
4.4.2 Major environmental impacts and social-economic consequences .................... 98
4.4.3 Linkages with other transboundary problems............................................................. 99
4.4.4 Immediate, underlying and root causes .......................................................................... 99
4.4.5 Knowledge gaps ..................................................................................................................... 102
4.5 Loss of biodiversity ........................................................................................................................ 102
4.5.1 Description of the problem and justification of its transboundary importance 103
4.5.2 Major environmental impacts and social-economic consequences ................. 104
4.5.3 Linkages with other transboundary problems.......................................................... 105
4.5.4 Immediate, underlying and root causes ....................................................................... 105
4.5.5 Knowledge gaps ..................................................................................................................... 107
4.6 Loss and modification of ecosystems (including terrestrial and water ecosystems) 107
4.6.1 Description of the problem and justification of its transboundary importance 108
4.6.2 Major environmental impacts and social-economic consequences ................. 109
4.6.3 Linkages with other transboundary problems.......................................................... 109
4.6.4 Immediate, underlying and root causes ....................................................................... 109
4.6.5 Knowledge gaps ..................................................................................................................... 111
4.7 Sedimentation in rivers and water bodies as a result of upstream land degradation 111
4.7.1 Description of the problem and justification of its transboundary importance 111
4.7.2 Major environmental impacts and social-economic consequences ................. 113
4.7.3 Linkages with other transboundary problems.......................................................... 113
4.7.4 Immediate, underlying and root causes ....................................................................... 113

11
4.7.5 Knowledge gaps ..................................................................................................................... 115
4.8 Invasive species ............................................................................................................................... 115
4.8.1 Description of the problem and justification of its transboundary importance 115
4.8.2 Major environmental impacts and social-economic consequences ................. 116
4.8.3 Linkages with other transboundary problems.......................................................... 117
4.8.4 Immediate, underlying and root causes ....................................................................... 117
4.8.5 Knowledge gaps ..................................................................................................................... 119
4.9 Over-arching Root Causes............................................................................................................ 119
4.9.1 Absence of sustainable development/wise use of natural resources on political agenda. ......................................................................................................................................... 119
4.9.2 Low Standard of Environmental Education and Awareness ............................... 120
4.9.3 Population Pressure ............................................................................................................. 120
5 STAKEHOLDER ANALYSIS .................................................................................................................... 121
5.1 Introduction ....................................................................................................................................... 121
5.2 Development of Stakeholder Matrix........................................................................................ 121
5.2.1 Primary Stakeholders .......................................................................................................... 121
5.2.2 Secondary Stakeholder ........................................................................................................ 122
5.2.3 Key stakeholders .................................................................................................................... 122
5.3 Development of Engagement Strategies ................................................................................ 125
5.3.1 Powerful but Less supportive stakeholders: .............................................................. 125
5.3.2 Supportive but less powerful stakeholders: ............................................................... 125
5.3.3 Powerful and Supportive: .................................................................................................. 125
6 GOVERNANCE ANALYSES ..................................................................................................................... 126
6.1 Introduction ....................................................................................................................................... 126
6.2 Politics, Policies/Strategies ......................................................................................................... 126
6.3 Legal and Institutional Assessment ......................................................................................... 127
6.4 Transboundary and international cooperation .................................................................. 128

12
7 Conclusion and recommendations .................................................................................................... 130

13
3 TABLES
Table 1.1 Surface Area of the basin among the lcbc member nations ............................................. 21
Table 2.1 officials and Structures Involved in the TDA Process ......................................................... 26
Table 3.1 The Characteristics of the Diagnostic Basins ......................................................................... 32
Table 3.2: The Important Protected Areas in the Member Countries: Cameroun ...................... 54
Table 3.3 Important Protected Areas in CAR ............................................................................................. 55
Table 3.4 Important protected areas in Chad ............................................................................................ 56
Table 3.5 important protected areas in niger ............................................................................................ 59
Table 3.6 Protected Areas in Nigeria ............................................................................................................ 61
Table 3.7 The Regions Household Sources of Income ............................................................................ 69
Table 3.8 health & Education Indicators for lcb........................................................................................ 72
Table 3.9 The Main Water Sector Agencies in the LCB .......................................................................... 75
Table 3.10 The Main Functions Performed by the Water Sector Agencies ................................... 75
Table 4.1 Drainage areas, inflows and overall water balance of the lake ...................................... 83
Table 4.2: Lost Fishes of the Hadejia Nguru Wetlands ........................................................................ 103
Table 6.1: Conventions Acceded To by the LCBC Member Countries ........................................... 128

14
4 LIST OF FIGURES
Figure 1.1 Administrative and conventional lake chad basin ............................................................. 18
Figure 1.2 LCBC Member states ....................................................................................................................... 19
Figure 3.1 A drainage map of lake chad basin ........................................................................................... 29
Figure 3.2 The Diagnostics Basins of the Lake Chad ............................................................................... 31
Figure 3.3 map Showing the 300mm Isohyets in the 1950s................................................................ 49
Figure 3.4 map Showing the 300mm Isohyets in the 1990s ............................................................... 50
Figure 4.1 Priority transboundary environmental problems of the lcb and their ratings ...... 81
Figure 4.2 Progressive Decline in lake chad’s volume ........................................................................... 83
Figure 4.3: rainfall variability in the sahel, 1950 - 2000 ....................................................................... 85
Figure 4.4: An abandoned irrigation scheme on the yobe River in niger republic..................... 86
Figure 4.5 an abandoned well in the yobe basin in niger republic ................................................... 87
Figure 4.6: Causal Chain Analysis for Variability of Hydrological Regime and Fresh Water
Availability ................................................................................................................................................................ 89
Figure 4.7: causal chain analysis for chemical pollution ....................................................................... 94
Figure 4.8: photograph depicting tree death in car ................................................................................. 96
Figure 4.9:Photo Depicting Fine Mesh Fishing Gear in Use on the Logone in Cameroon ........ 97
Figure 4.10: Photo Depicting an Example of an Encrusted Bare Surface in Cameroon............ 98
Figure 4.11: Causal Chain Analysis for Decreased Viability of Biological Resources (Including
Fish Stock) ............................................................................................................................................................. 101
Figure 4.12: Causal Chain Analysis for Loss of Biodiversity ............................................................. 106
Figure 4.13: Wetlands/Lake Chad Loss Between 1972 and 2001 ................................................. 108
Figure 4.15: Sedimentation Downstream Of Tiga Dam In Nigeria ................................................. 112
Figure 4.14: Photograph of Sediment Laden Upper Reaches of the Chari in CAR ................... 112
Figure 4.16: Causal Chain Analysis for Sedimentation in Rivers and Water Bodies as a Result
of Upstream Land Degradation ..................................................................................................................... 114
Figure 4.17: Photograph of Typha Bed in the Hadejia Nguru Wetlands in Nigeria................. 116
Figure 5.1: An Indicative Stakeholder Matrix for the Nigeria Sector ............................................ 124

15
5 ANNEXES
Annex 1: The National TDA Reports

16
6 ACRONYMS
AMCEN African Ministerial Conference on Environment
CAR Central Africa Republic
COM Council of Ministers
IMCC Inter Ministerial Coordinating Committee
IWRM Integrated Water Resources Management
LCB Lake Chad Basin
LCBC Lake Chad Basin Commission
MDG Millennium Development Goals
NAP National Action Plan
SAP Strategic Action Program
TDA Transboundary Diagnostic Analysis
TTT Technical Task Team
UNEP United Nations Environment Program
WSSD World Summit on sustainable Development
HNCE High National Committee for the Environment (Chad)
MEE Water and Environment Ministry (Chad)
MMEP Ministry of Agriculture, Mines, Energy and Oil (Chad)
STEE Society for Water and Electricity (Chad)
DREM Department of Water Resources and Meteorology (Chad)
CBDA Chad Basin Development Authority (Nigeria)
HJRBDA Hadejia Jama’are River Basin Development Authority (Nigeria)
NEAZDP North East Arid Zone Development Program
KYB Komadugu Yobe Basin
IWRM Integrated Water Resources Management

17
CSO Civil Society organizations
EIA Environmental impact assessment
RBDA River Basin Development Authority

18
1 INTRODUCTION
1.1 CONTEXT
The Lake Chad Basin, which is the largest area of inland drainage basin in Africa, is situated
in West/Central Africa region between 6° to 24° N and 8° to 24° E. It comprises a vast
expanse of land made up of several catchments that feed Lake Chad. Figure 1.1 shows a
general map of the Lake Chad Basin, while figure 1.2 shows the LCBC member countries.
UNEP (2006) reported that, based on EROS Data Center 2002, the entire geographical basin
covers an area of about 2,500,000 km2. This is about 8% of the surface area of the African
continent, shared between the countries of Algeria, Cameroon, Central African Republic
(CAR), Chad, Libya, Niger, Nigeria, Sudan, Algeria and Libya. It constitutes a strategic source
of freshwater for the countries, which is central to the livelihoods in the basin.
Figure 1.1 Administrative and Conventional Lake Chad Basin

19
Figure 1.2 LCBC Member States
Source: Impact Assessment, Inc
For about four decades today recurring droughts, a general decline in rainfalls, and degradation of the vegetation cover have led to drastic changes in the environmental conditions of the Lake Chad Basin. The drying up of Lake Chad, the encroachment of the desert, and the decline of agriculture, livestock and fisheries, threatens the social and economic well-being of the over 15 million people living in the Lake Chad Basin. Considering these threats, the African Ministerial conference on Environment, AMCEN, decided at its inaugural meeting in 1985 to support "the Lake Chad Basin Commission for the integrated development of Lake Chad Basin, in order to halt the drying up of Lake Chad and use its waters and ecosystems rationally" as one of the "priority sub-regional activities". The Committee on River and Lake Basins (CORLAB, established by AMCEN) has also given priority to Lake Chad.
Due to the growing seriousness of the situation in the Lake Chad Basin a Conference of the Ministers of Environment of the Lake Chad Basin countries, held at Maroua in 1988, requested UNEP to prepare the Diagnostic Study on the Environmentally Sound Development and Management of the Water, Land, and Biological Resources of the Lake Chad Basin. By defining specific environmental problems and their impacts and outlining possible solutions, the Diagnostic Study is to contribute to a Plan of Action for

20
Environmentally Sound Management of the Lake Chad Basin (CHADPLAN). Its implementation activities were to be financed jointly by the riparian governments, UNEP, other UN organizations, and various donor countries and non-governmental organizations.
It should be noted that the hydrology and water resources of the Lake Chad Basin have been the subject of several previous investigations even ahead of the above decision, including the 15-year long (1964 – 1979) investigations by ORSTOM, the UNESCO "Study of Water Resources in the Chad Basin" (1970), the FAO "Survey of the Water Resources of the Chad Basin for development Purposes" (1972), the UNDP's "Lake Chad Basin Development Study" (DRN 1979), and several others.
Kindler et al (1989) completed the diagnostic study recommended by AMCEM in 1988. Since then, and sprouting from this, the Lake Chad Basin Commission has acquired the assistance of the Global Environment Facility (GEF) to move forward the programme of reversing the land and water resources degradation trends prevalent in the Lake Chad Basin, through the LCBC-GEF programme on the reversal of degradation trends in the land and water resources of the LCB.
This Transboundary Diagnostic Analysis, a key output of the the LCBC-GEF programme, is centred on the transboundary environmental problems that need to be addressed jointly by the international community and the LCBC member states, if the degradation trends are to be reversed. It was conducted through a participatory process (Chapter 2) designed to engender stakeholder ownership of the output, as well as underpin the strategic action programme (SAP) that the LCBC stakeholders will formulate during the next stage of the project.
The descriptive background material in here draws heavily on the earlier studies of Kindler et al (1989) and Impact Assessment, Inc. (2006).
1.2 LAKE CHAD CONVENTIONAL BASIN
The initial conventional basin consisted of approximately 20% (427,500 km2) of the total area of the Lake Chad basin (i.e., it excluded the majority of the terminal depression consisting of desert that provides little or no effective hydrological contribution to the conventional basin). This was subsequently expanded to include additional watersheds in northern Nigeria, southern Chad, and northern Central African Republic, with a current total area of 967,000 km2. Lands within the Chad portion of the conventional basin represent approximately 34 percent (361,980 km2), Cameroon 6 percent (56,800 km2), Niger 17 percent (162,375 km2), Nigeria 19 percent (188,000 km2), and Central African Republic 22 percent (197,800 km2) of this total land area.

21
Table 1.1 Surface Area of the Basin Among the LCBC Member Nations
State Size of Basin (km2) % of Conventional Basin
% of National Territory
Cameroon 56,800 6.0 12.12
Niger 162,375 17.0 12.70
Nigeria 188,000 19.0 22.15
Chad 361,980 36.0 28.42
CAR 197,800 22.0 31.75
Total 967,000 100 -
A framework for economic cooperation and integration built around the shared resources of Lake Chad has been well perceived even if not achieved. This was demonstrated by the political leaders of Cameroon, Chad, Niger and Nigeria who, through a Convention and Statutes signed at Fort Lamy (N’djamena) on May 22, 1964, brought about the establishment of an intergovernmental organization - Lake Chad Basin Commission (LCBC) - for the development of the Lake Chad Basin.
1.3 THE NEED FOR A COMMON VISION
The Fort Lamy Convention recognizes the sovereign rights of each Member State over Basin water resources within its own territory but forbids unilateral exploitation of lake water where such a use jeopardizes the interests of other member States. Member States are, therefore, required to abstain from measures likely to alter the water budget, water quality, integrated water resources management, or water access by other Member States. The Convention also recognizes the right of Member States to plan projects within the “Conventional Basin” in consultation with the LCBC.
The LCBC has a broad mandate including, inter alia, provisions related to prior notification, the monitoring of progress of studies and works related to water resources, and the authority to examine complaints and contribute to the resolution of conflicts and differences of opinion among Member States. In practice, however, Member States have at times appealed to other authorities to address Basin-related issues without the involvement of the LCBC, even though these issues are within the LCBC mandate (Hodge, 2006). During the 49th Session of Council of Ministers (COM) held in Yaoundé on 14-15, January 2002, a decision was taken to restructure the Lake Chad Basin Commission (LCBC). As follow-up to the decision, two new resolutions were passed during the 50th Session of the COM - Niamey 27-28, February 2003, during which representatives of the Lake Chad Basin Commission

22
(LCBC) Member States agreed to undertake an assessment of the LCBC basic agreements and organizational framework. The GEF project, Reversal of Land and Water Degradation Trends in the Lake Chad Basin, was deemed the appropriate platform for this initiative.
These actions represented a departure from the geopolitical context that prevailed until late 1990s. This context is particularly marked by the adoption of the Millennium Development Goal (MDG) as declared at the World Summit on Sustainable Development (WSSD) held in Johannesburg 2002 on the new approach to the governing of resources: the integrated water resources management (IWRM) to tackle the growing threat of dramatic reduction in water resources over the years. The new policy, the IWRM can be defined as a shared vision based on consultation and cooperation among the riparian States as well as reciprocity and solidarity in the elaboration of policies, programs and projects of water, land and related resources. This is to ensure equity, while taking into consideration the diversity of uses and preservation of the ecosystems. It requires careful consideration of not only national issues but also transboundary problems. Transboundary issues are those shared across borders with neighboring riparian countries that need to be addressed collectively to improve overall conditions in the basin.
1.4 OBJECTIVES OF THE TDA
The production of this Transboundary Diagnostic Analysis (TDA), which is to be followed by the preparation of a Strategic Action Program (SAP) for the LCB, is in fulfillment of a requirement for most projects intended to be financed from the GEF International Waters Focal Area, as it is in this case .
This TDA is the product of a scientific and technical fact-finding analysis that scaled the relative importance of sources, causes and impacts of transboundary water problems in the LCB. It is an objective assessment and not a negotiated document. It is visualized as a prerequisite for the design of interventions intended to reverse the trends of degradation of land and water in the LCB. The following are therefore the specific objectives of this TDA:
Identification, quantification, and prioritization of the environmental concerns in the LCB that are transboundary in nature; and
Identification of their immediate, intermediate and fundamental or root causes. That is, the identification of causes, specific practices, sources, locations and human activity sectors from which environmental degradation arises or is threatened, as well as the driving forces behind them.
This TDA provides the factual basis for the formulation of a SAP, which will embody specific actions (policy, legal, institutional reforms or investments) that can be adopted nationally, within a harmonized multinational context, to at least address the top priority transboundary concern(s) and over the longer term restore or protect the Lake Chad Basin transboundary ecosystem.
It thus provides the Lake Chad Basin Commission (LCBC) with the foundation for the logical development of a SAP that will be based on a reasoned, holistic and multi-sectoral consideration of the problems associated with the state of and threats to transboundary

23
water systems. Furthermore, it will serve as a valuable vehicle for multilateral and multinational exchanges of perspectives and stakeholder consultations that constitutes a precursor to the eventual formulation and implementation of a SAP to address the real causes of land and water degradation in the Lake Chad Basin.

24
2 TDA APPROACH
2.1 TDA METHODOLOGY
This TDA has been developed through a scientific and technical process of fact-finding (or diagnosing) the state of, and threats to, international waters as it relates to the Lake Chad Basin. The process was based on undertaking the following exercises at two levels: first on the level of individual member states anchored by national Technical Task Teams (TTT), and secondly at the level of the LCB region anchored by a combination of the LCBC-GEF PMU, the national TTTs and an international consultant:
Information and data ‘stock taking’ exercise: In each member country the national TTT took stock of all existing information pertaining to land and water resources management in their respective diagnostic sub-basins. Termed as a meta data study, the exercise ascertained sources of information/data, their availability and gaps in knowledge.
Among the key sources of existing information on the LCB that have been of immense use in the preparation of the TDAs is the work by Chandler et al. (1989), ‘A Diagnostic Study of Environmental Degradation in the Lake Chad Basin.’
Identification and initial prioritization of transboundary problems: In each country a wealth of information/data was found, enabling the TTT members, in collaboration with an inter ministerial coordinating committee (IMCC), to effect an initial identification of transboundary issues, their impacts and consequences, in spite of the gaps in knowledge that were identified from the available information/data. The IMCC is a broad based coalition of stakeholders identified for the participatory implementation of the LCBC-GEF pilot projects in their respective countries. Catalyzed by the TTT, the individual national IMCCs and other stakeholders also prioritized the identified transboundary issues through a step wise approach to joint fact finding.
Analysis of causes, impacts/consequences of each transboundary problem: Anchored by the individual national TTTs, the IMCC and other stakeholders did a causal chain analysis for each of the prioritized transboundary problems. Through this exercise, a shared understanding of the whole chain of symptoms, causes and effects related to each problem was arrived at among the stakeholders in each country.
The transboundary environmental problems identified in each country, their prioritization, and the analysis of their impacts and consequences are presented in Annex 1 to this report, which is a compendium of the national level TDA reports prepared by the national TTTs. In general, the transboundary problems identified pertain to those that can be effectively addressed only if at least two countries

25
jointly work together, although issues that were common to the member countries but which could generally be tackled at the level of individual countries were also included. The immediate causes identified were also primarily technical in nature and were more readily quantified and geographically located. Also the identified underlying causes were those that contributed to the immediate causes and can be broadly defined as aspects of sectoral resource uses and practices, and their related social and economic causes. Furthermore, beyond the sectoral causes the root causes identified often pertain to macroeconomic, consumption patterns, environmental values, access to information and democratic processes. This said the immediate, underlying and root causes have been intermixed in some of the reports.
Final prioritization of transboundary problems: The individual national TTTs were brought together to examine the national TDA reports they prepared for their respective countries, in September 2006 in Maroua, Cameroon. Through a consultative process anchored by an international consultant, each national TTT was enabled to identify a maximum of five transboundary problems considered to be of paramount importance from their national perspectives, after a consideration of each national TDA, and acquiring a clearer understanding of what constitutes transboundary problems, and their various types of causes. With further facilitation by the international consultant, the priority problems presented from national perspectives were integrated into seven transboundary problems considered by all the countries to be of critical importance for addressing the degrading trends in land and water resources in the LCB. The combined group of national TTTs, through working groups, each of which was constituted by representatives of each member country, performed a causal chain analysis of the commonly agreed transboundary problems. Based on the outcome of this exercise, the problems were prioritized by the combined group.
Governance analysis: The term ‘governance’ is shorthand for the whole political environment: institutions, laws, policies and projected investments that affect environmental problems. The analysis of these is known as governance analysis. An important aspect of governance analysis is finding out where decision-making power really lies, and how the mechanisms actually work, as opposed to how they are supposed to work. In carrying out the causal chain analysis, many cross-cutting underlying causes were found to be governance issues.
This analysis was performed by each national TTT working with national stakeholders for each country, and then by the combined team of TTT members for the region. The results are integrated in the national TDA reports and in this regional TDA.
2.2 COORDINATION AND CONSULTATION PROCESS
The preparation of the national TDAs that laid the foundation for the preparation of this regional TDA was preceded by full consultations with all stakeholders. Four key points that underpinned each national TDA preparation exercise with the stakeholders are:
Joint fact-finding;

26
Prioritisation;
Participation; and
Consensus.
The approach did not only prove to be an effective way of achieving desired progress, it also acted as an effective means of enabling national/stakeholder ownership of the process and the product, which is a prerequisite for the development and implementation of the NAPs and SAP.
The following actions were structured and undertaken to facilitate coordination and consultation between various players at all levels:
Identification of stakeholder groups and exchange of ideas with local stakeholders: This was done through a stakeholder analysis, carried out in each country to select and execute local pilot initiatives that were to receive small grants from the project. This was primarily to stimulate the participation of local groups in the analysis of critical issues to address. This was to have been concluded by July 2006.
Using pilot projects to create/strengthen stakeholder forums to discuss critical issues and their causes and consequences. The allocation of small grants to address some of the emerging issues was expected to create good opportunities to strengthen the engagement of stakeholders.
Monitoring and follow up of ongoing activities: The LCBC/PMU undertook regular field visits to perceive evidence of key problems and discuss with local user groups. The results of this consultation have been used to gain improved understanding of the impacts of the pilot projects and the lessons learned which have been incorporated into the national TDA reports and the regional TDA.
The Project National Coordinators played key roles in sharing the TDA process with all local stakeholders during the field visits. They organized ad hoc fora to provide opportunity for exchange of ideas about critical issues regarding land use and water management.
Meanwhile, the following officials and structures, shown in table 2.1 below, were fully or will be fully involved in the process:
Table 2.1 officials and Structures Involved in the TDA Process
LCBC First Commissioners
Kept informed
27
LCBC Second Commissioners
The National Coordinators reported directly to them
LCBC Executive Secretariat Coordinated the whole TDA/SAP process
Interministerial Coordinating Committees (IMCC)
Participated in identification, prioritization and analysis of issues
Project Steering Committee (PSC) Discussed the TDA at its formal meetings
National Experts or Technical Task Teams (TTT)
Anchored the inputs to and preparation of the national TDAs
Council of Ministers (LCBC-COM) The regional TDA is to be presented to them at a ministerial session
Public involvement To be facilitated through the mass media & stakeholder fora
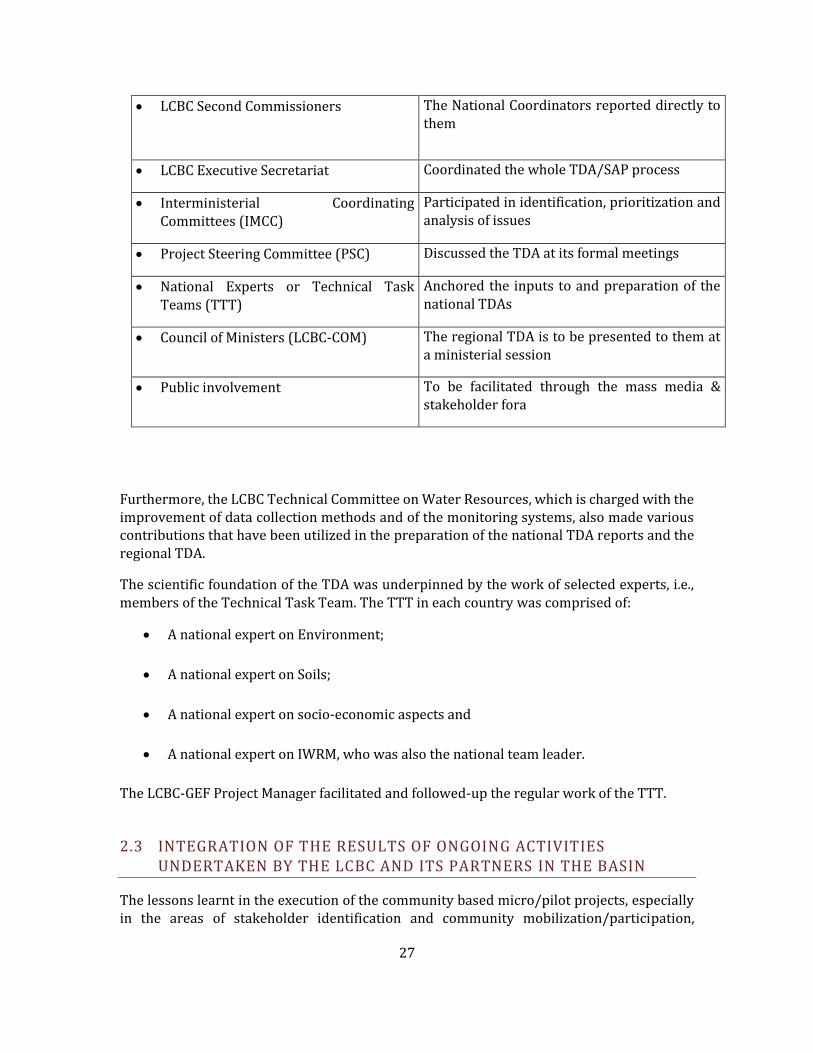
Furthermore, the LCBC Technical Committee on Water Resources, which is charged with the improvement of data collection methods and of the monitoring systems, also made various contributions that have been utilized in the preparation of the national TDA reports and the regional TDA.
The scientific foundation of the TDA was underpinned by the work of selected experts, i.e., members of the Technical Task Team. The TTT in each country was comprised of:
A national expert on Environment;
A national expert on Soils;
A national expert on socio-economic aspects and
A national expert on IWRM, who was also the national team leader.
The LCBC-GEF Project Manager facilitated and followed-up the regular work of the TTT.
2.3 INTEGRATION OF THE RESULTS OF ONGOING ACTIVITIES UNDERTAKEN BY THE LCBC AND ITS PARTNERS IN THE BASIN
The lessons learnt in the execution of the community based micro/pilot projects, especially in the areas of stakeholder identification and community mobilization/participation,

28
provided useful insights for the identification and analysis of the impacts and consequences of the transboundary problems. For example, based on experiences from the pilot projects in Nigeria the geographical spread of the problem of channel siltation and its consequences were appreciated. Likewise, it was through lesson learning from the experiences of the IUCN-Hadejia Nguru Wetlands Conservation Project in Nigeria that the national TTT, IMCC and other stakeholders gained a deeper understanding of the impacts of decreasing viability of biological resources, as well as an understanding of water pollution. These lessons have been reflected in the preparation of the TDAs.

29
3 BASELINE INFORMATION ON THE LAKE CHAD BASIN
3.1 GEOGRAPHICAL SCOPE
Lake Chad is Africa’s fourth largest lake, the largest in Western and Central Africa. The lake is fed by the following rivers: Chari/Logone, which originates from CAR and supplies approximately 95% of the lake’s surface water input; Komadugu-Yobe which flows in from northern Nigeria, and considered to be of minor significance to the whole of the basin, yet locally significant to the northern reaches of the Lake Chad wetlands; and the Ebeji and Yedseram, which also contribute very small inflows. Figure 3.1 is a drainage map of the basin.
Source: Impact Assessment, Inc
Figure 3.1 A Drainage Map of Lake Chad Basin

30
The lake is shallow, with an average depth of 1.5 meters, and is of relatively small volume. The lake is subject to considerable evaporation and yet is not saline. The total inflow is extremely variable, ranging from a high of 54 km3/year (1955/56) to low of 7 km3/year (1984/85).
Although the most pronounced feature of the Lake Chad Basin is the presence of “wetlands in dry lands” (see Woodhouse, Bernstein, Hulme, and others 2001) by far the largest area is comprised of dry lands in varying degrees of aridity, from desert to savanna. On the other hand, both human and wildlife populations and communities are concentrated in wetland areas. Again, however, those areas contain a wide variety of environmental conditions, from upstream irrigated agriculture to seasonally flooded riverine wetlands to open lake aquatic environment.
The basin is closed with two exceptions. In wet years, during flood time, some water of the Logone River flows off past the Gauthiot Falls towards the southwest to reach the Niger River through its tributary, the Benue. At exceptionally high stages of the lake, some water may also be drained toward the Nile Basin via the Bahr el Ghazal. More than two-thirds of the geographical basin is situated in an arid zone and does not contribute actively to the surface flow towards Lake Chad.
3.2 CHARACTERISTICS OF LAKE CHAD SUB-BASINS
The Lake Chad Basin has commonly been subdivided into eight planning units or diagnostic basins that make more sense from development, conservation and planning points of view. The diagnostic basins are: Lake Chad including Kanem lakes, Lower Chari, Lower Lagone including the Yaeres and El Beid, Mayo Kebbi and other Mandara mayos/rivers, Borno Drainages, Komadugu-Yobe, Northern including Bahr el Ghzal, and Lake Fitri. Figure 3.2 shows the diagnostic basins, while Table 3.1 summarizes their characteristics.

31
Source: IUCN-ROCA
Figure 3.2 The Diagnostics Basins of the Lake Chad
32
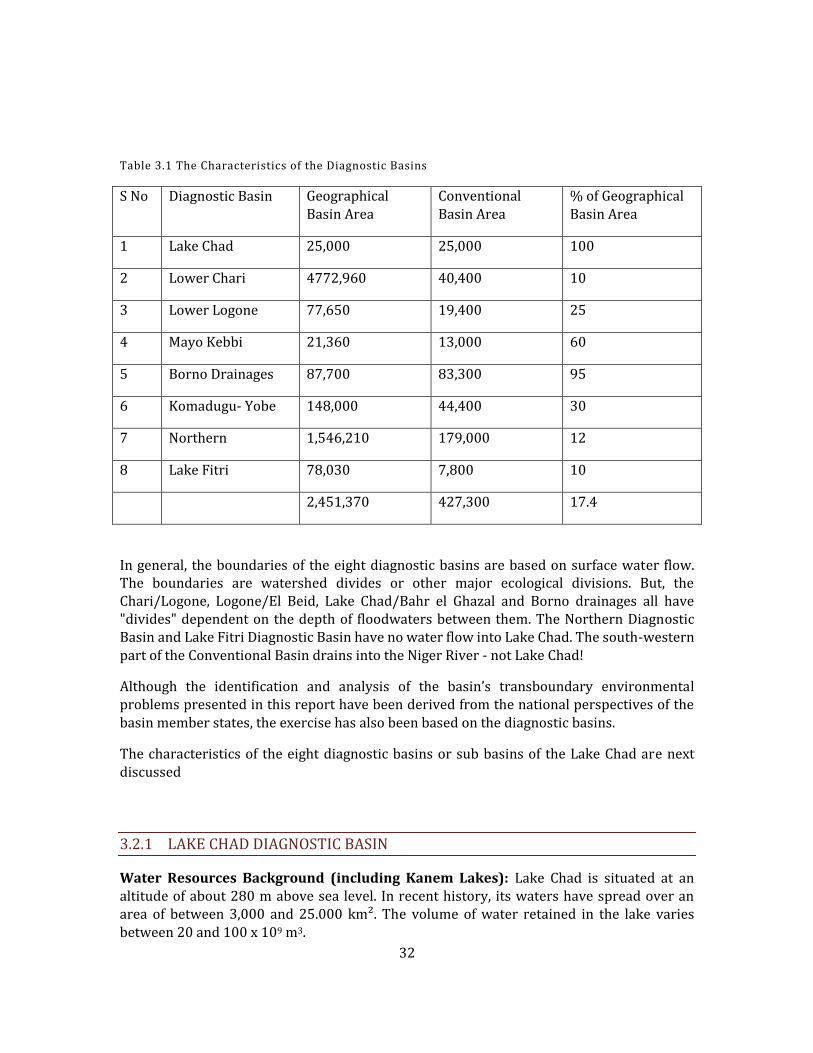
Table 3.1 The Characteristics of the Diagnostic Basins
S No Diagnostic Basin Geographical Basin Area
Conventional Basin Area
% of Geographical Basin Area
1 Lake Chad 25,000 25,000 100
2 Lower Chari 4772,960 40,400 10
3 Lower Logone 77,650 19,400 25
4 Mayo Kebbi 21,360 13,000 60
5 Borno Drainages 87,700 83,300 95
6 Komadugu- Yobe 148,000 44,400 30
7 Northern 1,546,210 179,000 12
8 Lake Fitri 78,030 7,800 10
2,451,370 427,300 17.4
In general, the boundaries of the eight diagnostic basins are based on surface water flow. The boundaries are watershed divides or other major ecological divisions. But, the Chari/Logone, Logone/El Beid, Lake Chad/Bahr el Ghazal and Borno drainages all have "divides" dependent on the depth of floodwaters between them. The Northern Diagnostic Basin and Lake Fitri Diagnostic Basin have no water flow into Lake Chad. The south-western part of the Conventional Basin drains into the Niger River - not Lake Chad!
Although the identification and analysis of the basin’s transboundary environmental problems presented in this report have been derived from the national perspectives of the basin member states, the exercise has also been based on the diagnostic basins.
The characteristics of the eight diagnostic basins or sub basins of the Lake Chad are next discussed
3.2.1 LAKE CHAD DIAGNOSTIC BASIN
Water Resources Background (including Kanem Lakes): Lake Chad is situated at an altitude of about 280 m above sea level. In recent history, its waters have spread over an area of between 3,000 and 25.000 km². The volume of water retained in the lake varies between 20 and 100 x 109 m3.

33
Although Lake Chad is a closed basin within an arid zone, it has relatively low salinity because (1) there is no limestone in the watersheds and the river water carries a low ionic load; (2) biogeochemical sedimentation occurs in the lake, reducing salts by 45%; (3) considerable infiltration helps leach salts from the lake (especially in the north pool); (4) mollusks help regulate calcium ions by shell formation; (5) macrophytes help regulate potassium and silicates by plant growth; (6) diatoms also help regulate silicates.
The lake consists of two morphologically distinct pools. They become fully visible at a water surface elevation of about 279 m. At this elevation, a ridge known as Grand Barriers is visible between Baga Kawa and Baga Kiekra, subdividing the lake into two, a northern and a southern pool.
The lake receives over half of its annual water supply between September and November. This seasonal inflow pattern, coupled with a much more uniform evaporation, causes water level fluctuations of 1 to 2.5 m to occur every year. The average annual inflow to the lake is equal 38.5 x 10⁹ 83, but it has varied from about 7 x 10⁹ m3 (1984/88) to about 53 x 109 m3 (1961/62). During this period, lake levels and corresponding surface areas varied from a low of 275.35 m and less than 3,000 km² in 1984, to a high of 283.41 m and almost 26,000 km² in 1962. Even at the highest water levels, the lake has a large number of islands, and the percentage of the free water represents only about 70 percent of the total area of the lake. The average annual inflow to the lake is in the order of 2/3 of the average volume of water retained in a "normal" year as defined by ORSTOM.
All policies for the lake should be based on four understandings:
- large areas of the lake bed are likely to emerge or be flooded from one year to the next;
- the northern pool is more lake-like; the southern pool is more of a riverine delta;
- in wet years, the northern pool will be more stable than the south pool; in dry years, only the Chari delta will be flooded;
- profound changes in the ecological zones will always accompany the changes in this shallow lake. Some ecological zones may even temporarily disappear.
Regarding Kanem: Dunes that are maximally 20 to 40m deep dominate the landform. There is no directional flow between the seasonal and permanent lakes and ponds. They cover the bottoms of an ancient fixed erg. Viewed in terms of environmental degradation, there are two types of ouadis which require different strategies:
(1) the isolated ouadis in steep-sloped depressions separated by moving sand (e.g., Nokou, Mao).
(2) the more or less open ouadis such as the Bahr el Gahzal which is discussed under the Northern Diagnostic Basin.
The bottoms of ouadis (as opposed to simple dunal depressions) have a non-sandy soil and a water table between 3 to 10 m from the surface. The isolated ouadis have silty or silty-sandy soils in the bottom. Water levels depend on rains, as well as the water tables of Lake

34
Chad and the Bir Louri (Chirati water table). Even though some ouadis have a three cycle crop season, there appears to be no loss of fertility.
Spirulina, the harvested algae used to make proteinaceous sauces, thrives in the meso-carbonated to the most carbonated water bodies in the wadis.
In the south, some ouadis have doum and borassus palms as well as A. Senegal. Recently, Prosopis and Parkinsonia have been planted. The grass layer varies with rainfall and has changed dramatically since the drought.
The ouadis also support date palm orchards, bananas, guavas, and citrus. Only the oligocarbonated water can support fish (Tilapia, Hemichromis and Parophiocephalus). Waterbirds visit the lakes opportunistically. Hippos are rare but do appear.
Water Resource Concerns: The shrinkage of Lake Chad in the 1980s imposed serious constraints on the operation of the South Chad Irrigation Project (SCIP) in Nigeria, the largest irrigation scheme that is dependent on the lake’s fresh water resources. There are serious doubts about the future of the project, which is presently moribund, due to the highly variable levels of the lake, which in turn is tied to variability in inflow from the contributing rivers.
A major environmental concern in analyzing all impacts on Lake Chad is salinity control. The maintenance of this salinity is dependent on the "extra" flow necessary to accomplish leaching; enough flow to maintain dilution of lake water from previous years; and enough detritus (dead plant/algae material) to stimulate the biogeochemical sedimentation. This concern has not yet been addressed in the policy dialogue of LCBC.
Ecological Resource Background: There are three main landscapes within the lake that vary in extent with the water type-year: the archipelago of islands on the east side, which are really the tops of dunes of a widely submerged erg; islands of vegetation (some floating, some rooted) with Cyperus or Phragmites as dominants; and areas of open waters.
The lake's shallowness has led some researchers to describe "Lake" Chad as no more than a deep wetland. This is supported by the fact that the fish species are all derived from river-adapted species.
There are 120 species of fish in the lake and the backwaters of the Chari delta. The distribution of these fish changes according to the distance from the Chari, El Beid, and, formerly, the Komadougu-Yobe delta, and the landscape type (archipelago, open waters, vegetative islands). The open waters support fewer fish than the archipelago.
During wet years, the north basin supports more fish than the south because of its greater depth. During dry years, the depressed volume of the lake concentrates fish, reduces breeding habitat and shelter for juveniles, and increases competition and vulnerability to fishing gear. Shallowness promotes resuspension of sediments that kills fish by blocking their gills or reducing oxygen. The north pool dries up first and fish cannot move to the south pool because an anoxic barrier forms from the rotting plant life along the Grande Barriere. Because no species appears to be restricted to "Lake" Chad, regeneration of stocks is possible as long as floodplain habitat (the yaeres) remains intact and fishing is controlled.

35
The lake is globally significant for avian biodiversity. 372 species of birds have been inventoried on the lake
Ecological Resource Concerns: The Lake supports hippopotami, otters, and sitatunga. The sitatunga, a swamp-adapted antelope, is of some conservation concern. Some elephant herds enter the lake bed seasonally. The Lake is also important as a resting ground for intra-African and inter-continental bird migrants. Protection of Lake and lake shore habitat for these species is a major concern.
There are two protected areas along the lake shore: the Douguia National Park in Chad and the Lake Chad Sanctuary in Nigeria.
Human Resource Background: The Lake itself supports the following:
(1) a major fishery shared by all nations either adjacent to its shores or who engage in trade;
(2) a major livestock industry which depends on seasonal entrance into the lake bed for forage;
(3) a variable transport industry that occurs only at high lake levels;
(4) an undocumented gathering "production system" based on doum palms subirrigated by the lake, aquatic plants, and salt flats;
(5) A morribund modern agriculture along the shores of Nigeria that pumped water from the lake for irrigation and the cooling systems for electricity generation;
(6) a wildlife heritage and possible tourist industry consisting of wetland birds, crocodiles, hippos, elephants, and the sitatunga;
(7) a passive "pollution" control system that keeps Lake Chad water from becoming too saline;
(8) a groundwater recharge system that is little understood but may supply the polder agricultural developments on the northeast shores of the lake.
(9) Residual moisture (polder) cultivation of wheat, sorghum, maize, potatoes, cow pea and vegetables.
The lake shore and the insular areas were once dominated by Buduma, but with the retreat of the lake, communities of Kotoko, Kanuri, Hausa, and others have pioneered agriculture in the lake bottom.
3.2.2 LOWER CHARI DIAGNOSTIC BASIN

36
Water Resources Background: Annual run off values which range from 17.0 to 5.0 x 10⁹ x M3, decrease substantially moving eastward to the more arid north-eastern parts of the basin. The eastern boundary of the Chari Basin is a region considerably drier than the other sub-catchments, and does not substantially affect Lake Chad levels. The most influential sub-catchment is that of the Baha Sara which joins with other tributaries downstream of the City of Sahr. This catchment, although less than half the area of the southwestern Bahr Aouk system converging around Sahr, provides nearly twice as much water to the Chari. Thus it must be regarded as the most important collecting area, and every effort should be made to conserve its water resources.
The lower Chari comprises about 600 km of the river between Sahr and N'djamena. At low flows the Chari is contained within its banks and meanders within its coarse sandy bed. At high flows, however, there are several overspills. Especially important is the right bank overspill near Miltou; it is collected by the Bahr Erguig which wanders through extensive inundation plains of Massenya before finally discharging back into the Chari 300 km downstream from Miltou.
The Chari delta proper begins immediately downstream of Ndjamena, 140 km from the Lake Chad, where the Serbewel River branches off from the left bank and follows its own course to the lake. The annual runoff of Serbewel River varies from 1.3 to 3.9 x 10⁹ m3.
Ecological Resources Background: This diagnostic basin has the largest permanent river. Its soils derive from ancient deltas, the southern mountains, the lake bottom soils of ancient Lake Chad, and ancient eolian sand dunes from the north.
Three soil groups are of particular interest to those concerned with environmental degradation. Along the river channels and embankments there are weakly developed soils formed from deposition or hydropmorphic soils. In the ancient delta and Massenya basin, the extensive hydromorphic soils with a surface of pseudo-gley, and the leached alkali soils, occur. These soils are extremely fragile. Already, by 1964, many of these soils were free of vegetation. The other major soil group is the brown soils (some with weakly developed brown or reddish brown fades; others with weakly leached ferruginous fades).
The diagnostic basin spans the Sahelo-Sudanien zone and the Sudano-Sahelian zone. In general, the line between the zones oscillates north and south around the town of Massenya. Almost the whole diagnostic basin supports shrub steppes, shrub savannas and wooded savannas. There is one National Park (Dougia) and one Faunal Reserve (Mandelia) along the right bank of the Chart. The Mande National Park and the Yimbe Classified Forest border the southern boundary of the Diagnostic Basin. The status of theoretically protected forests is uncertain.
Human Resources Background and Concerns: The lower Chari is home to a large number of ethnic groups. The principle agricultural and agro-pastoral groups include the Kotoko, Baguirmi, Massa and related groups (Sara, Hadjerai, etc.) Pastoral groups include Shuwa Arabs, Peul and other transhumant Arab groups from the Kanem sub-basin.
In the conventional basin, the Baguirmi live on the upper course of the right bank of the Chan where transplanted sorghum- and millet-based agriculture fishing and pastoralism are mixed. The zone is a transhumant corridor for populations from the Batha on their way

37
to the Salamat. Kotoko semi-sedentary fisher agriculturalists and semi-sedentary Arabs (Choa) live in its lower course. A variety of small agricultural groups distinguished by village and language live on the left bank. In the upper reaches cereals, tuber crops, and rice are grown. Population density is not high.
Populations have traditionally had to face certain resource constraints The water table varies from a few meters in the low lands to 45 m or 50 m over basement complex rocks in the Baguirmi region. Elsewhere there is basement complex rock in which water is scarce. Local water scarcity may provoke problems between transhumants and agriculturalists in the period before the grain is harvested. Alkaline soils unsuitable for agriculture are not uncommon, but seasonally inundated hydromorphic soils are characteristic. Economic diversification i e cultivation of hydrophilic sorghums and millet, seasonal hunting, fishing and intensive stock rearing (Massa), is the traditional response.
3.2.3 FLOOD PLAINS OF THE LOGONE
Water Resources Background: Although the Logone river is a tributary of the Chari, it is considered a major river in its own right in view of its specific characteristics. The river rises in the Adamaoua Mountains in Cameroon at a height of about 1,200 m, and the area of the Logone Basin is estimated at 77,650 km².
The hydrological data indicate that the peak flood of the Logone is extremely regular before it joins Chari above N'djamena and that whatever the magnitude of flood in the upper catchment, there is little variation in the river's flow downstream. This reduction of peak flows is due to the natural attenuation through storage in the vast flood plains which occupy approximating 25,000 km². The most significant of the flood plains is the Grand Yaeres, which is about 5,000 Km2 in area.
The Logone River begins to overflow its banks when the river gauge at Laï-Mission goes beyond 4.60 m (the altitude of "0" is 350.31 m above sea level). Overflows occur mostly from mid-August to mid-October. Up to the early 1970s, the flooding invariably took place with a duration of submergence sufficient to enable paddy cultivation. The droughts of the 1970s and 1980s made paddy cultivation very problematic.
El Beid River, locally known as the Ebeji, forms part of the border between Nigeria and the Cameroon. It drains an area of approximately 22,640 km". This stream flows most of the year, beginning in June or July and ending in the following May. Peak discharge occurs in November or December. The El-Beid is by far the largest Nigerian river flowing into Lake Chad, but its water comes mostly from the Cameroon. Three main sources of water that feed it are: (1) direct runoff from the Mandara Mountains, (2) flood overspill from the Logone River into Yaeres, and (3) relatively small overspills from the Serbewel River. The lower reach of the river has moved progressively to the west, resulting in a wide stretch of abandoned channels all following westerly courses. These channels break up in the north and enter the lake on the delta. Flow to the el Beid from the Logone is estimated to begin when flows reach 1500m3. Duration and size of flow contributed by the Logone vary widely.

38
Hydrologically, the Grand Yaeres act as a large natural compensation reservoir, lowering and extending flood flow and generally providing more uniformly distributed inflow to Lake Chad. At the same time, the Yaeres' large-scale and shallow inundations result in major channel flow losses due to infiltration, evaporation and evapotranspiration. The flood waters "irrigate" the pastures and recession agriculture fields, recharge the water table, and create habitat for fisheries reproduction and growth. Largest area inundation has been estimated at 8,000 km². Typically, flooded land will be covered for a period of time with surface water about 0.7m deep.
The Grand Yaeres, is the most productive of all the inundation areas in the Lake Chad Basin in terms of fisheries, livestock, and non-systematic flood-retreat cropping. During the dry season, when grazing space is scarce elsewhere, the Grand Yaeres provide a most valuable alternative source of food and water for the animals. The ponds that remain after the water has receded are also important for fishing activities in the area.
Water Resources Concerns: The Maga Dam intercepts the Mayo Tsanaga and Mayo Boula. It is also fed by a canal from the Logone. It has blocked runoff onto the yaeres causing a permanent artificial drought. Poor design and environmental impact analysis characterizes this water project. For instance, a by-pass or overflow structure could have been incorporated into the design which would have allowed downstream flooding, pasture irrigation, forest growth, wildlife support, and fisheries. The poor design hurt both economics and conservation. This issue is currently being tackled through a pilot project.
Ecological Resources Background: The Logone floodplains ("Yaeres") cover 8,000 km2. They are very flat and are "irrigated" by the overflow of the Logone floods, the mayos from the Mandara mountains, and rainfall, which begins in mid-July. The extent and duration and height of flooding determine the economics of the yaeres including fisheries, grazing and agricultural productivity. In a year of above 1500 m3 flooding (and before the construction of dikes and dams), 850,000 tons of clay/silt/mineral sediment were deposited on the Yaeres. This is its major source of "natural" fertilizer.
The floodplains have few trees. The shrub/grassland is interrupted only by marshes in depressions and villages at higher elevation. The flood levels vary between 0.7 and 1m. The grasses of the Yaeres include Eragrostis sp., Panicum, Setaria, Sorghastrum sp. and Hyparrhenia rufa. The pockets of Echinochloa ("bourgu") are especially important to the pastoralist herds.
The soils (mostly vertisols and hydromorphic soils with calcium nodules and slumping) and extreme flatness are not particularly susceptible to erosion. There are only scattered alkaline soils and bands of sandy ferruginous leached soils. Drought years have changed plant species composition, but have not eliminated the grass and tree canopy.
The diagnostic basin has flooded sparse wooded savannas on the vertisols, forming "islands" on the sandy soils. There is a grass savanna on the gleyed hydromorphic soils. The leached red/brown soils support a shrub savanna with termite mounds or a wooded savanna with Daniella and Burkea.

39
The dry season ponds and the flooding of the Yaeres contain two different fish fauna: marsh/pond residents (transverse migrants) and lake/river (longitudinal) migrants. In wet years, a 2000 m² pond can yield 8 tons of fish. The flood is especially important to the dispersal of juveniles of about a dozen species crucial to fisheries production. Alestes sp., Labeo sp. and Distichodus sp. are typical of the migratory fish requiring the flood and floodplains to successively grow and reproduce.
The flooded soils provide some of the best pasture in the basin. The pockets of bourgu and the marshes provide additional grazing. Herders come from Niger, Nigeria, Chad and South Cameroon; 90% of cattle are from Cameroon. The Yaeres is crucial to Diamare and, to a lesser degree, neighbouring departments.
The El Beid floods from rainfall, Mandara mayos and the Logone, when its flow is greater than 1500 m3 per second. The El Beid acts as a drain for the Yaeres soils disposing of heavy mineral salts after the first rains. During wet years of heavy flooding, the El Beid supports heavier fish, many juvenile cohorts and more species. In wet years, the El Beid is a second major area of fishing (along with the Logomatia) and is a major source of stock for the fishery in Lake Chad.
The most striking land uses within this diagnostic basin include Waza National Park (170,000 ha), the Kalamaloue Faunal Reserve (4500 ha), part of Chad's Mandelia Faunal Reserve (total: 138,000 ha), the canalization of the Logone with dikes, the Maga Dam (30 km long), Chad's Bongor Rice development and the SEMRY rice projects. In addition, the dams in the Mandara mountains have reduced floodflows to the yaeres. Major urban centers include Kousseri, Makari and Yagoua, Maroua, and Bongor.
Ecological Concerns: The Maga dam has cut off the inundation from the Mandara mountains and partially from the Logone. About 900 km2 of the yaeres is behind the dam. About 1500 km2 of Waza National Park is impacted by the dam. The loss of inundation occurs even in years of good rainfall. Major changes in the vegetation are occurring: e.g. Vetivarria, a major feed for elephants, is dying and being replaced by annuals. More than half the floodplain vegetation of Waza National Park has disappeared (50,000 ha). The waterworks have harmed both the wildlife (especially antelopes such as Kobes, Topi and Roan) within the park and the livestock outside the park. In the 1970s, the area pastured 200,000 cattle. Recent counts have estimated only 100,000. In short, the Maga has created a permanent downstream hydrological drought.
In addition, the free fertilization of the yaeres by overflow and transported silt/minerals has stopped. This will result in long-term degradation of pasture land fertility. The grasslands are not so much over-grazed as under-nourished and under-irrigated because of the dam project. Herders must switch to de-branching trees for forage when confronted by poor grass production. The lack of good pasture and forage for certain species of wildlife forces them to wander outside the park where they are more easily poached or can contract bovine diseases such as rinderpest.

40
There have been losses of forest species and forest cover within this diagnostic basin. Some forest losses are strictly from drought. For instance, Khaya senegalensis has suffered mainly from the drought. In other cases, the lower rainfall combined with human activities (increased usage from drought emigrants, urban demand, need for alternative incomes, brushfires in dry periods, etc.) to cause problems in the woodland and shrub savanna. In Waza, for instance, lowered groundwater tables from both drought and dams have led to the death of Anogeis-sus, particularly the older trees that cannot respond quickly to changes in the level of the water table. In some cases, the species loss is due simply to strictly over-exploitation. For instance, the ronier palms have been overcut far beyond a sustained yield levels. The riparian forests along the Logone have suffered from human over-exploitation.
Mandelia Faunal Reserve is in poor condition. About ten elephants remain. Lions, buffalo and cheetah have disappeared. The wildlife has been stressed by poaching and agricultural encroachment. There is serious discussion of moving the boundaries south and connecting the reserve more closely to Waza National Park
The Kalamaloue National Park is 4500 ha adjacent to the Maltam-Kouserri road. The park has suffered from drought, herders, poaching, brushfires and, perhaps, even from the three villages within it. It borders Chad and has suffered from the weapons and ammunition that spread throughout the area during the war. The park still supports elephants and could serve as one of the "habitat islands" used by migrating herds.
Mozogo-Gokoro Park (1400 ha) is a unique forest relict in the Sudanian zone of Africa in the Mandara Mountains. A forest reserve since 1932, the Park is an important gauge to measure all sorts of environmental degradation.
The park is surrounded by villages, and the contrast between agricultural fields and the forest is astounding. The villagers tend to avoid the park because of snakes. But the cutting of trees, the entrance of domestic animals, and the potential for runaway brushfires threatens the integrity of the park.
Human Resources Background and Concerns: North of Sara country there is a zone of great ethnic diversity with Marbai, Leie, Kim, Ham and others often organized into autonomous village groups. Rice, red sorghum, pencil millet, and taro are common cultigens in the south. The Massa, who live north of these groups on both sides of the frontier between Cameroon and Chad, are involved in the rice perimeter developments of the past two decades. Still further north, on the borders of the Great Yaere between Pouss and Logone Birniis, is the province of the Mousgoum, who are related to the Massa . Seasonally, the yaeres harbor Shuwa Arabs from the delta regions, and Peul from Cameroon, Nigeria and Niger. Kotoko agro-fishers and Shuwa Arabs can be found near Ndjamena and Kousseri, but this entire area has become a zone of commercial horticultural production initiated by urban dwellers.
Diminished rainfall and surface water translates into a shrinking resource pool for these groups, loss of fishing and livestock income, loss of recession sorghum and millet lands, and increased reliance on commercial irrigated agriculture and trade.

41
3.2.4 THE MAYO KEBBI DIAGNOSTIC BASIN
Water Resources: The diagnostic basin of the Mayo Kebbi includes only part of the total watershed. Part of the southern watershed is outside the conventional basin. In addition, the Mayo Kebbi flows into the Niger River basin at high water in the Logone. This unique watershed divide is filled with a string of lakes which, at times, can flow to the Logone River or flow towards the Niger River. This is a unique landscape feature in the Lake Chad Basin and a remarkable landscape feature for the planet.
The Mayo Kebbi, a right hand tributary of Benue, drains an area of 21,360 km² located in Chad and Cameroon. It takes the overflow from the left bank of the Logone River near the Ere Bongor.
Mean rainfall at Lake Fianga is 960 mm. High flows in Mayo Kebbi are recorded in July to October. The dry season lasts from November to March. The mean annual outflow from the Lake Chad Basin via Mayo Kebbi was estimated by FAO (1972) as 0.73 x 10⁹ m3/year.
Ecological Resources: The soils of the lakes are leached alkali soils in the bottomlands. The immediate slopes around the lakes are stoney relict soils with ferruginous fades. Towards the Logone, the soils change to leached and weakly leached ferruginous soils, some areas with iron pan and concretions (Pala region).
The plant life on the stony relict soils is a reg-adapted "sudanian" wooded savanna with Combretacae and Burseracae dominants or an opened shrub savanna in which the trees are gradually replaced by Acacia hockii, Albizia and Dalbergia. The vegetation of the tropical ferruginous soils is a complex mixture of shrub and wooded savannas. On the ironpan ferruginous soils, the shrub/wooded savanna near Pala contains Isoberlinia and Monotes.
There is a wildlife reserve (Binder-Lere) at the far west end of the conventional basin. Little is known of this reserve. Roan and Bubale antelope live there. Lake Lere (just west of the conventional basin border) has a unique fauna with manatees and hippos and a combination of Niger River and Lake Chad basin fish.
Human Resources Background: Massa, Touboucuri, Moundang, and a number of smaller groups people the Mayo Kebbi diagnostic basin.
3.2.5 KOMADUGU YOBE DIAGNOSTIC BASIN
Water Resources Background: This diagnostic basin of about 148,000 km2 is divided into two distinct parts: an upland water collecting area, the Hadejia-Jama'are sub-basin, situated in the Kano, Jigawa and Bauchi States; and the lowland area of dispersal, the Yobe River sub –basin, situated in the Borno and Yobe States and in Niger. It is joined by the Komadugu Gana River before it reaches the lake. The Yobe River is a classical example of a tapering stream, losing a large part of its total annual flow by infiltration and evapotranspiration. The lowest 160 km of the river is an international boundary between Nigeria and Niger.

42
Two large dams, for supporting irrigation schemes and water supply, have been constructed in the upper catchments. The Tiga Dam, the second largest earth fill dam in Nigeria that created a storage reservoir of 1974 x 106 m3 capacity was closed in 1974. The Challawa Gorge Dam, the other large dam, with a storage of 1950 x 10 m3, was closed in 1992. Kafin Zaki Dam is being built on the River Bunga, one of the tributaries of the Jama'are River. The reservoir shall have a total capacity of 2,700 x 10 m3. Construction of the dam is moribund.
Water Resource Concerns: Poor management of the river system and dam operations have altered the regime of the river system. There is a reduction in flow downstream of Gashua by an average of 32%. There is also a marked reduction in the flow duration, from an average of 10 months in the year before the dams, to a maximum of six months in the past few years. There is also a distortion in the flows in the channels passing through the Hadejia Nguru Wetlands, due to blockage by resultant typha and silts deposits, giving rise to desiccated and over flooded channels.
Ecological Resources: The diagnostic basin falls within the Sahelian zone with low rainfall years pushing it toward Sahelo-Saharan vegetation. The characteristic trees along the Komadugu are Tamarind and baobab; along the shoreline of Lake Chad are A. nilotica, A. tortillas, Balanites, Zyziphus and Salvadora. In the depressions, doum or date palms grow. On the dunes, Commiphora africana, A. senegalensis, Dalechampia scandens, A. albida and Zyziphus mauritania.
The alluvial plains support Viteverria grasslands. There is Mitragyna/Mimosa along the banks and bars of more active rivers, and Oryza/Echinochloa marshlands in perennial ponds. Calotropis has invaded road sides and the receding lake.
There are no game reserves or protected areas in the lower Yobe. Upstream, on the border of the conventional basin, the Hadejia Nguru wetlands have international importance as a wintering migratory area for Palearctic birds such as the ruff and wood sandpiper. Within it is Nigeria’s premier and only Ramsar site to date (Marma Channel and Nguru Lake). There is also a sector of the CBNP, the Zurgum Baderi, in the wetlands. The Bulatura oasis, which is also another sector of the CBNP, is an important breeding and roosting site for black-crowned cranes. It was also the first location for flamingos in Nigeria. There were, at one time, about 27 medium to large mammals in the diagnostic basin. The black rhinoceros, the cheetah, and the lion are now extinct in the area. Dorcas gazelles are the only large mammal commonly reported. This diagnostic basin includes the Kouri breed of cattle (and crosses with Azawak and Bororo) unique to the Lake Chad Basin.
Human Resources Background: Hausa, Bade, Fulani, and Kanuri dominate the upstream end of the Yobe River Basin. The downstream eastern end of the Yobe is home to the Mobeur sub-group of the Kanuri and related groups such as the Manga.
Seasonal millet, sorghum, and rice production, fishing, and animal husbandry make up the valley economy. Vegetables are also produced for export. Post-flood sorghum is grown on the shores of Lake Chad. Wheat was traditionally grown both in the Yobe valley and in the Yobe delta region. More than four decades ago, 6.5 T of fish were taken on the short of Lake Chad, and 4.5 T were taken from the Yobe.

43
Peul and Tubu pass through this basin with their herds. Since the late 1970s, some Shuwa Arab groups in search of pasture begun to infiltrate the diagnostic basin. Camels are now a common sight.
The Niger part of the lower Komadougou Basin occupies the administrative regions of Diffa and Goure. This area has a population of nearly 330,000 persons. About two-thirds of the population are agricultural peasants, the rest are nomadic herdsmen. The water needs of both population and livestock are satisfied by the phreatic and artesian aquifers.
3.2.6 THE BORNO DRAINAGES
Water Resources Background: It is entirely within Nigeria with three seasonal rivers (Yedseram, Ngadda, Gubio). For the most part, the diagnostic basin is a featureless plain, which slopes gently east and northeast towards Lake Chad. The only feature which breaks the monotony of the plain is the sandy Bama ridge extending from a point west of Maidiguri, past Maidiguri and Bama, for a distance of about 160 km. The ridge is probably an ancient shoreline of Lake Chad.
Except for a relatively short period during the rainy season, most of the seasonal rivers flow into marshy areas on the plain and disappear by infiltration, evaporation, and evapotranspiration before reaching Lake Chad. Under these circumstances, the reliance on groundwater for urban and rural supply and small-scale irrigation is heavier in this area than in other parts of the basin. Any adverse effect on groundwater systems arising from their exploitation is bound to have far-reaching consequences.
The Yedseram River, which is called the Mbuli River in its lower reaches, has a catchment area of 16,320 km². The source of the river is in the Mandara Mountains, about 250 km south of Lake Chad. About 30 km west of Bama, south of the Gombole Forest Reserve, the Yedseram is joined by the Ngadda River in a large swamp (Sambissa) covering about 130 km2, where the main water courses are ill-defined.
The Ngadda River has a catchment area of 14,400 km². It drains into several lakes and swamps in its north westerly flow, before it is dispersed in the low flow zone of the old Lake Chad bed. The Ngadda River does not, therefore, succeed in maintaining a definite course to the lake.
Between Ngadda and Komadugu-Yobe there is an area of about 27,000 km² around Gubio, which has no distinct drainage pattern. The ground slope towards the lake is very small and surface water moves slowly toward shallow depressions from where it disappears by infiltration and evaporation.
As seen from the above, the contribution of the seasonal rivers of the Borno drainage system to Lake Chad is negligible in comparison with the total lake inflow.

44
Water Resource Concerns: One of the intriguing and not fully understood phenomena in the area between Maiduguri and the lake, is the development of many sinkholes of 0.5 to 30 m diameter and 300 to 600 m long fractures in the soft soils predominating in this area. Large numbers of fractures appeared in 1985 along the Konduga-Mafa Road, very near to the Alau Project. Once a long fracture or sinkhole is formed, it drains the surface water intensively as shown by a local network of gullies leading to them. These are quite disturbing phenomena which may lead to all kinds of difficulties in the implementation of surface water projects (dam instabilities, uncontrolled water loss from storage reservoirs, etc.). There is a possibility that the formation of large fractures is caused by deep seated compactional and tectonic movements. It is also possible that groundwater pumping or destruction of recharge areas has caused subsidence or even triggered seismic movements..
Ecological Resources: As in the Komadugu Diagnostic Basin, the land surfaces of the Borno drainages formed from a combination of eolian and lake events.
The soils are all "juvenile" resting on hydromorphic, brown, halomorphic soils and eolian sands. There are vertisols within the topographic depressions or vertisol/brown soil mixtures. The halomorphic soils are easily eroded.
The basin is basically in the Sahelian zone and enters the Sahelo-Sudian in periods of wet years or soils with higher water content. The extensive flooded zones and seasonal rivers create wetland habitats of great interest for fish, rice cultivation, vegetable growing, dry season pasture and livestock watering. The northern part includes shrub steppes (Acacia/Aristida) grading into savannah woodland (Combretum/Anogneissus/ Hypaarhennia) to the south. The extensive flooded areas are virtual prairies of Echinochloa stagnina (burgoo) and Hyparrhenia. The riparian includes Acacia/Mitragyna forests. The widespread "park savannas" with A. albida and baobab are human-made.
The diagnostic basin includes the Sambisa Game Reserve (518 km2), the Chingurmi Duguma sector of the Chad Basin National Park (CBNP), and the Lake Chad Game Sanctuary, another sector of the CBNP. Sambisa, is a major area for the conservation of elephants. It is the last stronghold of the ostrich in Nigeria and still supports a variety of antelopes. The Lake Chad Sanctuary has crowned cranes and sitatunga (a special wetlands adapted antelope).
Major land and water uses within the basin are Maiduguri township, the South Chad Irrigation Project, Alau Dam, other irrigation schemes, the game reserves, and the road/rail system.
Human Resources Background: The Kanuri, practicing farming and sedentary animal husbandry are the most important group demographically and politically in Borno (70 percent of the population). The second largest group are the Shuwa Arabs (about 8 percent of the population). They practice semi-nomadic agro-pastoralism and agriculture. Nomadic Fulani (Mbororo) make up about 5 percent of the population. Small groups, including Manga and Mobeur, live along the Niger/Nigerian border. Groups related to the mountain peoples of the Mandara chain live along the Cameroon/Nigerian border.

45
3.2.7 NORTHERN DIAGNOSTIC BASIN (INCLUDES TERMIT SUD, BAHR EL GHAZAL)
Water and Ecology Resources Background: Administratively, the northern "drainages" include parts of the Lake, Kanem and Chari Baguirmi Prefectures of Chad and parts of the N'guigmi, Diffa and Maine Soroa Prefectures of Niger. In Chad, the main urban centres are Bol, Mao, Ngouri,and Moussouro. In Niger, the major urban centres are Gore and Nguigmi.
It is the largest drainage area in the Lake Chad Basin, enclosing 1,546,210 km². For practical purposes, the area can be considered to provide no surface runoff to the lake. On the contrary, it has a distinct drainage pattern, flowing away from the lake along the Bahr el-Ghazal trough towards the Bodele Depression.
By far the largest area is covered by moving sands (low altitude plateau) and recent ergs. The Bahr el Ghazal and the depressions south of the Bahr are major exceptions. They have been formed from the lake deposits of an ancient Lake Chad. The other exception, on the west side of the lake, includes the ancient sand barrier of the lake, the quaternary delta deposits from now dead rivers, and the alluvial deposits from the same quaternary period.
Because the most widespread soils (sandy tropical ferruginous soils of the French classification) are very susceptible to drought, the responses to human degradation are accelerated. The groundwater drops quickly, the surface becomes easily mobile, and sheet wash is easily initiated compared to more southern soils.
There are three main types of vegetation of the northern drainages: (1) A Panicum turgidum grassland with a mixed herbaceous layer; (2) a shrub steppe of Commiphora, Leptadenia and Acacia raddianna (shrubform) interspersed with Arisitida grasses; (3) a shrub steppe which, at times, reach tree size with Acacia Senegal and A. laeta as well as the other Acacias, Balanites and Arisitida/Scheonfeldia grasses. The woody plants have not been heavily used. They served as firewood for nomads, extra income (from gum arabic), and browse for cows and sheep (dry season), camels and goats (year-round).
Some of the grasslands support year-round grazing. These grasslands were never over-grazed, but were under-watered, causing southern movement of various pastoralist groups.
The northern diagnostic basin supports goats, sheep, camels, cattle and donkeys.
There is rapidly decreasing wildlife. Reports of ostrich, scimitar-horned oryx, addax, Damas and Dorcas gazelle were common in the 1960s.
Water and Ecological Concerns: Cattle and livestock trampling, especially near human settlements and along passage tracks, are a major cause of top soil mobilization. This also accelerates dune mobilisation. The most severely damaged area in this Diagnostic Basin is around Mao.
The main concern for pastoralists within this diagnostic basin has been the lack of forage, and the need to penetrate the Lake Chad shoreline for forage, or to move south beyond the Komadugu (on the west side) and beyond even the CAR border (on the east side).

46
In the Lake Chad area, the Kouri cattle are resistant to rinderpest, but they suffer from parasites (e.g., trypanosomes) and blackleg, when they enter the marshlands. The clustering of cattle around the shoreline has led to localized overgrazing.
Regarding the vegetation cover, the over-riding concern is the lack of balance between vegetative loss (which occurs quickly) and regeneration (which occurs slowly) in this diagnostic basin. This is being driven by an increase in livestock numbers, especially browsers that have browsed seedlings.
The two main concerns for farmers in the Kanem (Bol) areas and similar areas in Niger have been (a) the sanding in of ouadis and other depressions (fadamas) and (b) the re-activation of dunes.
BAHR EL GHAZAL: These flat and wide wadis are noted for their sweet waters, where the water table is 1 to 1.5 from the surface in the rainy season and 5 to 7 m in the dry season. There is an exceptional old-growth doum palm stand in the Cheddra wadis, which have been turned into truck farms for N'djamena.
This region is the cross roads for a variety of pastoral (Kreda, Daza, Oueled Sliman), agro-pastoral (Kouri, Buduma), and agricultural (Kanembou, Haddad) groups. Dune and recession cultivation and short cycle transhumance are characteristic of production systems around the lake and the Bahr. The population density is highest near the lake where it reaches about 7 p/km².
Under conditions of prolonged aridification, degradation of the vegetative cover has resulted from abusive lopping of aerial fodder, from clearing of ouadi bottoms for gardening, from clustering around boreholes where disputes tend to break out amongst herders, and even from scorched earth tactics undertaken by one nomadic group against another deemed to be too near.
Land tenure in the ouadis, which privileges the interests of absentee pastoral land owners, is a constraint on investments in renewable resources (fruit, improved date palm, and shade trees).
Bahr el Ghazal environmental concerns include: There is possible over-exploitation of palms for shadoufs and construction wood in the last remaining natural stands in Cheddra and Rig-Rig.
TERMIT SUD: The Termit Sud region is the home to pastoral populations including Tubu (= Gorane), Wo'daa'be Fulani, Shuwa Arabs and other groups who practice a variety of transhumant production systems.
Isolation of herding groups from circuits of exchange inhibits their ability to de-stock in response to periodic instances of drought. Delayed de-stocking result in overgrazing of diminished pasture resources, as well as inefficient economics.
As has been known since the early 1970s, bore holes have become foci of environmental degradation through degradation of the vegetative cover, and soil compacting.

47
3.2.8 LAKE FITRI DIAGNOSTIC BASIN
Water and Ecological Resources Background: Only the west-end of the Batha/Fitri depression is in the Conventional Basin. This piece includes Lake Fitri, sometimes considered a miniature version of Lake Chad.. For a surface of 800 km², inflow of about 1 X 10⁹ m3 is needed to compensate for evaporation (about 3000 mm/year), transpiration, and infiltration.
Following the variability of rainfall, the lake's water level is extremely variable. It is 420 km2 in a median year. It can double or triple in size during wet and very wet years (greatest recorded coverage is 1,300 km²) or completely dry up in consecutive dry years (1973 and 1984) The depth, during "normal" periods, is between 1.5 and 2 m. Lake Fitri volumes (when not completely dry) varies between 0.7 to 2 X 10⁹ m3. As in Lake Chad, the water quality contains few mineral salts.
The depression has complex soils because of the expansion and contraction of the lake and because of various dunal transgressions. Near Lake Fitri, the soils are gleyed, with hydromorphic clays or pseudo-gleys that support extensive wetlands. In the rececession borders of the lake, brown sub-arid soils with anthropogenic pseudo-steppes form an irregular circle. In depressions, vertisols and alkaline halomorphic soils support an open canopy thorn forest. During wet and very wet years, the wetland vegetation moves into the Batha's delta and into the southwestern interdunal depressions.
Human Resources Background: Lake Fitri and its environs is inhabited by the Bilala, an agro-pastoral people affiliated with the Kanembou. The area is seasonally visited by a number of Arab pastoral groups. Cultivation of berbere, kreb (Panicum laetum) and wild rices are among traditional agricultural activities of the zone. Millet is also grown on the dunes. Lake Fitri fisheries are also important to the traditional Bilala economy.
Lake Fitri is a particularly rich zone. There is always green pasture. Bourgoutieres in the hot dry season, recession pastures in the cold dry season, and dune pastures in the rainy season attract agro-pastoralists. In addition, the association of vertisols and dune soils makes for a diversified agricultural calendar involving transplanted recession sorghum, pencil millets, and kreb. In addition, fisheries resources (Silurides and Pterocarpus) are available.
There is an intensified competition for the resources amongst the indigenous populations. The old rules of use fixed by custom and habit have been overturned. The Bilala agriculturalists have become very strict about the routes pastoralists may take through their territory. They have designated trekking routes which animals must follow and designated locations where camps can be installed. For their part, herders have begun to charge for the transport and other services which used to be exchanged in kind.
3.3 CLIMATIC FEATURES AND CLIMATE CHANGE
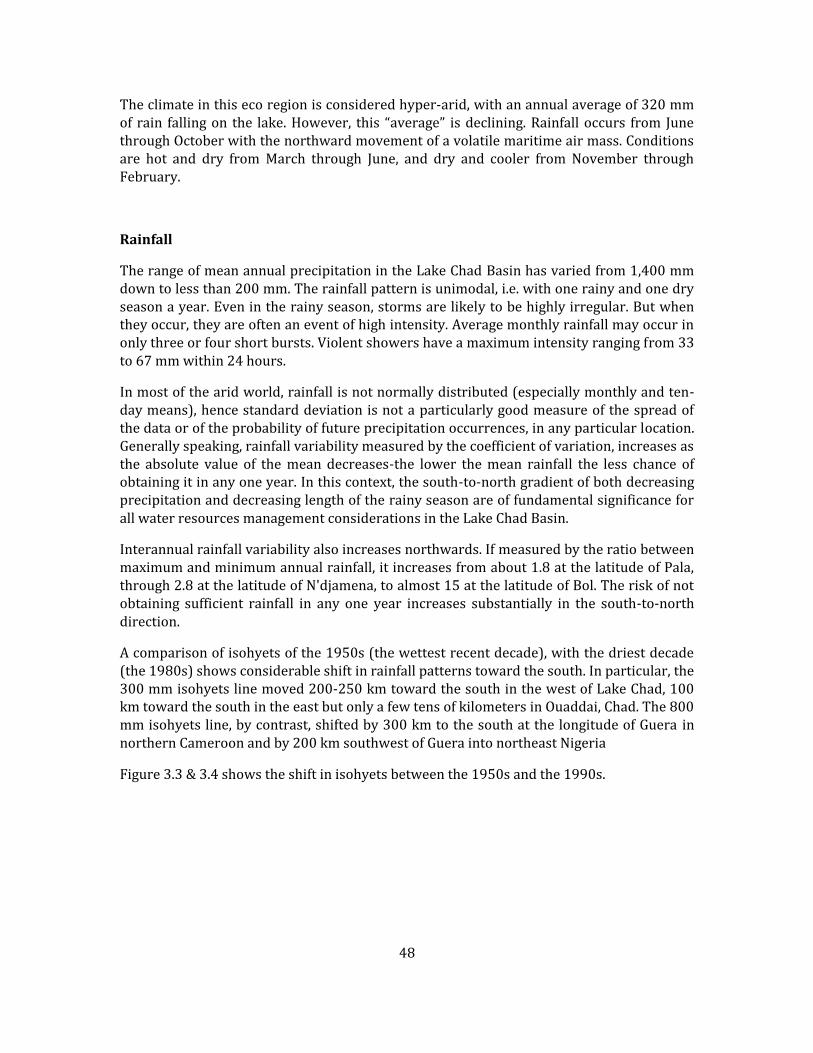
48
The climate in this eco region is considered hyper-arid, with an annual average of 320 mm of rain falling on the lake. However, this “average” is declining. Rainfall occurs from June through October with the northward movement of a volatile maritime air mass. Conditions are hot and dry from March through June, and dry and cooler from November through February.
Rainfall
The range of mean annual precipitation in the Lake Chad Basin has varied from 1,400 mm down to less than 200 mm. The rainfall pattern is unimodal, i.e. with one rainy and one dry season a year. Even in the rainy season, storms are likely to be highly irregular. But when they occur, they are often an event of high intensity. Average monthly rainfall may occur in only three or four short bursts. Violent showers have a maximum intensity ranging from 33 to 67 mm within 24 hours.
In most of the arid world, rainfall is not normally distributed (especially monthly and ten-day means), hence standard deviation is not a particularly good measure of the spread of the data or of the probability of future precipitation occurrences, in any particular location. Generally speaking, rainfall variability measured by the coefficient of variation, increases as the absolute value of the mean decreases-the lower the mean rainfall the less chance of obtaining it in any one year. In this context, the south-to-north gradient of both decreasing precipitation and decreasing length of the rainy season are of fundamental significance for all water resources management considerations in the Lake Chad Basin.
Interannual rainfall variability also increases northwards. If measured by the ratio between maximum and minimum annual rainfall, it increases from about 1.8 at the latitude of Pala, through 2.8 at the latitude of N'djamena, to almost 15 at the latitude of Bol. The risk of not obtaining sufficient rainfall in any one year increases substantially in the south-to-north direction.
A comparison of isohyets of the 1950s (the wettest recent decade), with the driest decade (the 1980s) shows considerable shift in rainfall patterns toward the south. In particular, the 300 mm isohyets line moved 200-250 km toward the south in the west of Lake Chad, 100 km toward the south in the east but only a few tens of kilometers in Ouaddai, Chad. The 800 mm isohyets line, by contrast, shifted by 300 km to the south at the longitude of Guera in northern Cameroon and by 200 km southwest of Guera into northeast Nigeria
Figure 3.3 & 3.4 shows the shift in isohyets between the 1950s and the 1990s.

49
Source: Impact Assessment, Inc
Figure 3.3 Map Showing the 300mm Isohyets in the 1950s.

50
Source: Impact Assessment, Inc
Temperature
Low rainfall is accompanied by excessively high temperatures in all arid lands. The annual trend of temperature extremes is moderated by the onset of the rainy season producing, in the Lake Chad Basin, two annual hot peak periods. The first, and somewhat higher peak, occurs before the onset of the rainy season. The second occurs just after the rains stop. During years of low cloud cover, the impacts of higher temperatures are more severe.
Exceptions to the temperature model occur in the most southern parts of the basin, where the rainy season extends considerably into the period of cooler weather. Although the annual means do not vary much throughout the basin, the increase in the mean temperature amplitude (Tmax - Tmin) from south to north is characteristic of the change from the Guinean to the Saharan climatic zone.
The major concern of high temperatures is their impact on evaporation and transpiration rates in plants, especially crops. Secondary concerns include increased fire hazard and accelerated reduction of standing water for livestock. In Lake Chad, increased and long-term high air temperatures impact the dissolved oxygen levels of the lake and, in extreme, can cause fish die-offs. The reduction of water volume by evaporation increases salinity which also reduces fish habitat.
Humidity
Figure 3.4 Map Showing the 300mm Isohyets in the 1990s

51
Relative air humidity, used to assess the evaporative demand of the atmosphere (high values indicate low evaporation) is influenced by two factors: the advance and retreat of the rain belt, and the large bodies of surface water. Highest values consistently coincide with the peak rainfall months. For example, in August, the lowest average value of 84 percent was recorded at Nguigmi, a station with very low rainfall. Lowest values occur during the dry season, generally in February or March, the smallest being the mid-day average at N'djamena, 11 percent for both months. However, the monthly, daily, and even hourly variability of air humidity is substantial.
Wind
The dry season in the Lake Chad Basin is characterized by hot and dry winds from north-easterly directions. In the rainy season, the south-westerly monsoon winds are predominant.
Wind can be both beneficial and harmful. Its benefits include wind pollination of grasses, oxygenation of lakes (stirring up lake nutrients and sediments, increasing biogeochemical turnover), and, during the rainy season, increased air humidity (by providing cool and wet air masses).
Wind is harmful to human production systems when it is dry and hot and sucks up soil moisture, stresses plant water balance, reduces air humidity, mobilizes soil fines (eolian erosion), accelerates dune movement, and causes abrasion of plants with wind-born sand.
Evaporation from free water surface
This hydrometeorological parameter is of particular importance in the Lake Chad Basin and its quantification is essential for all water balance investigations. Its value depends on all hydrometeorological factors discussed so far (including solar radiation).
An average annual evaporation from the surface of Lake Chad was estimated by ORSTOM to be 2,150 mm, with the mean monthly values from January to December being 150,152,148,137,158,180,180,190,194,311,228, and 132 mm respectively. In the SCIP feasibility study (Sir MacDonald, 1973), the average value of 2,290 mm was used.
In all Lake Chad water balance models, evaporation (along with lake inflow by Chart and Logone Rivers) is one of two key variables. It certainly needs more thorough investigations based on field measurements in different hydrometeorological conditions.
Transpiration
In the Sahel and Sudanian zones, transpiration is about 10 to 30 percent of total evapotranspiration. Most recent potential evapotranspiration rates calculated with the Penman Formula for several stations in the Lake Chad Basin are given by FAO (1984). For example, annual totals for Bol and N'djamena are 2,079 mm and 1,788 mm respectively. Approximately one-third of the annual values correspond to the growing season of rain fed crops (July to October), one-third to the winter season of irrigated crops (November to February), and the remaining one-third to the rest of a year.

52
Transpiration is a necessity of all plantlife. In order to grow, soil water must be utilized and "exhaled" as vapor. In order to decrease heat stress, leaves transpire as a cooling mechanism. Water, as water vapor, is less useful to farming and pasture and forest production than water in its liquid form. Therefore, a major goal is to increase production while, at the same time, minimizing transpiration.
Climate Change
Climate change is regarded as the most important global change relevant to the Lake Chad Basin. In the past 30 years, the Sahel has experienced the most substantial and sustained decline in rainfall recorded anywhere in the world within the period of instrumental measurements (IPCC 2001). Linear regression of 1901-1990 rainfall data from 24 stations in the West African Sahel yields a negative slope amounting to a decline of 1.9 standard deviations in the period 1950-1985 (Nicholson & Palao 1993 in IPCC 2001). Since 1971, the average of all stations fell below the 1989-year average and showed a persistent downward trend since 1951 (IPCC 2001).
A comparison of isohyets of the 1950s, which is regarded as the wettest decade, with the driest in the 1990s showed considerable shift towards the south as shown in Figure 3.3 and 3.4 (Olivry et al. 1996). In particular, the 400 mm isohyet moved 200-250 km towards the south in the west of Lake Chad, 100 km towards the south in the east but only few (10s) of kilometres in Ouaddai (Chad). The 800 mm isohyets shifted by 300 km to the south at the longitude of Guera and by 200 km to the south east of Guera, in Nigeria. The reduction in rainfall was about 100 mm for each 100 km of distance apart from the annual and spatial variations (LCBC 2000b). The shift showed that areas that had experienced a mean rainfall of 320 mm (e.g. over the Lake itself) received less than 210 mm (World Bank 2002b).
The dramatic decrease in the surface area and volume of Lake Chad has been attributed to regional and global climate change as well as water management practices. Climate change thus remains a major determinant of the future of the lake’s volume and surface area. This is in addition to having serious implications for the availability of fresh water in the basin.
Climate change has also impacted, and is till impacting, on vegetation cover. There has been a general decline and disappearance of large trees and woody species with declining rainfalls, as well as the disappearance of perennials of the field layer. But the effects on vegetation did not exactly parallel the shifts of the isohyets, as soil types also had major effects in maintaining the status quo or in accelerating the rate of degradation, as do the effects of man and animals. Continuing degradation of the vegetation cover will have immediate direct implications for agriculture and livestock rearing.
3.4 NATURAL RESOURCES
Biological Diversity
The Lake Chad Basin contains a variety of habitats, including deserts, shrub steppes, savannahs, forests, lakes, wetlands, and mountains. The humid zones of the LCCB and the

53
lake itself constitute a unique ecosystem in this area of the Sahel, and a refuge of biodiversity of global importance. These terrestrial and aquatic habitats form a unique sanctuary for the diverse fauna of the region that include ostriches, cheetahs, hyraxes, crocodiles, hippopotamus, and elephants.
These habitats also have a good stock of water birds, migratory birds, and waders that thrive in the river valleys depending primarily on the waters of the numerous small lakes that are formed during periods of receding floods. For example, 140 species of fish and 372 species of birds, of which one third is migratory species, have been recorded. The integrity of the ecosystems and maintenance of biodiversity is an essential shield against desertification.
The ecoregion has highest biological importance for the large numbers of migrant birds that use the area, especially ducks and waders that spend the Palearctic winter period in Africa. The lake provides a vital refuge for birds migrating between the Palearctic and Afrotropical realms. Over one million waterbirds congregate on the lake in the Palearctic winter period, making it the third most important area for migratory water birds in West Africa. Some 49 of the 83 major Palaeoarctic species attracted to the Sahel depend on wetlands, and for another 10 species wetlands are the preferred habitat.
Periodic counts of waterfowl and other species have been conducted in Chad and Hadejia- Nguru since 1955. Seventeen species of waterfowl and 49 other wetland bird species are recorded, and abundance varies in different years with the size of the lake and wetlands conditions elsewhere in West Africa. The most abundant bird is the wader ruff (Philomachus pugnax), with more than one million seen on the lake at one time. In the Hadejia-Nguru wetlands the most common waterbirds are white-faced whistling duck (Dendrocygna viduata), garganey (Anas querquedula), northern pintail (Anas acuta), and ruff (P. pugnax). Lake Chad also supports two near-endemic bird species, the river prinia (Prinia fluviatilis) and the somewhat more widespread rusty lark (Mirafra rufa). Although little is known on the range, abundance or status of the listed rare species, the contraction of the wetlands is likely to have been detrimental to their populations. One other bird of note is the marbled teal (Marmaronetta angustirostris), which is occasionally seen on Lake Chad and in northern Chad; it is thought to be declining worldwide.
3.5 UNIQUE ECOLOGICAL COMMUNITIES AND PROTECTED AREAS
From the planetary point of view, the most unique ecological communities and the ecological communities that contain the most intact food webs include :
- The Lake itself-the second largest wetland of West Africa and one of the most important in all of Africa; its flooded dune islands; its shallow, divided basins.
- The Yaeres floodplains of the Logone and Mandara mountains which feed Waza National Park.
- The ouadis of the northern drainages (outside the conventional basin) which may still support remnant populations of scimitar-horned oryx, addax, dorcas and slender-horned gazelle.

54
- The watershed "divide" between the Niger River and Lake Chad Basin which includes Gauthiot Falls and a series of lakes (one supporting manatee).
- Remnant wetland swamps in the States of Borno and Yobe such as Sambisa and Nguru.
- Lake Fitri (a closed basin miniature of Lake Chad).
Current national protected areas include the Lake Chad Game Reserve on the western shore of Lake Chad in Nigeria, the three sectors of the Chad Basin National Park in Nigeria(Zurgum Baderi Wetlands, Bulatura Oasis, Chingurmi Duguma), the Manda National Park on the west bank of the Chari in Chad, the Waza National Park in Cameroun and the Mandelia Faunal Reserve on the floodplain between the Chari and Logone in Chad. The Aïr and Ténéré National Nature Reserve in Niger and the Ouadi Rimé-Ouadi Achim Faunal Reserve in Chad are the two most important protected areas in the Sahelian sub-desert zone of Africa. They contain many of the last viable populations of many of the larger ungulates of the South Saharan Steppe and Woodlands ecoregion .
In July 2000, the Lake Chad Basin Commission (LCBC) declared all of Lake Chad a transboundary Ramsar site of international importance. However, only the national governments of Niger and Chad have designated their sections so far, although both Nigeria and Cameroon have promised that they too will designate their sections as Ramsar sites.
Currently there are the following Ramsar sites: Nguru Lake and Marma Channel complex ( in the Hadejia-Nguru Wetlands, Nigeria); Lake Chad (Chad site); Lake Chad (Niger Site); and Lake Fitri (Chad) (Ramsar 2003). The GEF/World Bank Project has allocated substantial funding for the improved management of the existing and planned Ramsar sites (LCBC 2002). All Lake Chad Basin riparian countries have ratified the Convention on Biodiversity (CBD).
Table 3.2 below lists the most significant protected areas in the member countries and their characteristics.
Table 3.2: The Important Protected Areas in the Member Countries: Cameroun
Name Size in Km2
Significance Current state Type & IUCN category
1 Waza 1,700 Biosphere reserve, tourism, rich in faunal biodiversity
Well managed Wildlife reserve. II
2 Kalamoloue 450 TBPA, elephant refuge Encroached Wildlife reserve. II
3 Mozogo 140 Relic forest. Primates & birds refuge
Encroached Forest reserve. II
4 Mayo Bankara
23 Floral biodiversity Partially encroached Forest reserve. IV

55
Name Size in Km2
Significance Current state Type & IUCN category
5 Kalfoli 400 Floral biodiversity Largely encroached Forest reserve. IV
6 Boulogne 4 Floral biodiversity Partially encroached. Transferred to Yagoua municipality
IV
7 Mayo Louti 350 Floral biodiversity Partially encroached. Transferred to Makolo municipality
IV
8 Zamai 100 Floral biodiversity Encroached IV
9 Mokolo 24.5 Floral biodiversity Encroached IV
10 Laf 500 Floral biodiversity Partially encroached. Transferred to Moutourwa municipality
IV
11 Mogode 25 Floral biodiversity Partially encroached . transferred to Mogode municipality
Table 3.3 Important Protected Areas in CAR
Name Status Localisation Area (km2)
Year of création
Type (IUCN)
Importance Institution of conservation
Vassako Bolo Intégral Natural reserve
Bamingui- Bangoran 860 1933 I Scientific work and protection fauna resources
Zone d’action ECOFAC-ZCV
Bamingui Bangoran
National Parc and Biosphère Reserve
Bamingui–Bangoran 10.700 1933 II Protection of écosystem
Zone d’action ECOFAC-ZCV
Manovo Gounda St-Floris
National Parc Bamingui–Bangoran 17.400 1933 II Protection of écosystem and recreation area(Patrimoin wold)
Zone d’action ECOFAC-ZCV
André Félix National Parc Vakaga, dans la Réserve de faune de la Yata-Ngaya
1700 1940 II Protection of écosystem and recreative area
_

56
Name Status Localisation Area (km2)
Year of création
Type (IUCN)
Importance Institution of conservation
Ouandja Vakaga Réserve de Faune Vakaga 4800 1939 I protection fauna resources
Cynegetic village aera
Yata-Ngaya Réserve de Faune Vakaga 4200 1940 I protection fauna resources
-
Gribingui Bamingui
Réserve de faune Bamingui–Bangoran 4500 1933 I protection fauna resources
-
Koukourou Bamingui
Réserve de Faune Bamingui–Bangoran 1100 1940 I protection fauna resources
Cynegetic village aera
Aouk Aoukalé Réserve de Faune Vakaga 3300 1940 I protection fauna resources
-
Nana Barya Réserve de Faune Ouham 2300 1953 I protection fauna resources
-
Awakaba Présidentiel Parc Bamingui-Bangoran 1700 1968 II Protection of écosystem and recreative area
Présidence area
Table 3.4 Important Protected Areas in Chad
Name/creation date
Surface (ha)
Specific significance State of conservation Category
Zakouma
300, 000 Plain drained by Barh Salamat
clear forest with thorny savanna and
grassy depressions
Elephants, buffaloes, giraffes, lions, panthers, etc.
abundant monkeys
abundant avifauna
Rehabilitation Project financing the EEC since 1989.
Satisfying conservation status
Concern of adjustment of the buffer zones
National park

57
Name/creation date
Surface (ha)
Specific significance State of conservation Category
Manda
114, 000
Significant hydrographical network hic: Chari and Barh Sara, permanent ponds; ;
Clear forest;
Disappearance of Derby for which the park is created
Small antelopes and monkeys
Considerable damage because of war, invasion of the park by the stockbreeders, fishermen, poachers.
Rehabilitation Project funded by the French Co-operation has just been born.
National park
Siniaka-Minia
426, 000
Plain bordered by mountainous solid masses in the East and the West supplied by Minia and others rivers ;
Raised and very dense savanna;
Initial classification for the protection of the black rhinoceros which is completely decimated today;
Rehabilitation in progress within the framework of the extension of the CURESS/Zakouma project
Fauna Reserve
Barh Salamat
2, 060, 000
Reserve surrounding the Zakouma National park o
Same inherent characteristics and even fauna that Zakouma
In the process of rehabilitation in relation to the CURESS/Zakouma project
Fauna Reserve
Aboutelfane
110, 000
Vegetation sahélo-soudanian type, clear raised savanna with Anogeissus.
Reserve created in the mountainous solid mass of Guéra for the protection of the great kudu which seems be maintained.
Very strong degradation of the zone under the men pressure and the livestock.
No intervention until now, absence of monitoring.
Fauna Reserve
Binder-Léré
135, 000 Localized in a rock zone with diversified vegetation, timbered savanna with Anogeissus in the South, forests galleries, graminaceous in edge of the lakes and in
In spite of the war, maintained in good condition of the ecological aspect of the reserve. Registered on the list of the of biosphere reserves
The contribution of the GTZ
Fauna Reserve,
RAMSAR site.

58
Name/creation date
Surface (ha)
Specific significance State of conservation Category
the flooded zones.
Manatee in the lakes Lere, Tréné, hippopotamus, crocodiles, etc.
stimulates the monitoring and protection
Mandelia
138, 000 sahélo soudaniav vegetation type with more or less dense savanna in the South; shrubby savanna with thorn-bush in North.
Reserve created to protect the elephants between Logone and Chari (5 to 600 at the time), those completely disappeared.
Avifauna along the rivers and the ponds.
critical situation of this reserve under the multiple pressures:
overgrazing;
agricultural hydro installations;
Poaching having brought the disappearance of the faunal species.
Anarchistic exploitation of palm tree
Fauna Reserve
Ouadi Rimé- Ouadi Achim
8, 000, 000
sparse vegetation and clear savanna in North.
Steppe with Aristida and Pannicum in the South and the center, pseudo steppe
Created for the protection of the desert fauna : addax, oryx, gazelle dorcas, leopard as well as the ostriches.
There currently almost do not remain these antelopes of which the great part had emigrated in Niger.
Intense degradation of fauna and the environment these last years because of the poaching facilitated by the civil war.
No measurement of refitting until now summer planned to support the return of fauna.
Fauna Reserve
Fada Archei
211,000
Desert zone; mountainous solid mass between 500 and 1000 m.
Created for the protection of the moufllon with cuffs, the gazelles dorcas and rammed, guepards, ostriches, etc.
Reserve protected from the poaching by the difficulties of access to the mountainous zone and the mobility of the moufflons; but abandoned since the civil war of 1979.
Fauna Reserve
Lake Fitri 195,000 Sahélian Zone with varied Wetland of importance biosphere

59
Name/creation date
Surface (ha)
Specific significance State of conservation Category
vegetation in North, raised savanna with acacia, balanites, relatively dense etc in spite of the pressure of the man and the livestock in the South, clear forest strongly degraded with the accesses of the lake.
Elephants, hyenes, jackals, lions, ostriches.
Very significant fauna, particularly migrating.
very significant piscicultural resources in the lake
international for the water birds and placed under the mode of the Convention of RAMSAR.
A project of management was initiated in 1989 by the UICN but its financing was not found.
Currently no installation and management activity was still undertaken
Reserve,
RAMSAR site
Partie tchadienne du lac Tchad
1,648,168 A vast expanse of water bordered on the northwest by a cordon of dunes, on the northeast by an "erg" of shifting sand dunes, and on the south by flat lowlands. The site supports internationally important numbers of waterbirds and is essential for some 150 fish species
RAMSAR site
Plaines d'inondation du Logone et les dépressions Toupouri
2,978,900 One of Africa's largest wetlands, characterized by a succession of rivers, lakes, floodplains and permanent and temporary ponds.
RAMSAR site
Table 3.5 Important Protected Areas in Niger
Name Size Significance Current condtion Type & IUCN category
Tourmour 150 Acacia Radiana Well managed Forest reserve. VI
Kolol 112 Dakora Threat of being buried by sand Forest reserve. VI
Tramsougona 139. Dakora Threat of being buried by sand Forest reserve. VI

60
Name Size Significance Current condtion Type & IUCN category
Loulono 100 Dakora Threat of being buried by sand Forest reserve. VI
Ariboudimaram 410 Dakora Threat of being buried by sand Forest reserve. VI
Abaram 210 Dakora Threat of being buried by sand Forest reserve. VI
Dakozandi 248 Dakora Well managed Forest reserve. VI
Karagou II 631 Dakora Threat of sand burial, over harvesting & encroachment
Forest reserve. VI
Kedjimeri hois Classement
438 Dakora Threat of sand burial, over harvesting & encroachment
Forest reserve. VI
Kedjimiri RN 143 Dakora Threat of sand burial, over harvesting & encroachment
Forest reserve. VI
Taya Toutoule 255 Dakora Threat of sand burial, over harvesting & encroachment
Forest reserve. VI
Assaga 67 Dowm palm Over harvesting. No young growth. Lacks management plan
Forest reserve. VI
Mamouri 610 Desert encroachment control
Well managed Forest reserve. VI
Nguel Kolo 189 Resources source for local people
Needs a management plan Forest reserve. VI
Bara/Dadaria 380 Dakora Old trees. No young and seedlings Forest reserve. VI
Iguin 155 Dakora Well managed Forest reserve. VI
Taboro 10,000 Prosopis Well managed Forest reserve. VI
Grema Bocardi 230 Dakora Threatened burial by sand Forest reserve. VI
Lari Kanori 150 Sahradora pasika Over harvesting of root Forest reserve. VI
Kabalewe 2,000 Prosopis Well managed Forest reserve. VI

61
Table 3.6 Protected Areas in Nigeria
S/N FOREST RESERVE
AREA/KM2
LOCATION STATUS BIODIVERSITY HUMAN/ANIMAL ACTIVITIES
REMARK
1 Chingurmi/Duguma
206.25 Bama L.G. Not Gazetted
2 Yerwa 120.33 Damboa L.G. Gazetted 26/9/57
3 Sambisa 163.33 Gwoza L.G.
4 Fuchu 168.01 Mafa L.G. Gazetted 4/10/55
5 Yau 96.86 Abadam L.G Gazetted 10/11/60
.6 Ngohi-Ngulde 157.00 Askira/Uba Gazzetted
23/5/57
Rich in fauna & flora
Poaching, grazing & extraction of fuelwood & timber
-Lack of proper management
.7 Marguba 323.75 Kaga Gazzetted
11/6/53
Very rich in flora - Poaching
-Fuelwood extraction
Encroached
.8 Wuda-Taye 99.79 Mafa Gazzetted
14/2/57
Rich in flora & fauna especially Birds & Reptiles.
Poaching
-Fuelwood extraction
Encroached
.9 Gombole 144.83 Konduga Gazzetted
14/11/57
Rich in flora & fauna
- Poaching
Fuelwood extraction
- pole extraction
Slightly Encroached
.10 Kesawa 45.58 Konduga Gazetted
7/10/48
Rich in flora only - poaching
-fuelwood extraction
Enroached
.12 Lake Alau 21.23 Konduga Gazzetted
1937
Rich in both flora , fauna especially migratory birds
-Poaching activity
-Fuelwood extraction
.13 Miringa North-West
131.12 Biu Gazzetted
11/6/59
Rich in fauna & flora especially reptile & birds
-Fuelwood extraction
-Timber extraction
-Poaching
-Lack of management
-Timber tree species are threatened.

62
S/N FOREST RESERVE
AREA/KM2
LOCATION STATUS BIODIVERSITY HUMAN/ANIMAL ACTIVITIES
REMARK
14 Imirshiwa 86.51 Damboa Gazzetted 26/1/61
Abundant fauna & flora especially birds mammals & some reptiles
-Poaching
-Fuelwood extraction
-Timber extraction
-Poverty level
-Lack of freqrent patrol
-Political influence
15 Wayo Gubarunde
84.51 Bayo Gazzetted
17/5/62
High in fauna & flora
-Over-grazing
-Fuel wood
- Extraction for poles
-Poor awareness
16 Marawa Hills 26.29 Hawul Gazzetted
18/1/57
Abundant Acacia & shrub spp
-Fuelwood extraction at high rate
17 Waniri 15.28 Gazamalla Gazetted
1/6/61
Abundant Acacia & shrub spp
-Over-Grazed
-Settlement
-Poor conservation eduication
18 Lemiskari 15.92 Biu Gazzetted
30/1/51
-rich in reptiles & rodent
-Timber trees species threatened
19 Damokarimo Damboa Proposed rich in fauna & flora especially rodents & large mammals
-poaching
-Fuelwood extraction
-Timber extraction
-poles extraction
-Large mammals & timber tree species threatened
20 Dusuwa F/R 167.99 Damaturu L.G.
Produce other forest products in perpetuity
21 Kalallawa 213.41 Damaturu L.G.
Protection of acacia trees
22 Galamo 157.00 Fika L.G. threatened
23 Bam Ngelzarma
161.69 Fune L.G. Strict nature reserve
24 Jajere F/R 224.47 Fune L.G Fauna and Flora
25 Kusur F/R 198.28 Geidam L.G. Fuel wood
26 Gujba F/R seasonal ground Rich in fauna and

63
S/N FOREST RESERVE
AREA/KM2
LOCATION STATUS BIODIVERSITY HUMAN/ANIMAL ACTIVITIES
REMARK
for elephants flora
27 Gumsuri F/R 252.01 Machina L.G. Community grazing ground
Poor management
28 Shekau F/R 187.60 Tarmuwa L.G. Fuel wood and grazing
Poor management
29 Kolisgum Sugum F/R
139.90 Jakusko L.G. Fuel wood
30 Baturiya G/R
31 Adiyani F/R Guri L.G.
32 Falgore F/G/R
922.645 Doguwa L.G. Wild life conservation
Lack of management
33 Rurum F/R 414.183 Rano L.G. Natural species Conservation
34 Central Wase 421 km2 Wase Gazetted 1958
Timber /Fuel wood. a
Sudan Savann Farming, Grazing and illegal felling
35 Jarawa Hills 225.14 km2
Jos East Strict Reserve Sudan Savanna Grazing
Mining
36 Kantana Hills 2,590.72ha or 25.91 km2
Kanam Strict Reserve Sudan Savanna Encroachment
Grazing
37 Pai River Game Reserve
416 km2 Wase Gazetted 1955
Wildlife Conservation
Sudan savanna
Encroachment
Farming
Grazing
38 Pandam Game Reserve
36,259ha or 362 km2
Qua’an pan Wildlife Conservation
Guinea Savanna Poaching Encroachment
39 Zok Giji 10,240.00ha or 102 km2
Wase Wildlife Conservation
Sudan Savanna Encroachment illegal felling Grazing
40 Aliya F/Reserve
375.5 Darazo Gazetted
41 Farin Ruwa F/Reserve
273.8 Darazo -do-
42 Yautare 137.2 Darazo -do-

64
S/N FOREST RESERVE
AREA/KM2
LOCATION STATUS BIODIVERSITY HUMAN/ANIMAL ACTIVITIES
REMARK
F/Reserve
43 Gadau F/Reserve
94.7 Itas/Gadua -do- encroached
44 Lizai F/Reserve
142.4 Itas/Gadua -do- Encroached
45 Kirfi Hills F/Reserve
206 Kirfi -do- Encroached
46 Panshanu F/Reserve
206.5 Toro -do- Encroached
47 Jauro River F/Reserve
189 Toro -do- Portion allocated to refugees
48 Yankari Game Reserve
2,244.1 Alkaleri -do- Gazetted Not encroached. LEEMP/GEF intervention

65
3.6 WATER RESOURCES
Surface Water
For all practical reasons, surface water resources do not exist north of Lake Chad owing to the extremely low rainfall, high evaporation rates, and high infiltration capacity.
The main collection areas for water which feed the lake are:
- upper catchment of the Chari river rising in the Central African Republic and Southeastern Chad, in particular the Bahr Sara tributary which joins with other tributaries downstream of the city of Sahr.
- upper catchment of the Logone rising in the Central African Republic and Cameroon, and converging at Lai.
The lower reaches of the above rivers act as dispersal zones in which uncontrolled irrigation and flood recession cropping is widely practiced. In these zones considerable overspills and evaporation take place.
The lake experiences a close interaction between rainfall, evaporation, and the generation of lateral inflow, groundwater leakage under the body of the lake and human abstraction. Thus the water balance of the lake is highly variable, resulting in fluctuating open surface waters that have exhibited dramatic expansion and contraction over geologic and recent history.
Climate data show a great decrease in rainfall since the early 1960s, largely due to a decrease in the number of large rainfall events. Lake Chad appears to have always undergone seasonal and annual fluctuations because its shallow depth, averaging less than 23 feet (7 m), is highly dependent on seasonal inflows.
Today average depths vary between 1.5 and 5 m and any increase in lake volume means a substantial increase in lake area and shoreline. The surface of the lake is covered with a mixture of island archipelagoes (23 percent), reed beds (39 percent), and open water (38 percent).
Lake Chad divided into northern and southern pools in 1973, which have remained separated ever since. The northern pool has not contained permanent open waters for the past several years although recently there has been some flooding associated with wet years in 1994 and 1999. A swamp belt now divides the lake into north and south basins.
The basin’s rivers exhibit a tropical regime with a single flood occurring at the end of the rainy season lasting from August to November. Evaporation is extremely high, reaching
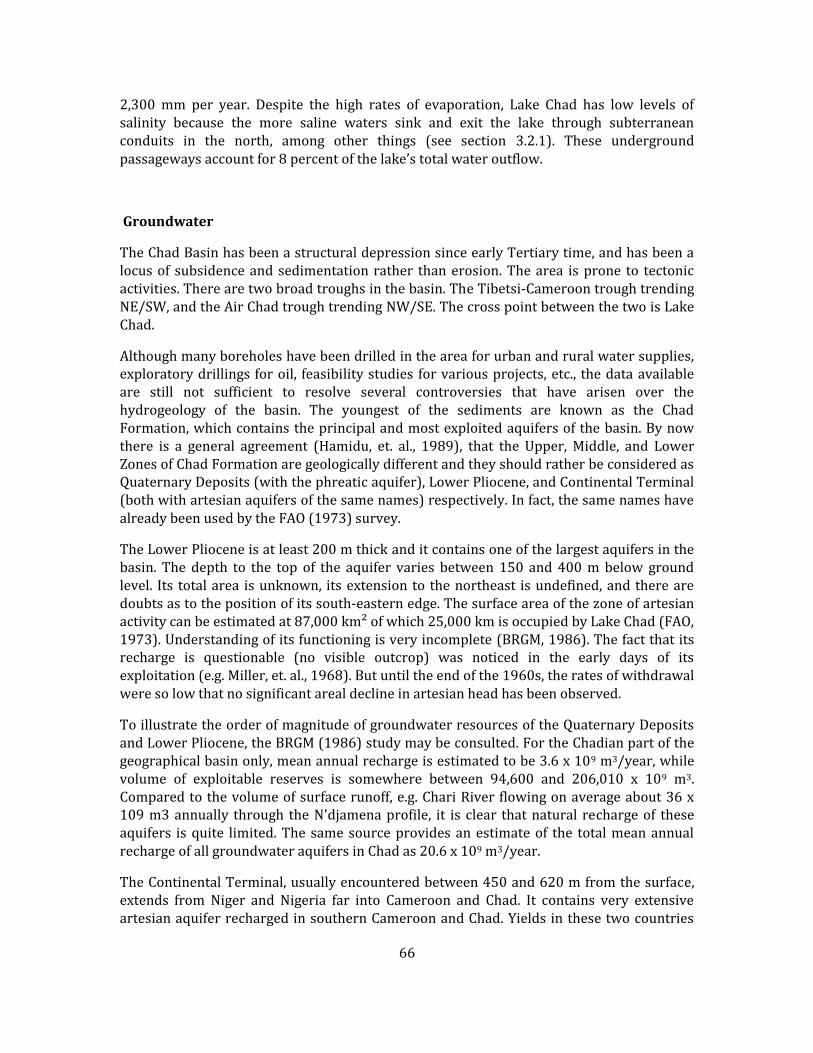
66
2,300 mm per year. Despite the high rates of evaporation, Lake Chad has low levels of salinity because the more saline waters sink and exit the lake through subterranean conduits in the north, among other things (see section 3.2.1). These underground passageways account for 8 percent of the lake’s total water outflow.
Groundwater
The Chad Basin has been a structural depression since early Tertiary time, and has been a locus of subsidence and sedimentation rather than erosion. The area is prone to tectonic activities. There are two broad troughs in the basin. The Tibetsi-Cameroon trough trending NE/SW, and the Air Chad trough trending NW/SE. The cross point between the two is Lake Chad.
Although many boreholes have been drilled in the area for urban and rural water supplies, exploratory drillings for oil, feasibility studies for various projects, etc., the data available are still not sufficient to resolve several controversies that have arisen over the hydrogeology of the basin. The youngest of the sediments are known as the Chad Formation, which contains the principal and most exploited aquifers of the basin. By now there is a general agreement (Hamidu, et. al., 1989), that the Upper, Middle, and Lower Zones of Chad Formation are geologically different and they should rather be considered as Quaternary Deposits (with the phreatic aquifer), Lower Pliocene, and Continental Terminal (both with artesian aquifers of the same names) respectively. In fact, the same names have already been used by the FAO (1973) survey.
The Lower Pliocene is at least 200 m thick and it contains one of the largest aquifers in the basin. The depth to the top of the aquifer varies between 150 and 400 m below ground level. Its total area is unknown, its extension to the northeast is undefined, and there are doubts as to the position of its south-eastern edge. The surface area of the zone of artesian activity can be estimated at 87,000 km² of which 25,000 km is occupied by Lake Chad (FAO, 1973). Understanding of its functioning is very incomplete (BRGM, 1986). The fact that its recharge is questionable (no visible outcrop) was noticed in the early days of its exploitation (e.g. Miller, et. al., 1968). But until the end of the 1960s, the rates of withdrawal were so low that no significant areal decline in artesian head has been observed.
To illustrate the order of magnitude of groundwater resources of the Quaternary Deposits and Lower Pliocene, the BRGM (1986) study may be consulted. For the Chadian part of the geographical basin only, mean annual recharge is estimated to be 3.6 x 10⁹ m3/year, while volume of exploitable reserves is somewhere between 94,600 and 206,010 x 109 m3. Compared to the volume of surface runoff, e.g. Chari River flowing on average about 36 x 109 m3 annually through the N'djamena profile, it is clear that natural recharge of these aquifers is quite limited. The same source provides an estimate of the total mean annual recharge of all groundwater aquifers in Chad as 20.6 x 10⁹ m3/year.
The Continental Terminal, usually encountered between 450 and 620 m from the surface, extends from Niger and Nigeria far into Cameroon and Chad. It contains very extensive artesian aquifer recharged in southern Cameroon and Chad. Yields in these two countries

67
are unfortunately poor, contrary to Nigeria where the aquifer is heavily exploited and where serious declines in head have been noticed (up to 6 m per year). Also in the case of this aquifer, BRGM (1986) points out that knowledge is very sketchy.
Vertical communication between all three aquifers discussed above seems to be very limited. Water quality is generally acceptable both for village and livestock use. The chemical qualities of water from the artesian aquifers make its use for irrigation purposes difficult.
The Continental Terminal overlays five major cretaceous formations of Kerri-Kerri, Combe Sandstones, Fika Shales, Congila and Bima Sandstones exposed by recent oil explorations at depths of 2,700-4,500 m. All these sedimentary successions are laid on the so-called Basement Complex platform.
The Kerri-Kerri formation is about 200 m thick, has an outcrop near Potiskum in Nigeria, and according to one of the unconfirmed-as-yet hypotheses, it recharges the Continental Terminal and Lower Pliocene aquifers from underneath. Combe Sandstones have a maximum thickness of 350 m which thins down towards Lake Chad. They form good aquifers in the outcrop areas. Concerning lower formations, the available data are not yet sufficient for the quantification of the aquifer characteristics (Hamidu, et. al., 1989).
Major groundwater concerns include maintenance of flow in rivers to allow phreatic water table recharge; determining the extent of "fossil" water vs. rechargeable water; reserving groundwater for dry-years in order to prevent lowering of the groundwater table; increased pumping costs from lower groundwater; application of groundwater with high ion concentrations to irrigable farmland; and pollution risks in major urban areas.
Interactions between surface water and groundwater
The Gubio depression is a well-known direct recharge area for the upper aquifer in Borno Drainages diagnostic basin (Odige and Anyaeche, 1991). The Yobe River, acting as an influent stream, is largely responsible for the recharge of the upper aquifer in the middle course of the Komadugu Yobe diagnostic basin (Alkali, 1995; Hassan et al., 2004).
3.7 HUMAN RESOURCES
Social and cultural aspects
According to Kindler et al. (1990), the Basin exhibits a socio-historical unity based on a history shared by the established population groups some of which straddle national boundaries. Many trading circuits remain controlled by the groups who have long considered them their specialty (e.g. the Hausa and Kanuri).
There are numerous ethnic groups present in the Lake Chad Basin, many of which are present in several countries; altogether, there are more than 70 ethnic groups, each

68
exploiting the natural environment by a range of activities. The majority of the populations speak several local and an official language. The main languages used in the area reflect the political roles exercised during the pre-colonial period: Kanuri (Niger and Nigeria), Fulfulde (Niger, Nigeria, Cameroon), and Arabic (Chad). These include a very diverse range of ethno-linguistic groups; in Nigeria alone there are 394 linguistic units (Otite 1990). The French and English colonial powers have also imposed their languages, and legal and administrative systems, upon the traditional ones; customary laws, regulations, and structures still determine land use systems in large measure.
The old Islamicised states (Kanem, Borno, the Peul Empire of Sokoto, Wadai and Baguirmi) are largely responsible for the present distribution of populations in the Basin, including the small groups that took refuge in the Mandara Mountains and the Mayo Kebbi regions. The Western shore of Lake Chad, where the majority of the Basin’s population resides, is under the jurisdiction of Borno (one of the 36 states of Federal Republic of Nigeria) and is dominated by the Kanuri ethnic group. Migration during the latter part of the millennium has brought Shuwa Arabs from the east and Fulani pastoralists from the west and recently during the 1970s Hausa families from across northern Nigeria who were attracted by fishing opportunities at the Lake (Neiland & Verinumbe 1990, Sarch 2001).
Most of the countries of the Lake Chad Basin have experienced considerable political instability and a history of domestic and international conflict since 1960 when they gained their independence from the colonial regimes of the United Kingdom and France. Nigeria has had 11 changes of government, military coups and a civil war, Chad has experienced almost continuous unrest and war, and only Cameroon has had a stable government (Neiland & Béné 2003). Outbreaks of armed clashes and rebel activity on islands in the Lake have persisted since the 1970s and are largely associated with the succession of civil wars in the Republic of Chad and the migration of Nigerian fishermen following the receding lake south eastwards. A multi-national ‘Joint Patrol’ was created in response to these outbreaks and has been monitoring the Lake to prevent further violence (Sarch 2001).
Population dynamics
Over the last two decades the annual population growth in the region has ranged between 2.5 and 3.0% (World Bank 2002c). The current population within the region is estimated to be approximately 37.2 million people (based on ORNL 2003). The total population has increased by about 11.7 million since 1990. Population estimates for 1990 was 25.5 million people (UNEP 1999). The Basin’s population is unevenly distributed between the countries. Nigeria, Africa’s most populous country hosts an estimated 22 million people (about 59%) of the total population living in the region. Whereas the northern and eastern peripheral countries, Algeria, Libya and Sudan, only have approximately 2.7 million inhabitants in the
Basin (about 7%), as it only represents just over 6% of the land area of the Basin (EROS Data Center 2002). Population densities are greatest in Nigeria and surrounding Lake Chad and decreases in the more arid northern locations. For example in the Tibesti Highlands the people are primarily nomadic pastoralists, and population densities are as low as 0-1 people/km2. The region is also experiencing rapid urbanization, as destitute rural

69
communities search for an improved standard of living in the swelling southern cities such as Kano (Nigeria), Maiduguri (Nigeria) and N’Djamena (Chad). In Cameroon the population of the northern city of Garoua has more than doubled from 122 600 to 287 000 between 1987 and 2003 (World Gazetteer 2003).
Population structure
The Basin’s population is characterized by a young age structure, particularly in the southern riparian countries. In Niger for example nearly 50% of the population is under 15 and only 2% is over 65 (World
Bank 2002c). The riparian countries of Sudan, Libya and Algeria, located on the periphery of the northern, northwest and northeast borders of the Basin have a larger proportion of over 65 year olds and their population structure is less skewed towards the young. The Basin’s population is also predominately rural. In Chad (46% of the Basin’s surface area) approximately 80% of the population is rural (IMF 2003).
Economic activities
In the Lake Chad Basin production activities are dominated by the primary sector and tertiary sectors in which technical progress is slow, with a predominance of informal, low productivity activities. In Chad and Niger those working in the primary sector head the poorest households because they make up 78% and 80% respectively of the population but account for only 39% of the GDP (World Bank 2002c, IMF 2003).
The primary sector employs more than 80% of the population and comprises primarily of agriculture and livestock rearing (Government of Niger 2002). Table 3.3 shows the regions sources of income.
Table 3.7 The Regions Household Sources of Income
Activity Millions USD
Fishing 45.1
Rain fed & flood recession cropping 26.6
Animal husbandry 14.7
Small scale irrigation 10.8
Large scale irrigation 9.4
Source: Nami 2002
The economic activities in the Basin include:

70
Mining: e.g. Gold mining in Central African Republic.
Oil: Exploration and exploitation.
Agriculture: Cotton, groundnuts, cassava, millet, sorghum, rice, onions. Mixed cropping is widely practiced.
Fisheries: In dams, rivers, floodplains and the Lake Chad.
Manufacturing: Cotton ginning, brewing, leather industry, machinery, milling and food industry.
Generally, the Lake Chad region is relatively less industrialized, however the commencement of oil exploitation in southern Chad may trigger industrial development. The number and sizes of industries also differ per country, but generally, there are few industries compared for example with the rest of West Africa. Agro-industries, textiles and tanneries dominate, whereas heavy industries are relatively few (World Bank 2002b). The majority of industry is focused in the urban areas that are disproportionately distributed with the highest concentrations in northern Nigeria and Cameroon, whilst the lowest are in Chad, CAR and Niger.
The economy of the basin is also characterized by flexibility, spatial and temporal mobility into and out of particular activities and lack of assets, savings or food security. Wetlands, essentially Lake Chad, smaller lakes, the rivers, and other seasonal water courses, provide drought fall-back reserves. Wetlands are the only natural insurance besides public aid, mobility and job-switching. In the past, intensive resource use was the rule in the conventional basin since extensive, low resource use technologies predominated. The Mandara Mountains constitute an exception. Intensive soil and water management was and still is practiced.
Of the principal modern export products of the LCBC countries only cotton (Chad, Cameroon) is produced in the conventional basin. Of secondary export products, livestock, which is critical to the economies of both Chad and Niger, is produced in or transits through the basin. Basin production of livestock contributes at least 31 percent of national production. Basin production of fish accounts for 12.5 percent of national fisheries production.
Economic growth
The countries within the region are among the poorest countries in the world. Chad was ranked 155th out of 162 countries on the United Nations’ 2001 Human Development Index (HDI), with an annual per capita income of only 200 USD. The Gross National Incomes (GNI) of the countries are extremely low with the exception being Algeria (no data for Libya). Out of 206 countries ranked by the World Bank in terms of GNI per capita; Chad, Niger, CAR and Nigeria are amongst the 23 poorest countries in the world (World Bank 2002c).

71
Economic growth is very slow and variable in the region. Overall in the 1980s and 1990s, Chad and Niger’s economies are characterized by a practically stagnant standard of living for the populations, with GDP growing in Chad by barely 1.4% per year over 20 years (IMF 2003) and in Niger by 1.9% per year over the decade 1990 to 2000 (Government of Niger 2002). In CAR and Sudan growth rates have declined steadily since 1997. The low growth rates of the Basin’s economies are considered as being insufficient to sustain long-term reductions in poverty and bring improvements in the standards of living in the region. In Nigeria, despite vast oil reserves, GDP growth averaged 1.6% between 1980 and 1990, 2.4% between 1990 and 1998, but just 1% in 1999 (Narayan & Petesch 2002).
The economies of the Basin’s countries generally suffer from a very low productivity, insufficient infrastructure, and poor governance, a lack of a dynamic private sector, an oversized informal sector and a vulnerability to domestic and external shocks. In Sudan and Chad economic progress has also been inhibited by the series of civil war and associated military expenditures, infrastructure deterioration and discouragement of foreign aid and investment. The AIDS pandemic has directly impaired economic growth because it mainly affects the economically active population. In Chad, 56% of detected cases are in the 14-49 year old population (IMF 2003).
Poverty
The Lake Chad region is trying to cope with mass poverty The percentage of poor households in the region is likely to be 60% or more (IMF 2003). Nigeria’s poverty has steadily grown worse since the 1980s and according to World Bank Development Indicators (World Bank 2002c) in 1997, 90.8% of the population was below the 2 USD per day international poverty line. Based on the poverty line set by the Poverty Profile for Niger prepared in 1994, 63% of the population is poor, and 34% is extremely poor. The extent of poverty in Algeria is not as severe as in the southern region’s of the Basin but in recent decades due to economic stagnation the percentage of the population under the poverty line has increased from around 8% to 14%.
Health
Standards of health in the region are overall very poor. However there is a great disparity between the northern countries of Algeria and Libya, which have far higher standards of health than the sub-Saharan nations.
Niger, Chad and CAR have the lowest standards of health. The health of the rural populations is inferior to that of the urban populations and it is often the case that these areas of the country are located in the Lake Chad Basin. For example in Niger, child malnutrition is most severe in the regions of Diffa and Zinder contained in the Lake Chad Basin as well as Maradi (Government of Niger 2002). Table 3.4 shows national statistics for health.

72
Table 3.8 Health & Education Indicators for LCB
Health & Education indicators
Chad CAR Cameroun Nigeria Niger Sudan Libya Algeria Sub Saharan Africa
Life Expectancy (2000) 48 43 50 47 46 56 71 71 47
Infant mortality/1000 life births (2000)
101 96 76 84 114 81 26 33 91
Prevalence of under nourishment, % of pop (1996 – 1998)
38 41 19 8 46 18 n.d 5 33
Incidence of TB/100,000 people
270 415 335 301 252 195 24 45 339
Physicians/1000 people (1990 – 1999)
>0.05 >0.05 0.1 0.2 >0.05 0.2 1.3 1.0 0.1
Health care expenditure, % of GPD
2.9 3 5 2.8 2.6 3.3 n.d 3.6 4.9
Adult illiteracy, male, % ages 15 & over (2000)
48 40 18 28 76 31 9 25 30
Adult illiteracy, femal, % ages 15 & over (2000)
66 65 31 44 92 54 32 43 47
Gross primary enrolment, % of school age group (1998)
67 57 90 n.d 31 56 153 109 78
Source: World Bank 2002c
Social Organization
Everywhere in the basin the traditional systems of social organization have been more or less transformed by the modern world system. Older systems of family and village solidarity have been modified or reduced in their degree of authority. Conversely in some cases new systems, village associations and cooperatives, women's and young people's associations, political parties, school groups, and the like, have been established. But, for the most part, these groups are young, often untried, and insufficiently trained for natural resource management work.
Generally, in the agricultural areas to the south, where population densities are relatively high, and where there is a long history of cooperative, missionary, or extension activity, the local populations have technological abilities (including ' traditional ones) and a ready

73
aptitude for organization and responsibility. In these well-watered zones, the role of outside assistance (states and donors) may be limited to canalization and technical supervision of anti-degradation measures.
By contrast, in the pastoral zone and in other zones of light population density, people neither have cooperative experience nor experience with sustained development activities. In these areas, the short-term capacity of the populations for organization for natural resource management is relatively feeble. This can be improved with a major training effort focused on interventions which correspond to the needs of an inherently mobile and flexible population, with few drought-fallback securities. In these areas (northern basins, Lake Fitri, Lake Chad) the involvement of the states and the donors must be correspondingly greater to provide the coherence and continuity required.
3.8 INSTITUTIONAL AND LEGAL ASPECTS
3.8.1 INTRODUCTION
Repositioning the existing institutional setting in the LCB member countries for tackling the challenges of integrated water resources management is central to the success of the program of reversing the degradation trends in the basin. There is a multiplicity of national line agencies and several regional organizations on the ground that needs to be understood and worked upon. There are also several upcoming civil society organizations that, if properly positioned, can play significant roles in promoting integrated land and water resources management practices in the basin. Furthermore, there are also existing national policies and laws in each country that need to be addressed.
Institutions/Agencies: At the regional level, there is fortunately an institution crafted by the member countries and given the responsibility for the sustainable development of the water resources of the LCB. This is the Lake Chad Basin Commission (LCBC), which was set up in 1964 by Cameroon, Chad, Niger and Nigeria. They were joined in 1994 by Central African Republic and by the Republic of Sudan (yet to ratify convention) in 2000. The aims of the commission are: to regulate and control the use of water and other natural resources in the basin, and to initiate, promote, and coordinate natural resources development projects and research. The commission also promotes mechanisms for settling disputes and enhancing regional cooperation. Further details on the commission can be found in GIWA (2004).
Table 3.5 below summarises the main water sector management authorities in the LCBC member countries and their functions. The table presents the government agencies responsible for water resources development, regulation and management, and management of water systems and infrastructures. Table 3.6 describes the functions performed by the water sector agencies

74

75
Table 3.9 The Main Water Sector Agencies in the LCB
Country Water resources Development Regulation and Management Management of water systems and infrastructures
CAR Ministry for Water, Forests, Wildlife & Fisheries
Ministry for Water, Forests, Wildlife & Fisheries
Ministry for Mines, Energy & Hydrology
Cameroon Société National des Eaux du Cameroun :
Société National des Eaux du Cameroun :
Société National des Eaux du Cameroun :
Chad Ministry of Agriculture, Chadian society for Water & Electricity
Ministry of Water & Environment
Ministry of Water & Environment, Ministry of Agriculture
Niger Regional Directorate for Agricultural Development, Regional Directorate for Environment
Regional Directorate of Hydrology, Regional Directorate for Community Development & Regional Planning
Regional Directorate for Community Development & Regional Planning
Nigeria Chad Basin Development Authority, Hadejia-Jema’are River Basin Development Authority, Upper Benue River Basin Development Authority, North East Arid Zone Development Programme, State Irrigation Departments x 6,
Federal Ministry of Agriculture & Water Resources, Federal Ministry of Environment & Housing, National Meteorological Organization, State Environmental Protection Agencies x 6,
Chad Basin Development Authority, Hadejia-Jema’are River Basin Development Authority, Upper Benue River Basin Development Authority, State Irrigation Departments x 6
Table 3.10 The Main Functions Performed by the Water Sector Agencies
Country Water Resources Development Regulation and Management
Management of water systems and infrastructures
CAR Monitoring & quality control Coordination of sectoral initiatives
Installation of water structures & distribution of water
Cameroon Monitoring & quality control Coordination of sectoral initiatives
Installation of water structures & distribution of

76
Country Water Resources Development Regulation and Management
Management of water systems and infrastructures
water
Chad Supplying of water for irrigation & monitoring
Development of policies Installation of water structures & distribution of water
Niger Monitoring & supply for irrigation
Development of policies for management of surface & ground water
Installation of water structures & distribution of water
Nigeria Harnessing of water for crop & livestock production, & for potable water
Formulation of policies & regulations for water use
Installation of water structures & distribution of water
The institutional setting/water resources management framework in each of the member countries is briefly described in the following sections.
3.8.2 CAR
The Ministry of Energy, Mines and Hydraulics is responsible for the over all management of surface and ground water. This Ministry ensures the coordination of water resources use and development by all concerned sectors.
The Ministry of Water, Forests, Hunting and Fishing is in charge of the development/use of water resources from the perspective of the environment. There are two departments in the ministry that articulate this. These are the Department for the Promotion and the Coordination of the Environmental Actions and the Department of Water, fishing and Fish culture.
The Department of Water, Fishing and Fish culture is charged to work out and implement the directives for the control of pollution, and the monitoring of the quality of water, as well as the regulations on water, fishing and fish culture. It has moreover the task to collect, synthesize and disseminate information relating to the quality of water.
The Ministry of the Equipment, Transport and Civil aviation is another line agency: Through one of its departments, the ministry is responsible for the execution of research in weather and hydrological sciences, to provide information for guiding economic development. It also takes care of the application of the international agreements subscribed to by the RCA regarding meteorology hydrology.
The Ministry for the public health and the population is another player in the: It intervenes through the Department of Community Health, which is charged to conceive and implement strategies and action plans in the fields of the public health and the healthiness of the

77
environment, nutrition, food hygiene and water; and to establish the standards as regards provision of services in these same fields.
NGOs such as CEDIFOD, CARFAM, CFAR, CARITAS-SPDH, UNACREF, and PAEDAS are interested mainly in awareness raising. Some are also interested in the financing of the hydraulic works, such as the African Muslim Agency.
Further more, some NGOs such as Central Africa Clean Country and ORAOM are interested in domestic garbage collection.
There are also international NGOs that take part in information/education and communication as it relates to water resources management. Such NGOs include AFRICARE, VITA, COOPI, AFVP, and OXFAM.
3.8.3 CAMEROON
The management of water sector in Cameroon is a prerogative of the state. Several Ministries are involved in the management of Water as follows:
- Ministry of Water and Energy; - Ministry of Agriculture and Rural Development; - Ministry of Livestock and Fisheries.
The Ministry of Water and Energy is involved in the management of potable water. In urban areas the supply of water is under the supervision of a Government agency named SNEC (Cameroon National Water Society). This agency collects, treat and distributes water. In rural areas, people have access to potable water through wells and boreholes provided by the same ministry or by some NGOs (ACCEN, CFAID, AIDR, ODCAM….), development Projects (PREPAFEN, PADC, PARFAR…), urban councils or the consumers themselves.
Unfortunately, access to potable water is poor, estimated at 86,2 % in urban areas compared to 31.3% in rural areas (estimation done in 2001). To solve this problem the Government has put in place a policy of privatisation of SNEC so as to be able to provide potable water for all in 2025 through the program called 'Hydraulique Rurale II’. In this way, the Government hope is to feel the gap and increase access to water in rural areas from 31.3 % to 75% by 2025.
On the other hand the same ministry is responsible for electricity generation (hydro from Lagdo dam) and distribution.
The Ministry of Agriculture and Rural Development is involved in rural water resources development for irrigation. This ministry formulates and implements policies and strategies regarding the management of small dams and the construction of other related infrastructures.
The Ministry of Livestock and Fisheries is involved in the construction and the management of ponds for livestock watering, and for fisheries exploitation.

78
A strategic action program for integrated water resource management (SAP IWRM) has been elaborated by the Ministry of Water and Energy for the coordination of water resources development by the all concerned agencies. This SAP IWRM is supposed to integrate the management of ground water and underground water, as well as the interests and concerns of all the sectors that have something to do with water.
3.8.4 CHAD
The management of the water sector in Chad, like in the other member states, is a prerogative of the state. Several agencies play various roles. These are the High National Committee for the Environment (HNCE), Water and Environment Ministry (MEE), Ministry of Agriculture, and the Ministry of Mines, energy and Oil (MMEP) that works in the water sector through the Chadian Society for Water and Electricity (STEE).
The HNCE coordinates all actions related to the environment; in particular it ensures the harmonious use of natural resources including water. Its main thrust is to ensure the environmental sustainability of all developments, including those in the water sector.
The MEE is responsible for the design and implementation of water resources development and natural resources management policies. It is also responsible for the implementation of national regulations as well as regional and international agreements related to water and other natural resources. It works through five departments. These are the Department of Hydraulics (DH) which is responsible for decentralised level activities, Department of Water Resources and Meteorology (DREM) which is responsible for planning and programming of the exploitation of surface waters as well as monitoring, Department of fisheries which is responsible for fisheries development, department of forestry and desertification control, and the department of Parks and Reserves.
The ministry of agriculture, in addition to other functions, formulates and implement policies and strategies regarding hydro-agricultural installations, as well as the construction of related infrastructures. It is also involved in the preservation of ground water.
The supply of potable water in urban areas is under the supervision of MMEP, which does this through STEE. STEE collects treats and distributes water, in addition to being responsible for electricity generation and distribution. Water supply in rural arrears is the responsibility of Boards of village management or village associations.
NGOs such as CARE International and World Vision are also active in the water sector in Chad. They provide water for villages, herders and truck farmers.
3.8.5 NIGER

79
The management of Water involves several Ministries, as follows:
1. Ministry of Water Resources is in charge of harnessing and sustainable utilisation of both surface and ground water, i.e., the over all management of water resources in the country. The ministry hosts an inter-ministerial water management team that coordinates water resources development by the various sectors and agencies.
2. The Department of Environment is in charge of the management of water resources from the perspective of environmental sustainability.
3. The Ministry of Agriculture is responsible for the development of surface and ground water resources for irrigation, as well as for the development of fisheries.
4. The Ministry of Animal Resources is responsible for the development of water resources for the livestock industry (pastoral wells, pastoral bore holes and ponds)
5. There are two agencies responsible for the supply of water to urban centres. These are SPEN and SEEN. They deal with production and distribution.
All the above agencies of government involved in the management of water resources, coordinated by the Ministry of Water Resources as the apex ministry, work within the context of a national policy on water resources and sanitation, which requires that: 1) the water resources of the country be harnessed and restored; 2) water be recognised and utilised as a tool for socio-economic development; and 3) water is to be used in a way that safeguards the environment.
The country is currently promoting a participatory approach to water resources management. Along this line, NGOs such as CARE play active roles in water resources development in the country.
3.8.6 NIGERIA
The Federal Ministry of Water Resources, merged early this year for the third time with the Federal Ministry of Agriculture, is the apex organ of government which has the statutory responsibility for policy formulation and coordination for water resources development and management throughout the federation. However, due to the dependence of other sectors of the economy on this critical resource, as well as the three tier system of government which Nigeria operates, several other statutory and non-statutory institutions are active players in the management of water resources in the basin. These include the following: the Federal Ministry of Environment (crafted from the defunct Federal Environmental Protection Agency in 1999 and merged this year with Housing to form the Federal Ministry of Environment and Housing); the Hadejia-Jama'are River Basin Development Authority (HJRBDA) and the Chad Basin Development Authority (CBDA); the governments of Bauchi, Borno, Jigawa, Kano and Yobe states through their state level ministries in charge of water resources and environment; the North East Arid Zone Development Programme (NEAZDP); Local Government Authorities through their

80
departments of agriculture; and several water-user associations, such as the Stakeholders Consultative Forum on the KYB.
Out of the six governmental organisations and over fourteen non-governmental organisations that have interest in the management of water resources in the basin, only two governmental institutions, namely Federal Ministry of Agriculture and Water Resources and Federal Ministry of Environment and Housing, and the Stakeholders Consultative Forum, are concerned with sustainable utilisation of the water resources of the basin. All the other institutions are inward-looking, concerned only with meeting their water requirements, with a minimal or no concern for the impacts of their activities on system. There is no organisation which regulates the water uses in the basin. Furthermore there are overlaps in the roles and mandates of the various governmental institutions in the basin.
There are two legal instruments which, when properly applied, can control the uncoordinated development of water resources in the basin. These are the Water Use Decree number 101 of August, 1993, and the Environmental Impact Assessment Decree number 86 of 1992. Although both decrees are already in force, the modalities for their effective implementation are currently being finalised by their custodians. A water management plan is to be implemented according to the provisions of the two decrees.

81
4 PRIORITY TRANSBOUNDARY PROBLEMS
4.1 INTRODUCTION TO THE TRANSBOUNDARY PROBLEMS AND PRIORITY SCORES
A Delphi exercise undertaken with representatives of the LCB riparian stakeholders (mainly TTT members from the member states) conducted in Maroua in September 2006 identified a harmonized list of seven priority transboundary problems. This was from a collection of the transboundary environmental problems presented by each member state. Figure 4.1 below presents the problems and their individual priority ratings as arrived at by the riparian stakeholders.
The graph indicates that they have been rated by stakeholders in the following order, starting from highest priority to least priority:
Variability of hydrological regime and fresh water availability;
Water pollution;
Decreased viability of biological resources;
Loss of biodiversity;
0.0
0.5
1.0
1.5
2.0
2.5
3.0
3.5
4.0
Changes and variability in hydrological regime & fresh water availability Water pollution Invasive species Decreased viability of biological resources including fish stocks Loss of biodiversity Loss and/or modification of
ecosystems Sedimentation in rivers and water bodies as a result of upstream land degradation
Median Value
Figure 4.1 Priority Transboundary Environmental Problems of the LCB and their Ratings

82
Loss and modification of ecosystems;
Sedimentation in rivers and water bodies and;
Invasive species.
The above transboundary problems, which constitute the past, present and future social risks to populations of the Lake Chad conventional basin are the products of the combined impacts of accelerating global climate change and unsustainable resources use practices by a growing population, driven by institutional failures. The net effect of the transboundary problems is deepening poverty in the sub region.
The following sections provide a description of each problem, its major impacts and consequences, its linkages with other transboundary problems, its causes, as well as gaps in knowledge regarding each of them, as determined/perceived by the stakeholders at the Maroua workshop of September 2006.
4.2 VARIABILITY OF HYDROLOGICAL REGIME AND FRESH WATER AVAILABILITY
4.2.1 DESCRIPTION OF THE PROBLEM AND JUSTIFICATION OF ITS TRANSBOUNDARY IMPORTANCE
Lake Chad and the rivers that feed it, and their associated wetlands, have been traditional sources of freshwater for domestic consumption and agricultural production throughout the centuries. Over the past forty years, the lake has shown a dramatic decrease in size, however. Coe and Foley (2001) in a study prepared for NASA determined that the lake’s volume had declined between 1966 and 1975 by approximately 30%. Since 1963 to date the lake has shrunk to a twentieth of its former size, apparently due to both climatic changes and high demands for agricultural water. Figure 4.2 below illustrates the point.

83
As the case is with the lake, the rivers that feed it have also experienced desiccation during the same period. Table 4.1 below, which shows the difference between the long term mean inflow into the lake and the mean for the period 1971 - 1990, illustrates the point.
Table 4.1 Drainage Areas, Inflows and Overall Water Balance of the Lake
S/No River sub-system Catchment area (Km2)
Area of lake & wetlands (Km2)
Long – term mean inflows in Km2/yr (pre 1970)
Mean inflow 1971 - 1990
1 Chari - Logone 590,000 8,000 39.8 (93%) 21.8 (96%)
Figure 4.2 Progressive Decline in Lake Chad’s Volume

84
S/No River sub-system Catchment area (Km2)
Area of lake & wetlands (Km2)
Long – term mean inflows in Km2/yr (pre 1970)
Mean inflow 1971 - 1990
2 Komadugu- Yobe 147,840 6,000 1.0 (2%) 0.45 (2%)
3 Yedseram-Ngadda-Ebeji
53,720 80 - 120 0.89 0.12
4 Others 1.2 0.2
5 Total river inflows 42.89 22.57
6 Rainfall on open water surface
6.0 2.1
7 Total inputs 48.89 24.68
Source: Oyebande (1997)
Beside the general decline in the quantity of available fresh water in the lake and its rivers, there is also a marked variability in hydrological regimes of the rivers. For example, the Komadugu Yobe system, which used to flow for nine months a year, now barely flows for four months and has unpredictable starting and ceasing dates.
The lake’s desiccation is a transboundary problem because, not only is this development impacting on all the countries of the region, but also a reversal in the trend can be effected only if all the concerned act in a concerted manner. Likewise the variability in channel flows, especially in the KYB and Chari Logone systems affect multiple countries and can not be addressed by individual countries.
Rainfalls have also not only suffered a decrease in quantity and duration, but there have also been inconsistencies in onset and ceasing dates. Figure 4.3 below, shows rainfall variability in the region.

85
Figure 4.3: Rainfall Variability in the Sahel, 1950 - 2000
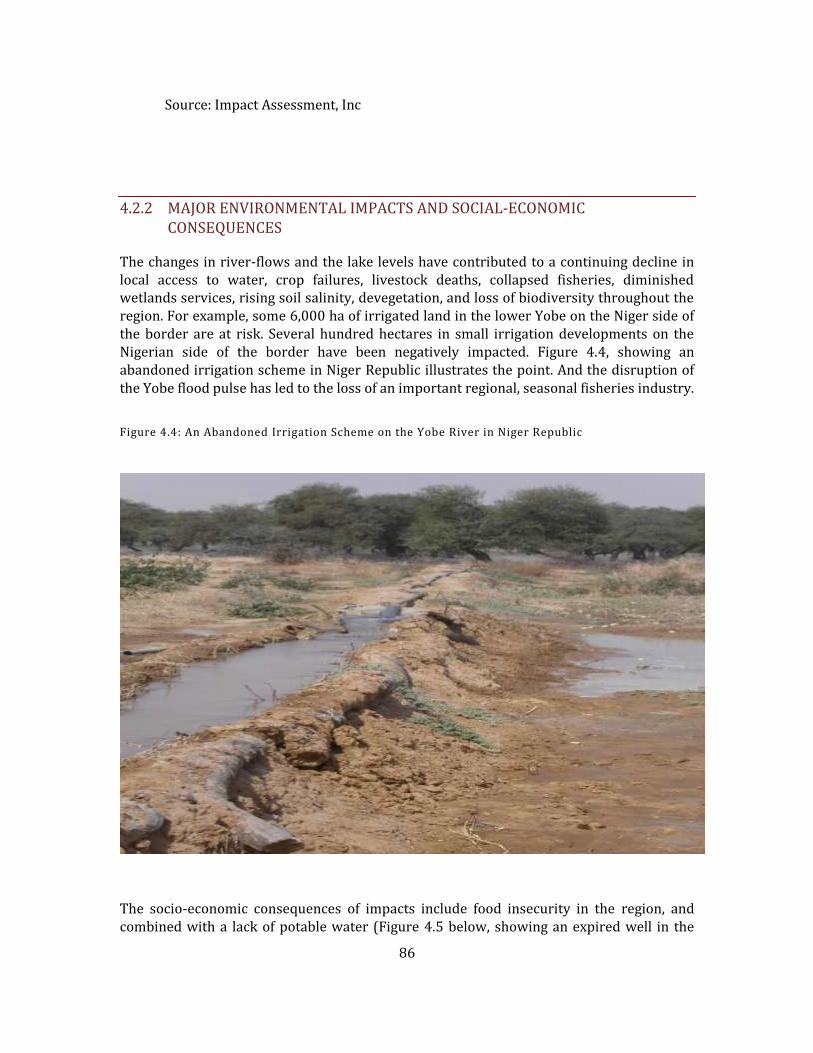
86
Source: Impact Assessment, Inc
4.2.2 MAJOR ENVIRONMENTAL IMPACTS AND SOCIAL-ECONOMIC CONSEQUENCES
The changes in river-flows and the lake levels have contributed to a continuing decline in local access to water, crop failures, livestock deaths, collapsed fisheries, diminished wetlands services, rising soil salinity, devegetation, and loss of biodiversity throughout the region. For example, some 6,000 ha of irrigated land in the lower Yobe on the Niger side of the border are at risk. Several hundred hectares in small irrigation developments on the Nigerian side of the border have been negatively impacted. Figure 4.4, showing an abandoned irrigation scheme in Niger Republic illustrates the point. And the disruption of the Yobe flood pulse has led to the loss of an important regional, seasonal fisheries industry.
The socio-economic consequences of impacts include food insecurity in the region, and combined with a lack of potable water (Figure 4.5 below, showing an expired well in the
Figure 4.4: An Abandoned Irrigation Scheme on the Yobe River in Niger Republic

87
Yobe Basin in Niger republic, illustrates the point). This has had implications on the health status of the LCB’s population. Furthermore, freshwater shortages have included upstream/downstream conflict over who has the right to use the diminishing water resources. Social tensions have been further provoked by the increased pressure on resources from the migration of people from the drought stricken northern regions of the LCCB into areas surrounding the lake and associated river basins, as well as by job switching that has intensified the competition for irrigable agricultural land. Continuing social disruptions hold the key risk of diverting the majority of resources into seeking to mitigate for these ‘symptoms’ rather than addressing root causes of system decline.
Drought, as an element of hydrological variability, and water diversions have also led to emigration. The entire department of Diffa in Niger has lost about 10,000 inhabitants since the early 1980s.
4.2.3 LINKAGES WITH OTHER TRANSBOUNDARY PROBLEMS
Figure 4.5 An Abandoned Well in the Yobe Basin in Niger Republic

88
Overall, the reduction in freshwater is considered as being the most severe problem due to it driving almost all environmental concerns in the Lake Chad Basin. It is a contributory immediate cause of five out of the seven transboundary problems identified by stakeholders in Maroua last September. These are: Decreased viability of biological resources, in particular fisheries, as many have been lost due to desiccation (Section 4.4) ; Loss of biodiversity, especially as a result of the desiccation of the lake and of some wetlands (Section 4.5); Loss and modification of ecosystems, especially aquatic ecosystems again as a result of desiccation (Section 4.6); Sedimentation in rivers and water bodies due to decreases in channel flows as well as the loss of the ability of the rivers to flush out their channels at the onset on the rainy season and (Section 4.7); Invasive species that have been attracted by the all year round inundation of floodplains and river channels in the Komadugu Yobe system in particular (Section 4.8).
4.2.4 IMMEDIATE, UNDERLYING AND ROOT CAUSES
The causal chain for the variability of the hydrological regime and fresh water availability shown in Figure 4.6 identifies the immediate, underlying and root causes of this transboundary problem. The text below highlights some key points from this diagram.

89
Figure 4.6: Causal Chain Analysis for Variability of Hydrological Regime and Fresh Water Availability
Root Causes Intermediate/Underlying Causes
Socio economic drivers Resource use
Low standard of environmental education & awareness.
Drought/reduced rainfalls. (Externa Driver)
Lack of integration in sectoral development planning & mangt.
Population growth or pressure.
Lack of /mismanagement of public funds for envtal. Protection/improvement.
Absence of sustainable development/wise use of natural resources on political agenda.
Lack of/poor enforcement of environmental conservation regulations, guidelines and standards in farming practices.
Lack of/poor endorsement of envtal. conservation regulations, guidelines & standards in forest resources harvesting.
Poor capital investment & operational funding for channel maintenance e.g. river training.
Absence of user fees/free access to cpr water.
Absence of resources use planning.
Lack of finances
Poor dam operation procedures.
Weak/absence of water use allocation policy
Weak envtal. policy and regulations related to water abstraction.
Unsustainable farming practices e.g. clear felling
Poor maintenance of river channels
Low awareness of farmers on sound land mangt. or soil conservation practices.
Uncontrolled devegetation of rangelands from fuel wood, construction material and fodder harvesting leading to soil erosion.
Inefficient/wasteful raw water infrastructures.
Inefficient/wasteful irrigation practices.
Poor/uncontrolled development of irrigated agriculture.
Siltation of channels & water bodies.
Flow diversion/ abstraction.
Reduced flow

90
Coe and Foley (2004) calculated that irrigation and river water diversions accounted for only 5% of the decline in the lake’s volume between 1966 and 1975, with declining rainfall accounting for the remaining 95%. As population expanded irrigation demands increased by four fold between 1983 and 1994, accounting for 50% of the subsequent decrease in the lake volume. The driving forces associated with this include: persistent droughts and decrease in rains that made reliance on rain fed agriculture uncertain, lack of integration in sectoral development policies and planning that pursued agricultural development at the expense of the environment, low standards of environmental education and awareness that clouded appreciation of the negative impacts, and the absence of sustainable development on the political agenda. Large and unsustainable irrigation projects built by Niger, Nigeria, Cameroon, and Chad, have been diverting water from both the lake and the major contributing rivers, the Chari and Logone system, as well as from the Komadugu Yobe Basin. For example, in Nigeria there are three large dams and 22 small ones in the KYB constructed during this period. The three large dams are Bagauda (closed in 1972, with a surface are of 145 km2), Tiga (closed in 1972, with a surface area of 180 km2 and Challawa (closed in 1992, with a surface area of 100 km2) constructed primarily to support heavily subsidized large scale irrigation schemes. In Cameroon the Maga dam, with a surface area of 400km2, that diverted flows from the Yaeres, was also constructed during this period. It was meant to support a large scale rice production scheme, which has now failed.
In addition, heavy overgrazing in the region, resulting in the loss of vegetation and serious deforestation, has contributed to the desiccation of the rivers that feed the lake. Refer to Section 4.6 for more detail on this particular issue.
The population of the basin also increased by 30% (10 million) between 1994 and 2004, serving as a driving force behind the above developments, as well as behind other unsustainable resources use activities. Stream diversion, associated with the construction of water infrastructure, has also been an immediate cause of anthropogenic stream flow modification. A case in point is the inefficient raw water intake structures for Kano City in the KYB which have changed flows in stretches of the rivers from annual to a perennial.
The numerous dams have disrupted the timing and extent of the flooding of the LCCB wetlands.
Upstream damming, especially their operation in an unintegrated manner, irrigation development with 11% use efficiency and the drought have negatively effected the
Poor sectoral planning
Lack of admin. framework for maintaining/managing rivers.
Weak envntal policy and regulations related to maintenance/protection of rivers.
Damming of rivers.
Absence of water conservation
practices.

91
downstream flow regimes and flood pulse on which the populations of the lower Komadugu increasingly depend. This type of development may not be unique to the KYB alone.
4.2.5 KNOWLEDGE GAPS
There is a severe lack of up to date hydrological information for the whole basin and its rivers, as there is no functional hydrological monitoring network for the basin.
There is a general lack of information on groundwater reserves and the impacts of abstraction are not known, but potential groundwater resources are minimal. The impact of changes in the water table due to the reduction in the flows, wetlands, and lake, and therefore their aquifer recharge function, and due to the indiscriminate sinking of boreholes that are often uncapped and free flowing, is unknown.
There also appears to be no report on the cumulative impacts of water diversions in the headwaters of the mayos. The downstream consequences of diversions and storage are also not properly understood.
4.3 WATER POLLUTION (OIL, MICROBIOLOGICAL, ORGANIC, INORGANIC, MINERAL ETC.)
4.3.1 DESCRIPTION OF THE PROBLEM AND JUSTIFICATION OF ITS TRANSBOUNDARY IMPORTANCE
Due to the limited industrial activity and relatively limited and localized application of agricultural fertilizers in the LCB, contamination is currently of limited concern and current quantities are thought not to exceed the local environmental assimilative capacity. In the Komadugu Yobe Basin in Nigeria, however, there are already traces of pollutants (zinc, mercury and magnesium metals in the system, introduced mainly by tannery and textile industries in Kano, where there is evidence of the discharge of untreated effluents into the rivers.
The relatively high priority rating of this problem by stakeholders is in view of foreseeable trends and the dangers they portend for the region. Increasing commercial agriculture in, for example, the cotton and rice industries, which are known to use large quantities of agro-chemicals (including herbicides, insecticides and fertilizers), will lead to inorganic chemical pollution and eutrophication.
There is also increasing oil exploitation within the basin, especially in Chad, which will give rise to increased urbanization, population, and resource consumption. Oil spills and related

92
hazards will cause severe contamination of the water bodies and further deplete the flora and fauna. In spite of the foregoing there is no evidence of any preparations in the region for addressing the issue (e.g. there is no ongoing review of legislation or contingency planning).
Increased irrigated cultivation tends to concentrate pests. Borers, caterpillars, locusts, crickets, quelea birds, and golden sparrows are already endemic. Increased use of pesticides such as DDT, some of which are considered toxic in the United States and Europe, poses a risk of pesticide loading in water, which could potentially affect the human population.
4.3.2 MAJOR ENVIRONMENTAL IMPACTS AND SOCIAL-ECONOMIC CONSEQUENCES
Currently there is little evidence of environmental impacts from chemical pollution. However, in the KYB chemical pollution from the tannery and textile industry has been implicated in incidences of river water pollution (including Zn and Hg), that have in turn led to health hazards (skin diseases and stiff joints epidemics in Kano) and fish kills and resultant loss of livelihoods.
4.3.3 LINKAGES WITH OTHER TRANSBOUNDARY PROBLEMS
Water pollution is a contributory factor to the immediate causes of fisheries depletion in the KYB. Pollution from agricultural chemicals has also contributed to the prevalence of invasive species through the eutrophication of the invaded water bodies.
4.3.4 IMMEDIATE, UNDERLYING AND ROOT CAUSES
The causal chain for water pollution, shown in Figure 4.7 identifies the immediate, underlying and root causes of this transboundary problem. The text below highlights some key points from this diagram.

93

94
•Political/Economic
changes and/or instability
•Low standard of living
(poverty, unemployment,
low incomes)
•Low standard of
environmental education
and awareness
•Poor implementation of
sectoral management
planning
Root causes
Lack/ poor enforcement of environmental protection regulations in industry (including energy and extraction of raw materials)
Poor or no enforcement of trade waste discharge regulations
Weak sectoral industrial policy and related legislations
No incentive for pollution prevention and control
Lack of finances
Poor or uncontrolled development of mining activities
Low level of user fees (tariffs) and incentives for wastes collection, storage
Poor management/planning/use of waste spoil sites
Poor capital investment and operational funding for waste collection/storage and treatment
Infiltrations from waste spoil
Diffuse pollution from mine activities
Discharge of wastewater from mining enterprises
Inappropriate waste spoil disposal
Untreated industrial effluents and/or poorly maintained industrial treatment plants
Absence of / or outdated treatment technology
Old industrial technologies and practices
Poor management/planning/use of mines and waste spoil disposal
Lack of treatment, and/or no infrastructure for collecting waste spoil
Lack of operation and maintenance of mining activities and waste spoil disposal
•Lack/ mismanagement of
public funds dedicated to
improve the quality of the
environment
Lack/poor enforcement of environmental protection regulations
No incentives for pollution prevention and control
Weak sectoral industrial policy and related legislations
Absence of or outdated storage and treatment technology and facilities
Poor maintenance equipment
No effective monitoring and contingency plans for oils spills
Illegal operations
Operational oil spills
Potential accidental oil spills
Socio-economic drivers Resource
uses
Immediate Causes Intermediate/Underlying causes
Weak environmental policy and regulations related to application of fertilizers, pesticides and herbicides
Weakly developed legislation and enforcement mechanisms related to the use of pesticides and fertilizers
Low farmers’ awareness on the negative impacts of application of fertilizers, pest and herbicides
Lack of administrative framework to manage and evaluate diffuse sources of pollution from agriculture
Use of illegal pesticides, herbicides and fertilizers
Inefficient/unsustainable agricultural practices
Low awareness of farmers on sound land management
Lack of “Best Management practices” in agriculture
Potential of diffuse pollution from improper application of fertilizers, pesticides and herbicides
Discharge of untreated industrial effluents
Land contamination from accidental spills and hazardous waste
Figure 4.7: Causal Chain Analysis for Chemical Pollution

95
The immediate cause of the current traces of pollution of water bodies in the KYB is the release of untreated zinc and mercury laden effluents by upstream tannery and textile industries in Kano. This is happening due to a weak enforcement of environmental regulations, guidelines and standards, as well as a low standard of environmental education and awareness that has made the public unaware of the impacts of the industrial effluents.
Diffuse chemical pollution is also being driven by unsustainable application of fertilizers and other agricultural chemicals by farmers with low environmental awareness, operating in the absence of regulations and guidelines for the wise use of agricultural chemicals.
4.3.5 KNOWLEDGE GAPS
The distribution and quantity of the chemicals in the environment is not known and there is currently a severe lack of monitoring and information networks regarding pollution. There is also no information on the assimilative capacities of the local receiving environments in the LCB.
4.4 DECREASED VIABILITY OF BIOLOGICAL RESOURCES (INCLUDING FISH STOCKS)
4.4.1 DESCRIPTION OF THE PROBLEM AND JUSTIFICATION OF ITS TRANSBOUNDARY IMPORTANCE
Vegetation cover in the basin, which is the primary source of fuel wood, construction wood and other related materials, as well as fodder, foods and medicines, is no longer meeting these needs adequately. In large cities like Kano and N’djamena, fuel wood is sourced from distances of up to 300 km. The rate of regeneration of plant cover in the basin lags behind the rate of exploitation, to the extent that in some parts of the basin, especially the KYB, the seedlings of several tree species have disappeared. Drought has killed off or damaged many tree species. Terminalia avicennoides, Anogneissus, leiocarppus, Scleorcarya birrea, and Lannea and, where the water table has dropped, Acacia nilotica have all sufferred. Tree death has been apparent on both the slightly leached, ferruginous soils of the southeast, and the isohumic soils of the north. Figure 4.8, a photograph depicting tree death in CAR, illustrates this point.

96
The fish populations in the lake have suffered declines recently from drought, overfishing, diversion or blockage of stream flows, and increased juvenile catch due to use of smaller mesh. The most important fish in Lake Chad are the characin (Alestes baremoze) and the Nile perch (Lates niloticus). Characin populations have decreased drastically while Nile perch catch-sizes have decreased substantially so that they seldom exceed 5 to 8 kg in weight, compared to past weights of over 10 kg. The average size of the fish shows that the resource is today being severely exploited. Figure 4.9 below, depicting a fine mesh fishing gear in use on the Logone in Cameroon, illustrates the point.
Figure 4.8: Photograph Depicting Tree Death in CAR

97
Figure 4.9:Photo Depicting Fine Mesh Fishing Gear in Use on the Logone in Cameroon
Viewed as a biological resource, large portions of the soils of the conventional basin are today classified as highly degraded.This has resulted from the vulnerability of the soils of the basin to degradation, coupled with a tendency to over-exploit the limited carrying capacity to meet food requirements by using inappropriate or unsustainable farming methods. This is illustrated by the widespread encrustation of halomorphic alkali soils that have been denuded. Around N'djamena, soil degradation has spread among the brown soils, the hydromorphic soils, the ferruginous soils and the alkaline soils. There are large bare areas with crusts, as illustrated in the photograph below. Figure 4.10 is a photo of an encrusted bare surface in Cameroon. Millions of hectares have been lost to agricultural production due to this phenomenon.

98
Figure 4.10: Photo Depicting an Example of an Encrusted Bare Surface in Cameroon
The transboundary nature of this problem lies with the forces which cause it. These include borderless unsustainable harvesting of resources and poor management of changes in climatic trends.
4.4.2 MAJOR ENVIRONMENTAL IMPACTS AND SOCIAL-ECONOMIC CONSEQUENCES
The degradation of vegetation cover has had a multiplier effect on ecosystem degradation, as the people’s response to the concomitant shortages has been more unsustainable harvesting and more damages. The shortages have led to more competition and even resources use conflicts, especially among pastoralists and between pastoralists and cultivators. It has also caused soil degradation, mainly by exposing the soils to erosion and depriving them of organic matter content. These in turn have caused declines in incomes.
Declines in the viability of fisheries have led to less catches in both the quantities caught and the sizes of the catches. This again has translated into impoverishment.
The encrusted soils reduce infiltration and increases runoff, sheet wash and scouring. It also encourages the formation of sand sheets and nebkhas. The net result is less soil productivity and increased poverty.

99
4.4.3 LINKAGES WITH OTHER TRANSBOUNDARY PROBLEMS
Devegetation and soil degradation lead directly to loss of biodiversity Section 4.5), and even to reduction in available fresh water Section 4.2), as it encourages rapid run offs and channel siltation. They also lead to ecosystem modification (Section 4.6), and can encourage the prevalence of invasive species (Section 4.8).
4.4.4 IMMEDIATE, UNDERLYING AND ROOT CAUSES
The causal chain for the decreased viability of biological resouurces, shown in Figure 4.11 identifies the immediate, underlying and root causes of this transboundary problem. The text below highlights some key points from this diagram.

100

101
Figure 4.11: Causal Chain Analysis for Decreased Viability of Biological Resources (Including Fish Stock)
Root Causes Intermediate/Underlying Causes
Socio economic drivers Resource use
Immediate Causes
Low standard of living (poverty, unemployment, low incomes).
Reduced rainfalls/Drought. (External Driver)
Lack of integration in sectoral development & mangt planning.
Population growth or pressure.
Lack of /mismanagement of public funds for natural resources conservation/management.
Absence of sustainable development/wise use of natural resources on political agenda/political & economic instability.
Lack of resource use planning.
Weak/poor management of protected areas.
Lack of/poor enforcement of environmental conservation regulations, guidelines and standards related to resource use/harvesting.
Low resources users awareness of negative impacts of resources harvesting techniques.
Use of illegal chemicals & explosives.
Lack of admin. Framework for habitat protection outside protected areas.
Weak envtal policy & regulations related to agric. Practices & settlements.
Lack of/poor enforcement of environmental protection regulations, guidelines and standards for natural resources exploitation.
Weak/lack of energy policy & related application.
Lack of integration in sectoral development & mangt. planning.
Absence of user fees for water.
Poor enforcement of envital. Protection regulations & standards.
Unsustainable/ inappropriate fishing techniques (e.g. small mesh sizes, dynamites, poison)
Unsustainable/ inappropriate harvesting of vegetal resources (e.g. indiscriminate felling for timber & fuelwood, over grazing.
Over hunting/ poaching of wildlife.
Uncontrolled expansion of farmlands & settlements.
Uncontrolled exploitation of vegetal resources (e.g. fuelwood, timber, fodder).
Bush burning.
Inappropriate agric. Practices such as slash and burn.
Over exploitation of ground water leading to lowering of water table and tree death.
Introduction of invasive species.
Drainage of wetlands.
Abstraction/ diversion for irrigation & water supply at expense of envtal. needs.
Pollution/ contamination of
water bodies.
Control/disruption
of flooding rythms.
Over harvesting/ over exploitation of biological/ natural resources.
Habitat loss and/ modification
Freshwater shortages
Low standard of envtal. education & awareness.

102
Chaotic deforestation is a chronic problem. Domestic and industrial energy use from the fish-drying and bread-making industries of Maiduguri, Kano, N’djamena and other major towns contributes significantly to deforestation. Wood cutting has become a lucrative economic activity that is conducted without adequate management plans for naturally forested areas. For example, in the Nigerian sector of the LCB, demand for wood exceeds supply by a large margin. This is because the annual domestic wood demand by the estimated population of 22 million is 7.5 million metric tones, while what can be harvested sustainably from the sector averages 5 million metric tones per annum (Neiland, A and Verinumbe, I 1990).
Seasonal burning for land clearance is also a serious problem that contributes to deforestation and air pollution.
The degraded soils have little to do with drought. They are predominantly the result of devegetation by humans. Up to 120 km east of N'djamena, the cutting of trees (A. seyal) in the sandy clays and the cutting of A. nilotica from the hydromorphic soils is severe. A. nilotica has almost entirely disappeared. The most severe degradation is east of N'djamena.
Significant habitat modification is one of the driving forces behind the decreased viability of fisheries. This has been largely a consequence of the freshwater shortage. The unsustainable exploitation of the fish and other living resources is thus not considered as the primary reason for the fluctuations in fisheries production experienced over the past years, as habitat modification is the main culprit.
Among the root and underlying causes of diminishing fisheries are the facts that: there is no internationally recognized institution controlling fishing effort, areas and seasons; there is also a huge black market in fish sales making it difficult to monitor species, amount and age of fish; there are no enforceable rules on mesh size, species catch, fish "reserves", age of fish caught, etc. The lack of enforceable codes allows over-exploitation of certain species and age-classes. For example, in 1977, commonly used net mesh size was already too small. It should not have been smaller than 60-70 mm. By 1971, Alestes baremoze had been over-exploited independent of water levels and drought conditions.
4.4.5 KNOWLEDGE GAPS
There is lack of information on the stock and trends of the biological resources that can support effective resources use planning. This is due to the absence of mechanisms for monitoring natural resources.
4.5 LOSS OF BIODIVERSITY

103
4.5.1 DESCRIPTION OF THE PROBLEM AND JUSTIFICATION OF ITS TRANSBOUNDARY IMPORTANCE
While conditions differ for different ecosystems and parts of the LCB, in general the biodiversity and ecosystem health have declined dramatically and continue to do so.
Fish diversity has reduced dramatically throughout the basin. In the HNWs in the KYB, for example, a biodiversity survey conducted by IUCN in 1997 revealed that 43 species from 14 families had disappeared from an inventory done two decades earlier that listed 24 families with 106 species (Okali and Bdliya, 1997). The lost fishes are shown in table 4.2
Table 4.2: Lost Fishes of the Hadejia Nguru Wetlands
S.no Family Species lost
1 ARIIDAE Arius gigas
2 BAGRDAE Bagrus docmac, Chrisichthys nigrodigitatus, Chrisichthys forkatus, Clarotes laticeps, Clarotes macrocephalus
3 CYPRINIDAE Labeo pseudocoubie, Labeo parvus, Barbus occidentalis, Barilius loati
4 CHINNIDAE Parachcnna obscurus
5 CHARACIDAE Alestes baremose, Alestes macrolepidotus, Alestes brevis, Hydrocynus forskalis, Hydrocynus somonorum, Hydrocynus brevis
6 CICHLIDAE Tilapia monodi, Tilapia mariae
7 CITHARINIDAE Citharinus citharus, Citharinus distichoides, Citharinus latus, Citharidium ansorgei
8 CARANGIDAE Trachnotue goreensis
9 CLARIDAE Claria submarginatus, Heterobranchus longifilis, Heterobranchus bidorsalis
10 DISTICHODONTIDAE Distichodus rostratus
11 GYMNARCHIDAE Gymnarcus niloticus
12 HEPSETIDAE Hepsetus odoe
13 ICHTHYOBORIDAE Ichthyoborus besse
14 MORMYRIDAE Mormyrops deliciosus, Mormyrops engystoma, Mormyrops oudoti, Mormyrops macrophthalmus, Marcusenius harringtoni, Gnathonemus tamandua, Gnathonemus deboensis,
104
S.no Family Species lost
Gnathonemus petersii
15 NOTOPTERIDAE Xenomystus nigri
16 POLYPTERIDAE Polypterus birchir, Polypterus endlicheri, Polypterus ansorgei
Source : Okali & Bdliya 1997
Regarding wildlife, the sitatunga is now considered extinct in Niger while only a few declining populations remain in the Lake Chad region of Nigeria and no recent information is available for Chad and Cameroon. A reduced hippopotamus population is still present and otters remain common. Nile crocodiles are now uncommon in the lake. A few populations of elephant, kob, and red-fronted gazelle still survive. Although humans have generally hunted out other large mammals and crocodiles, viable populations of smaller mammals (such as the endemic Lake Chad gerbil), smaller reptiles, and amphibians remain.
Of global significance is the threat of loss of a floating rice variety (Glaberima) in the KYB and the Kuri cattle breed around the lake. The rice variety, grown mainly along the middle reaches of the Yobe, has a unique flavor and is quick and high yielding. The Kuri cattle is resistant to the common bovine diseases in the region. Their disappearance will reduce opportunities for effecting improvements in crop and livestock production.
4.5.2 MAJOR ENVIRONMENTAL IMPACTS AND SOCIAL-ECONOMIC CONSEQUENCES
Changes in biodiversity affect ecosystem functions and productivity. While some of these impacts can be predicted, others cannot. As biodiversity decreases, ecosystem productivity and services deteriorate.
For example, the decrease in crocodile and hippopotamus populations may have adversely affected fish populations. Crocodile prey heavily upon catfish (Clarias gariepensis) which consume the eggs and fry of tilapia and other cichlids. Without crocodiles to control catfish populations, the catfish reduce tilapia stocks. Hippos also maintain fish stocks by stirring up rich water sediments, keeping deepwater channels open and increasing water fertility with their dung.
Furthermore, as a result of climate variability and water development projects being pursued without integration to other sectors, at least five species of fish (Bagrus docmac, Alestes baremose, Labeo parvus, Citharinus latus, Gymnarcus niloticus) have disappeared from different parts of the Lake Chad Basin in Nigeria. Examples of such projects include the large dams in the KYB and the manner in which they are operated without due recourse to environmental considerations. The experience in the Logone valley south of the SEMRY Irrigation Project is also similar: fish yields collapsed by 90% for lack of inundations.

105
The net consequence of biodiversity loss is increased impoverishment of the human population as a result of the loss of natural products and ecosystem functions.
4.5.3 LINKAGES WITH OTHER TRANSBOUNDARY PROBLEMS
Biodiversity loss causes decreased viability of biological resources Section 4. 4) and the loss and modification of ecosystems Section 4. 6). It is caused to a large extent by variability of hydrological regimes and fresh water availability, as well as water pollution and invasive species.
4.5.4 IMMEDIATE, UNDERLYING AND ROOT CAUSES
The causal chain for loss of biodiversity, shown in Figure 4.12 identifies the immediate, underlying and root causes of this transboundary problem, which are similar to those responsible for the other biological transboundary problems (decreased viability of biological resources, loss and modification of ecosystems, as well as invasive species). The text below highlights some key points from this diagram.

106
Figure 4.12: Causal Chain Analysis for Loss of Biodiversity
Root Causes Intermediate/Underlying Causes
Socio economic drivers Resource use
Low standard of living (poverty, unemployment, low incomes).
Lack of integration in sectoral development & mangt planning.
Population growth or pressure.
Lack of /mismanagement of public funds for natural resources conservation/management.
Absence of sustainable development/wise use of natural resources on political agenda/political & economic instability.
Lack of admin. Framework for habitat protection outside protected areas.
Weak envtal policy & regulations related to agric. Practices & settlements.
Lack of/poor enforcement of environmental protection regulations, guidelines and standards for natural/ vegetal resources harvesting.
Lack of resource use planning.
Lack of integration in sectoral development & mangt. planning.
Lack of resource use planning.
Lack of/poor enforcement of envtal protection regulations, guidelines & standards in relation to resources harvesting.
Low resources users awareness of negative impacts of unsustainable resources harvesting techniques.
Use of illegal chemicals. Absence of user fees for
water.
Weak enforcement of envital. protection regulations, guidelines & standards in water resources exploitation.
Lack of integration in sectoral development & mangt. planning.
Uncontrolled expansion of farmlands & settlements.
Uncontrolled exploitation of vegetal resources (e.g. fuelwood, timber, fodder).
Bush burning.
Disturbance of water bodies.
Introduction of invasive species.
Drainage of wetlands.
Disruption of food chains through over harvesting/extinction of some resources.
Unsustainable/ inappropriate fishing techniques (e.g. small mesh sizes, dynamites, poison)
Unsustainable/ inappropriate exploitation of vegetal resources (over grazing clear felling for constr. materials & fuel wood.
Over hunting and poaching of wildlife.
Abstraction of and/ diversion of supply.
Pollution/ contamination of
water bodies.
Over harvesting/ over exploitation of biological resources.
Habitat loss.
Freshwater shortages
Immediate Causes
Low standard of envtal. education & awareness.

107
Freshwater shortage resulting from over abstraction and the consequent habitat modification, along with the over harvesting of resources, are regarded as the main influencing drivers of biodiversity loss. There is also habitat loss from the uncontrolled expansion of farmlands and settlements, and the drainage of wetlands, which along with the other immediate causes are driven by the lack of administrative frameworks for protecting habitats outside protected areas. This is further worsened by the prevalence of weak environmental policies and regulations or their weak enforcement, as well as the absence of resources use planning. Climate change is predicted to have further severe further impacts on biodiversity.
The fish habitat in the lake has altered from being an open water environment to being a predominantly marshy environment. The fish species composition has changed to reflect this and significant biodiversity loss has been recorded during the past decade or so. According to the LCBC fisheries unit, Clarias gygas has disappeared due to the habitat changes, while Heterotis niloticus, Alestes (Sardine) and gymnarcus niloticus , all of which used to be dominant, are now scarce. On the other hand, Tilapia (Oreochronis) has now become predominant.
Bird life is threatened by decreasing water levels that have resulted in loss of wetland habitats in general and seasonal inundations in particular, which are needed by the birds. Recent concerns include the availability of nesting sites for the endangered West African subspecies of black-crowned crane (Balearica avonina pavonina) and adequate wintering grounds for numerous intercontinental migrants such as the ruff (Philomachus pugnax).
The decreased inundated area of the Waza-Logone floodplain has been a major cause for the reduction in the number of kob, and the complete disappearance of buffalo, waterbuck, bushbuck and common duiker in the Waza National Park.
Devegetation and declining rains have led to a marked shortage of seedlings of large tree species in the wild.
4.5.5 KNOWLEDGE GAPS
There is a paucity of information on fish species, their importance and status in the basin. There is no comprehensive and up to date biodiversity profile for the basin that can support a concerted management intervention.
4.6 LOSS AND MODIFICATION OF ECOSYSTEMS (INCLUDING TERRESTRIAL AND WATER ECOSYSTEMS)
Reduced rainfalls/Drought. (External Driver)
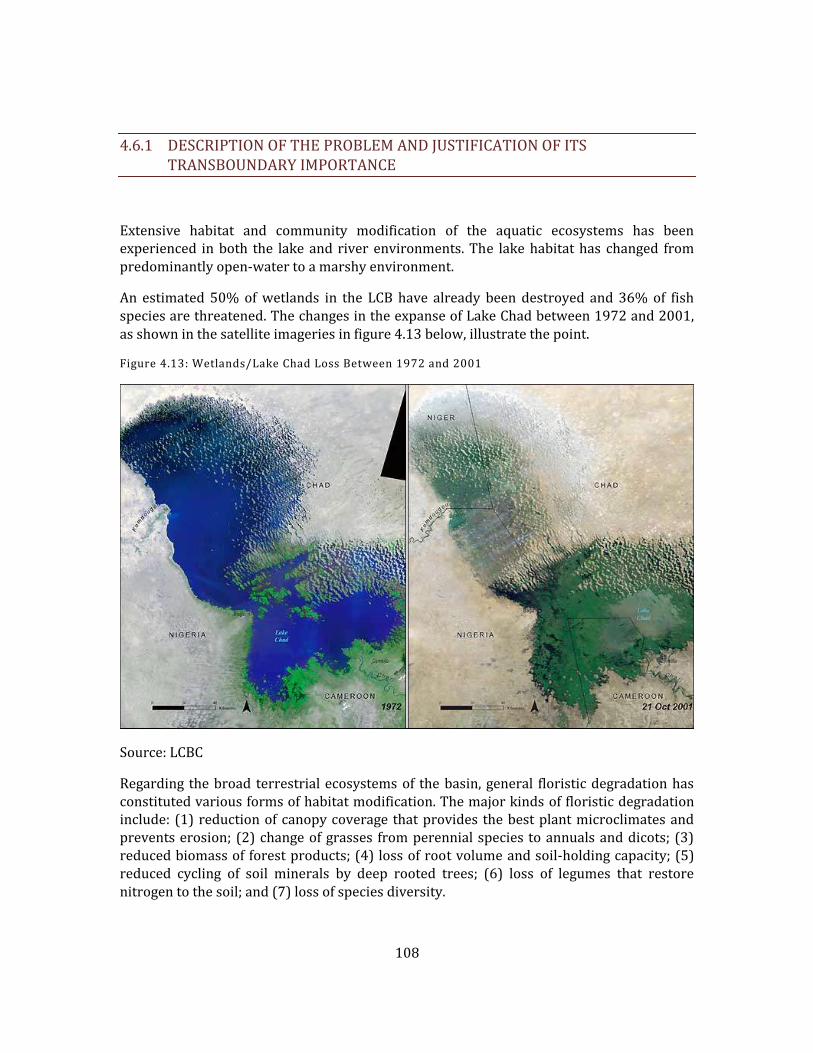
108
4.6.1 DESCRIPTION OF THE PROBLEM AND JUSTIFICATION OF ITS TRANSBOUNDARY IMPORTANCE
Extensive habitat and community modification of the aquatic ecosystems has been experienced in both the lake and river environments. The lake habitat has changed from predominantly open-water to a marshy environment.
An estimated 50% of wetlands in the LCB have already been destroyed and 36% of fish species are threatened. The changes in the expanse of Lake Chad between 1972 and 2001, as shown in the satellite imageries in figure 4.13 below, illustrate the point.
Figure 4.13: Wetlands/Lake Chad Loss Between 1972 and 2001
Source: LCBC
Regarding the broad terrestrial ecosystems of the basin, general floristic degradation has constituted various forms of habitat modification. The major kinds of floristic degradation include: (1) reduction of canopy coverage that provides the best plant microclimates and prevents erosion; (2) change of grasses from perennial species to annuals and dicots; (3) reduced biomass of forest products; (4) loss of root volume and soil-holding capacity; (5) reduced cycling of soil minerals by deep rooted trees; (6) loss of legumes that restore nitrogen to the soil; and (7) loss of species diversity.

109
Upstream dams have altered the flow regime of the lower Yobe and the major inflow to the northern pool of Lake Chad. Although no detailed study has separated the impacts of the drought from those of the dams, it is apparent that the groundwater table has lowered, causing streams, ponds, ox-bows and village wells to have less water for a shorter period during the year. The five to six month flow of the Yobe now lasts three to four months. There are areas that are never flooded even in good rainfall/runoff years. The Maga dam in Cameroon had a similar impact on the Logone, and a worse one on the Yaeres.
4.6.2 MAJOR ENVIRONMENTAL IMPACTS AND SOCIAL-ECONOMIC CONSEQUENCES
The modification of ecosystems has ended the Yobe fishery and much of the recessional rice production. In addition, flood depression fisheries have collapsed. A lot of plant and animal biodiversity have been lost. The resultant or accompanying degradation has translated into the loss of products that support livelihoods, besides the loss of fisheries. A case in point is the loss of a genetically unique rice cultivar in the KYB (refer to Section 4.5.1 for more details). These developments have contributed to the entrenchment of poverty.
4.6.3 LINKAGES WITH OTHER TRANSBOUNDARY PROBLEMS
The loss and modification of ecosystems has been a major cause of biodiversity loss (Section 4. 5), variability of hydrological regimes and fresh water availability (Section 4.2) and decreased viability of biological resources (See section 4.4). It has been facilitated by sedimentation in rivers and water bodies and invasive species.
4.6.4 IMMEDIATE, UNDERLYING AND ROOT CAUSES
The causal chain for loss and modification of ecosystems, shown in Figure 4.14 identifies the immediate, underlying and root causes of this transboundary problem. The text below highlights some key points from this diagram.

110
Fig 4.14: CAUSAL CHAIN ANALYSIS FOR LOSS AND MODIFICATION OF TERRESTRIAL AND AQUATIC ECOSYSTEMS
Root Causes Intermediate/Underlying Causes
Socio economic drivers Resource use
Low standard of living (poverty, unemployment, low incomes).
Reduced rainfalls/Drought (External Driver)
Lack of integration in sectoral development & mangt planning.
Population growth or pressure.
Lack of /mismanagement of public funds for natural resources conservation/management.
Absence of sustainable development/wise use of natural resources on political agenda/political & economic instability.
Lack of resource use planning.
Weak/poor management of protected areas.
Lack of/poor enforcement of environmental protection regulations, guidelines and standards related to resource use.
Low resources users awareness of negative impacts of resources harvesting techniques.
Use of illegal chemicals , nets & poisons.
Lack of effective energy policy.
Absence of regional & country planning.
Lack of envtal policy & regulations related to agric. and settlement activities.
Poor enforcement of environmental protection regulations, guidelines and standards for resources use.
Absence of user charges for water.
Lack of integration in sectoral development & mangt. planning.
Poor enforcement of envital. protection regulations & standards for cpr water use.
Unsustainable harvesting of vegetal resources for fuelwood, fodder & construction materials.
Unsustainable harvesting of fauna (fishing with small mesh sizes, & poison, hunting/poaching for game, etc) that disrupts food chain.
Uncontrolled expansion of farmlands & settlements.
Uncontrolled development of roads
Drainage of wetlands.
Bush burning.
Abstraction and diversion of inflowing water.
Pollution/ contamination of
water bodies.
Control/ disruption of
flooding rhythm.
Over harvesting/ over exploitation of resources.
Landuse conversion/ changes & disturbances.
Freshwater shortages
Immediate Causes
Low standard of envtal. education & awareness.

111
Stream flow modification, resulting mainly from reduced rains and damming, which has forced the lake to contract, has significantly affected the lake environment, by contracting the open water lake into a marshy ecosystem.
Intensive cultivation and large numbers of domestic animals, as well as the over harvesting of vegetal and faunal resources contributed to the degradation of the wetland ecosystems. The primary reason for the reduction in the extent of the wetlands has, however, been attributed to the changes in the seasonal timing and extent of flooding. Consequently, since the 1960s wetland resources in the LCCB have been reduced by almost 50%.
Human influences that have led to terrestrial ecosystem degradation include: (1) over-cutting trees for fuel wood, especially near cites; (2) over-cutting for construction wood, especially borassus and doum palm; (3) over browsing, overgrazing and trampling by livestock; (4) clearing for irrigation agriculture and waterworks; and (5) clearing for human settlements. Their root causes can be traced to population pressure, absence of sustainable development or the wise use of natural resources on the political agenda, low standards of living, low standards of environmental education and awareness, and a lack of integration in sectoral development planning and management, among others.
4.6.5 KNOWLEDGE GAPS
There is no information on the types, locations, extents and functional status of the various ecosystems in the LCB.
4.7 SEDIMENTATION IN RIVERS AND WATER BODIES AS A RESULT OF UPSTREAM LAND DEGRADATION
4.7.1 DESCRIPTION OF THE PROBLEM AND JUSTIFICATION OF ITS TRANSBOUNDARY IMPORTANCE
This pertains to the sedimentation of the rivers that feed the lake, as well as of small lakes and wetlands in the basin. In the KYB’s inland delta in the Hadejia Nguru wetlands this has dried out some channels, as their intakes got filled up by sediments. The Chari Logone system, especially in its upper reaches, also has large sediment deposits in the channel. Figure 4.15, photographs depicting the sediment laden upper reaches of the Chari CAR and sedimentation downstream of the Tiga Dam in Nigeria, illustrates this point.

112
Figure 4.15: Sedimentation Downstream Of Tiga Dam In Nigeria
Figure 4.14: Photograph of Sediment Laden Upper Reaches of the Chari in CAR

113
This problem has led to changes in channel flow patterns as well as a decrease in the inflows into the lake, making it a transboundary issue.
4.7.2 MAJOR ENVIRONMENTAL IMPACTS AND SOCIAL-ECONOMIC CONSEQUENCES
The major impact of sedimentation in channels is the local diversion of flows. In the HNWs this has led to the desiccation of a channel that about 300,000 people have been depending upon for irrigated agriculture, as well as the flooding of communities by the diverted flow, which has caused immense damages to infrastructure, fisheries and farmlands.
Some of the silted lakes and other water bodies became suitable for colonization by invasive species, especially typha that thrives best in fresh shallow water.
The net consequences of channel desiccation and typha invasion has been deepening poverty and increased resource use conflicts.
4.7.3 LINKAGES WITH OTHER TRANSBOUNDARY PROBLEMS
Sedimentation of water bodies is a contributory factor of variability in hydrological regimes and fresh water availability, decreased viability of biological resources, loss of biodiversity, loss and modification of ecosystems, as well as the facilitation of invasive species.
4.7.4 IMMEDIATE, UNDERLYING AND ROOT CAUSES
The causal chain for sedimentation in rivers and water bodies, shown in Figure 4.16 identifies the immediate, underlying and root causes of this transboundary problem. The text below highlights some key points from this diagram.

114
Figure 4.16: Causal Chain Analysis for Sedimentation in Rivers and Water Bodies as a Result of Upstream Land Degradation
Root Causes Intermediate/Underlying Causes
Socio economic drivers Resource use
Low standard of living (poverty, unemployment, low incomes).
Reduced rainfalls/Drought (External Driver).
Lack of integration in sectoral development
planning & mangt.
Population growth/ pressure.
Lack of /mismanagement of public funds for environment protection/improve
ment.
Absence of sustainable development/wise use of natural resources on political agenda
Lack of/poor enforcement of environmental protection regulations, guidelines and standards in farming practices.
Lack of/poor enforcement of environmental protection regulations, guidelines and standards in forest resources harvesting.
Poor capital investment & operational funding for channel maintenance.
Absence of user fees/ free access to cpr water.
Absence of resource use planning.
Weak envtal. policy and regulation related to water abstraction.
Weak/absence of water use and allocation policy.
Low level of farmers awareness of negative impacts of unsustainable agric. practices.
Lack of/poor enforcement of environmental protection regulations, guidelines and standards in farming practices.
Lack of/poor enforcement of environmental protection regulations, guidelines and standards in laterite mining & sand collection.
Poor capital investment & operational funding for channel maintenance.
Unsustainable farming practices that mobilize alluvium/cause erosion (e.g. clear felling, ploughing along slopes, farming on marginal lands or river banks & overgrazing).
Uncontrolled devegetation of rangeland from fuelwood construction materials and fodder harvesting, lead to erosion
Low awareness of farmers on sound land management or soil conservation practices.
Disruption of channel flushing by first rains/storms due to waste water abstraction (irrigation, water supply) that introduce dry season flows and reduce flows.
Unsustainable agric. practices that cause banks to collapse, e.g. cultivation on the banks.
Disturbance of river banks through excavation for laterite/mining and crushing by trucks that mine/collect sand, grazing and watering animals and other traffic.
Silt alluvium deposition.
Collapse of banks
Immediate Causes
Low standard of envtal. education & awareness.

115
In theory, human impacts on stream, river and ouadi channel changes can be traced to urbanization, roads, upstream dams and/or diversions and increased runoff and sheet wash from damaged hill slopes, especially as a result of uncontrolled farming and devegetation. The landscape changes interlace with natural causes such as tectonic events, long-term meteorological drought, and extreme runoff and channel flow events. The human impacts are themselves driven by poor enforcement of environmental protection regulations, low standard of environmental education and awareness, population pressure, and lack on integration in sectoral development planning and management, among others.
4.7.5 KNOWLEDGE GAPS
In the Lake Chad basin, human-influenced geomorphological concerns have been poorly documented. There is little information concerning channel form changes; sediment load; aggraded streambeds burying surface flow; dune reactivation and dune formation (WW). There is no mapping of down cutting or gullying on valley slopes. There is also no information on the locations, extents and impacts of sedimentation.
4.8 INVASIVE SPECIES
4.8.1 DESCRIPTION OF THE PROBLEM AND JUSTIFICATION OF ITS TRANSBOUNDARY IMPORTANCE
This pertains to the domination of a habitat by a single plant or animal specie to the exclusion of other species that ordinarily thrive in the same habitat. In the KYB there are two prominent invasives, typha grass and quelea birds. In the Chari-Logone system it is water Hyacinth while the lake itself has been invaded by Typha and water Hyacinth.
The typha and other invasive weeds issue, although prevalent at specific locations, is transboundary in nature because it impacts on shared river systems. In the Komadugu Yobe river system in Nigeria, for example, it has colonized over 1000 Km2 of fadama land in the HNWs, and has contributed immensely to the diversion of flows away from Lake Chad. Figure 4.17 depicts a typha bed in the Hadejia Nguru Wetlands in Nigeria.
The Red billed quelea bird (Quelea quelea lathamii) has a grazing range of up to 500 km, which more than often crosses borders, and thus can not be controlled without international cooperation. It is a small seed–eating bird which is a serious pest of sorghum
Political and economic instability.

116
and millet in much of central and West Africa. The two cereals form part of the staple diet for the human population and due to their drought tolerance’ can be grown throughout the region. The birds occur in colonies of up to millions of birds. Normally the birds feed on grass seeds but in the absence of these they attack the crops mainly at dough stage, sucking out the soft grain. Damage caused in individual field can be as high as 100 percent if no control measures are undertaken.
4.8.2 MAJOR ENVIRONMENTAL IMPACTS AND SOCIAL-ECONOMIC CONSEQUENCES
The major environmental impact of weed infestation is the blockage, and in some instances even diversion of channels. This has led to parallel incidences of channel desiccation and inundation in the HNWs, the net consequences of which have been loss of livelihoods, poverty and resources use conflicts.
Figure 4.17: Photograph of Typha Bed in the Hadejia Nguru Wetlands in Nigeria

117
Quelea birds destroy crops and thus resulting in losses in incomes and food stuff. Furthermore, Spraying with the organophosphates has been the predominant means to control it for more than forty years. Birds of prey, owls and passerines have been commonly reported casualties of spraying over land. Moreover, organophosphates are known to have negative effects on aquatic invertebrates, in particular on populations of crustacea, which predicates against its use near water bodies. Non-target species may be affected directly by spraying, but predatory birds, scavenging birds and even mammals can be contaminated by secondary poisoning when they eat Quelea carcasses found up to 20 km or more from the primary control site.
4.8.3 LINKAGES WITH OTHER TRANSBOUNDARY PROBLEMS
Invasive species are facilitated by variability of hydrological regimes and fresh water availability, water pollution, loss and modification of ecosystems, as well as sedimentation in rivers and other water bodies. It leads to the decreased viability of biological resources.
4.8.4 IMMEDIATE, UNDERLYING AND ROOT CAUSES
The causal chain for invasive species, shown in Figure 4.18 identifies the immediate, underlying and root causes of this transboundary problem. The text below highlights some key points from this diagram.

118
Fig 4.18: CAUSAL CHAIN ANALYSIS FOR INVASIVE SPECIES.
Root Causes Intermediate/Underlying Causes
Socio economic drivers Resource use
Low standard of living (poverty, unemployment, low incomes).
Lack of integration in sectoral development planning & mangt.
Population growth/ pressure.
Lack of /mismanagement of public funds for environment protection/improvement.
Absence of sustainable development/wise use of natural resources on political agenda.
Lack of/poor enforcement of environmental protection regulations, guidelines and procedures for water abstraction.
Absence of user fees for cpr water.
Lack of/poor enforcement of environmental protection regulations, guidelines and procedures in farming.
Lack of/poor enforcement of environmental protection regulations, guidelines and procedures for dam operations. Lack of/poor enforcement of environmental protection, guidelines, procedures and standards in agric. fertilizer & pesticide application.
Low level of farmers awareness of negative impacts of fertilizer, herbicides & pesticides application.
Lack of administrative framework for managing & evaluating difuse sources of pollution from agriculture.
Inefficient raw water intake structures that provide dry season flows.
Inefficient irrigation practices that provide dry season flows.
Unsustainable farming practices that lead to channel blockage and formation of shallow pond and lakes.
Poor dam operation procedure.
Low awareness of farmers on sound land management practices in farming practices.
Lack of best management practices in agric./ inappropriate application of fertilizers & herbicides.
Perennial water availability instead of seasonal.
Eutrophication of water bodies.
Immediate Causes
Low standard of envtal. education.

119
The major cause of typha invasion in the KYB is a change in the hydrological regime, which turned a seasonal river into a perennial river. This in turn is the result of poor dam operation procedures and inefficient raw water intake structures, which put a lot of water in the river system during the dry season. The Kano City raw water intake structure on the KYB, for example, takes maximally only 5% of dam releases in the dry season effected on its account. The remaining 95% of the releases, at a maximum of 25 million cubic meters per second, and a minimum of 10 million cubic meters per second, provides unwanted dry season flows downstream. This is happening due to the absence of an integrated system of water resources management in the basin, which is illustrated by a poor enforcement of environmental protection regulations and the absence of sustainable development/wise use of natural resources on the political agenda. There is in addition the issue of eutrophication as another immediate cause, which is driven by the lack of best practices in the use of agricultural chemicals, which itself is the result of the absence of an administrative framework for managing diffuse sources of pollution in agriculture. Quelea birds, on the other hand, have become more prevalent as crop pests due to the degradation and destruction of their grazing sites through uncontrolled expansion of farmlands and settlements, which are in turn the products of population pressure and low standards of environmental education and awareness.
4.8.5 KNOWLEDGE GAPS
There is a paucity of knowledge regarding available viable strategies for controlling the invasive species. Also very little is known of their locations, magnitudes and impacts.
4.9 OVER-ARCHING ROOT CAUSES
Three of the root causes of the degradation trends require special attention, as they appear to be over-arching. They are briefly discussed in a descending order in terms of their perceptible regional coverage and magnitude as driving forces behind the degradation trends.
4.9.1 ABSENCE OF SUSTAINABLE DEVELOPMENT/WISE USE OF NATURAL RESOURCES ON POLITICAL AGENDA.
In all the member countries there is clear evidence that the governments of the day make very minimal investments in the biological resources management and environmental protection sector. In Nigeria, for example, the budgetary outlay for the Federal Ministry of Environment, which is eloquently charged with the responsibility for protecting the environment and promoting sustainable development, has since its creation in 1999 never

120
reached 10% of what is allocated for the army. This is hard to explain, as the regions economy is dependant on the exploitation of natural resources, whether through agricultural production or direct harvesting of resources. The most probable reason is the preoccupation of the governments with short term concerns, which is driven mainly by a low level of environmental awareness and education, as well as survival instincts in an unstable economy and political setting. There is no pressure on the governments of the day for investments and services that can underpin sustainable development.
4.9.2 LOW STANDARD OF ENVIRONMENTAL EDUCATION AND AWARENESS
The leadership and populace in the region have minimal appreciation of the linkages between environmental stability and economic well being. The evidence for this is the disposition of each member country to provide more budgetary outlay for tackling the impacts of environmental disasters than they provide for pro-actively checking environmental degradation. In Nigeria, for example, the Ecological Funds Office, whose main function is to fund investments for addressing manifested ecological problems, enjoys an annual budgetary support that is more than ten times of what is provided for the Ministry of Environment that is charged with the responsibility of ensuring that the ecological problems do not manifest. On the part of the populace, especially as articulated through their elected representatives, no one is seeking for a more responsive arrangement by governments. At the level of individual resources users, there is characteristically very reckless exploitation of natural resources.
4.9.3 POPULATION PRESSURE
This phenomenon would not have been a serious problem on its own. But given the low levels of technical know how for sustainable natural resources exploitation that characterizes the region, coupled with the pressures of short term survival concerns (low standards of living), as well as the laizes faire attitudes of governments towards natural resources exploitation, there is a correlation between growing populations and more reckless natural resources exploitation.

121
5 STAKEHOLDER ANALYSIS
5.1 INTRODUCTION
Stakeholders, in this instance, are any party that is involved in or are affected by an environmental problem or its solution. These range from the governments of the member countries, their regulatory agencies, development agencies, communities, businesses, individual or grouped resources users, and CSOs. In order for the SAP that will sprout from this TDA to be an effective tool for addressing the transboundary issues, the process of developing and implementing it will have to based on a shared vision between stakeholders.
Since there is such a wide range of stakeholders that the LCBC will need to partner with, it needs to be recognized upfront that the stakeholders will vary in their supportiveness as well as influence (powerfulness) in relation to any proposed intervention. The ultimate aim of working on them would thus be to deploy various influencing strategies that will augment their supportiveness and ‘powerfulness’, where such a need is identified.
This section presents approaches for identifying stakeholders, their supportiveness and their ‘powerfulness’, which have been applied in Nigeria and can be applied as LCBC progresses with the development and implementation of the SAP.
5.2 DEVELOPMENT OF STAKEHOLDER MATRIX
This is best achieved through a brainstorming exercise with a broad, well informed and pre-committed set of stakeholders who will:
Identify all the stakeholders that are relevant for the proposed intervention
Plot each of them onto a matrix that shows supportiveness on the y axis, and ‘powerfulness’ on the x axis.
Below, as an indicative example, is a list of the stakeholders identified in the Nigerian section of the LCB for the proposed program of reversing land and water resources degradation trends. They have been categorized into primary (directly impacted), secondary (intermediaries) and key (take the determining decisions) stakeholders.
5.2.1 PRIMARY STAKEHOLDERS

122
1. Upland rain-fed crop farmers
2. Irrigation farmers
3. Fishermen
4. Nomadic pastoralists
5. Settled and Semi-settled pastoralist
6. NTFPS collectors
7. Water vendors
8. Produce dealers and middlemen
5.2.2 SECONDARY STAKEHOLDER
9. KYB Foundation (Trust Fund)
10. LCBC & LCBC-GEF program
11. DFID-JWL Project
12. FMWR-IUCN-KYB Project
13. Donors (DFID, EU, CIDA, JICA, etc)
14. Development Agencies (World Bank, IFAD, etc)
15. Mass media & Praise singers/Artisits
16. Service providers (transporters, police, etc)
17. CBOs & NGOs
18. Banks
5.2.3 KEY STAKEHOLDERS
19. National Assemblies/Legislators
20. State Assemblies/Legislators

123
21. Federal Ministry of Water Resources
22. Federal Ministry of Environment
23. Federal Ministry of Agriculture
24. National Emergency Management Agency
25. State Environmental Protection Agencies
26. Governments of the riparian states
27. Chad Basin National Park
28. River Basin Development Authorities
29. States Ministries of Water Resources & of Agriculture
30. Local Government Councils within the Basin
31. Traditional Rulers & Religious leaders
Figure 5.1 below is the indicative matrix from Nigeria showing supportiveness and ‘powerfulness’ of each stakeholder.

124
State Min. of Water Resources & of
Agriculture
Less Powerful More Powerful
op
po
sed
-
Les
s S
up
po
rtiv
e -
n
eutr
al
mo
der
atel
y -
M
ore
Su
pp
ort
ive
-
fully
LCBC & LCBC-GEF program
KYB Foundation (Trust Fund)
FMWR-IUCN-KYB Project
Governments of riparian states
Development agencies
(World Bank, IFAD etc
Donors (DFID, EU, CIDA, JICA
etc
Water vendors
Settled & Semi-settled
pastoralists
Irrigation farmers
Upland rain-fed crops farmers
Normadic pastoralists
Fishermen
Local Government
Councils within the
Basin
DFID-JWL Project
Produce dealers & middlemen
Federal Min. of environment
Chad Basin
National Parks
Banks
Mass media & Praise
singers/Artists
National Assemblies/Legislators members
federal min of water res.
River Basin Development
Authorities
National Emergency Management Agency
NTFP collectors
Service providers (transporters,
Police, etc
CBOs & NGOs
Federal Min. of Agriculture
State Assemblies/Legi
slators
Traditional Rulers & Religious leaders
Figure 5.1: An Indicative Stakeholder Matrix for the Nigeria Sector

125
5.3 DEVELOPMENT OF ENGAGEMENT STRATEGIES
5.3.1 POWERFUL BUT LESS SUPPORTIVE STAKEHOLDERS:
These are those in the bottom right portion of the matrix. Mainly high level decision makers who have nothing to directly loose, and can explain their inaction. They need to be engaged so that they can become more supportive. Failing to carry them along is a major risk. They can be influenced through embarking on activities that can make them more accountable than they presently are, such as generating demand from the grass roots for service from them as well as accountability. The grass roots at present tend towards apathy.
5.3.2 SUPPORTIVE BUT LESS POWERFUL STAKEHOLDERS:
These are those in the top left part of the matrix. They are predominantly the target beneficiaries of the intervention. But they lack voice, and are generally apathetic. They need to be empowered to serve themselves and demand for services that are due to them from service providers. This can be through awareness raising, mobilisation, formation of networks and coalitions, etc.
5.3.3 POWERFUL AND SUPPORTIVE:
These are those in the top right section of the matrix. Engagement with them should be about retaining their confidence and support. This is where the project managers should aspire to shift stakeholders to as projects progress.

126
6 GOVERNANCE ANALYSES
6.1 INTRODUCTION
Governance issues (political, legal, policy and institutional) and in particular, utilization of IWRM instruments in the Basin raises special concerns, because it is at the heart of the objective of LCBC-GEF Project. All stakeholders agree that addressing governance issues would be critically important in addressing many other priority issues affecting the land and water degradation trends in the basin.
Although most of the member countries have been individually adjusting their various institutional, legal and policy frameworks for water governance to improve on performance, significant deficiencies that stand in the way of promoting IWRM in the basin persist.
The setting for managing water resources in the LCBC member countries is as varied as the individual member countries vary among themselves. Each country is characterized by a multiplicity of line agencies with overlapping, and in some cases even conflicting, responsibilities. All the member countries also have in place national policies and laws that are meant for or have bearing on the management of land and water resources, but with little on no bearing to integrated land and water resources management at the level of the LCB.
6.2 POLITICS, POLICIES/STRATEGIES
The member countries operate under different political and administrative settings, with large foot prints of their two differing former colonial masters that encourage them to look inwardly. Of the five member nations, Nigeria inherited a British system of public service, while the rest operate under a French bureaucratic tradition. The difference in the political structures and regulatory frameworks hamper the capability and readiness of the member states to confront the larger issues of dysfunctional multinational agencies charged with the management of water resources. The set up also often works against multi-jurisdictional coordination and management of transboundary waters. The resultant poor coordination has hindered joint monitoring, besides rendering them incapable of arbitrating among competing uses and demands. Political conflicts and wars in Chad further compound the situation, as the affected country can not have the luxury of putting the LCBC issue on its agenda.
At the level of the individual member countries, there are no comprehensive national water policies in the forms of strategies, functional national water master plans, systems for inter sectoral coordination, tariff setting and conflict resolution. They all have water policies that target providing the public with full access to water for sanitation, agriculture, industries, etc, but they have no realistic matching mechanisms (e.g. means of funding) to actualize the

127
policy thrusts. It is of interest to note that in all the member countries water is treated as a free commodity, i.e. it has no economic value. This has placed avoidable additional constraints on water resources management.
A most noteworthy point is the history of general policy inconsistency in the region. Most of the individual national policies in the 1960s in the region promoted exports at the expense of production for domestic demand, leading to dependence on subsidies and state marketing systems, which proved to be financially unsustainable. Structural adjustment in the 1980s and 1990s exposed producers to weak and variable prices and increasing input costs. Incentives for investment in sustainable natural resource management were not prioritized. Recently more attention has been paid to restoring agriculture to a central place in macro-economic policy. Some government programs had an impact on natural resource management, but others led, instead, to increased degradation, for example, through installing hydro-agricultural infrastructures without co-ordination, destroying wetlands and engaging in inappropriate mechanization on fragile soils. This situation resulted in part from an absence of functioning sub-regional strategies for the allocation and development of land.
Weak co-ordination and implementation of regional strategies, and harmonization of national policies, is illustrated by the facts that there is no concerted strategy for allocating land or for establishing hydro-agricultural schemes and structures.
There are no functional catchment management plans. There is no express mechanism for promoting a system of integrated water resources management. Furthermore, national sectoral policies that impinge on land and water resources management are seldom coordinated or streamlined. For example, in Nigeria the National Policy on Agriculture promotes less dependence on rain fed farming through the promotion of dam construction and large scale irrigation schemes, without due recourse to the process of EIA. This generated increased demand for water at the expense of environmental sustainability.
6.3 LEGAL AND INSTITUTIONAL ASSESSMENT
At the regional level, the signing of the Lake Chad Basin Commission (LCBC) Convention, as far back as 1964, was a clear sign of the riparian countries’ willingness to address issues related to the sustainable management of the lake and its catchment area. But this agreement, like several other international agreements signed by the member countries, has not been backed by the relevant national legislations that can make their implementation effective. Once a government makes the formal commitment to become a signatory of a convention, it assumes the obligation to enforce the measures required by the convention. In most cases this implies the enactment of national laws, creation of standards or institutional reorganization to enforce the provisions of the convention. None of the requirements have been met in any of the member countries. Indeed most of the member countries are in default of paying their agreed dues for running the LCBC. The LCBC as a regional institution, in view of the political history in the region that emphasizes national differences, and the accompanying failure of the member countries to provide the

128
framework needed for the convention to work, is consequently not in the position to put in place a system of integrated water resources management in the basin. The institution lacks the necessary funds for routine technical activities such as hydrological, livestock and resources monitoring. The staffing of the organization is inexplicably top heavy. It has no legal mandate to enforce standards, neither can it sanction offenders.
In the individual member countries regulations are very complicated and haphazardly enforced, with confusion among different administrative or line agencies. In Nigeria, for example, there are three laws that are central to water resources management (River Basin Decree of 1987, EIA Decree of 1992, and Water Resources Decree 101 of 1993), but they all lack provisions for promoting or enforcing integrated water resources management. There is thus no shortage of sectoral laws related to water resources management in each country. The main problem is that they are not harmonized, while some are outdated, and they need to be streamlined with the regional perspectives.
There is a multiplicity of agencies at all tiers of government pursuing different uncoordinated water agenda. For example, in Nigeria there are two river basins development authorities managing one catchment in the LCB, each also with conflicting responsibilities for regulating the use of water as well as its development. The boundaries of their operational areas are also based on political divides instead of natural divides, making monitoring and maintenance of river systems difficult. The RBDAs are also grossly under funded and can not deliver on their responsibilities of managing the river systems.
6.4 TRANSBOUNDARY AND INTERNATIONAL COOPERATION
There is a lot of evidence that the LCBC member countries value transboundary and international cooperation. This is evidenced by their willingness to establish the LCBC as a platform for the joint promotion of the sustainable exploitation of the water resources of the lake. Individually the member countries have also acceded to international agreements and conventions that pertain to joint international action for addressing resources use issues. Table 6.1 below lists the conventions acceded to by each country.
Table 6.1: Conventions Acceded To by the LCBC Member Countries
Convention CAR Chad Cameroon Niger Nigeria
Convention on Biodiversity * * * *
Convention on Climate Change * * * *
Convention on Desertification * * * * *

129
Convention CAR Chad Cameroon Niger Nigeria
Convention on Wetlands (RAMSAR) * * * *
Convention on Trade in Endangered Species
(CITES)
* * *
Convention on Migratory Species * *
Convention on Protection of the Ozone layer * * *
Convention on Persistent Organic Pollutants * *
There is unfortunately a very unsatisfactory general level of commitment to the letters of the conventions. A good illustration is the continued failure of the LCBC member countries to pay their annual dues, with the possible exception of Nigeria that recently even made available $ 5 million for the feasibility study of the proposed inter basin water transfer project. The same lip service is being paid to the convention on biodiversity, on climate change, and on desertification control in terms developing and funding the execution of the policies for implementing them.

130
7 CONCLUSION AND RECOMMENDATIONS
The seven priority transboundary problems identified and analyzed by stakeholders for the LCB are, to a large extent, the products of unsustainable resources use practices that are rooted in three overarching root causes, namely: the absence of sustainable development on the political agenda of the riparian countries, low standard of environmental education and awareness (including especially at the level of decision makers), and population pressure. Any attempt at reversing the degradation trends in the land and water resources of the basin will need to address these issues before it can work.
The LCBC, as presently constituted, is not in a position to tackle the problems: It lacks the power to arbitrate water conflicts in the basin; it can not sanction member countries; it has no mechanism for fostering basin level integrated water resources management by way of getting the line agencies of the member countries to harmonise their water resources development programs.
The national legal and institutional settings in the member countries as they stand today are not suited for promoting integrated water resources management in the individual member countries, talk less of promoting it in the LCB.
A recommended starting point for addressing the situation is the reconstitution of the LCBC, so that it can be more powerful, better funded to perform its mandates, and to take on more responsibilities and programs.

131
REFERENCES
Alkali, A.G. (1995): River-aquifer interaction in the middle Yobe River Basin, NE Nigeria. A Ph.D. thesis, Silsoe College, Cranfield University, UK.
Coe, M.T. and Foley, J.A. (2001). Human and natural impacts on the water resources of the Lake Chad basin. Journal of Geophysical Research, 106:3349-3356.
ESRI (1996). Environmental Systems Research Institute, Inc. and DATA.
ArcAtlas: Our Earth.
Government of Niger (2002). Full Poverty Reduction Strategy. Retrieved July 2003 from: http://poverty.worldbank.org/files/9355_NigerPRSP.pdf
IMF International Monetary Fund (2003). Chad: Poverty Reduction
Strategy Paper. IMF Country Report No. 03/209.
Hassan, M., R.C. Carter and K.R. Rushton (2004). Development of conceptual groundwater model of river-aquifer interaction using limited data in a semi-arid zone: a case study of Yobe River Basin, North-East Nigeria. Zuma Journal of Pure and Applied Sciences 6(1), p. 184-187.
Hodge, S (2006) LCBC Institutional Assessment Report.
Impact Assessment Inc (2006) Environmental and Social Risk Assessment in the Lake Chad Basin. A report submitted to LCBC.
IPCC (2001). Climate Change 2001: Impacts, Adaptation and Vulnerability - Contribution of Working Group II to the Third Assessment Report of the IPCC. Chapter 10.2.6.3. Climatic Factors in Desertification.
Available at: http://www.grida.no/climate/ipcc_tar/wg2/403.htm
IUCN-ROCA (2007) Management Plan of the Lake Chad
Kindler, Janusz and others (1990). The Lake Chad Conventional Basin: A Diagnostic Study of Environmental Degradation. Tucson: Office of Arid Lands Studies, University of Arizona, November 1989.
LCBC Lake Chad Basin Commission (2000). The Lake Chad Basin Vision for 2025. Second World Water Forum.
LCBC Lake Chad Basin Commission (2002). Integrated Environmental Assessment and Social Assessment (EA/SA). Of the GEF Project entitled ‘Reversal of Land and Water Degradation Trends in the Lake Chad Basin. E563. Vol.3. Retrieved July 2003 from: http://wwwwds.worldbank.org/servlet/WDSContentServer/WDSP/IB/2002/04/19/000094946_02040604050966/Rendered/PDF/multi0page.pdf

132
Le Barbé, L. and Lebel, T. (1997). Rainfall Climatology of the HAPEX-Sahel
Nami, B. (2002). Environmental Degradation of the Lake Chad Basin: Implications for Food Security.
Narayan, D. and Petesch, P. (2002). Voices of the Poor: From Many Lands. New York, N.Y: Published for the World Bank, Oxford University Press. Chapter 4: Nigeria - Illbeing and Insecurity.
Neiland, A.E. and Verinumbe, I. (1990). Fisheries Development and Resource-usage Conflict: A Case Study of Deforestation Associated with the Lake Chad Fishery in Nigeria. Paper provided by Centre for the Economics and Management of Aquatic Resources. Retrieved from: http://www.pbs.port.ac.uk/econ/index.html
Neiland, A. and Béné, C. (eds) (2003). Sustainable Development of African Continental Fisheries: A Regional Study of Policy Options and Policy Formation Mechanisms for the Lake Chad Basin.
University of Portsmouth and European Commission, EU-INCO Project. Final Report.
Odigie, D.I. and O.L. Anyaeche (1991): The estimation of the direct recharge to the upper zone aquifer of the Lake Chad Basin In: Gadzama N.M., F.A. Adeniji, W.S. Richards and G.G.R. Thambyahpillay “Arid Zone Hydrology and Water Resources”, University of Maiduguri Press, 1991.
Okali D and Bdliya H (1997) Biodiversity of the Hadejia Nguru Wetlands. Report of a Survey for IUCN.
Olivry, J.C., Chouret, G., Vuillaume, G., Lemoalle, J. and Bricquet, J.P. (1996). Hydrologie du Lac Tchad, ORSTOM, Monographies Hydrologiques, 12:266. Paris, France.
ORNL (2003). Landscan 2002. Oak Ridge National Laboratory. Retrieved Nov. 2003, from http://www.ornl.gov/gist
Otite, O. (1990). Ethnic Pluralism and Ethnicity in Nigeria. Shaneson, Ibadan.
Oyebande L (1997) Integrated management of the Lake Chad Basin in Nigeria. Preparatory Assistance Report, UNDP/GEF
Sir M. MacDonald & Partners, 1973: Investigation and feasibility study of an irrigation project south of Lake Chad, Nigeria Annex: I: Soil survey and land classification, Vol. 2. Profile descriptions and laboratory analysis.
Ramsar (2003). A Directory of Wetlands of International Importance, 7th edition. Retrieved Sept. 2003 from: http://www.wetlands.org/RDB/africa/AFRICA_map.html
Sarch M.T. (2001). Fishing and farming at Lake Chad: Institutions for access to natural resources. Journal of Environmental management 62:185-199.

133
UNEP United Nations Environment Programme (1999). Singh A., Dieye A., Finco M., Chenoweth M.S., Fosnight E.A. and Allotey A. Early Warning of Selected Emerging Environmental Issues in Africa: Change and Correlation from a Geographic Perspective.
United Nations Environment Programme. Challenges to International Water: Regional Assessments in a Global Perspective. Nairobi: UNEP, 2006.
Woodhouse, Philip, Henry Bernstein, David Hulme, and others. African Enclosures? The Social Dnamics of Wetlands in Drylands. Trenton, New Jersey: Africa World Press, 2001.
World Bank (2002a). GEF Reversal of Land and Water Degradation Trends in the Lake Chad Basin Ecosystem: Project Brief.
World Bank (2002b). World Development Indicators. Development Data group.
World Gazetter (2003). Retrieved by GIWA in July 2003 from: http://www.worldgazetteer. com/c/c_cm.htm