transatlantic secondary contact in atlantic salmon, …351) bradbury... · received 27 march 2015;...
TRANSCRIPT

Transatlantic secondary contact in Atlantic Salmon,comparing microsatellites, a single nucleotidepolymorphism array and restriction-site associated DNAsequencing for the resolution of complex spatialstructure
IAN R. BRADBURY,* LORRAINE C. HAMILTON,† BRIAN DEMPSON,* MARTHA J. ROBERTSON,*
VINCENT BOURRET,‡ § LOUIS BERNATCHEZ§ 1 and ERIC VERSPOOR¶ 1
*Science Branch, Department of Fisheries and Oceans Canada, 80 East White Hills Road, St. John’s, Newfoundland, Canada
A1C 5X1, †Aquatic Biotechnology Laboratory, Bedford Institute of Oceanography, Dartmouth, Halifax, Nova Scotia, Canada
B2Y 4A2, ‡D�epartement de Biologie, Institut de Biologie Int�egrative et des Syst�emes (IBIS), Universit�e Laval, 1030 avenue de la
M�edecine, Qu�ebec, Qu�ebec, Canada G1V 0A6, §Direction de la faune aquatique, Minist�ere du D�eveloppement durable, de
l’Environnement, de la Faune et des Parcs, Qu�ebec, Qu�ebec, Canada G1S 4X4, ¶Rivers and Lochs Institute, Inverness College
University of the Highlands and Islands, Inverness IV2 5NA, UK
Abstract
Identification of discrete and unique assemblages of individuals or populations is
central to the management of exploited species. Advances in population genomics pro-
vide new opportunities for re-evaluating existing conservation units but comparisons
among approaches remain rare. We compare the utility of RAD-seq, a single nucleotide
polymorphism (SNP) array and a microsatellite panel to resolve spatial structuring
under a scenario of possible trans-Atlantic secondary contact in a threatened Atlantic
Salmon, Salmo salar, population in southern Newfoundland. Bayesian clustering
indentified two large groups subdividing the existing conservation unit and multivari-
ate analyses indicated significant similarity in spatial structuring among the three data
sets. mtDNA alleles diagnostic for European ancestry displayed increased frequency in
southeastern Newfoundland and were correlated with spatial structure in all marker
types. Evidence consistent with introgression among these two groups was present in
both SNP data sets but not the microsatellite data. Asymmetry in the degree of intro-
gression was also apparent in SNP data sets with evidence of gene flow towards the
east or European type. This work highlights the utility of RAD-seq based approaches
for the resolution of complex spatial patterns, resolves a region of trans-Atlantic sec-
ondary contact in Atlantic Salmon in Newfoundland and demonstrates the utility of
multiple marker comparisons in identifying dynamics of introgression.
Keywords: Atlantic Salmon, RAD-seq, secondary contact
Received 27 March 2015; revision received 18 September 2015; accepted 21 September 2015
Introduction
The identification of discrete and unique assemblages of
individuals or populations is central to the conservation
and management of exploited species (Moritz 1994;
Waples 1995; de Guia & Saitoh 2007; Schindler et al.
2010). Advances in population genomics (e.g. Baird
et al. 2008; Davey & Blaxter 2010; Etter et al. 2011; Peter-
son et al. 2012) have recently revolutionized this task
allowing increased numbers of loci to be surveyed, and
both neutral and putatively adaptive genetic variation
to be considered in defining management units (e.g.
Correspondence: Ian R. Bradbury, Fax: (709) 772-4188;
E-mail: [email protected] contributed equally order alphabetical.
© 2015 John Wiley & Sons Ltd
Molecular Ecology (2015) 24, 5130–5144 doi: 10.1111/mec.13395
Lamichhaney et al. 2012; Bradbury et al. 2013; Hohen-
lohe et al. 2013; Moore et al. 2014; Candy et al. 2015).
Despite the obvious potential, rapidly increasing
options for population genomic study in nonmodel
organisms (e.g. Gonen et al. 2014; Houston et al. 2014;
Benestan et al. 2015) contrast a lack of comparative
studies (although for microsatellite—SNP comparisons
see: Hohenlohe et al. 2013; Larson et al. 2014; Moore
et al. 2014; Candy et al. 2015). Ultimately, these compar-
ative examinations employing multiple approaches are
needed to both explore limitations and biases and to
evaluate the application of these technologies to ques-
tions of wildlife conservation and management, particu-
larly under complex demographic scenarios.
Atlantic Salmon (Salmon salar) is a species of signifi-
cant social, ecological and economic importance
throughout the North Atlantic, characterized by large-
scale ocean migrations (Reddin 1988; Thorstad et al.
2010; Reddin et al. 2012) and fine-scale homing beha-
viour (Stabell 1984; Keefer & Caudill 2014). Atlantic
Salmon has been the subject of extensive population
genetic (e.g. Dionne et al. 2009; Ozerov et al. 2012; Brad-
bury et al. 2014) and increasingly population genomic
studies (e.g. Bourret et al. 2013b; Moore et al. 2014).
Populations are commonly structured at various spatial
scales, ranging from across the North Atlantic (McCon-
nell et al. 1995; King et al. 2001; Bourret et al. 2013b), to
among river systems (Castric & Bernatchez 2004; Ver-
spoor 2005; Palstra et al. 2007; Moore et al. 2014), and
even among tributaries of larger rivers (e.g. Primmer
et al. 2006; Dionne et al. 2009).
Discerning the ultimate scale of neutral and adaptive
population structuring in Atlantic Salmon is focal to the
conservation of endangered populations and the identi-
fication of evolutionarily significant units (i.e. Designat-
able Units, COSEWIC 2008). At present, these
conservation units are likely coarse and poorly resolved
in Canadian waters (COSEWIC 2011) and this is of
immediate concern as many regions are experiencing
record lows and continued declines in abundance (ICES
2015). In the southern Newfoundland population, which
is located along the southern coast of the island, contin-
ued declines over several decades led to a ‘threatened’
status in 2011. Management and conservation of the
region is complicated by significant fine-scale differenti-
ation and a surprising lack of genetic isolation by geo-
graphic distance (Palstra et al. 2007; Bradbury et al.
2014) suggesting significant heterogeneity and that fur-
ther subdivision of this conservation unit may be war-
ranted (COSEWIC 2011). However, a clear rationale for
subdivision, including data on neutral and possibly
adaptive variation, has remained elusive.
Here, we evaluate and compare the ability of RAD-
seq, a single nucleotide polymorphism (SNP) array and
a microsatellite panel to resolve spatial structuring and
management units under a complex scenario of post-
glacial recolonization and possible trans-Atlantic sec-
ondary contact in Atlantic Salmon along Newfound-
land’s south coast (<500 km). Specifically, the objectives
are (i) to delineate population structure in southern
Newfoundland using genetic and genomic approaches
to provide guidance to management and conservation
of Atlantic Salmon; (ii) to compare genetic and genomic
approaches to inform future applications; and (iii)
finally to explore the potential influence of trans-At-
lantic secondary contact on contemporary spatial struc-
ture in the region. We build directly on previous
studies documenting the presence of both complex spa-
tial structuring (e.g. Palstra et al. 2007; Bradbury et al.
2014) and of European alleles (e.g. King et al. 2007) in
salmon populations found in Newfoundland. This work
highlights the utility of RAD-seq based approaches for
the resolution of complex spatial patterns, explores a
region of trans-Atlantic secondary contact in Atlantic
Salmon in Newfoundland and demonstrates the utility
of multiple marker comparisons in identifying dynam-
ics of introgression.
Materials and methods
Sampling
River stocks utilized here represent a subset of rivers
described elsewhere (see Bradbury et al. 2014) with
additional ones. Tissue samples were collected in
coastal rivers or tributaries (Fig. 1, Table 1) generally
<5 m in width and 2 m depth. Tissue samples were
obtained from parr of various age groups (0–3 years
old) captured by electro-fishing during the period of
July to September 2008–2010 and generally at two loca-
tions per river. For each salmon, fin clips were stored in
95% ethanol. The total number of river stocks analysed
varied by approach and ranged from 31 for the
microsatellite analysis, 17 for RAD-seq analysis, to 10
for SNP array (See Fig. 1 and Table 1 for locations for
each analysis).
Microsatellite genotyping
The total number of individuals sampled and geno-
typed for the 15 microsatellite loci was 2439 with an
average of 78.7 individuals per population (Table 1).
Microsatellite polymorphisms were quantified at 15 loci
as follows: Ssa85, Ssa202, Ssa197 (O’Reilly et al. 2000),
SSOSL417 (Slettan et al. 1995), SsaD85 (T. King, unpub-
lished data), SsaD58, SsaD71, SsaD144, SsaD486 (King
et al. 2005), MST-3 (hereafter referred to as U3) (Presa &
Guyomard 1996), SSsp2201, SSsp2210, SSsp2215,
© 2015 John Wiley & Sons Ltd
COMPLEX SPATIAL STRUCTURE IN ATLANTIC SALMON 5131

SSsp2216 and SSspG7 (Paterson et al. 2004). Details
regarding the microsatellite genotyping have been
described elsewhere (e.g. Bradbury et al. 2014). In brief,
DNA was extracted using the Qiagen DNeasy 96 Blood
and Tissue extraction kit (Qiagen) following the guideli-
nes of the manufacturer. DNA was quantified using
QuantIT PicoGreen (Life Technologies) and diluted to a
final concentration of 10 ng/lL in 10 mM Tris (Buffer
EB; Qiagen). Loci were multiplexed (Bradbury et al.
2014), and PCR reactions were set up in a 10 lL volume
containing 10 ng DNA, 19 Type-it Microsatellite PCR
master mix (Qiagen) and the primer mix for that panel.
PCR products were size separated on an ABI 3130xl
(Life Technologies) capillary electrophoresis system
using Gene Scan 500 as the internal size standard (la-
belled in LIZ; Life Technologies). The resulting electro-
pherograms were analysed using GENE MAPPER 4.0 (Life
Technologies). On each extraction plate, two types of
control samples were included, both redundants and
cross-plate controls. Individuals that failed to amplify
for more than two loci were removed from further
analysis.
SNP array genotyping
A subset of individuals and populations (Table 1) geno-
typed at the microsatellite loci were also analysed using
5568 SNP loci with the SNP array developed by the
Centre for Integrative Genetics (CIGENE, Norway)
using the Illumina infinium assay (Illumina, San Diego,
CA, USA) following the manufacturer’s instructions
(see Bourret et al. 2013a,b for details). A total 203 indi-
viduals were genotyped from 10 populations, with an
average of 20 individuals per population. This array
included primarily nuclear loci, as well as eight mtDNA
loci. Loci were visually classified into different cate-
gories including single locus SNPs, paralogous
sequence variants (PSVs) and multisite variants (MSVs),
arising from genome duplication (for further details see
Lien et al. 2011; Bourret et al. 2013b). We filtered for
true SNPs and genotypes with a >0.95 call rate (CR:
proportion of genotyped SNPs) and removed SNPs
with minor allele frequencies <5% (MAF < 0.05) or
missing in more than 15% of individuals. Previous anal-
ysis suggests that ascertainment bias using this panel
(A)
(B)
Fig. 1 Map of sample locations, (A) inset shows southern Newfoundland in relation to eastern North America. (B) Southern
Newfoundland. See Table 1 for sample sizes and Materials and methods for sampling details.
© 2015 John Wiley & Sons Ltd
5132 I . R . BRADBURY ET AL.

appears minimal for North American populations
(Bourret et al. 2013b). The distribution of these SNPs
across the genome was evaluated using a previously
published linkage map for North American Atlantic Sal-
mon (Brenna-Hansen et al. 2012), and we conducted a
sliding window analysis using a LOWESS second-order
filter and locus-specific FST values.
RAD-seq analysis
For RAD sequencing, again a subset of individuals and
populations were analysed. A total of 313 individuals
were genotyped from 16 populations, with an average
of 19.5 individuals per population (Table 1). Total geno-
mic DNA was extracted from fin clips using the
DNeasy Kit (Qiagen) according to the manufacturer’s
protocols. Subsequently, 2.5 lg of spectrophotometri-
cally quantified DNA was submitted to FLORAGENEX,
Oregon, who generated and sequenced RAD tags
following the methods outlined by Baird et al. (2008),
Hohenlohe et al. (2010) and Emerson et al. (2010). In
brief, sequencing adaptors and individual barcodes
were ligated to Sbf I-digested total genomic DNA, and
the resulting fragments were sequenced from the
restriction sites. Individually barcoded RAD samples
were jointly sequenced on the Illumina GAIIx platform
with single-end 1 9 100-bp chemistry. Reads were sep-
arated by individual, and sequencing barcodes were
removed after the sequencing run, resulting in RAD
tags of 90–100 bp. The available S. salar genome
(http://genomicasalmones.dim.uchile.cl) was used for
RAD reference mapping and to identify SNP candi-
dates. SNP calling was based on output from the BOWTIE
(version 0.11.3; Langmead et al. 2009) and SAMTOOLS
(0.1.12a; Li et al. 2009) algorithms and custom scripts to
identify SNP candidates. Reference mapping with
Table 1 Locations for all samples with sample sizes for each data type. Sample codes refer to locations on Fig. 1
Location Region Code Microsatellite RAD-seq SNP array
Biscay Bay River Trepassey Bay BSB 78 20 20
Stoney Brook Trepassey Bay STN 51 – –Northeast Brook Trepassey Bay NEB 95 20 20
Northwest Brook Trepassey Bay NWT 88 – –St. Shott’s River Trepassey Bay STS 75 – –Big Barachois River St. Mary’s Bay BBA 68 – –Little Salmonier River St. Mary’s Bay LSR 75 20 19
North Harbour St. Mary’s Bay NHR 57 – –Rocky River St. Mary’s Bay RKR 100 20 40
Salmonier River St. Mary’s Bay SLR 84 20 –Northeast River Placentia Bay NPR 111 20 20
Southeast River Placentia Bay SPR 74 20 –Bay du Nord River Fortune Bay BDN 76 20 15
Garnish River Fortune Bay GAR 100 – –Grand Bank Brook Fortune Bay GBB 100 – –Long Harbour River Fortune Bay LHR 56 20 9
Southwest Brook Fortune Bay SWB 71 – –Simms Brook Fortune Bay Fortune Bay FBS 74 – –Old Bay Brook Great Bay de l’Eau OBB 69 – –Conne River Bay d’Espoir CNR 99 20 20
Conne River Mill Brook Bay d’Espoir CMB 77 – –Little River Bay d’Espoir LRR 82 – –Southwest Brook Fortune Bay SWB 71 – –Southwest Brook Milltown Bay d’Espoir SBM 76 – –Cinq Cerf Brook Southwest Coast CCR 80 20 –Dolland Brook Southwest Coast DHB 78 20 –Garndy’s Bay of Islands Southwest Coast GBI 75 – –Grandys Brook Southwest Coast GNR 77 20
Grey River Southwest Coast GRR 82 20 20
Isle aux Morte Southwest Coast IAM 75 – –La Poile River Southwest Coast LPR 70 20 20
White Bear River Southwest Coast WBR 66 13 –Total 2439 313 203
SNP, single nucleotide polymorphism.
© 2015 John Wiley & Sons Ltd
COMPLEX SPATIAL STRUCTURE IN ATLANTIC SALMON 5133
BOWTIE took sequence quality information into account,
allowed for up to three mismatches (4.28%) between
each read and the reference sequence and ignored reads
which mapped against more than a single position in
the genome. SAMTOOLS tabulated SNP results for all indi-
viduals (using the ‘pileup’ module) and retained infor-
mation on the number of reads covering each SNP.
Finally, SNP candidates were filtered for possible PSVs
or MSVs by the removal of all SNPs with three or more
alleles, and additionally, we restricted our analysis to
those SNPs which were unambiguously mapped to the
S. salar reference genome (Davidson et al. 2010). We
also filtered and removed SNPs with a MAF < 5%,
Phred scores < 15, sample depth of <149.
Data analysis
Microsatellite data were checked for the presence of
null alleles and scoring errors using MICRO-CHECKER (van
Oosterhout et al. 2004). Genetic polymorphism was
quantified by examination of the number of alleles (mi-
crosatellites) or minor allele frequency (SNPs) and
observed heterozygosity using MSA (Dieringer &
Schl€otterer 2003) and GENODIVE (Meirmans & Van Tien-
deren 2004). Global and pairwise F-statistics and signifi-
cance were calculated using MSA (microsatellites,
Dieringer & Schl€otterer 2003) and GENODIVE (SNP, Meir-
mans & Van Tienderen 2004). Isolation by distance was
examined using the relationship between linearized FST(FST/(1�FST)), and coastal geographic distance mea-
sured as the shortest distance between all locations
within 5 km of the coast. Bayesian clustering was per-
formed using STRUCTURE v.2.2.4 (Pritchard et al. 2000) to
provide an estimate of the number of distinct groups
present. This approach assumes Hardy–Weinberg equi-
librium and linkage equilibria among loci, introduces
population structure and assigns populations that are
not in linkage equilibrium using a MCMC (Markov
chain Monte Carlo) algorithm to estimate the number of
populations (K). The algorithm was run 10 times for
each K to ensure convergence of values, and with a
burn-in of 100 000 repetitions, 300 000 repetitions after
burn-in and K = 1–25. Structure was initially run with
1 million repetitions to ensure 300 000 was sufficient.
The optimal K was determined visually from the value
at which L P(D) plateaus as well as using the DKmethod (Evanno et al. 2005). All structure results were
amalgamated among replicates using CLUMPP 1.1.2
(Jakobsson & Rosenberg 2007) and summarized graphi-
cally using DISTRUCT 1.1 (Rosenberg 2004). We explored
the variation explained by the STRUCTURE clusters using
AMOVA and all three data sets in ARLEQUIN version 3.5.1.3
(Excoffier & Lischer 2010). Comparisons among data
sets were restricted to locations in common. We used
two approaches to explore similarity in spatial structur-
ing observed in each data set. First, we used Mantel
tests in PASSAGE (Rosenberg 2001) using the pairwise FSTmatrices for each data set to explore similarity in spatial
structure. Second, we conducted principal component
analysis and compared the first principal component
for each data set.
We explored the influence of trans-Atlantic secondary
contact using several mitochondrial SNPs present on
the CIGENE SNP array that have previously been
shown to be diagnostic for European or North Ameri-
can Atlantic Salmon. We focus on one SNP in particular
which appears to be most polymorphic and informative
in this region. This SNP, 10 879, is widely polymorphic
in Europe but not in North America and shows
similar trends as SNPs 365, 5768 (Bourret et al. 2013b,
E. Verspoor and D. Knox, in preparation). We com-
pared differences in the proportion of alleles at 10 879
among pairs of populations to pairwise FST values in all
three data sets to explore possible influences of sec-
ondary contact on spatial structure. Finally, allele fre-
quencies of the diagnostic loci were compared with
range wide mtDNA data on the distribution of North
American and European types.
We evaluated two different measures to examine the
degree of introgression or the proportion of alleles pre-
sent in hybrid individuals from each of the two groups,
and how this differed among the marker types. First,
we compared the frequency distributions of the Q-val-
ues from the STRUCTURE analysis for each data set, run
with K = 2, again limiting the analysis to the 10 com-
mon populations among the data sets. However, in cer-
tain scenarios, a simplified model may be preferred
(Buerkle 2005) and as such we also calculated a maxi-
mum-likelihood hybrid index using the method of
Buerkle (2005) implemented in the R package INTROGRESS
(Gompert & Alex Buerkle 2010; R Development Core
Team 2010). This analysis assumes parental forms can
be identified in advance, and the index scales from 0 to
1, with 0 corresponding to one parental form and 1 to
the other. Individuals identified as parental forms were
selected based on Q-values >0.9 or <0.1 in the STRUCTURE
analysis above. Similarly, hybrid individuals for exami-
nation were selected based on Q-values ranging from
0.1 to 0.9. Again frequency distributions of hybrid index
values were compared among data sets and were also
compared among methods using Pearson’s correlation
coefficient.
Results
Microsatellite mean allelic richness ranged from 11.3 to
18.4 and observed heterozygosity ranged from 0.70 to
0.88. No evidence of linkage disequilibrium was
© 2015 John Wiley & Sons Ltd
5134 I . R . BRADBURY ET AL.
detected among loci, and deviations from Hardy–Wein-
berg equilibrium were rare (<5% of locus population
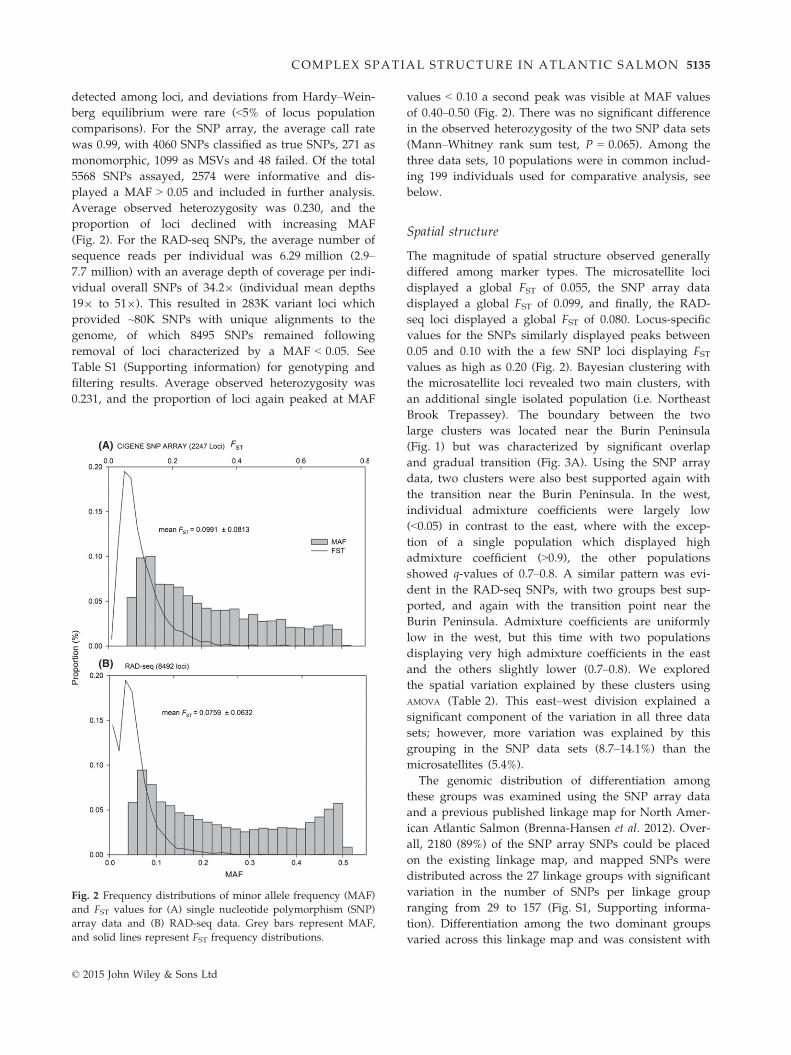
comparisons). For the SNP array, the average call rate
was 0.99, with 4060 SNPs classified as true SNPs, 271 as
monomorphic, 1099 as MSVs and 48 failed. Of the total
5568 SNPs assayed, 2574 were informative and dis-
played a MAF > 0.05 and included in further analysis.
Average observed heterozygosity was 0.230, and the
proportion of loci declined with increasing MAF
(Fig. 2). For the RAD-seq SNPs, the average number of
sequence reads per individual was 6.29 million (2.9–7.7 million) with an average depth of coverage per indi-
vidual overall SNPs of 34.29 (individual mean depths
199 to 519). This resulted in 283K variant loci which
provided ~80K SNPs with unique alignments to the
genome, of which 8495 SNPs remained following
removal of loci characterized by a MAF < 0.05. See
Table S1 (Supporting information) for genotyping and
filtering results. Average observed heterozygosity was
0.231, and the proportion of loci again peaked at MAF
values < 0.10 a second peak was visible at MAF values
of 0.40–0.50 (Fig. 2). There was no significant difference
in the observed heterozygosity of the two SNP data sets
(Mann–Whitney rank sum test, P = 0.065). Among the
three data sets, 10 populations were in common includ-
ing 199 individuals used for comparative analysis, see
below.
Spatial structure
The magnitude of spatial structure observed generally
differed among marker types. The microsatellite loci
displayed a global FST of 0.055, the SNP array data
displayed a global FST of 0.099, and finally, the RAD-
seq loci displayed a global FST of 0.080. Locus-specific
values for the SNPs similarly displayed peaks between
0.05 and 0.10 with the a few SNP loci displaying FSTvalues as high as 0.20 (Fig. 2). Bayesian clustering with
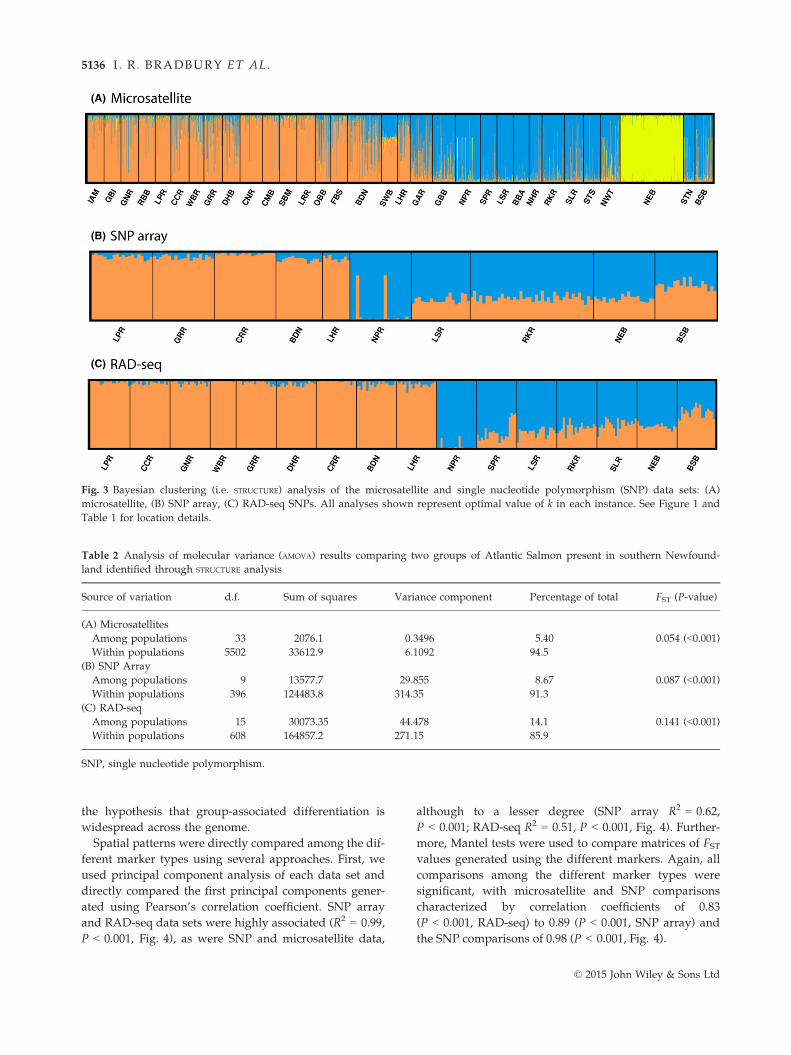
the microsatellite loci revealed two main clusters, with
an additional single isolated population (i.e. Northeast
Brook Trepassey). The boundary between the two
large clusters was located near the Burin Peninsula
(Fig. 1) but was characterized by significant overlap
and gradual transition (Fig. 3A). Using the SNP array
data, two clusters were also best supported again with
the transition near the Burin Peninsula. In the west,
individual admixture coefficients were largely low
(<0.05) in contrast to the east, where with the excep-
tion of a single population which displayed high
admixture coefficient (>0.9), the other populations
showed q-values of 0.7–0.8. A similar pattern was evi-
dent in the RAD-seq SNPs, with two groups best sup-
ported, and again with the transition point near the
Burin Peninsula. Admixture coefficients are uniformly
low in the west, but this time with two populations
displaying very high admixture coefficients in the east
and the others slightly lower (0.7–0.8). We explored
the spatial variation explained by these clusters using
AMOVA (Table 2). This east–west division explained a
significant component of the variation in all three data
sets; however, more variation was explained by this
grouping in the SNP data sets (8.7–14.1%) than the
microsatellites (5.4%).
The genomic distribution of differentiation among
these groups was examined using the SNP array data
and a previous published linkage map for North Amer-
ican Atlantic Salmon (Brenna-Hansen et al. 2012). Over-
all, 2180 (89%) of the SNP array SNPs could be placed
on the existing linkage map, and mapped SNPs were
distributed across the 27 linkage groups with significant
variation in the number of SNPs per linkage group
ranging from 29 to 157 (Fig. S1, Supporting informa-
tion). Differentiation among the two dominant groups
varied across this linkage map and was consistent with
(A)
(B)
Fig. 2 Frequency distributions of minor allele frequency (MAF)
and FST values for (A) single nucleotide polymorphism (SNP)
array data and (B) RAD-seq data. Grey bars represent MAF,
and solid lines represent FST frequency distributions.
© 2015 John Wiley & Sons Ltd
COMPLEX SPATIAL STRUCTURE IN ATLANTIC SALMON 5135
the hypothesis that group-associated differentiation is
widespread across the genome.
Spatial patterns were directly compared among the dif-
ferent marker types using several approaches. First, we
used principal component analysis of each data set and
directly compared the first principal components gener-
ated using Pearson’s correlation coefficient. SNP array
and RAD-seq data sets were highly associated (R2 = 0.99,
P < 0.001, Fig. 4), as were SNP and microsatellite data,
although to a lesser degree (SNP array R2 = 0.62,
P < 0.001; RAD-seq R2 = 0.51, P < 0.001, Fig. 4). Further-
more, Mantel tests were used to compare matrices of FSTvalues generated using the different markers. Again, all
comparisons among the different marker types were
significant, with microsatellite and SNP comparisons
characterized by correlation coefficients of 0.83
(P < 0.001, RAD-seq) to 0.89 (P < 0.001, SNP array) and
the SNP comparisons of 0.98 (P < 0.001, Fig. 4).
(A)
(B)
(C)
Fig. 3 Bayesian clustering (i.e. STRUCTURE) analysis of the microsatellite and single nucleotide polymorphism (SNP) data sets: (A)
microsatellite, (B) SNP array, (C) RAD-seq SNPs. All analyses shown represent optimal value of k in each instance. See Figure 1 and
Table 1 for location details.
Table 2 Analysis of molecular variance (AMOVA) results comparing two groups of Atlantic Salmon present in southern Newfound-
land identified through STRUCTURE analysis
Source of variation d.f. Sum of squares Variance component Percentage of total FST (P-value)
(A) Microsatellites
Among populations 33 2076.1 0.3496 5.40 0.054 (<0.001)Within populations 5502 33612.9 6.1092 94.5
(B) SNP Array
Among populations 9 13577.7 29.855 8.67 0.087 (<0.001)Within populations 396 124483.8 314.35 91.3
(C) RAD-seq
Among populations 15 30073.35 44.478 14.1 0.141 (<0.001)Within populations 608 164857.2 271.15 85.9
SNP, single nucleotide polymorphism.
© 2015 John Wiley & Sons Ltd
5136 I . R . BRADBURY ET AL.

The possible influence of secondary contact between
eastern and western Atlantic populations on regional
structuring was explored using the diagnostic mtDNA
SNPs genotyped as part of the SNP array. First, we
compared the distribution of European haplotypes in
southern Newfoundland with entire range using data
from E. Verspoor and D. Knox (in preparation) to
demonstrate the diagnostic nature of these alleles for
continental type (Fig. S2, Supporting information). We
observed a clear association between diagnostic mtDNA
alleles in Newfoundland and those found in the eastern
Atlantic supporting their usage in this context and there
was a clear tendency for European alleles to occur in
the southeast and not the southwest of Newfoundland
(Fig. S2, Supporting information). In fact, the frequency
of the eastern Atlantic allele was clearly elevated in
eastern Newfoundland although the population-specific
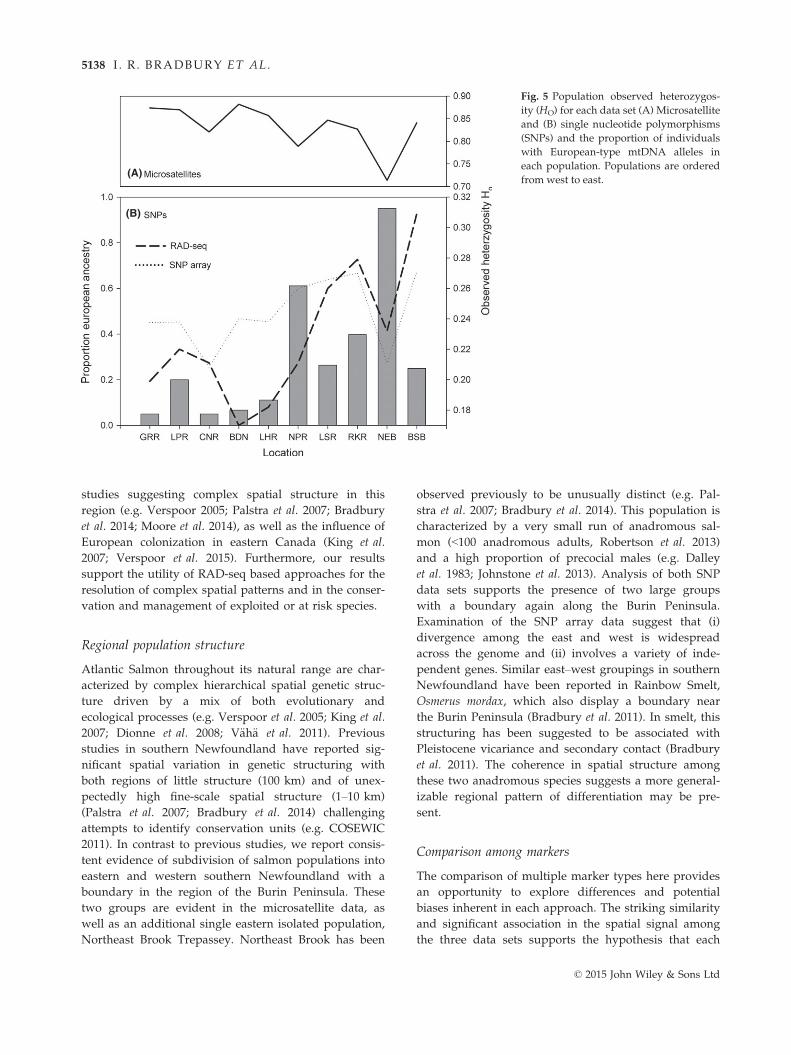
values were variable. Changes in marker diversity
seemed to coincide with this transition across the south
coast with microsatellite observed heterozygosity
decreasing to the east and SNP observed heterozygosity
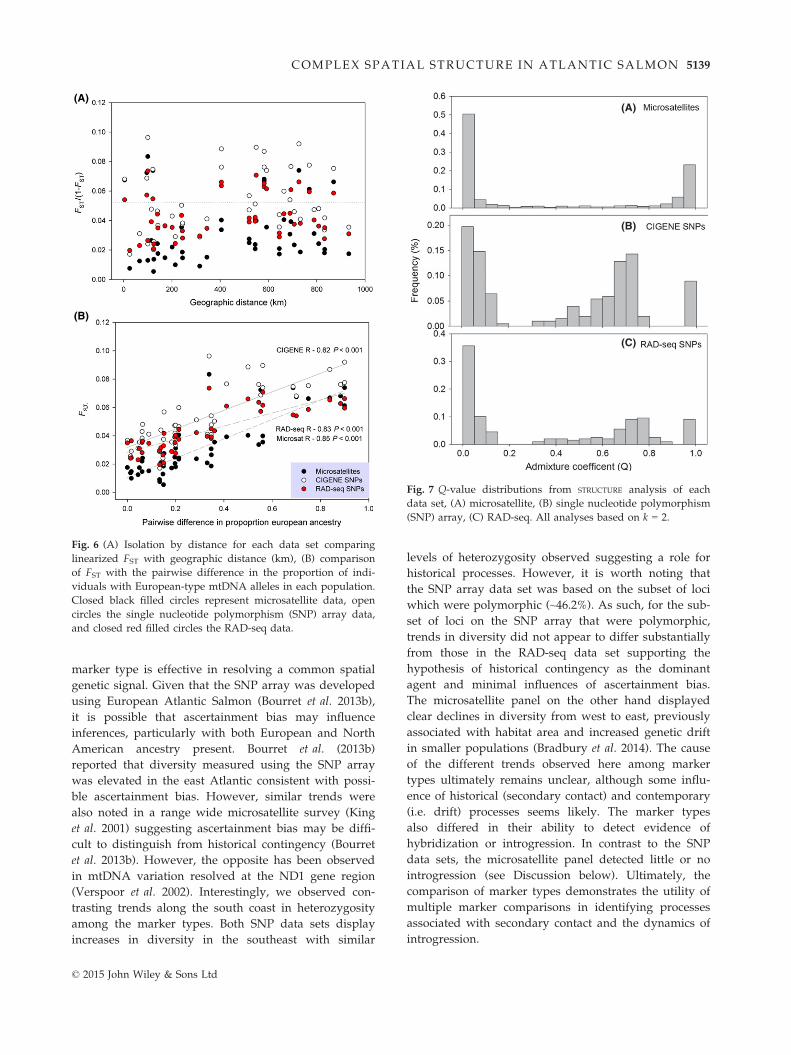
increasing (Fig. 5). To evaluate the role of secondary
contact vs. dispersal or straying as structuring agents in
this region, we used all three data sets and compared
the isolation-by-distance relationships with the relation-
ship between the proportion of European alleles present
and FST. The portion of European alleles per population
was significantly associated with FST and similar in each
marker type (R > 0.80, P < 0.001) despite a lack of isola-
tion by distance in the region again in all three data sets
(R < 0.20, P > 0.05) (Fig. 6).
To explore the presence of possible hybridization
and introgression among the groups present on the
south coast, we used two approaches. First, we evalu-
ated the distribution of Q-values from STRUCTURE analy-
sis (k = 2) for each marker type (Fig. 7). For the
microsatellite loci, the Q-value distribution clearly
showed two peaks associated with the two groups, but
little evidence of individuals with intermediate Q-val-
ues. This was in contrast to the SNP data sets, which
displayed Q-values associated with the two groups,
but also a significant proportion of individuals with
intermediate Q-value consistent with introgression
(Fig. 7). In both instances (i.e. SNP data sets), the inter-
mediate Q-values were not evenly distributed, but
skewed towards the eastern regions ‘European-’ type
individuals. Second, we also used a maximum-likeli-
hood-based hybrid index to quantify the presence of
introgression in the different data sets (Fig. 8). Again,
the SNP data sets showed a significant proportion of
intermediate hybrid index values and again they are
skewed towards the individuals from the southeast or
European type (Fig. 8).
Discussion
The identification of discrete and unique assemblages of
individuals or populations is central to the management
and conservation of exploited or threatened species.
Recent advances in population genomics utilizing next
generation sequencing provide opportunities for re-
evaluating existing management units but comparisons
among approaches remain rare. Here, we report signifi-
cant similarity in the utility of RAD-seq, a SNP array
and a microsatellite panel to resolve spatial structuring
in a threatened Atlantic Salmon population and provide
evidence of significant subgroups within an existing
conservation unit. Interestingly, these groups seem
defined by secondary contact between European and
North American origin Atlantic Salmon, and analysis of
the SNP data sets indicates some evidence of asymmet-
rical introgression with gene flow towards the Euro-
pean type. This work builds directly on previous
(A)
(B)
Fig. 4 Comparison of first principal component from the analy-
sis of each data set. (A) Comparing RAD-seq and single
nucleotide polymorphism (SNP) array PCs, (B) comparing SNP
and microsatellite PCs. Closed circles represent comparisons
with SNP array and open circles the RAD-seq data.
© 2015 John Wiley & Sons Ltd
COMPLEX SPATIAL STRUCTURE IN ATLANTIC SALMON 5137
studies suggesting complex spatial structure in this
region (e.g. Verspoor 2005; Palstra et al. 2007; Bradbury
et al. 2014; Moore et al. 2014), as well as the influence of
European colonization in eastern Canada (King et al.
2007; Verspoor et al. 2015). Furthermore, our results
support the utility of RAD-seq based approaches for the
resolution of complex spatial patterns and in the conser-
vation and management of exploited or at risk species.
Regional population structure
Atlantic Salmon throughout its natural range are char-
acterized by complex hierarchical spatial genetic struc-
ture driven by a mix of both evolutionary and
ecological processes (e.g. Verspoor et al. 2005; King et al.
2007; Dionne et al. 2008; V€ah€a et al. 2011). Previous
studies in southern Newfoundland have reported sig-
nificant spatial variation in genetic structuring with
both regions of little structure (100 km) and of unex-
pectedly high fine-scale spatial structure (1–10 km)
(Palstra et al. 2007; Bradbury et al. 2014) challenging
attempts to identify conservation units (e.g. COSEWIC
2011). In contrast to previous studies, we report consis-
tent evidence of subdivision of salmon populations into
eastern and western southern Newfoundland with a
boundary in the region of the Burin Peninsula. These
two groups are evident in the microsatellite data, as
well as an additional single eastern isolated population,
Northeast Brook Trepassey. Northeast Brook has been
observed previously to be unusually distinct (e.g. Pal-
stra et al. 2007; Bradbury et al. 2014). This population is
characterized by a very small run of anadromous sal-
mon (<100 anadromous adults, Robertson et al. 2013)
and a high proportion of precocial males (e.g. Dalley
et al. 1983; Johnstone et al. 2013). Analysis of both SNP
data sets supports the presence of two large groups
with a boundary again along the Burin Peninsula.
Examination of the SNP array data suggest that (i)
divergence among the east and west is widespread
across the genome and (ii) involves a variety of inde-
pendent genes. Similar east–west groupings in southern
Newfoundland have been reported in Rainbow Smelt,
Osmerus mordax, which also display a boundary near
the Burin Peninsula (Bradbury et al. 2011). In smelt, this
structuring has been suggested to be associated with
Pleistocene vicariance and secondary contact (Bradbury
et al. 2011). The coherence in spatial structure among
these two anadromous species suggests a more general-
izable regional pattern of differentiation may be pre-
sent.
Comparison among markers
The comparison of multiple marker types here provides
an opportunity to explore differences and potential
biases inherent in each approach. The striking similarity
and significant association in the spatial signal among
the three data sets supports the hypothesis that each
(A)
(B)
Fig. 5 Population observed heterozygos-
ity (HO) for each data set (A) Microsatellite
and (B) single nucleotide polymorphisms
(SNPs) and the proportion of individuals
with European-type mtDNA alleles in
each population. Populations are ordered
from west to east.
© 2015 John Wiley & Sons Ltd
5138 I . R . BRADBURY ET AL.
marker type is effective in resolving a common spatial
genetic signal. Given that the SNP array was developed
using European Atlantic Salmon (Bourret et al. 2013b),
it is possible that ascertainment bias may influence
inferences, particularly with both European and North
American ancestry present. Bourret et al. (2013b)
reported that diversity measured using the SNP array
was elevated in the east Atlantic consistent with possi-
ble ascertainment bias. However, similar trends were
also noted in a range wide microsatellite survey (King
et al. 2001) suggesting ascertainment bias may be diffi-
cult to distinguish from historical contingency (Bourret
et al. 2013b). However, the opposite has been observed
in mtDNA variation resolved at the ND1 gene region
(Verspoor et al. 2002). Interestingly, we observed con-
trasting trends along the south coast in heterozygosity
among the marker types. Both SNP data sets display
increases in diversity in the southeast with similar
levels of heterozygosity observed suggesting a role for
historical processes. However, it is worth noting that
the SNP array data set was based on the subset of loci
which were polymorphic (~46.2%). As such, for the sub-
set of loci on the SNP array that were polymorphic,
trends in diversity did not appear to differ substantially
from those in the RAD-seq data set supporting the
hypothesis of historical contingency as the dominant
agent and minimal influences of ascertainment bias.
The microsatellite panel on the other hand displayed
clear declines in diversity from west to east, previously
associated with habitat area and increased genetic drift
in smaller populations (Bradbury et al. 2014). The cause
of the different trends observed here among marker
types ultimately remains unclear, although some influ-
ence of historical (secondary contact) and contemporary
(i.e. drift) processes seems likely. The marker types
also differed in their ability to detect evidence of
hybridization or introgression. In contrast to the SNP
data sets, the microsatellite panel detected little or no
introgression (see Discussion below). Ultimately, the
comparison of marker types demonstrates the utility of
multiple marker comparisons in identifying processes
associated with secondary contact and the dynamics of
introgression.
(A)
(B)
Fig. 6 (A) Isolation by distance for each data set comparing
linearized FST with geographic distance (km), (B) comparison
of FST with the pairwise difference in the proportion of indi-
viduals with European-type mtDNA alleles in each population.
Closed black filled circles represent microsatellite data, open
circles the single nucleotide polymorphism (SNP) array data,
and closed red filled circles the RAD-seq data.
(A)
(B)
(C)
Fig. 7 Q-value distributions from STRUCTURE analysis of each
data set, (A) microsatellite, (B) single nucleotide polymorphism
(SNP) array, (C) RAD-seq. All analyses based on k = 2.
© 2015 John Wiley & Sons Ltd
COMPLEX SPATIAL STRUCTURE IN ATLANTIC SALMON 5139

Secondary contact and introgression
A significant factor in the formation of the east and west
groups along the south coast of Newfoundland seems to
be secondary contact between two phylogeographic
lineages representing North American and European
Atlantic Salmon variants. Despite significant divergence
between east and west Atlantic, previous work had sug-
gested the presence of these alternate variants in a few
locations both in North America (e.g. Verspoor et al.
2005) and northern Europe (e.g. Makhrov et al. 2005), but
their fine-scale distribution and influence on spatial
structure had not been resolved. In these southeastern
Newfoundland populations, the proportion of diagnostic
European alleles was elevated in comparison with south-
western Newfoundland, varied among locations sampled
and was highest in two small rivers with partial obstruc-
tions to upstream migration, Northeast River Placentia
and Northeast Brook Trepassey. Indeed, the unusual
uniqueness of Northeast Brook Trepassey noted here and
elsewhere (Palstra et al. 2007; Bradbury et al. 2014) may
be partly due to the dominance of this European lineage.
Dating of the divergence of Eastern and Western Atlantic
Salmon suggests the isolation of these lineages for the last
600 000–700 000 years (King et al. 2007). Recent examina-
tion of the European lineage in Newfoundland suggests
its isolation from Europe occurred c. 18 000–19 000 years
ago (E. Verspoor and D. Knox, in preparation) implying
that the North American European lineage was isolated
from Europe around the end of the last glacial period.
Recent range wide SNP analysis supports hypotheses of
a deep genetic divergence between the east and west
Atlantic stocks, although no loci displayed fixed differ-
ences between the regions (Bourret et al. 2013b) perhaps
in part due to the presence of these alternate variants; this
parallels observations for allozyme variation (Verspoor
et al. 2005). Similar patterns of the influence of European
lineages in the western Atlantic have been reported in
Atlantic cod on the Flemish Cap (Cross & Payne 1978;
Bradbury et al. 2013), and Atlantic wolfish on the Grand
Banks (McCusker & Bentzen 2010). In addition to marine
fish, several intertidal marine invertebrates display
patterns of colonization of eastern North America from
Europe following the last glacial period (Wares & Cun-
ningham 2001). This growing body of work supports the
hypothesis that periods of trans-Atlantic colonization
and gene flow have been a common phenomenon.
Admittedly, our ability to interpret these lineage-specific
trends here depends on the use of the diagnostic mtDNA
SNPs used in the analysis. The fact that these SNPs corre-
late with whole mtDNA patterns in lineage distribution
generally supports their usage here.
The presence of both lineages in eastern North Amer-
ica raises the possibility of hybridization and introgres-
sion. Our analysis of both SNP data sets supports the
hypothesis that introgression has occurred, as interme-
diate q-values and hybrid index values were observed.
Although there was limited evidence of introgression in
the microsatellite data set, it is possible that the
microsatellite panel has less power to resolve introgres-
sion in comparison with the SNP panels; however, the
east and west groups are clearly resolved in the cluster-
ing analysis using the microsatellites. It also possibly
supports a hypothesis of differential introgression or
perhaps the leakage of favourable gene-associated
SNPs. This observation is in contrast to the patterns of
differential introgression usually observed at hybrid
zones during the early stages of speciation where diver-
gence is only apparent at loci associated with reproduc-
tive isolation or ecological speciation (e.g. Payseur 2010;
Larson et al. 2013).
Also worth noting is the observation that the interme-
diate q-values and hybrid index values in both SNP
data sets were skewed towards the southeastern popu-
lations. This is consistent with a hypothesis of asym-
metric introgression and gene flow from the North
(A)
(B)
Fig. 8 Hybrid index values from INTROGRESS for both single
nucleotide polymorphism (SNP) data sets (A) SNP array and
(B) RAD-seq.
© 2015 John Wiley & Sons Ltd
5140 I . R . BRADBURY ET AL.
American lineage into the local European lineage.
Asymmetrical or unidirectional hybridization and intro-
gression has been reported among several other species
of closely related salmonids (e.g. Garcia-Vazquez et al.
2004; Kirkpatrick et al. 2007; �Alvarez & Garcia-Vazquez
2011) and is consistent with significant divergence and
hypotheses of subspecies status of North American and
European Atlantic Salmon (King et al. 2007). In fact,
previous work has reported significant differences in
chromosome number between North American and
European Atlantic Salmon, and significant divergence at
almost all marker types examined (King et al. 2007),
again supporting hypotheses of significant divergence.
Our observation of asymmetrical introgression is also
consistent with a recent study exploring the viability of
backcrosses between North American and European
Atlantic Salmon. Cauwelier et al. (2012) report a com-
plete lack of viability when F1 hybrids were back
crossed to North American Salmon and hypothesize
that this may be associated with Dobzhansky—Muller
incompatibilities. Thus, our study supports early experi-
mental and genetic work suggesting that hybridization
can occur, that it appears to be asymmetric towards the
European variant, and is consistent with subspecies
level isolation observed among other salmonids.
Management and conservation implications
Dramatic increases in the number of loci surveyed and
the inclusion of both functional and neutral genetic
variation have revolutionized how genetics and geno-
mics can contribute to management and conservation
activities (Funk et al. 2012). Atlantic Salmon in southern
Newfoundland have undergone significant declines in
abundance the last few decades with some individual
rivers declining by more than 50% (Robertson et al.
2013) and at present are designated as a single designat-
able or evolutionarily significant unit (COSEWIC 2011).
Our results clearly demonstrate the presence of two
groups characterized by significant differentiation both
at neutral and gene-associated loci, warranting subdivi-
sion of this conservation unit. The identification of east-
ern Atlantic affinities in one of these groups and the
possibility of limited introgression and even subspecies
status only serve to strengthen this case. Furthermore,
the similarities reported here among methods despite
the complex demographic scenario support the utility
of new approaches such as RAD-seq for resolving struc-
turing in nonmodel species. Recent work in Atlantic
Salmon is continuing to define conservation units both
in North American and Europe (Bourret et al. 2013a;
Moore et al. 2014). Similar results have been reported in
marine fish where the identification of cryptic diversity
using genome wide SNP surveys has the potential to
change management and conservation practices
(COSEWIC 2010; Bradbury et al. 2013; Milano et al.
2014). The growing body of examples including this
work support the conclusion that population genomic
tools will ultimately change management and conserva-
tion of wild populations by allowing a more accurate
delineation of diversity in conservation units and pro-
viding fine-scale tools for assignment and individual
identification.
Acknowledgements
All samples were collected with the assistance of Fisheries and
Oceans staff including G. Furey, R. Poole, D. Reddin, B Short
and P Downton. We thank G. Perry, R. Porter, two anonymous
reviewers for their constructive comments on a previous ver-
sion of this manuscript. Funding for sample collection and
analysis was provided by the Genomics Research and Develop-
ment Initiative of Fisheries and Oceans Canada.
References
�Alvarez D, Garcia-Vazquez E (2011) Maintenance of asymmet-
ric hybridization between Atlantic salmon (Salmo salar) and
brown trout (Salmo trutta) via postzygotic barriers and pater-
nal effects. Canadian Journal of Fisheries and Aquatic Sciences,
68, 593–602.Baird N, Etter P, Atwood T et al. (2008) Rapid SNP discovery
and genetic mapping using sequenced RAD markers. PLoS
ONE, 3, e3376.
Benestan L, Gosselin T, Perrier C et al. (2015) RAD-genotyping
reveals fine-scale genetic structuring and provides powerful
population assignment in a widely distributed marine
species; the American lobster (Homarus americanus). Molecular
Ecology, 24, 3299–3315.Bourret V, Dionne M, Kent MP, Lien S, Bernatchez L (2013a)
Landscape genomics in Atlantic salmon (Salmo salar): search-
ing for gene-environment interactions driving local adapta-
tion. Evolution, 67, 3469–3487.Bourret V, Kent MP, Primmer CR et al. (2013b) SNP-array
reveals genome-wide patterns of geographical and potential
adaptive divergence across the natural range of Atlantic sal-
mon (Salmo salar). Molecular Ecology, 22, 532–551.Bradbury IR, Coulson MW, Campana SE, Paterson IG, Bentzen
P (2011) Contemporary nuclear and mitochondrial genetic
clines in a north temperate estuarine fish reflect Pleistocene
vicariance. Marine Ecology Progress Series, 438, 207–218.Bradbury IR, Hubert S, Higgins B et al. (2013) Genomic islands
of divergence and their consequences for the resolution of
spatial structure in an exploited marine fish. Evolutionary
Applications, 6, 450–461.Bradbury IR, Hamilton LC, Robertson MJ et al. (2014) Land-
scape structure and climatic variation determine Atlantic sal-
mon genetic connectivity in the northwest Atlantic. Canadian
Journal of Fisheries and Aquatic Sciences, 71, 246–258.Brenna-Hansen S, Li J, Kent M et al. (2012) Chromosomal differ-
ences between European and North American Atlantic salmon
discovered by linkage mapping and supported by fluores-
cence in situ hybridization analysis. BMC Genomics, 13, 432.
© 2015 John Wiley & Sons Ltd
COMPLEX SPATIAL STRUCTURE IN ATLANTIC SALMON 5141
Buerkle CA (2005) Maximum-likelihood estimation of a hybrid
index based on molecular markers. Molecular Ecology Notes,
5, 684–687.Candy JR, Campbell NR, Grinnell MH et al. (2015) Population
differentiation determined from putative neutral and diver-
gent adaptive genetic markers in Eulachon (Thaleichthys paci-
ficus, Osmeridae), an anadromous Pacific smelt. Molecular
Ecology Resources, doi: 10.1111/1755-0998.
Castric V, Bernatchez L (2004) Individual assignment test
reveals differential restriction to dispersal between two sal-
monids despite no increase of genetic differences with dis-
tance. Molecular Ecology, 13, 1299–1312.Cauwelier E, Gilbey J, Jones CS, Noble LR, Verspoor E (2012)
Asymmetrical viability in backcrosses between highly diver-
gent populations of Atlantic salmon (Salmo salar): implica-
tions for conservation. Conservation Genetics, 13, 1665–1669.COSEWIC (2008) Guidelines for recognizing designatable units.
Government of Canada. Available from http://www.
cosewic.gc.ca/eng/sct2/sct2_5_e.cfm.
COSEWIC (2010) COSEWIC Assessment and Update Status Report
on the North Atlantic Cod, Gadus moruha, in Canada, pp. 118.
Committee on the Status of Endangered Wildlife in Canada,
Ottawa, Ontario.
COSEWIC (2011) COSEWIC Assessment and Status Report on the
Atlantic Salmon Salmo salar in Canada, pp. 182. Committee on
the Status of Endangered Wildlife in Canada, Ottawa,
Ontario.
Cross TF, Payne RH (1978) Geographic variation in Atlantic
cod, Gadus morhua, off eastern North America: a biochemical
systematics approach. Journal of the Fisheries Research Board of
Canada, 35, 117–123.Dalley EL, Andrews CW, Green JM (1983) Precocious male
Atlantic salmon parr (Salmo salar) in insular Newfoundland.
Canadian Journal of Fisheries and Aquatic Sciences, 40, 648–652.Davey JW, Blaxter ML (2010) RADSeq: next-generation popula-
tion genetics. Briefings in Functional Genomics, 9, 416–423.Davidson W, Koop B, Jones S et al. (2010) Sequencing the genome
of the Atlantic salmon (Salmo salar). Genome Biology, 11, 403.
Dieringer D, Schl€otterer C (2003) Microsatellite analyser (MSA):
a platform independent analysis tool for large microsatellite
data sets. Molecular Ecology Notes, 3, 167–169.Dionne M, Caron F, Dodson JJ, Bernatchez L (2008) Landscape
genetics and hierarchical genetic structure in Atlantic sal-
mon: the interaction of gene flow and local adaptation.
Molecular Ecology, 17, 2382–2396.Dionne M, Caron F, Dodson J, Bernatchez L (2009) Compara-
tive survey of within-river genetic structure in Atlantic sal-
mon; relevance for management and conservation.
Conservation Genetics, 10, 869–879.Emerson KJ, Catchen JM, Hohenlohe PA et al. (2010) Resolving
postglacial phylogeography using high-throughput sequenc-
ing. Proceedings of the National Academy of Sciences, USA, 107,
16196–16200.Etter PD, Preston J, Bassham S, Cresko WA, Johnson EA (2011)
Local de novo assembly of RAD paired-end contigs using
short sequencing reads. PLoS ONE, 6, e18561.
Evanno G, Regnaut S, Goudet J (2005) Detecting the number of
clusters of individuals using the software STRUCTURE: a
simulation study. Molecular Ecology, 14, 2611–2620.Excoffier L, Lischer HEL (2010) Arlequin suite ver 3.5: a new
series of programs to perform population genetics analyses
under Linux and Windows. Molecular Ecology Resources, 10,
564–567.Funk WC, McKay JK, Hohenlohe PA, Allendorf FW (2012)
Harnessing genomics for delineating conservation units.
Trends in Ecology & Evolution, 27, 489–496.Garcia-Vazquez E, Perez J, Ayllon F et al. (2004) Asymmetry of
post-F1 interspecific reproductive barriers among brown
trout (Salmo trutta) and Atlantic salmon (Salmo salar). Aqua-
culture, 234, 77–84.Gompert Z, Alex Buerkle C (2010) Introgress: a software pack-
age for mapping components of isolation in hybrids. Molecu-
lar Ecology Resources, 10, 378–384.Gonen S, Lowe N, Cezard T et al. (2014) Linkage maps of the
Atlantic salmon (Salmo salar) genome derived from RAD
sequencing. BMC Genomics, 15, 166.
de Guia A, Saitoh T (2007) The gap between the concept and
definitions in the evolutionarily significant unit: the need to
integrate neutral genetic variation and adaptive variation.
Ecological Research, 22, 604–612.Hohenlohe PA, Bassham S, Etter PD et al. (2010) Population
genomics of parallel adaptation in threespine stickleback
using sequenced RAD tags. PLoS Genetics, 6, e1000862.
Hohenlohe PA, Day MD, Amish SJ et al. (2013) Genomic pat-
terns of introgression in rainbow and westslope cutthroat
trout illuminated by overlapping paired-end RAD sequenc-
ing. Molecular Ecology, 22, 3002–3013.Houston R, Taggart J, Cezard T et al. (2014) Development and
validation of a high density SNP genotyping array for Atlan-
tic salmon (Salmo salar). BMC Genomics, 15, 90.
ICES (2015) Report of the Working Group on North Atlantic Sal-
mon (WGNAS), 17–26 March Moncton, Canada, pp. 380. ICES
CM, Moncton, New Brunswick, Canada.
Jakobsson M, Rosenberg NA (2007) CLUMPP: a cluster match-
ing and permutation program for dealing with label switch-
ing and multimodality in analysis of population structure.
Bioinformatics, 23, 1801–1806.Johnstone DL, O’Connell MF, Palstra FP, Ruzzante DE (2013)
Mature male parr contribution to the effective size of an
anadromous Atlantic salmon (Salmo salar) population over
30 years. Molecular Ecology, 22, 2394–2407.Keefer M, Caudill C (2014) Homing and straying by anadro-
mous salmonids: a review of mechanisms and rates. Reviews
in Fish Biology and Fisheries, 24, 333–368.King TL, Kalinowski ST, Schill WB, Spidle AP, Lubinski BA
(2001) Population structure of Atlantic salmon (Salmo salar
L.): a range-wide perspective from microsatellite DNA varia-
tion. Molecular Ecology, 10, 807–821.King TL, Eackles MS, Letcher BH (2005) Microsatellite DNA
markers for the study of Atlantic salmon (Salmo salar) kin-
ship, population structure, and mixed-fishery analyses.
Molecular Ecology Notes, 5, 130–132.King TL, Verspoor E, Spidle AP et al. (2007) Biodiversity and
population structure. In: The Atlantic Salmon (eds Verspoor
E, Stradmeyer L, Nielsen J), pp. 117–166. Blackwell Publish-
ing Ltd., Oxford.
Kirkpatrick NS, Everitt DW, Evans BI (2007) Asymmetric
hybridization of pink (Oncorhynchus gorbuscha) and Chinook
(O. tshawytscha) salmon in the St. Marys River, Michigan.
Journal of Great Lakes Research, 33, 358–365.Lamichhaney S, Martinez Barrio A, Rafati N et al. (2012) Popu-
lation-scale sequencing reveals genetic differentiation due to
© 2015 John Wiley & Sons Ltd
5142 I . R . BRADBURY ET AL.
local adaptation in Atlantic herring. Proceedings of the
National Academy of Sciences, USA, 109, 19345–19350.Langmead B, Trapnell C, Pop M, Salzberg S (2009) Ultrafast
and memory-efficient alignment of short DNA sequences to
the human genome. Genome Biology, 10, R25.
Larson EL, Andres JA, Bogdanowicz SM, Harrison RG (2013)
Differential introgression in a mosaic hybrid zone reveals
candidate barrier genes. Evolution, 67, 3653–3661.Larson WA, Seeb LW, Everett MV et al. (2014) Genotyping by
sequencing resolves shallow population structure to inform
conservation of Chinook salmon (Oncorhynchus tshawytscha).
Evolutionary Applications, 7, 355–369.Li H, Handsaker B, Wysoker A et al. (2009) The sequence
alignment/map format and SAMtools. Bioinformatics, 25,
2078–2079.Lien S, Gidskehaug L, Moen T et al. (2011) A dense SNP-based
linkage map for Atlantic salmon (Salmo salar) reveals extended
chromosome homeologies and striking differences in sex-
specific recombination patterns. BMC Genomics, 12, 1–10.Makhrov AA, Verspoor E, Artamonova VS, O’Sullivan M
(2005) Atlantic salmon colonization of the Russian Arctic
coast: pioneers from North America. Journal of Fish Biology,
67, 68–79.McConnell SK, O’Reilly P, Hamilton L, Wright JM, Bentzen P
(1995) Polymorphic microsatellite loci from Atlantic salmon
(Salmo salar): genetic differentiation of North American and
European populations. Canadian Journal of Fisheries and Aqua-
tic Sciences, 52, 1863–1872.McCusker MR, Bentzen P (2010) Phylogeography of 3 North
Atlantic wolffish species (Anarhichas spp.) with phylogenetic
relationships within the family Anarhichadidae. Journal of
Heredity, 101, 594–601.Meirmans PG, Van Tienderen PH (2004) Genotype and gen-
odive: two programs for the analysis of genetic diversity of
asexual organisms. Molecular Ecology Notes, 4, 792–794.Milano I, Babbucci M, Cariani A et al. (2014) Outlier SNP
markers reveal fine-scale genetic structuring across European
hake populations (Merluccius merluccius). Molecular Ecology,
23, 118–135.Moore J-S, Bourret V, Dionne M et al. (2014) Conservation
genomics of anadromous Atlantic salmon across its North
American range: outlier loci identify the same patterns of
population structure as neutral loci. Molecular Ecology, 23,
5680–5697.Moritz C (1994) Defining evolutionarily significant units for
conservation. Trends in Ecology and Evolution, 9, 373–375.van Oosterhout C, Hutchison WF, Wills DMP (2004) MICRO-
CHECKER: software for identifying and correcting genotyp-
ing errors in microsatellite data. Molecular Ecology Notes, 4,
535.
O’Reilly PT, Canino MF, Bailey KM, Bentzen P (2000) Isolation
of twenty low stutter di and tetranucleotide microsatellites
for population analyses of walleye pollock and other
gadoids. Journal of Fish Biology, 56, 1074–1086.Ozerov MY, Veselov AE, Lumme J, Primmer CR (2012) “River-
scape” genetics: river characteristics influence the genetic
structure and diversity of anadromous and freshwater Atlan-
tic salmon (Salmo salar) populations in northwest Russia.
Canadian Journal of Fisheries and Aquatic Sciences, 69, 1947–1958.Palstra FP, O’Connell MF, Ruzzante DE (2007) Population
structure and gene flow reversals in Atlantic salmon (Salmo
salar) over contemporary and long-term temporal scales:
effects of population size and life history. Molecular Ecology,
16, 4504–4522.Paterson S, Piertney SB, Knox D, Gilbey J, Verspoor E (2004)
Characterization and PCR multiplexing of novel highly vari-
able tetranucleotide Atlantic salmon (Salmo salar L.)
microsatellites. Molecular Ecology Notes, 4, 160–162.Payseur BA (2010) Using differential introgression in hybrid
zones to identify genomic regions involved in speciation.
Molecular Ecology Resources, 10, 806–820.Peterson BK, Weber JN, Kay EH, Fisher HS, Hoekstra HE
(2012) Double digest RADseq: an inexpensive method for
SNP discovery and genotyping in model and non-model spe-
cies. PLoS ONE, 7, e37135.
Presa P, Guyomard R (1996) Conservation of microsatellites in
three species of salmonids. Journal of Fish Biology, 49, 1326–1329.
Primmer CR, Veselov AJ, Zubchenko A et al. (2006) Isolation by
distance within a river system: genetic population structuring
of Atlantic salmon, Salmo salar, in tributaries of the Varzuga
River in northwest Russia. Molecular Ecology, 15, 653–666.Pritchard JK, Stephens M, Donnelly P (2000) Inference of popu-
lation structure using multilocus genotype data. Genetics,
155, 945.
R Development Core Team (2010) R: A Language and Environ-
ment for Statistical Computing. R Foundation for Statistical
Computing, Vienna, Austria.
Reddin DG (1988) Ocean life of Atlantic salmon (Salmo salar L.)
in the Northwest Atlantic. In: Atlantic Salmon: Planning for the
Future (ed. Mills D), pp. 483–511. Croom Helm, Kent, UK.
Reddin DG, Hansen LP, Bakkestuen V et al. (2012) Distribution
and biological characteristics of Atlantic salmon (Salmo salar)
at Greenland based on the analysis of historical tag recover-
ies. ICES Journal of Marine Science, 69, 1589–1597.Robertson MJ, Weir LK, Dempson JB (2013) Population viabil-
ity analysis for the South Newfoundland Atlantic Salmon
(Salmo salar) designatable unit. DFO Can. Sci. Advis. Sec. Res.
Doc., pp. 26.
Rosenberg MS (2001) PASSAGE. Pattern Analysis, Spatial Statis-
tics, and Geographic Exegesis. Department of Biology, Arizona
State University, Tempe, Arizona.
Rosenberg NA (2004) Distruct: a program for the graphical dis-
play of population structure. Molecular Ecology Notes, 4, 137–138.
Schindler DE, Hilborn R, Chasco B et al. (2010) Population
diversity and the portfolio effect in an exploited species. Na-
ture (London), 465, 609–612.Slettan A, Olsaker I, Lie Ø (1995) Atlantic salmon, Salmo salar,
microsatellites at the SSOSL25, SSOSL85, SSOSL311,
SSOSL417 loci. Animal Genetics, 26, 281–282.Stabell OB (1984) Homing and olfaction in salmonids: a critical
review with special reference to the Atlantic salmon. Biologi-
cal Reviews, 59, 333.
Thorstad EB, Whoriskey F, Rikardsen AH, Aarestrup K (2010)
Aquatic nomads: the life and migrations of the Atlantic sal-
mon. In: Atlantic Salmon Ecology (eds Aas Ø, Einum S,
Klemetsen A, Skurdal J), pp. 1–32. Wiley-Blackwell, Oxford.
V€ah€a J-P, Erkinaro J, Niemel€a E et al. (2011) Temporally stable
population-specific differences in run timing of one-sea-
winter Atlantic salmon returning to a large river system.
Evolutionary Applications, 4, 39–53.
© 2015 John Wiley & Sons Ltd
COMPLEX SPATIAL STRUCTURE IN ATLANTIC SALMON 5143
Verspoor E (2005) Regional differentiation of North American
Atlantic salmon at allozyme loci. Journal of Fish Biology, 67,
80–103.Verspoor E, O’Sullivan M, Arnold AL, Knox D, Amiro PG (2002)
Restricted matrilineal gene flow and regional differentiation
among Atlantic salmon (Salmo salar L.) populations within the
Bay of Fundy, eastern Canada. Heredity, 89, 465–472.Verspoor E, Beardmore JA, Consuegra S et al. (2005) Popula-
tion structure in the Atlantic salmon: insights from 40 years
of research into genetic protein variation. Journal of Fish Biol-
ogy, 67, 3–54.Verspoor E, McGinnity P, Bradbury I, Glebe B (2015) The
potential direct and indirect genetic consequences for native
Newfoundland Atlantic Salmon from interbreeding with
European-origin farm escapes. DFO Canadian Science Advisory
Secretariat, 2015/030, viii + 36.
Waples RS (1995) Evolutionarily significant units and the con-
servation of biological diversity under the Endangered Spe-
cies Act. American Fisheries Society Symposium, 17, 8–27.Wares JP, Cunningham CW (2001) Phylogeography and histor-
ical ecology of the North Atlantic intertidal. Evolution, 55,
2455–2469.
I.R.B. designed, and supervised the study and per-
formed most of the analyses and wrote the manuscript.
L.C.H. conducted the laboratory analyses including the
microsatellite genotyping and participated in writing.
B.D., M.J.R., V.B., L.B. and E.V. provided samples or
existing data, and assisted with analysis interpretation
and writing.
Data accessibility
DNA sequences: All raw sequence data have been
uploaded to NCBI SRA. Bioproject # PRJNA291587,
Biosample #s SAMN04054010-SAMN04054188, SAMN0
4053806-SAMN04053964, SAMN04090079-SAMN040900
93. The SNP array, RAD-seq and microsatellite geno-
types used in this study, and all distance matrices have
been deposited in Dryad at http://dx.doi.org/10.5061/
dryad.7tv21. All corresponding sample codes and loca-
tions are in Table 1 and Fig. 1, respectively.
Supporting information
Additional supporting information may be found in the online ver-
sion of this article.
Fig. S1 Genomic distribution of differentiation between the east
and west groups of Atlantic Salmon populations in southern
Newfoundland.
Fig. S2 Distribution of mtDNA alleles diagnostic for European
lineage both in (A) Newfoundland and worldwide (B).
Table S1 Results of RAD-seq analysis and various filtering
steps.
5144 I . R . BRADBURY ET AL.
© 2015 John Wiley & Sons Ltd