training on adjusted macroeconomic indicators 4 policy .... policy... · identifying the fiscal...
TRANSCRIPT

I-WAVES 4 – Policy March 2018 1WAVES © 2014
Wealth Accounting and the Valuation of Ecosystem Services
www.wavespartnership.org
Training on Adjusted Macroeconomic Indicators – 4Policy Implications
Keith Jefferis - Econsult Botswana

I-WAVES 4 – Policy March 2018 2WAVES © 2014
WAVES Training on Macro-economic Indicators
1. Adjusted macroeconomic and wealth indicators
2. Calculating ANNI and ANS
3. Comprehensive wealth
4. Practical & Policy Implications
1. Policy Indicators
2. Next steps

I-WAVES 4 – Policy March 2018 3WAVES © 2014
Policy-related indicators
Indicators to add to sustainable development monitoring framework
Adjusted Net National Income
Carry out annual calculations
Compare real growth rate with GDP/GNI growth
Interpretation: if ANNI growth is lower, some GDP/GNI
growth is arising from resource depletion
Compare ANNI with final consumption expenditure
Interpretation: if the gap between the two is negative and
widening, then consumption is being maintained by
consuming capital, which is unsustainable. If ANNI > FCE,
than saving is taking place (linked to +ve ANS).

I-WAVES 4 – Policy March 2018 4WAVES © 2014
Policy-related indicators: ANNI & FCE
0
1,000,000
2,000,000
3,000,000
4,000,000
5,000,000
6,000,000
7,000,000
8,000,000
19
98
1999
2000
2001
2002
2003
2004
2005
2006
2007
20
08
20
09
2010
2011
2012
2013
2014
2015re
al ID
R b
illi
on
(co
nsta
nt
2010)
ANNI FCE

I-WAVES 4 – Policy March 2018 5WAVES © 2014
Policy-related indicators
Adjusted National Savings
This is the key flow indicator.
Can be calculated annually (in absolute terms and as % of GNI)
(albeit with a lag due to some data delays).
ANS is the key indicator that indicates whether a country’s growth
is on a sustainable path.
Is ANS positive or negative?
If ANS is negative, consumption is arising from asset depletion (and
in the long term will be unsustainable)
If ANS is positive, national wealth is being accumulated (and
consumption is sustainable).
If ANS is positive but declining as a share of GNI, then there may
be a warning sign of an unsustainable trend (a continued decline
would eventually lead ANS to turn negative).

I-WAVES 4 – Policy March 2018 6WAVES © 2014
Policy-related indicators
Measures of Comprehensive Wealth:• Total wealth (in real terms);
• Total real wealth per capita
• Total wealth (as % of GNI)
CW has an advantage over ANS in that it includes a wider range of assets
But some of the inputs to CW may not be available annually, so it may not
be possible to update CW each year (unlike ANNI and ANS).
So CW is more of a medium-long term indicator. ANS is the key short-term
indicator, as it is available annually.

I-WAVES 4 – Policy March 2018 7WAVES © 2014
Policy-related indicators
Measures of Comprehensive Wealth: Interpretation:
CW per capita: It should be a policy objective to increase real
wealth per capita. There is a clear relationship between wealth
per capita and real incomes. This requires that real ANS grows
faster than the population.
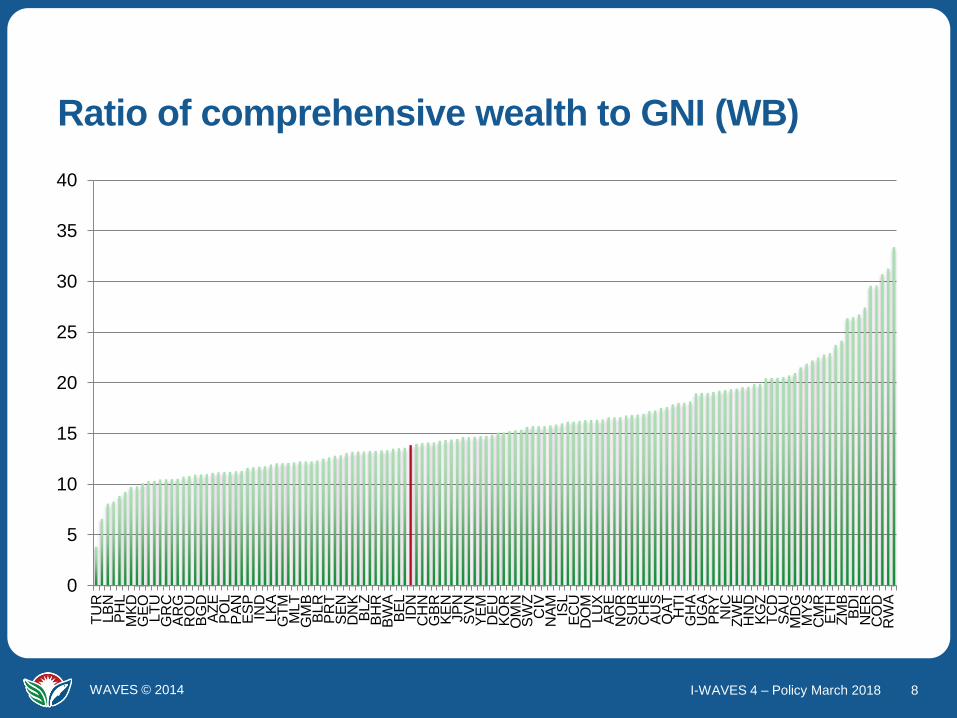
CW as % of GNI: the level of this indicator is not in itself crucial – a
high level may indicate high CW, or low GNI. It may also just
reflect the structure of an economy (e.g. resource-based or not).
For relatively low income countries, the expectation is that the
long-term trend will be downwards (i.e. GNI is rising faster than
wealth, which indicates increasing productivity).
I-WAVES 4 – Policy March 2018 8WAVES © 2014
Ratio of comprehensive wealth to GNI (WB)
0
5
10
15
20
25
30
35
40
TU
RL
BN
PH
LM
KD
GE
OLT
UG
RC
AR
GR
OU
BG
DA
ZE
PO
LP
AN
ES
PIN
DL
KA
GT
MM
LT
GM
BB
LR
PR
TS
EN
DN
KB
LZ
BH
RB
WA
BE
LID
NC
HN
GB
RK
EN
JP
NS
VN
YE
MD
EU
KO
RO
MN
SW
ZC
IVN
AM
ISL
EC
UD
OM
LU
XA
RE
NO
RS
UR
CH
EA
US
QA
TH
TI
GH
AU
GA
PR
YN
ICZ
WE
HN
DK
GZ
TC
DS
AU
MD
GM
YS
CM
RE
TH
ZM
BB
DI
NE
RC
OD
RW
A

I-WAVES 4 – Policy March 2018 9WAVES © 2014
Policy-related indicators
Measures of Comprehensive Wealth: Interpretation:
Resource economies: It is particularly important in resource
economies (minerals, energy) that CW is not depleted –
i.e. mineral/energy assets must be replaced by
produced/human K as they are run down.
Composition of comprehensive wealth: the general
expectation is that the share of Human K will increase over
time (i.e. human K will grow faster than other assets); there
is no target, but if this is not happening there needs to be
an explanation (which could be a data issue);

I-WAVES 4 – Policy March 2018 10WAVES © 2014
Summary of key indicators
Variable Measure
Adjusted net savings ANS (real)
ANS (% of GNI)
ANS (real, per capita)
Adjusted net national income ANNI (real)
ANNI (real, growth)
ANNI (% of GNI)
ANNI (% of FCE)
Comprehensive wealth Total, real
Total, real per capita
Total, % of GNI
% contribution from different sources
I-WAVES 4 – Policy March 2018 11WAVES © 2014
Natural Capital Accounts and Fiscal Policy
NCA can contribute to fiscal policy in two ways:
Identifying the fiscal potential of natural capital, e.g. mining
specific taxation
Utilising fiscal policy to change incentives and behaviour (e.g.
imposing taxes to compensate for externalities), and raise
funds for compensation for environmental damage
I-WAVES 4 – Policy March 2018 12WAVES © 2014
Illustration: Using mineral accounts to assess effectiveness of mining taxation
Mineral rents
represent the surplus value of mineral revenues over the
costs of production
the true value of the unmined natural resource
some countries treat this as a “national” resource that should
be taxed highly to ensure that the value of this resource
flows back to the nation (rather than flowing to private
owners) [note that this still leaves sufficient profits in the
hands of private owners of mineral resources]
we can evaluate how effectively minerals taxation
appropriates mineral rents
I-WAVES 4 – Policy March 2018 13WAVES © 2014
Using NCA to promote sustainability in a mineral economy
Three fiscal (public finance) policy challenges:
1. TAXATION: Design a taxation system that appropriates
mineral rents to the nation, while leaving the owners of
factors of production with a return for inputs, including a
reward for risk
2. SPENDING: Ensure that mineral revenues are spent on
asset accumulation (investment) and not consumption
(fiscal rules)
3. INVESTMENT: Ensure that investment is productive
(generation of income to replace minerals in future)

I-WAVES 4 – Policy March 2018 14WAVES © 2014
Fiscal Policy: Expenditure & Savings
Key decisions:
• How much to invest and how much to consume?
• (Hartwick rule says proceeds of taxation of rents – i.e.
resource depletion - should all be reinvested)
• How to divide investment between types of assets:
• Physical assets
• Human capital (education)
• Financial assets
• How to manage government’s financial assets?
• Sovereign Wealth Funds
• Domestic / offshore mix
I-WAVES 4 – Policy March 2018 15WAVES © 2014
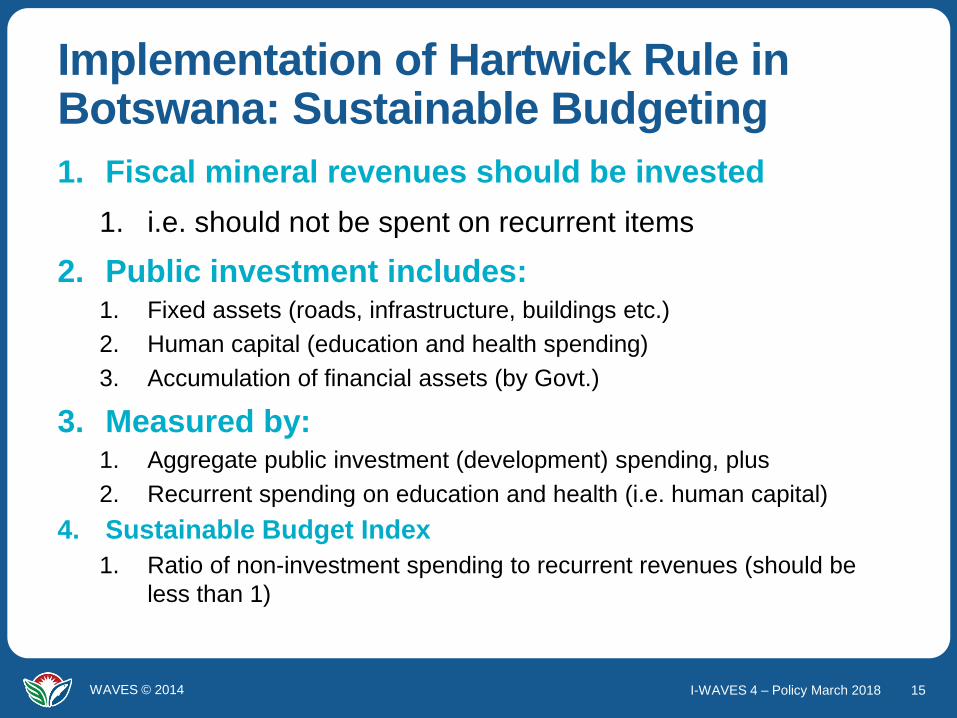
Implementation of Hartwick Rule in Botswana: Sustainable Budgeting
1. Fiscal mineral revenues should be invested
1. i.e. should not be spent on recurrent items
2. Public investment includes:1. Fixed assets (roads, infrastructure, buildings etc.)
2. Human capital (education and health spending)
3. Accumulation of financial assets (by Govt.)
3. Measured by:1. Aggregate public investment (development) spending, plus
2. Recurrent spending on education and health (i.e. human capital)
4. Sustainable Budget Index
1. Ratio of non-investment spending to recurrent revenues (should be
less than 1)

I-WAVES 4 – Policy March 2018 16WAVES © 2014
Mineral rents and fiscal policy – how well did Botswana do?
0
5,000
10,000
15,000
20,000
25,000
Min
era
l re
nts
, re
ven
ues (
real,
2012 p
ric
es,
P m
illi
on
)
Mineral rents Mineral revenues
Mineral revenues
have tracked
rents well
On average, 95%
of rents collected
as fiscal
revenues from
1983-2014

I-WAVES 4 – Policy March 2018 17WAVES © 2014
Monitoring Spending: Sustainable Budget Index (SBI)
Sustainable Budget Index
• Ratio of non-investment (recurrent) spending to recurrent revenues
• If < 1, budget is sustainable
• Mineral revenues not being used to finance recurrent
spending
• Mineral revenues being used to finance investment
(accumulation of assets)
• Implementation of the Hartwick Rule
• Largely observed in practice, despite being a policy rule not a statutory rule

I-WAVES 4 – Policy March 2018 18WAVES © 2014
Sustainable Budget Index
0.0
0.2
0.4
0.6
0.8
1.0
1.2
1.4

I-WAVES 4 – Policy March 2018 19WAVES © 2014
How have mineral revenues been spent?
0
100
200
300
400
500
0
100
200
300
400
500
P M
illi
on
, re
al, 2
012 p
rices
Education Health Other investment Mineral revenue

I-WAVES 4 – Policy March 2018 20WAVES © 2014
Illustration: Using Energy Accounts to support carbon taxation in South Africa
SA: major emitter of CO2 (13th largest in world)
Government policy to reduce emissions, by imposing a carbon tax to penalise CO2 emissions
Energy accounts enabled the govt to establish which sectors were major emitters of carbon, and which were the most carbon-intensive in their use of inputs
Provided inputs to macroeconomic modelling to determine the impact of a proposed carbon tax on different economic sectors, employment levels, exports etc.
Draft Carbon Tax Bill released for public comment in December 2017

I-WAVES 4 – Policy March 2018 21WAVES © 2014
Next Steps
We have covered the principles of calculating a range of adjusted macroeconomic indicators
We have focused on principles, calculations and data
sources
Further work is needed to develop and refine domestic data
sources for key indicators, to reduce reliance on external
measures

I-WAVES 4 – Policy March 2018 22WAVES © 2014
Refinement of indicators –Comprehensive Wealth
Produced capital
Identify service lives that are appropriate for Indonesia
Prepare fixed capital data for different asset classes,
reflecting GFCF categories in the NA
Include IP as an asset class
I-WAVES 4 – Policy March 2018 23WAVES © 2014
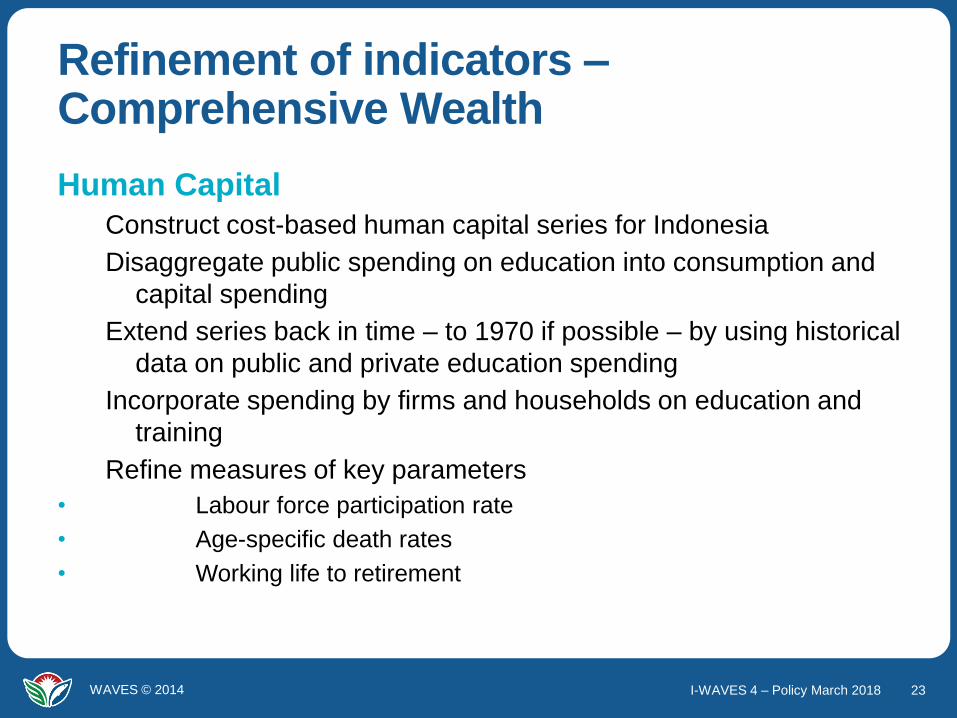
Refinement of indicators –Comprehensive Wealth
Human Capital
Construct cost-based human capital series for Indonesia
Disaggregate public spending on education into consumption and
capital spending
Extend series back in time – to 1970 if possible – by using historical
data on public and private education spending
Incorporate spending by firms and households on education and
training
Refine measures of key parameters
• Labour force participation rate
• Age-specific death rates
• Working life to retirement

I-WAVES 4 – Policy March 2018 24WAVES © 2014
Refinement of indicators –Comprehensive Wealth
Mineral Accounts
Refine calculation of mineral asset values
• Choice of discount rates
• Moving averages of rents
Investigate further the reasons for difference between
domestic and WB figures for mineral asset values

I-WAVES 4 – Policy March 2018 25WAVES © 2014
Refinement of indicators – ANNI and ANS
ANNI/ANS
Use domestic sources of mineral and energy depletion data
Develop domestic data sources for pollution, CO2,
Extend to include typhoon damage?
Extend to include impact of external pollution?
ANS
Include private expenditure on education (households, firms)

I-WAVES 4 – Policy March 2018 26WAVES © 2014WAVES © 2014
THANK YOU!
Econsult Botswana [email protected]