trained and why - nias repositoryeprints.nias.res.in/142/1/ias-nias-report.pdfthis study on...
TRANSCRIPT


TRAINED SCIENTIFIC WOMEN POWER:HOW MUCH ARE WE LOSING AND WHY?
April 2010
IAS–NIAS Research Report


TRAINED SCIENTIFIC WOMEN POWER:HOW MUCH ARE WE LOSING AND WHY?
Anitha Kurup2*, Maithreyi R1,2, Kantharaju B1,2 and Rohini Godbole1
April 2010
IAS–NIAS Research Report
National Institute of Advanced Studies
* Corresponding Author email: [email protected] Indian Academy of Sciences, Bangalore
2 National Institute of Advanced Studies, Bangalore
Indian Academy of Sciences

Conceptualised byAnitha Kurup
Pratima Sinha
Rohini Godbole
Shobona Sharma
Vineeta Bal
AdvisorsKaruna Chanana
N.S.Anuradha

This study on “Trained Scientific Women Power:How Much are we Losing and Why?” is a uniqueinitiative in terms of the nature of the study and thepersons involved. The study is the collaborative effortof a team of social scientists and natural scientistsemploying both quantitative and qualitative methods.The survey was the outcome of discussions of agroup of scientists consisting of Prof. Vineeta Bal(National Institute of Immunology, New Delhi), Prof.Rohini Godbole (Indian Institute of Science,Bangalore), Dr Anitha Kurup (National Institute ofAdvanced Studies, Bangalore), Prof. Shobona Sharma(Tata Institute of Fundamental Research, Mumbai)and Prof. Pratima Sinha (Bose Institute, Kolkata). Indiscussions with the then Academy President andNIAS Director, Dr K. Kasturirangan, it was envisagedthat this could be a collaborative project. Further,when presented to the Council of Indian Academyof Sciences, the Council of the Academy, under thepresidentship of Prof. T. V. Ramakrishnan, supportedthe idea that the survey be taken up as an initiativeof the WiS Panel of the Academy. From its initialconceptualization till the final stages of completion,valuable contributions were made by several peoplein different roles and capacities. We hereby sincerelyacknowledge all their contributions.
First and foremost, we would like to acknowledgethe enthusiastic support of both, Dr K. Kasturirangan,Member of the Planning Commission and FormerDirector of National Institute of Advanced Studies(NIAS) and Prof. T. V. Ramakrishnan and Prof. D.Balasubramanian, former Presidents of IndianAcademy of Sciences. We would like to convey ourthanks to Prof. V. S. Ramamurthy, present Directorof NIAS and Prof. Ajay K. Sood, President of IndianAcademy of Sciences, for their continued supportand guidance.
Prof. Vineeta Bal, Prof. Shobona Sharma and Prof.Pratima Sinha, members of the core team mentionedabove, made important contributions in steering theproject forward, providing inputs as well as keycontacts. We express our gratitude to them for theirsupport.
Prof. Karuna Chanana (Jawaharlal Nehru University,New Delhi) and Dr N.S. Anuradha (Indian Institute
of Science, Bangalore) were advisors and mentorsto the project team. Their valuable inputs, commentsand review of our work helped strengthen and refineit and enabled us achieve a greater standard. Theirparticular contributions from the sociologicalperspective to the study of a critical problem amongthe scientists needs a special mention. We thankthem sincerely for their constant support andguidance without which the project would not haveachieved this final form.
We extend our gratitude to Ms. Divya Sarma, andMs. Moumita Bhattacharya, former researchassociates, who have worked tirelessly during theinitial stages of identification of institutions andfinding important contact points for the study. Theyregistered several participants for the database andsurvey and contributed to the initial phases ofquestionnaire development. We thank them for theirdedicated efforts during the take-off phase of theproject.
The actual survey was preceded by the creation of alarge database of men and women scientists. Thesubjects for the survey were chosen from amongthis database. The creation and management of thisdatabase would have been impossible without thehelp of Mr. Poobalan D, who designed it, and Ms.Anitha M.K., who was responsible for the efficientmanagement of the database. We extend ourheartfelt thanks to them for their help. We wouldalso like to acknowledge Mr. Janardhan’s contributiontowards the development of an online version of thequestionnaire. Our many thanks to Mr. Raja P.K. forthe creation of an online PDF version of the men’squestionnaires which was a useful tool in obtainingresponses from several men scientists who wereunable to spare time for a 45 minute telephonic orpersonal interview.
Several field investigators across the countryprovided us immense support in canvassing thequestionnaires across the different parts of thecountry. They include Ms. Sudha T. and Ms.Madhumati Thangannam at Chennai; Ms. SaritaKulkarni at Pune, Ms. Kavita Joshi, Ms. GayathriSunadaram, Ms. Bhanu B.S., Ms. Deepa H., Ms.Zohara Jabeen, and Ms. Padma V. from Bangalore;
ACKNOWLEDGEMENTS

Ms. Karuna Shrivastava, Ms. Preeti Shrivastava andMs. Ruchi Shrivastava from New Delhi. Dr. NilimaSrivastava, Reader, IGNOU (New Delhi) has playeda critical role in locating the field investigators atDelhi, training them and supervising and coordinatingthe work at Delhi despite her busy schedule. We aregrateful to her for her help and time. Despite herseniority, Ms. Vijaya Chauhan, an independentconsultant, personally canvassed severalquestionnaires at Mumbai and was an inspiration tothe team. We thank her for willingly donning therole of a field investigator and contributing vitally tothe survey.
The crux of the survey is based on the analysis ofthe vast amount of data collected for approximately100 questions from each of over 700 participants.Handling and understanding of such data requiredexpert advice which we readily received from Dr.Lalitha Sundaresan, Visiting Professor (NIAS) andProf. N. V. Joshi (IISc). Dr. Lalitha has constantly
given us her time, suggestions and feedback andprovided us with fresh perspectives to look at thedata.
We thank Mr. Madhavan, former Executive Secretary,Indian Academy of Sciences and Mr. Chandramohan,Executive Secretary, Indian Academy of Sciences,and other staff of the Academy, for theiradministrative support that helped the smoothrunning and completion of this study.
Last but not the least, we extend our heart-felt thanksto the Administrative team at NIAS who have beensupportive throughout and whose efficiency hashelped us complete the project successfully, withoutencountering any major hurdles.
To this vast team we are indebted and we sincerelyacknowledge each of their individual contributionsto the successful completion of the project.

CONTENTS
1. EXECUTIVE SUMMARY 9
2. INTRODUCTION 17
3. METHODOLOGY 19
4. ANALYSIS 23
5. SUMMARY AND RECOMMENDATIONS 51
6. REFERENCES 58
7. APPENDICES 59

8

9
The study “Trained Scientific Women Power: HowMuch Are We Losing and Why?” was conducted tounderstand the reasons for the loss of trained womenscientists and to identify strategies and provisionsto retain them in Science.
The survey was conducted across India with 568women scientists and 226 men scientists who had aPhD in Science, Engineering or Medicine. The surveycovered women and men who were currentlyengaged in scientific research and teaching, engagedin jobs other than scientific research and teachingand even those who were currently not employed.The survey covered over 100 questions on personaland family characteristics, educational background,employment details, organizational atmosphere andresearch and productivity factors. The main findingsof the study and the recommendations drawn fromit are given below:
SUMMARY AND RECOMMENDATIONS
Women Scientists: Women in ScienceResearch(WIR), Women not in ScienceResearch (WNR), and Women not Working(WNW)
The complexity of developing interventions to retainwomen in Science stems from the diversity in thecharacteristics of women scientists across thedifferent sub-groups of women in Science. Thedifferences also, perhaps, stem from the differentpriorities the groups have because even with severalcommonalities among demographic profiles of thewomen, differences on important aspects such asprofessional prospects vs. childcare or familyresponsibilities are seen.
An analysis of sample details reveals that while amajority of all the three sub-groups of women weremarried, the highest percentage of WIR were‘never married’ (14.1 per cent). Women who were‘never married’ are distributed across all agecohorts. A majority of the three sub-groups alsoreported having children who were over 15 years.However more WNW across all age groups hadyounger children (between 0-5 years) comparedto the other two groups.
A majority of the women also reported living innuclear families. A significantly higher percentageof WNW reported having received no help with
childcare. Thus for WNW, the absence of supporteither by choice or compulsion could perhaps bean important reason for their dropping out ofScience. In contrast, WIR and WNR reportedreceiving help from a combination of agencies liketheir parental family, marital family andprofessional help.
Interestingly, a significantly higher proportion ofWNW also have had spouses in the same field ororganization, and this could have been anothermajor factor contributing to their dropping out.
With respect to organizational details, professionaladvantages and opportunities and getting jobshave been the main factors influencing jobselection. A majority of the responses from allgroups indicated not getting jobs as theprimary reason for not taking up postsapplied to. While more WIR and WNR haveindicated better professional prospects asreasons for not taking up the posts, none of theresponses from WNW indicated this reason.
With regard to leaving previous jobs, betterprofessional prospects have been the mostimportant consideration for WIR and WNR,while the temporary nature of the post hasbeen the reason most often stated by theWNW. Family reasons have also been reportedas the an important factor by WNW for leavingjobs.
WIR and WNR also significantly differed withrespect to reasons for accepting present post. Agreater proportion of WIR have reportedprofessional advantages as reason fortaking up the post, while for other reasonssuch as lack of other suitable options,freedom and autonomy in work,permanency of position, etc has figured asan important reason.
In terms of working hours, both WIR andWNR have reported working between 40-60 hours per week on an average. However,a higher per cent of WIR have reported workingfor 60 hours or more per week compared to WNR,while a greater per cent of WNR have reportedworking between 20-40 hours per week comparedto WIR.
EXECUTIVE SUMMARY

10
With respect to breaks in career, there is asignificant difference in the reasons reported bythe sub-groups. While childcare and elder carehave been important reasons for all three groups,more WIR have reported other familyfactors such as marriage, husband’s orfather’s transfer as significant reasons;more WNR have reported further studies,health reasons or non-availability offellowship due to age limits; while WNWhave reported difficulties in finding jobs andinstitutions as a significant factors forbreaks in career.
Having noted that there are differences betweenthe three groups of women scientists with respectto reasons for not taking up jobs, or leaving jobs,as well as reasons for breaks, it is hardly surprisingto note the significant differences between thegroups with respect to the provisions consideredimportant by them to retain women in Sciencecareers. While all three groups haveconsidered flexibility in timings to be themost important provision, they differ withrespect to other useful provisions. For WIR,who continue to juggle between scientificresearch and teaching careers on the onehand, and family responsibilities on theother, provisions for transportation andaccommodation are important. For WNR,better HR policies have been reported asimportant provisions to retain women inScience. For the third group of WNW,childcare facilities at the workplace arereported as important.
Summary of Women in ScienceResearch(WIR) and Men in Science Research(MIR) :
The analysis of the educational, work and researchprofiles of women and men in research is importantto identify factors that differentiate between womenand men differ, and subsequently contribute to theiradvancement or dropping out from Science.
The data analysis reveals the following:
Sample details have shown that while 14 per centof WIR were ‘never married’, only 2.5 per centMIR report being ‘never married’. In comparisonto 39 per cent women who reported that theirspouses were doctorates and 40 per cent whoreported that their spouses were in Science, only16 per cent men reported that their spouses weredoctorates and 19 per cent reported that theirspouses were in Science.
86 per cent men scientists compared to 74 percent women scientists reported having children.A higher proportion of WIR spent between40-60 hours per week at work compared toMIR; while a higher percentage of MIRreported spending less than 40 hours perweek at work compared to WIR when theirchildren were growing up.
With respect to employment and organizationalfactors, it was observed that a significantly higherproportion of women (46.8 per cent) comparedto men (33.5 per cent) reported workingbetween 40-60 hours per week. More menreported working less than 40 hours perweek compared to women.
For both women and men, getting jobs andprofessional advantages and opportunities havebeen important reasons in determining present andprevious jobs. More men compared to women havereported leaving previous posts for betterprospects. For men and women approximatelyequal proportion of responses were reportedindicating family as an important factor in takingup present posts. However, the proportion ofresponses reported by women indicatingorganizational factors such as flexible timings, daycare facilities, transportation and accommodation,etc for taking present posts is higher compared tothe responses from they men scientists. Theimportance of organizational provisions to helpwomen balance careers and domesticresponsibilities have been highlighted by this data.
Men and women differ significantly with respectto breaks in career also. A significantly lowerproportion of men have reported breaks in careercompared to women. While personal factors suchas health, further studies and voluntary retirementhave led to breaks for men, for women, domesticresponsibilities of childcare and care for elders havebeen the primary reason for the breaks in career.
Perceptions regarding why women drop out ofScience also differed between the groups. Whilehigher responses from men have indicated familyand socio-cultural factors, women have perceivedorganizational factors such as lack of flexibility intimings, lack of role models and mentors,discouraging and uncongenial atmosphere, etc tobe responsible for women dropping out fromScience.
Men and women differed with respect to theprovisions that have been considered importantto retain women in Science. While a majority of

11
WIR and MIR have reported flexibility intimings as an important provision, a largerpercentage of responses by MIR indicatedthe need for refresher courses, fellowships,awareness and sensitization campaigns toretain women in Science. In contrast,women perceive provisions such asaccommodation and transportation asprovisions that would help them balancetheir career and family. Since most scientificorganizations have a greater proportion of mencompared to women, especially on decision-making posts, the differences in understanding ofthe problem between men and women could haveimportant implications. Provisions that aredesigned without taking into account theexperiences of both, women and men, who arepart of this work space will not yield the desiredresults. Thus, it may be important to considerthe view points of gender sensitive menscientists along with gender sensitivewomen scientists who have a nuancedunderstanding of the complex functioningof S&T organizations. It must be emphasizedthat the S&T organizations in our country are variedand hence experiences of one organization cannotrepresent the other. Sociological studies of S&Torganizations with a democratic multidisciplinary team will go a long way toprovide useful insights that will help thecountry frame policies that can retain thetalent pool of both women and men.Excluding the experiences of women in Sciencecan lead to inadequate provisions. Thus, it isimportant that more women are representedon committees and decision making poststo influence the policies that can beconducive to women.
RECOMMENDATIONS
The primary purpose of the study was to develop acomprehensive set of recommendations and policydirections that are evidence-based and that wouldmotivate and retain women in Science research.Various bodies have dealt with this issue andformulated recommendations based on data and/orgroup discussions, meetings and suggestions as wellas feedback from various women scientists. Someof these recommendations are available in reportssuch as:
(1) ‘Science career for Indian women: Anexamination of Indian women’s access to andretention in scientific careers’ (October 2004) byIndian National Science Academy (INSA). (2)‘Women in Physics in India’ by Rohini Godbole,Neelima Gupte, Pratibha Jolly, Shobhana Narasimhanand Sumathi Rao presented at the Second IUPAPConference on Women in Physics held at Rio deJaneiro, Brazil between May 23-25, 2005. (3)‘Evaluating and enhancing women’s participation inscientific and technological research: The IndianInitiatives’ (January 2010) by National Task Forcefor Women, Department of Science & Technology,Government of India.Interestingly many of the recommendationsmentioned in the above reports find resonance withthe recommendations of this report. However, sincethis study for the first time has included sub- groupsof women scientists and men scientists that werenot covered by the earlier reports, several differentand nuanced recommendations have emerged fromthis study.
The recommendations have been developed throughinteractions with a wide range of women and menscientists from different parts of the country. Whilethe purview of the survey covered only those with aPhD in Science, Engineering or Medicine, adequatecare was taken to represent members from a rangeof scientific organizational settings like autonomousinstitutions, research organizations, universities andcolleges, industries that are government owned andprivate sectors. For the first time, this study hascovered women scientists who may not be currentlyemployed as well as men scientists. The dataconvincingly revealed that the groups were nothomogenous and the diverse experiences of the sub-groups of women scientists and men scientists hasvitally informed our recommendations. Thus, themyth of ‘one size fits all’ accepted by Sciencepolicy makers has been questioned throughthis study and an attempt was made to representthe many different voices and needs that Sciencepolicy makers have to respond to if there is to be aserious engagement with the central question ofattracting and retaining women in Science.
Integral to retaining women in Science is acquiringinformation on the number of women PhDs inScience. An important move in this direction will beto build on the existing database created by the IASon a mission mode by assigning dedicated staff andtargeting completion of a comprehensive databasewithin one year’s time. It will also be important to

12
dedicate resources to the continual maintenance andup-gradation of the database to reflect currentinformation and trends. Since women and also menwho have dropped out of Science are difficult tolocate, media drives and campaigns throughtelevision and newspapers wil l have to beundertaken.
Important headway can be made byaddressing organizational and infrastructuralfacilities as well as undertaking policychanges that may be critical to attract andretain women in Science research. Suchchanges need to move beyond the traditionalframework that locates societal and familyresponsibilities as singular factors responsiblefor women dropping out of Science.
The data has importantly revealed close to 85 percent of the women who are pursuing activecareers in research have competently and invery different ways balanced families andcareers. Among those in scientific researchapproximately 14% per cent have reportedbeing ‘never married’ and are distributedacross all disciplines. Among the largest majorityof those married, never married, with or withoutchildren, family and societal pressures havebeen a small but significant factor reportedfor not taking up the job . Even among thosewho are currently not working, the correspondingfigure is only 3.3% indicating that family andsocietal pressures cannot explain completelywhy women drop out of Science.
These facts are important indicators ofwomen’s commitment to pursue scientificresearch. Institutional support through‘gender-neutral’ facilities and policies will bevital in attracting and retaining women inScience. These policies in turn will have a spin-off effect in redefining ‘gender roles’ at homethat could maximize the productivity ofwomen and men scientists. In essence, thiswill lead to maximizing the productivity of theorganization on the whole.
Gender neutral facilities and policies are alsoimportant to prevent, on the one hand, thestereotyping of gender roles and on the other,the stigmatization of women for privileged orspecial treatment. In the West there has alreadybeen a recognition of the importance of having suchgender-neutral facilities and interestingly many menhave availed its benefits. A caution in this regardwould be however useful. Periodic reviews of the
new policies are essential to make sure thatthey do not work against the interest ofwomen in particular and Science practice ingeneral.
ORGANIZATIONAL / INFRASTRUCTURALPROVISIONS
A. Provisions to manage career andhome: Provisions of on campus housing,transportation1, state of art child care and facilitiesfor care of elderly as well as professionalizeddomestic help should be provided for both womenand men faculty at all S&T organizations. This shouldinclude universities, research organizations andautonomous organizations. These provisions areimportant for scientists to manage their familyresponsibilities. This will release their time andenergy that can be utilized for their scientific researchactivities. Priority accommodation and childcare andeldercare facilities for those with young children andelders would be important.
B. Flexibility in timings: The data revealedthat despite multiple responsibilities, a higherproportion of women scientists in research reportedworking between 40-60 hours per week than menscientists. However flexibility in timings will benefitboth women and men scientists.
It is important to evolve a gender neutral policy offlexible timings in all S&T organizations that allowsone to manage multiple responsibilities. This is notto be construed to mean that scientists would wantto work from home and not spend time in thelaboratories. Rather, it is an indication thatorganizations are willing to introduce policies thatwill allow a greater participation of scientists toengage with research. The policy will have extendedoffice hours which will give a margin of three hoursfor starting and closing work officially. This will meanthat scientists will start their office hours between 7and 10 am and close it respectively between 4-7 pmin the evening. Work can be organized by thescientists so as to use the official timings to interfacewith the administration if necessary and to holdofficial meetings at a time when convenient for allteam members. The quorum required fordepartmental meetings should have an acceptablerepresentation of both genders. The extra timemargin provided could be used productively onresearch.
C. Opportunities for networking andcollaboration: Increasing opportunities fornetworking and collaboration through increased

13
number of travel grants; organizing workshops andconferences dedicated to facilitate collaborations;integrating sessions in conferences and workshopsfor honing networking skills is important and suchmeasures to provide greater opportunities for womenscientists needs attention. In considering applicationsfor conferences and workshops, it is important toensure that there are adequate number ofapplications from both women and men throughactive pursuit2. The selection must take care ofrepresenting members of both groups, even whilespecifying the merit criteria. It would be importantto have a transparent, publicly displayed checklistindicating the requirements for merit based selection,both to encourage more women to apply throughknowledge of these criteria as well to ensuretransparency in the selection procedure.
Mentoring: Mentoring mechanisms and integratingsessions during workshops and conferences toenhance capabilities of women scientists areimportant factors in attracting and retaining womenin Science. As adopted by some corporate, mentoringcan also be encouraged by instituting official policiesthat pair senior and junior colleagues to provide forguidance. Providing incentives for mentoring ofwomen scientists and linking it as an assessmentcriteria on annual reviews and promotional reviewsshould be mandatory.
POLICY CHANGES
D. Policy on transparency in selection andevaluation procedures: All institutions must makeavailable the criteria for selection and promotion ofall faculty. According to literature the availability ofactual selection criteria helps increase the pool ofwomen applicants and builds confidence amongthose who contemplate whether to apply or notbecause of the low success rate for women. Studieson the hiring practices of institutions can providevital clues to the evaluation procedures and qualitiesperceived as desirable for a good candidate. Suchstudies would also help institutions develop a readychecklist to be made available to all candidates duringselection.
E. Policy on Time Bound TargetRecruiting System (TRS): For institutions that donot have adequate representation of women at alllevels starting from students to faculty (includingAssistant Professors, Associate Professors,Professors, Deans, etc), develop a time boundrecruitment target system(TRS). This should bebased on the current representation of women in
the institution as well as age and the size of theinstitution. Make it mandatory for institutionsto review TRS based on outcomes3 rather thanrestricting the policy to mean just providingopportunities or setting up processes.
F. Increase in recruitment of women topremier research institutions: The governmentmust proactively increase the number of womenscientists in premier institutions to break thestereotype that women scientists are best as collegeor university teachers. Increasing the number ofwomen in premier institutions that gets greatervisibility; that have comparatively higher resourcesand better infrastructural facilities, will have a farreaching impact on women wanting to choose ascientific career.
G. Mandatory disclosure of gender break-up of faculty and students across departmentsand levels: It must be mandatory that every S&Torganization, within a time frame, puts up genderdisaggregated data of their employees at every levelstarting from students to the professors and deans.The data must be presented department wise.
H. Mandatory composition of one-thirdwomen members in committees: It must bemandatory that all decision-making committees, likethe search/ selection/hiring committees, committeesthat decide on promotions at all levels as well asother decision-making committees have at least onethird women representation (or work towards itwithin a specific time frame). Efforts to get womenrepresentatives from outside the institution, city andstate must be explored. It would also be importantto make mandatory a rotational system of selectionof women representatives to different institutionalas well as national committees based on merit. Thiswill give opportunities to all women to be a part ofthe decision making process. It will broad base theparticipation of women scientists and hence becomemore representative.
Further as the study data has shown, perceptionsand experiences of different age cohorts of womenin Science are very different. More importantly,the differences in perception of usefulprovisions among the different age groupsindicates the need to balance policy makingand decision making committees withyounger women since they could haveimportant inputs to contribute. The trend ofappointing only senior and retired faculty tosuch important decision making groups needsto be revisited in this context. In other words

14
membership to these committees should notbe monopolized.
I. Introduction of Long-term schemes forre-entry: There is a need for modification ofexisting re-entry schemes to cater to long termworking opportunities for women and men whoreturn to scientific career after a break. Provisionsfor short term schemes, temporary positions and postdoc positions limit the potential attracting andretaining them in scientific research careers. It wouldbe important to ensure complete autonomy for thesescientists by making it mandatory for all governmentsupported institutions or labs to take them onindependent projects. To optimize the use of labfacilities supported by the government, incentivescan be given to these institutions for having takenmore independent researchers on governmentschemes. These scientists can be subjected to areview processes once in five years as done in thecase of scientists who are in tenure track positions.Facilities for these scientists like travel grants, PF,transport facilities, and child care/care of elders mustbe extended. It would be important to ensure to theautonomy of these women (or men) scientists. Thiscan be achieved through the constitution of a localadvisory committee that can guide and review theirwork, rather than linking the fellowship to theidentification of a faculty member at a particularinstitute.
J. Increase in job opportunities: The studyhas highlighted the lack of job opportunities in formalspaces in S&T organizations as a significant factorfor women dropping out of Science. While efforts toincrease job opportunities in S&T organizations mustbe made, it may be useful to create entrepreneurialopportunities in S&T fields that require training atthe highest level through the creation of venturecapital. A support mechanism at the national andstate level needs to be created for such an enterprise.
K. Creation of scientific infrastructurethrough venture capital: Alternatively, additionalinfrastructure and lab facilities to increase jobopportunities in basic Sciences through the creationof venture capital could be explored. This couldincrease the capacity of the formal workspace relatedto S&T.
L. Policy on employment of spouses inthe same organization: The study has revealedthat the largest proportion of women who wereunemployed had spouses who worked in the samefield or organizations. A higher proportion of thisgroup also reported that they had difficulty in finding
jobs as reasons for their breaks. Together, this datahighlights the importance of ensuring thecontinuation or accommodation of spouses in thesame organization or at least within differentorganizations in the same city or town to preventthe loss of trained scientific women power. It shouldbe made mandatory for all S&T organizations to stateit upfront and bring into practice employing coupleswhen found qualified. This is particularly relevantwith respect to small cities and towns whereopportunities for Science research are limited to oneor two institutions. The government agencies mustplay a proactive role in facilitating employment ofthe spouse when the other is transferred to preventthe loss of trained scientific human power.Alternatively, provisions to carry the jobs to othermutually agreed upon institutions at other parts ofthe country, when the spouse is transferred shouldalso be introduced to help women continue theircareer without breaks. Such a provision can begender neutral as it would be helpful for men also torelocate while continuing on the job, when their wivesare transferred.
M. All recommendations need to bereviewed periodically to make sure that stepstaken to attract and retain scientific humanpower (including men) are not detrimental tothe interest of promoting equality.
The recommendations developed here are the firststep towards understanding and addressing theissues of the diverse groups of women in Scienceresearch. Several more research studies is requiredto understand the complex process of women’schoices with respect to careers in Science.
Endnotes:1 In view of security concerns, it is not just enough fororganizations to compensate for travel but provideassured transportation facilities for late working hoursfor both women and men. This provision has alreadybeen adopted by the private sector, particularly IT andITES services which has enabled more women also towork in these sectors.
2 Subject specific databases developed by IAS and NIASas well as the database of DST can be used to send outmails calling for papers/abstracts since information byand large is restricted to premier and well knowninstitutions. Women from smaller institutions may thusnot get such opportunities.
3 Outcomes refer to the actual increase in the number ofwomen employee across all levels and departments.

15

16

17
INTRODUCTION
Table 1: Country-wise Attrition of Women inPhysics from Under-graduate to ProfessionalLevel
Country Under-Graduate Graduate ProfessionalLevel Level Level
India 32 % 20% 11%
UK 20% 19% 9%
France 38% 20% 19%
USA 20% 15% 10%
Source: Adapted from data by Working group on Women in
Physics (IUPAP). http://wgwip.df.uba.ar/
In the Indian context, while there has been a rise inthe numbers of women entering Science andEngineering education there is a steady attrition ofwomen at the progressively higher levels.
Even though one of every four scientists in India is awoman (Sur, 2001)2, the largest pool of them remainat the lower rungs of Science. Even in the BiologicalSciences, which have a higher proportion of women,they are limited at junior faculty positions, wheretheir proportion ranges from 18-33 % (Bal, 2005).
Assumptions and beliefs that women’s growingaccess to education would lead to gender equity inscientific careers have thus proven to be unfounded.
Absence of women in critical numbers in decisionmaking roles and positions continues to be a largeconcern. Even on other measures of awards andrecognition that are considered hallmarks for asuccessful scientific career, women remain highlyunder-represented. Internationally, only 16 of thetotal number of Nobel prizes in Science have beenawarded to women until 2009. The number of womenwho have been elected as Fellows of the RoyalSociety, the Royal Academy of Engineering and theInstitute of Biology in UK are well below 10%. Women comprise 10 per cent of the NationalAcademy of Sciences, USA (Sengers, 2009). The InterAcademy Council (IAC) in its report submitted in 2006also noted that women typically make up less than5 per cent of any Academy’s members. Only 10women have received prestigious national awardsin Science in India such as the Bhatnagar Award orthe Young Scientist Award. Similarly, women’srepresentation on different advisory committees hasbeen less than 15 per cent in India (Bal, 2004).
“….to be liberated woman should feel free to beherself not in rivalry to man but in the context of herown capacity. Women should be more interested,more alive and more active in the affairs of society,not because they are women but because theycomprise half of the human race.”
-Indira Gandhi, Former Prime Minister of India
Science and technology are key inputs to theeconomy. The peculiar problem for Science andtechnology in India, as elsewhere, remains theoptimal performance of women in Science. Womenwho form half of humanity have for long been kepton the fringes of Science and treated as passiverecipients of knowledge rather than generators ofknowledge, innovation and economic change1.
While there has (no doubt) been a growth in thenumber of women entering Science, the gender gapstill remains large, especially with respect toparticipation at higher levels in academic careers,across the world; this phenomena of attrition ofwomen at progressively higher levels has beendescribed as the ‘leaky pipeline’.
For example, as of 2001 women comprised 37 percent of the total number of doctorate holders in theUS, but only 26 per cent of the total PhD holdersemployed in Science and Engineering. Womenoutnumber men in educational institutions with lowersalaries and prestige such as K-12 schools, 2-yearcolleges, junior colleges, and technical institutes butcomprise only 27 per cent of other Science andEngineering jobs (NSF 2007a). In Europe, the HigherEducation Statistics Agency (HESA, 1998) showedthat women are still not succeeding in academiccareers, especially in Science. The percentage ofwomen declines to between 15-20 per cent at thefull professor level (Nature Medicine, 2004). Datacollected by the Working group on Women in Physicsof the International Union of Pure and Applied Physics(IUPAP) from 1990 -2002 shows an attrition ofwomen across countries from the graduate to theprofessional level. (Refer table 1 given below)

18
Thus, across the world large numbers of women withthe highest qualifications are under-utilized in Scienceresearch and academia while only 10% of them entersenior scientific posts. (Greenfield Report, 2002)3.These trends indicate poverty in Science researchdue to lost talent.
Women’s poor participation in academic Sciencecareers has commonly been associated with women’sinherent characteristics and domestic responsibilities.However, in recent times studies such as those byLemoine (1992), Kumar (2001), Basu (1997, as citedin Kumar 2009) and others have revealed nostatistical difference in the productivity of womenand men scientists, in terms of the number of booksand articles published by women and men scientistsand have even shown women’s publications to be inmore prestigious journals when compared withIndian scientists in general. Family studies of menand women scientists have shown many womenchoosing alternate paths to career and family in orderto keep their scientific career on track. Despite thelack of flexibility in timing family life in the Indiancontext for women, several studies have shownwomen to perform competently with respect to theircareers. Studies such as those by Subrahmanyan (ascited in Kumar, 2009), Gupta and Sharma (2002),etc have shown productivity in Science to be thehighest among married women with children, andalso a higher number of publications and rate ofparticipation in conferences for married women.
An interesting finding by Kumar (2009) has shownthat while there was no statistically significantcorrelation found between gender and productivity, there was a statistically significant correlation(r=0.22, p=0.01) between rank and genderindicating that the number of women is lower whenone moves into higher positions in organisations.This perhaps then is a result of the organizationalpractices and the culture of Science. Several studieshave pointed to the role of unfair practices anddiscrimination, inadequate provisions and salariesthat could be potential deterrents for women’scontinuation in Science. Studies at MIT as well as astudy by Gupta and Sharma (2009) in four institutionsof national importance in India have shown poorersupportive facilities for women such as child carefacilities on campus, administrative apathy, lack oforganizational provisions such as separate andsufficient number of washrooms, their poormaintenance and lack of security for women oncampus. Differential salaries for men and womenhave been reported across the world, including forwomen in India (Duraisamy & Duraisamy, 2009).
Formal and informal barriers in the work place suchas unequal standards imposed on women duringselection (Wenneras and Wold, 1997), gender biaseswhich include open admission by professors of notwanting women students due to fear of marriageand their dropping out; lack of social mobilityattributed to them due to social norms; maintenanceof hierarchies through disregard for women’sauthority, etc (Subrahmanyan, as cited in Kumar2009) affect women’s participation in Science. Thus,the culture of Science dominated by patrifocal ideasget translated into ‘micro-inequities’ for women inday-to-day functioning adding to their frustration anddemoralization (Gupta & Sharma, 2009).
Developing Gender-sensitive Policies:
As noted above, there is a conspicuous absence ofwomen from the higher rungs of Science and Scienceresearch, despite the increase in their participationin Science education. Addressing the issue of absenceof women from Science, their higher attrition andmethods for retention, is crucial for any country.Adequate representation of women in Science isimportant to ensure scientific productivity andadequate human resource for scientific enterpriseas well as from the perspective of diversity, toencourage creativity and innovation through theamalgamation of different modes of thinking.
Inclusiveness in Science can only be achieved whenthere is a politically unbiased governance systemset in place that acknowledges these disadvantagesimposed on women while recognizing theircontributions. Institutional awareness and awarenessamong Science-managers, Science publishers andreviewers, and other scientific personnel of theunique challenges for women in Science is essential.Leadership that is sensitive to these underlying biasesthat operate in Science, and is committed to bringingdiversity in Science research and practice can go along way in addressing this situation.
An important consideration should be theheterogeneity among women and development ofnuanced policies, programmes and interventions thatdo not treat women as a homogenous group. (Anithaand Kasturirangan, 2007).
The present study ‘Trained Scientific WomenPower: How Much are we Losing and Why?”is an attempt to bring visibility to the uniquechallenges faced by different groups of women inScience and to understand their experiences andneeds in order to develop meaningful mechanismsof intervention.

19
METHODOLOGY
The aim of the present study, “Trained ScientificWomen Power: How Much are we Losing andWhy?” jointly conducted by the National Instituteof Advanced Studies (NIAS) and the Panel for Womenin Science of the Indian Academy of Sciences was toinvestigate the reasons for poor participation ofwomen with doctorates in Science, Engineering orMedicine, in careers in Science. Specifically, theobjective of the study was to examine the reasonsfor the loss entailed when women who have receivedthe highest level of scientific training gained at thedoctoral level are not engaged in careers that utilizethat training and experience, thus indicating amismatch between their qualif ication andemployment at lower levels of Science. The objectivewas to develop a comprehensive set ofrecommendations, policies, interventions andstrategies in order to check the loss of trainedscientific women power.
A unique strength of the project has been theinvolvement of a team of scientists and socialscientists in order to analyze this problem to developmore holistic and comprehensive policies. Thiscollaboration has ensured that a deeperunderstanding of the processes and milieu ofscientific research and scientific careers can beobtained with the help of the scientists, whilesimultaneously applying the expertise of sociologicalperspectives and wide-range of methodologyavailable to the social scientists who bring theirunique training and perspective to problems relatedto human behaviour and functioning.
Objectives of the Research Study
The specific objectives of the research study wereas follows:
1. To create a database of women scientists with aPhD in Science, Engineering or Medicine;
2. To analyze trends and reasons for the drop-outamong women scientists from a research basedcareer; and
3. To develop a set of comprehensiverecommendations to retain women in Science.
Methodology
Sample: The aim of the project was to obtain apicture of the nation-wide loss of trained scientificwomen power, by sampling a representative numberof scientists and documenting reasons for this lossof human power, so that appropriate interventions,policies and strategies may be framed to check thisloss. It was also planned to sample a proportionatenumber of men scientists on a nation wide basis toallow for a comparative study of the reasons for theloss of scientific personnel.
Based on the objectives of the study, a total of 2369scientists who had completed a PhD in Science,Engineering or Medicine were registered. Of these,1966 were women and 403 were men. Zone-wise,discipline-wise, and category-wise break-up of thescientists registered on the database is given below.
Graph I: Zone-wise Distribution of Database Registrants (Refer Appendix I for the table)

20
Graph IV: Age Wise Distribution of Database Registrants (Refer Appendix I for the table)
Graph II: Discipline-wise Distribution of Database Registrants (Refer Appendix I for the table)
Graph III: Category wise Distribution of Database Registrants (Refer Appendix I for the table)

21
A survey was conducted with a total of 794 of theregistered members (568 women and 226 men)based on voluntary participation and availability ofrespondents. Table 1 gives a break-up of thesurvey respondents by category.
Research Design:
The project was divided into three phases spreadover 3 years (2007-2009). In the first phase, adatabase of women scientists with a PhD in Science,Engineering or Medicine was created with a consciouseffort to represent women scientists from differentcohorts starting from the year 1960 to the present.In order to obtain information about womenscientists several institutions, universities andcolleges across the four zones were contacted. Othercontacts were also obtained by Google searchingfor students and faculty from different institutionsof India. An attempt was made to contact at least10 organizations per zone to ensure that each zonewas adequately represented. However due topractical restrictions such as low number of PhDsand institutes in certain regions, unavailability ofrecords of students and contact details at manyinstitutions, and non-willingness of some scientiststo participate in the study, the actual numbers fromeach zone and across each decade vary.
Members were registered through multiple modes,i.e. personal visits to institutions, over phone orthrough email.
A request was also sent out to registered membersrepeatedly to inform us of their friends oracquaintances with a PhD in Engineering, Scienceor Medicine, particularly to trace women who werecurrently not working, as their details were notavailable in the public domain.
A questionnaire consisting of approximately 100questions (the actual numbers vary for each of thesub-groups of the study) was developed through areview of literature, and through discussions andinputs from various members of the core group. The
Category Women Men
Frequency Percent Frequency Percent
In Science Research 312 54.93 161 71.24
Not in Science Research 182 32.04 64 28.32
Not Working 74 13.03 1 0.44
Total 568 100 226 100
questionnaire was designed to collect bothquantitative as well as qualitative information withrespect to six main topics:
a. Employment details which included present as wellas prior engagements, breaks in career, balanceof professional and personal time, and desire towork in fields related to Science.
b. Educational details including Doctoral and post-graduate courses, supervisor details, educationalenvironment, role models , etc.
c. Organizational climate details for past and presentjobs.
d. Perceived reasons for women and men leavingScience and useful policies to retain them inScience.
e. Research and Productivity factors related toparticipation, collaboration and networking inresearch.
f. Personal details relating to spouse, children andfamily.
The questionnaire was circulated among the coregroup for suggestions. Discussions were held withstatisticians to ensure that the questionnaire wouldbe amenable to analysis and the questionsincorporated were valid. Based on the inputs a pilotquestionnaire was prepared and administered to asmall number of women scientists. Inputs receivedfrom respondents were then incorporated into thequestionnaire and it was finalized and sent for print.
After the creation of a database of women scientistsand development of the questionnaire, the secondphase of the study was begun, while the registrationprocess was simultaneously kept open. In the secondphase, members on the database were contactedand requested to participate in the survey. Memberswere contacted over phone or email and requestedto give appointments as per their convenience. The

22
survey was conducted using one of two modes –personal interview or telephonic interview.
In order to ensure collection of quantitative as wellas qualitative data, the survey was conducted in anopen-ended interview format with a reference set ofpre-coded options developed through a review ofliterature, as well as from inputs from pilot studyrespondents, for every question. Responses to eachquestion were first recorded in the respondent’s ownwords. Then a check was made to see if theresponses fell into the pre-existing codes. If therewas a match, then the appropriate code was noted;else the code for ‘Any other’ was indicated.Respondents were also given the option ofresponding with ‘Not Applicable’ for all questions.Additional information obtained during theconversation with the respondent was also notedverbatim. Each interview approximately took 45minutes to 1 hour.
In the second phase, men scientists were alsocontacted to participate in the study. Registered menscientists were requested to participate in the study,and appointments for the survey were fixed basedon their convenience. Survey with men scientistswere also conducted through the two modesindicated earlier- personal interviews or phoneinterviews. In addition a modifiable PDF version ofthe questionnaire was created and sent to fewmembers who requested an online version of thequestionnaire.
In the third phase of the study, the data obtainedwas entered, checked, cleaned and was analyzed. Acomparison of the frequencies and percentagesbetween the three sub-groups of women - in ScienceResearch(WIR) , Women - not in Science Research(WNR) and Women not Working (WNW) as well ascomparison between men and women scientists weremade.
Operational Definitions:
Women in Science Research (WIR)4: An integralcondition for classification of women scientists in thiscategory was their involvement in long-term, tenuredresearch activities which may also include teachingeither at the postgraduate or undergraduate level.These women scientists may also be engaged inresearch only (including technology based researchin research labs/institutes at universities or inindustries).
Women not in Science Research (WNR): Theclassification of women in this group was developed
to understand the unique experiences of womenemployed in Science, or outside Science, in careersthat may not require or utilize their training at thedoctoral level. Women in teaching only at the under-graduate level, in administrative or managerialpositions, and those on temporary research orteaching positions have been classified under thiscategory.
Women not Working (WNW): Women scientistsclassified under this category are currentlyunemployed, though they may be engaged inactivities and interests of non-occupational nature.
Men in Science Research (MIR): As for Womenin Science Research, men scientists in this categorywere categorized based on their involvement in long-term, tenured research activities which may alsoinclude teaching either at the postgraduate orundergraduate level. These men scientists may beengaged only in research (including technology basedresearch in research labs/institutes at universitiesor in industries).

23
ANALYSISopportunity, or by voluntary choice) that did notdemand training at the doctoral level.
Personal and Family Profile
A total of 312 women were surveyed under the‘Women in Science Research’ category. Theycomposed 54.9 per cent of the total womensurveyed.
A majority of women in these groups belonged tothe South zone followed by the North Zone. Thehighest majority in this group (65.4 per cent) re-ported living currently in cities.
A majority of the group reported belonging to the‘Forward’ castes. The mean age for the WIR groupwas between 40-50 years (Refer Appendix II,table 8 for details).
57.1 per cent of women scientists of this grouphave reported annual family incomes of rupees sixlakhs and above (which included spouse’s, ifmarried). The percentage of WIR reportingthis is higher compared to the other two subgroups, WNR and WNW. (Refer Appendix II,table 10 for details.)
The study ‘Trained Scientific Women Power:How Much are we Losing and Why?’ wasconducted in order to obtain numerical dataregarding the number of women with a PhD. inScience across the decades from 1960s-2009, toanalyze the dropping-out of women from Scienceand to understand the factors responsible for this.The aim was also to see if the reasons for this havediffered over the decades.
The analysis plan was as follows:
1. Calculating frequencies, percentages and cross-tabs for significant variables.
2. Identifying significant differences between sub-groups of women (i.e., In Research, Not inResearch and Not Working) using Chi-squaretests.
3. Analyzing differences between Women in ScienceResearch and Men in Science Research.
PROFILES OF PARTICIPANTS SURVEYED
Category I: Women in Science Research (WIR)
An integral condition for classification of womenscientists surveyed into Category I was theirinvolvement in long-term activities in research whichmay also include teaching either at the postgraduateor undergraduate level. A few women scientists inthis group were engaged in research only in labs/institutes within the industry or in scientificlaboratories in the country (including technologybased research). Another important criteria thatdefined this group was that these women scientistswho had completed their PhDs were in tenuredpositions as against temporary positions indicatinga greater stability in their occupation. Delineation ofthis group from the other two groups was necessaryto understand the unique experiences of women withdoctoral level training who have had careeropportunities to apply the rigorous skills andknowledge developed at the highest level ofeducational training appropriately. Thus ‘Women inScience Research’ was formed to distinguish themfrom other groups of women who, with similar skillsets obtained during the course of doctoral training,were engaged in careers (either due to lack of

24
While 85.9 per cent of WIR (268 women) reportedbeing married, the proportion of women who havereported ‘never being married’ is also higherin this sub group ((14.1 per cent) whencompared to the other two sub groups namelyWNR and WNW.
Note: Slices in shades of blue indicates women who were married(incluing those who may be divorced, separated or widowed. TheSlice in green indicates women who were ‘never married’.
With respect to those who were married 52.6 percent of them reported getting married after post-graduation but before or during doctoralstudies; while 24 per cent reported marriage aftercompletion of doctoral studies. However ahigher proportion of WIR have also reportedmarriage before completion of post-graduation(9.3 per cent) compared to the other two groups.These responses need to be analyzed further tounderstand the nature of support and encouragementthat a majority women in this category have receivedwith respect to taking up further studies from eitheror both parents and families into which they weremarried. It may also be important to explore ifalternative support structures beyond the family wasaccessed to enable them to pursue a career inScience. Thus, the findings go against the usualunderstanding that women drop out of Sciencemainly due to marriage and family responsibilities.Selection of spouse for 32.7 per cent of the groupwas completely parents’ choice, while anapproximately equal number (32.4 per cent) alsoreported it having been a personal choice (ReferAppendix II, table 12 for details).
A majority of women in the group reported havingchildren (74.4 per cent). However theproportion of WIR with children was lessercompared to the other two sub groups (WNR& WNW) (Refer Appendix II, table 13 fordetails). 48.3 per cent* of the responses
indicated that the group on an average had childrenover 15 years. 42.4 per cent* of the responsesby WIR indicate that the group had children aftercompletion of PhD. 76.4 per cent of theresponses from WIR who had children indicated thatthey had taken a minimum maternity break*during child birth; and the proportion of WIRreporting this is higher compared to the other twosub groups (WNR & WNW).
Note: the percentage of responses indicating not applicable includewomen both who do not have children, as well as those who mayhave taken breaks while their children were growing up.
46.8 per cent of WIR reported that they continuedto work between 40-60 hours per week (ReferAppendix II, table 15 for details) when theirchildren were growing up (i.e. time spent at office).With respect to help with childcare*, one in everyfour of the responses by WIR (25.8 per cent)showed them receiving help from their own family.Almost an equal number of responses (23.6 percent) showed them having taken help from paidprofessionals and help from husband’s family(Refer Appendix II, table 16 for details).Although the highest proportion of responsesreporting receiving help with childcare has comefrom this group, it is interesting to note that thenature of assistance is spread almost equally amongthe above three groups namely, parental family,husband’s family and paid professionals indicatingthat there are interesting ways that women copewith balancing their work and home and henceexperiences are varied and cannot be generalized.It is interesting to note that the majority of thewomen with children (72.7 per cent) reported livingin nuclear families. (Majority of the group of 312women also reported living in nuclear families.Details in Appendix II, table 17). Another pointto be noted is that while help is sought from differentquarters, they operate as a nuclear family indicating

25
that living away from the child may not be an optionthat they are comfortable with and hence parents orin-laws move into their house to play the supportiverole.
With respect to qualification of the spouse, 38.8per cent reported that their spouses were doctorateholders and 40.1 per cent reported that theirspouses were engaged in Science research, teachingor consultancy. (Refer Appendix II, tables 18,19 for details)
Employment & Organizational Profile
Of 312 women surveyed, the largest majority (39.7per cent) have reported doing research andteaching at the undergraduate or post-graduate level in universities or colleges. Thesecond largest proportion of women were engagedin research and teaching at academic researchinstitutions (33 per cent).
With respect to working hours, a majority of 62.8per cent (196) reported working between 40-60hours per week (Refer Appendix II, table 20for details). The proportion of WIR whoreported working between 40-60 hours perweek is significantly higher than theproportion of WNR reporting the same.
Better professional prospects, professionaladvantages as well as availability of jobs areimportant determinants for selection of jobs for WIR(Refer Appendix II, tables 19-21 for details).
Note: The question was a multiple response question and the totalnumber of responses received exceed the actual number ofrespondents
Sixty-two members of the WIR group (19.9 percent) have had breaks. For those with breaks, 47.8per cent of the responses indicate child care andelder care responsibilities as reasons for the break.
Research Productivity and Networking profile
Three hundred and six women scientists (98.1per cent) of the groups have reported authoringpapers or filing patents in their student orprofessional lives. The highest proportion of thegroup (86.2 per cent) has reported publishingjoint/multi-author research papers inrefereed journals (Mean = 18.2; SD = 25.6).The second largest proportion (51.9 per cent) ofthe group has reported publishing individualresearch papers in refereed journals (Mean =7.8; SD = 15.8). Publications that have beenreported by the least number of women in the groupsinclude other individual and collaborative publicationssuch as CDs, training manuals, etc, collaborativelyedited books and individual patents. A significantlyhigher proportion of WIR have also reported beingmembers of Professional Organizations (76per cent) compared to the other two groups namelyWNR and WNW.
With respect to conferences and workshops, 64.1per cent of WIR have reported participating inconferences at least two or more times per year.The highest responses received indicated that thereason for attending conferences and workshops*
by the WIR group was to keep themselves

26
The provision* that has received highest number ofresponses by the group, thereby considering it mostuseful to retain women in Science was ‘Flexibilityin timings’5 (30.9 per cent). While this provisionhas been commonly reported by all three groups ofwomen scientists, the provision that has receivedthe second highest number of responses from thisgroup is ‘Provisions of accommodation andtransportation’ (18.1 per cent of the responses),and this is reported by the WIR in contrast to theother two groups of women scientists.
Category II: Women Not in Science Research(WNR)
The classification of Category II was developed tounderstand the unique experiences of womenemployed in Science, or outside Science, in careersthat may not require training at the doctoral level.Women in teaching only at the under-graduate level,in administrative or managerial positions, and thoseon temporary research or teaching positions weresurveyed and their responses were analyzed underthis category. While it may be rightly argued that forcertain positions such as under-graduate levelteaching, a PhD has become the mandatoryrequirement imposed by the UGC (with the 6th paycommission), the categorization has been made withthe realization that women who have opted forteaching only, despite having the skills for engagingin research also may have made such choices dueto special considerations, unique to this group andwhich may have not been so for the WIR group.Similarly, women on temporary research positionssuch as DST women scientists’ schemes wereincluded in this category to understand the reasonsfor their engagement with research of a temporarynature only. As the findings in this study haveshown, several of the considerations forwomen in this group and for those who arenot working currently, reasons may be morestructural and institutional rather thanpersonal only.
Personal and Family Profile
A total of 182 women (32.0 per cent of the totalnumber of women surveyed) were interviewed inthis category.
updated and learn more (31.3 per cent). Theproportion of women who have reported this iscomparatively lower than for the other two groupsnamely WNR and WNW. The second highest statedresponse for the group was for Networking (23.1per cent).
Perceptions Regarding Drop-out from Scienceand Provisions to Retain Women in Science
Note: The question was a multiple response question and the numberof responses received exceeds the total number of respondents
A majority of the WIR have reported that morewomen drop out of Science compared to men. Themost frequently stated reason for drop-out* givenby them was for family responsibilities (51.6 percent of the responses). The second highest statedresponse by the group was due to disenablingorganizational factors such as lack of flexibilityin timings, discriminatory work practices, lack ofwomen colleagues, mentors and role models,restricted chances for participation, too few womenin decision making posts, harassment, etc. Withrespect to men dropping out of Science*, the largestmajority of responses indicate more lucrativecareers to be the reason, followed by familyresponsibilities.
Note: The question was a multiple response question and the totalnumber of responses received exceed the actual number ofrespondents

27
The highest proportion of the group belongs to theSouth, while the second highest proportion belongsto the North.
A majority of the group also reported belonging tothe ‘Forward’ castes. However a higher proportionof this group (8.2 per cent) have also reportedbelonging to ‘Other Backward Castes’ (OBCs).The mean age for women in this groups lies between40-50 years (mean age = 43.9 years; SD = 9.3).The highest proportion of the group (40.1 per cent)has also reported annual family incomes of rupeessix lakhs and above. (Refer Appendix II, tables9 and 10 for details).
Note: Slices in shades of blue indicates women who were married(including those who may be divorced, separated or widowed). Theslice in green indicates women who were ‘never married’.
With respect to family details, 87.9 per cent of thewomen scientists in this group (160 women
scientists) reported being married. (12.1 per centor 22 women reported ‘never being married’).Among those who were married, the highestproportion of women reported being married afterpost-graduate studies, but before or duringPhD (60.4 per cent), followed by the secondlargest majority that reported marriage afterdoctoral studies (20.9 per cent). Thus, it appearsthat majority of the married women in this groupalso have received the support of parents and in-laws to continue further education. The largestproportion of responses by the group (37.9 percent) has also shown selection of spouse to be byparental choice. The second largest proportionof the group (27.5 per cent) reported selection ofspouse to be with parental consultation, whilethe least proportion of the groups reported personalchoice in spouse selection (the proportion of womenwho reported personal selection was lesser comparedto the other groups of women). (Refer AppendixII, table 12 for details)
A majority of the women have reported also havingchildren (147, 80.8 per cent). The proportion ofwomen with children is higher in this group comparedto the other two groups. A majority of 46 per centof the responses by women with children in the groupindicate that their children were over 15 years*and 49.3 per cent of them indicate having childrenafter completion of PhD*. A majority of 64 percent of them have reported taking only minimummaternity breaks* during child-birth.
Interestingly, approximately equal proportions ofwomen with children in the group have reportedworking between 60-70 hours (24.7 per cent)and 20-40 hours per week (23.6 per cent) whiletheir children were growing up (i.e. the amount oftime spent at office or official work)
A majority of responses from the WNR group (34.2per cent) indicate that help was received forchildcare* from Husband’s family, while the second

28
largest majority of responses show help receivedfrom paid professionals (23.3 per cent). 60.7per cent of women with children have also reportedliving in nuclear families; overall among all womenin the group, 118 (63.7 per cent) reported living innuclear families. (Refer to Appendix II, tables16 and 17 for details).
The largest proportion of women in the group (36.8per cent) reported their spouses’ qualification tobe Post-graduation and the highest proportion ofthem (44.0 per cent) also reported that theirspouses were not engaged in Science research,teaching or consultancy. (Refer Appendix II,tables 18 and 19 for details).
Employment and Organizational Profile
A majority of WNR (102, 57.7 per cent) wereemployed in under-graduate teaching. A majorityof the group (45.1 per cent) have also reportedworking between 40-60 hours per week on anaverage. However a significantly higher proportionof WNR have also reported working between 20-40 hours per week (37.4 per cent) and below20 hours a week (11 per cent), compared to WIR.(Refer Appendix II, table 20 for details).
59.1 per cent of the group has reported having 50per cent or more women co-workers at thedepartmental level; at the organizational level,44.2 per cent reported having 50 per cent ormore women co-workers.
The two main factors that have influenced jobselection, including those previously applied to andnot taken up, previously held, as well as presentposts, among members of this group, are not havinggot the jobs, and reasons of better professionalprospects and advantages. (Refer Appendix II,tables 21, 22 and 23 for details).
Note: The question was a multiple response question and the totalnumber of responses received exceed the actual number ofrespondents
With respect to breaks, the most frequently statedresponse for breaks* by the WNR group was due tocare for children and elders (51.1 per cent).
Research Productivity and Networking Profile
Hundred and seventy-three women (95.1 percent) of the group have reported authoring papersor filing patents during their student orprofessional lives. The highest proportion of thegroup has reported publishing joint/multi-authorresearch papers in refereed journal (153, 84.1per cent). The second highest proportion of thegroup has reported authoring joint/multi-authorconference articles, proceedings or abstracts(38.5 per cent, with mean = 3 and SD = 6.1).Publications that have been least reported includeindividually and collaboratively edited books andpatents, collaborative popular articles and otherarticles.
A significantly higher proportion of women in thisgroup (47.3 per cent) have also reported notbeing part of professional organizations.Access to professional organization for the WNRgroup may be restricted since they do not belong tothe close knit Science community. It could alsoindicate that membership of professionalorganizations operates as an exclusive club wherenetworks become extremely important. This perhapsindicates lesser opportunities to be part of networkswithin scientific research and teaching communitiesthat may be of use in obtaining jobs, fellowshipsand projects in Science research and teaching abovethe post-graduate level. Further, it may also be truethat WNR are not interested in the activities ofprestigious scientific organizations.

29
A majority of the group has reported attendingconferences and workshops twice or more thantwice a year (50.0 per cent). Among those whoattended it, the highest stated reason for attending*was to keep themselves updated and gain moreknowledge (35.9 per cent). The second moststated response was due to interest in the topiccovered in the conference (19.5 per cent).Approximately similar number of responses has alsobeen obtained for Networking (19.2 per cent).(Refer Appendix II, table 26 for more details).
Perceptions Regarding Drop- out from Scienceand Provisions to Retain Women in Science
Note: The question was a multiple response question and the totalnumber of responses received exceed the actual number ofrespondents
52.7 per cent of WNR reported that women dropout of Science more frequently. A higher proportionof this group (13.7 per cent) compared to the othertwo groups has also reported that men drop outof Science more often. With respect to reasons whywomen drop out of Science*, a majority of 50.9responses indicate family responsibilities to bea significant reason, followed by disenablingorganizational factors6 (19.4 per cent). Giventhe fact, that existing literature particularly in theIndian context has always upheld that societal andfamily reasons are responsible for women leavingScience, the study has brought to the fore the roleof disenabling organizational factors. Recentsociological studies in India corroborate this finding(Gupta and Sharma 2003; Subramanian, 2007;Kumar, 2009; etc.). A majority of responses bywomen in the group also indicate that men drop outof Science* for other lucrative career options(47.5 per cent) followed by the reason of lack ofdedication and patience for careers in Science
(16.9 per cent). (Refer Appendix II, table 28for details).
Note: The question was a multiple response question and the totalnumber of responses received exceed the actual number ofrespondents
With respect to provisions to retain women inScience*, as with other groups, the majority ofresponses given by the group indicate flexibilityin timings7 to be the most useful provision (31.1per cent responses). However, the second mostfrequently stated response differs from the othergroups, it being better HR policies (16.8 per centresponses).
Category III: Women Not Working (WNW)
Women scientists classified under Category III arecurrently unemployed, though they may be engagedin activities and interests of non-occupational nature.It is important to note that women in category IIIbelonged to two different views: on the one handwomen who had voluntarily chosen to leave theirprofessions with the desire to spend more time withfamily and children. On the other hand, this groupalso comprised those who had given up their careersinvoluntarily due to organizational or personalhurdles. A total of 74 women scientists (13.0 percent of the total women interviewed) were surveyed.While the total registered number of womenscientists who were not employed at the timeof registration was much higher (144), manyhad obtained temporary posts (such as on DSTwomen scientist schemes) by the time of thesurvey, and several others were unwilling toparticipate in the survey.

30
Note: Slices in shades of blue indicates women who were married(including those who may be divorced, separated or widowed). Theslice in green indicates women who were ‘never married’.
A majority of the WNW group (91.9 per cent) havealso reported being married. Among the threecategories, the lowest proportion of respondentsfrom this group reported being ‘never married’ (8.1per cent). The largest majority of those who weremarried reported being married after post-graduationor during doctoral studies (59.4 per cent),followed by the second largest proportion that havereported after doctoral studies (27.0 per cent).The largest proportion of those who were marriedreported that selection of spouse was by parentalchoice (41.9 per cent). A majority of the womenin the group reported having children (83.8 percent), and 54.9 per cent of the responses fromthose with children* reported having children over15 years. (Compared to the other two groups, thehighest proportion of women in this group hasreported having children over 15 years). With respectto timing of child birth*, 39.1 per cent of theresponses indicated having children aftercompletion of PhD. Of those who had children,50.7 per cent responses showed that the womenhad taken minimum maternity break*, thoughthe lowest proportion of this group has reported thiscompared to the other two groups. The highestmajority of the women in the group (44.6 per cent)have reported that the question regarding time spentat work while children were growing up was notapplicable to them. This may be due to the fact thata large number of WNW group were in fact notworking after childbirth. Also for the women scientistsin the WNW group who reported not being married,the question would not have been applicable. Thelargest majority of responses by the women (28.0per cent) show that no help was received forchildcare*. The second highest proportion of theresponses from the group (17.3 per cent) haveshown help received from paid professionals. Ofthose with children, 82.3 per cent have reported
Personal and Family Profile
Of the 74 women scientists surveyed, a majority of43.2 per cent belonged to the South zone, whilethe second highest proportion belonged to the Northzone. Equal proportions of women were representedfrom the East and West.
A majority of women scientists surveyed under thiscategory (56, 75.7 per cent of the group) reportedthat they belonged to the ‘Forward’ castes. Alarger proportion of the group (2.7 per cent) wasalso composed of women from ‘Scheduled Castes’compared to WIR and WNR. The mean age of thegroup was between 40 and 50 years (mean age= 45.5 years; SD = 12.9).
A majority of the WNW group (39.2 per cent)reported having an annual family income of rupeessix lakhs and above, though the proportionreporting this was smaller than that of the othertwo groups. The second highest majority of the group(28.4 per cent) reported an annual family incomeof rupees four-six lakhs. (Refer Appendix II,table 10 for details).

31
Note: The question was a multiple response question and the totalnumber of responses received exceed the actual number ofrespondents.
With respect to breaks* in career, the highest majorityof responses (42.2 per cent) indicated care ofchildren / elders as reason for the breaks. Theproportion of responses received from this group withrespect to the above mentioned reason is lower thanthe proportion of responses received from the othertwo groups for the same reason. A significantlyhigher proportion of responses from this group (21.9per cent) also show breaks due to difficulty infinding appropriate jobs, advisors orinstitutions, compared to the other two groups.
Research Productivity and Networking Profile
Seventy women from the group (94.6 per cent)reported having authored papers or filingpatents. The highest proportion of the groupreported publishing joint/multi-author researchpapers in refereed journals (59, 79.7 per cent;mean = 14.0, SD = 32.9). The second highestproportion of the group reported publishingindividual research papers in refereed journals(35.1 per cent, mean = 5.85, SD = 15.9).
Majority of the women from the group reported beingmembers of professional organizations, and only 41per cent reported not being members ofprofessional organizations.
Fifty per cent of the group also reported attendingconferences and workshops twice or more peryear. The highest proportion of the responses (33.1per cent) indicate that the reason for attendingconferences or workshops* was to keepthemselves updated or increase theirknowledge base. The second highest proportionof responses (24.8 per cent) indicate attending
living in nuclear families. 78.4 per cent of the totalgroup has also reported living in nuclear families.(For details regarding marriage and childrenand family, refer Appendix II, tables 11 -17).
The highest majority of the group (45.9 per cent)reported that their husbands were doctorates and43.2 per cent reported that their husbands wereengaged in Science research, teaching orconsultancy. The highest proportion of this groupreported having spouses with doctorate degrees aswell as working in Science, compared to the othertwo groups. (Refer Appendix II, tables 18 and19 for details). Interestingly the highest proportionof this group (32.4 per cent) has also reportedthat their husbands were engaged in the samefield / organization as themselves. With manyinstitutes having informal policies disallowing couplesto work in the same institution, the higher proportionof women in this group having spouses in the samefield or organization perhaps affected theircontinuation in Science, since it is the women whousually sacrifice their careers for the sake of theirhusbands or families.
Employment and Organizational Profile
Questions regarding employment and organizationasked refer to the previous jobs held or applied to.
Of 74 women, 31 (41.9 per cent) have reportedapplying to jobs previously. Interestingly, thehighest proportion of this group has applied to jobspreviously. The largest proportion of the responsesfrom those who applied for jobs (66.7 per cent)showed not having got the jobs as reason for theirnot taking up the job*, while 15 per cent of theresponses showed disenabling organizationalfactors (which include long/inflexible hours, no roomfor professional growth and lack of daycare facilitiesat the workplace) as the reason. Scientists in generalperceive reporting disenabling organizational factorsas making a case for special treatment andoverlooking merit. This results in women scientistscarrying the burden of protecting merit and thusunderplaying organizational factors that may impedetheir entry/ upward mobility in formal S&T workspaces. The percentage of women who have reportednot having got the jobs is significantly highercompared to the other two groups. (ReferAppendix II, table 21 for details).

32
conferences and workshops for networking. (Referappendix II, table 23 for details).
Perceptions Regarding Drop-out from Scienceand Provisions to Retain Women in Science
Note: The question was a multiple response question and the totalnumber of responses received exceed the actual number ofrespondents.
A majority of the group (62.2 per cent, higher thanother groups) have reported that women drop outof Science. Family responsibilities have beenreported as the reason for women dropping out bymajority of the group (53.7 per cent).
Note: The question was a multiple response question and the totalnumber of responses received exceed the actual number ofrespondents.
The largest proportion of responses from the group(28.5 per cent) indicates flexible timings8 as animportant provision for retaining women in Science,while the second highest proportion of responses(15.6 per cent) indicate the need for better childcare facilities.
MEN
Category I: Men in Science Research (MIR)
Definition of ‘men in Science research’ is similar to‘women in Science research’, that is, those involvedin long-term activities in research which may alsoinclude teaching at the postgraduate and/orundergraduate level. Men scientists belonging to MIRmay be engaged in research only (includingtechnology based research), which may include theresearch labs/institutes within industries or the otherscientific laboratories. It primarily included men whowere engaged in research in some form or the other.Another important criteria that defined this groupwas that these men scientists who have completedtheir PhDs were in tenured positions as againsttemporary position indicating a greater stability intheir occupation. A total of 161 men scientists havebeen interviewed as part of this category.
Personal and Family Profile
Highest proportion of men surveyed in this categorybelonged to the South zone (34.8 per cent)followed by the second highest proportion from theNorth (31.1 per cent).
Majority of the men belonged to ‘Forward’ castes.Significantly higher proportion of MIR (12.4 percent) belonged to ‘Other Backward Castes’compared to women. The mean age for the grouplies between 40-50 years (mean age = 45.2

33
years; SD = 8.7). (Refer Appendix III, table32 for details).
Compared to WIR, highest majority of MIR havereported annual family incomes between rupees 4-6 lakhs (39.8 per cent), while the second highestper cent (31.1 per cent) have reported rupees 6lakhs and above. (Refer Appendix III, table33 for details).
Note: Slices in shades of blue indicates women who were married(including those who may be divorced, separated or widowed). Theslice in green indicates women who were ‘never married’.
97.5 per cent have reported being married. Thus,a significantly higher per cent compared to WIRhave reported being married. 47.2 per cent havereported being married after doctoral studies(which is significantly higher than theproportion of WIR who have reported beingmarried after doctoral studies. For details referAppendix III, table 34). 44.7 per cent reportedchoice of spouse was with parental consultation.A majority of the group (49.7 per cent) alsoreported spouse’s qualification to be post-graduation and only 16.1 per cent reportedspouse’s qualification to be doctorate. While onecan see that in a majority of the cases there is nostatus incongruence, the presence of this in 16 percent of the sample shows that there is a changingtrend. A small proportion of the group (18.6 percent) have reported that their spouses wereworking in Science research, teaching orconsultancy. (For details regarding spouse,refer Appendix III, tables 35-37).
86.3 per cent of the group also reported havingchildren. 44.6 per cent of the responses fromthe group indicated that their children were over15 years*. 57.8 per cent of the responses byMIR were indicative of having children after PhD*.33.5 per cent have reported working between 40-60 hours per week when their children weregrowing up (though the proportion of men reportingthis is lower than the proportion of WIR). A higher
proportion of MIR (28.6 per cent) have alsoreported working lesser than 40 hours per weekcompared to WIR. (Details regarding childrenare available in Appendix III, tables 38-40).
Employment and Organizational Profile
Note: The question was a multiple response question and the totalnumber of responses received exceed the actual number ofrespondents.
96 MIR, (59.6 per cent) have reported doingresearch and teaching at the postgraduateand/or undergraduate level at universities orcolleges, followed by 50 MIR, 31.1 per cent whohave reported doing research and teaching atan academic research institute.
With respect to number of hours at work, 74 (46.0per cent) men reported working between 40-60hours per week. The proportion of MIR whoreported working more than 60 hours per weekand less than 40 hours per week is greater thanthe proportion of WIR who reported work hours inthe above two categories. (Refer Appendix III,table 41 for details).
With respect to reasons for not taking up previousjobs applied to* and for leaving previous jobs*, themost frequently stated responses by the MIR groupwere non-availability of job or for betterprofessional prospects. The proportion ofresponses received from men with respect to betterprofessional prospects for both questions is higherthan the proportion of responses from women.(Refer Appendix III, tables 42 – 43 fordetails).
33.5 per cent of the responses by MIR indicatereasons of professional advantages and betterprospects for taking up present posts*. 21.6per cent of the responses by MIR indicate personalsatisfaction or enjoyment as the reason for taking

34
up the present job. (Refer Appendix III, table44 for details).
Note: The question was a multiple response question and the totalnumber of responses received exceed the actual number ofrespondents.
Only 7 men (4.3 per cent) have reported havingbreaks in career, with majority responses indicatingreasons such as completion of studies, healthreasons, voluntary retirement, etc. for thebreak*.
Research Productivity and Networking Profile
All members of the group (161) have reportedauthoring papers or publishing patents duringtheir doctoral or professional life. MIR on anaverage have the highest number of collaborativeconferences articles, proceedings or abstracts(mean= 30.4, SD = 48.8), fol lowed byCollaborative research papers in Refereedjournals (mean = 30.03, SD = 42.9). On anaverage they have few books and individual patents.
With respect to membership of professionalorganizations, a majority have reported beingmembers of professional organizations. Only 25.5per cent men reported not being members ofprofessional organizations.
72 per cent of MIR have reported attending twoor more conferences per year. 31.8 per cent ofthe responses by MIR indicate that the reason forattending conferences and workshops* was to keepthemselves updated and learn more while 27.1per cent MIR indicate networking as the importantreason. (Refer Appendix III, table 47 fordetails).
Perceptions Regarding Drop-out from Scienceand Provisions to Retain Women in Science
Note: The question was a multiple response question and the totalnumber of responses received exceed the actual number ofrespondents.
A majority of the men surveyed (47.2 per cent)reported that women drop out of Science moreoften than men. 58.5 per cent indicate that womendrop out of Science due to family responsibilities.With respect to reasons given for men dropping outof Science*, 53.2 per cent of the responses indicateother lucrative career options as the reason.(Refer Appendix III, table 49 for details).
Note: The question was a multiple response question and the totalnumber of responses received exceed the actual number ofrespondents.
With respect to provisions to retain women inScience*, one in every four responses by MIR(29.6per cent) report flexibility in timings9 as animportant provision. About 17.8 per cent ofresponses by MIR indicate the need to conductawareness and motivation campaigns andprogrammes, sensitize family and society,ensure jobs for women, allow couples to workat the same institute, create a safe and freework atmosphere and so on, to retain womenin Science.

35
I. SAMPLE DETAILS
The data has been collected from women and menrespondents covering all zones. Care was taken toensure that the three sub-groups of women scientistsand the group of men scientists were representedfrom each of these zones. The survey indicates thatby and large the formal spaces in Science aredominated by the general category. The distributionof the scientists surveyed reflected by and large thereligious and caste distribution of the generalpopulation. The mean age of the surveyed scientists,both women and men was 40-50 years. (Sampledetails are available in Appendices II and III).
Information was collected from the respondents withrespect to several questions such as family andmarital details, educational details, employment andorganizational details as well as research andproductivity factors. More than 100 questionscovering these various areas were asked of eachrespondent.
A majority of the women (87 per cent) and men(98 per cent) surveyed reported being married.The marital status of the three groups of womenscientists reveals, approximately 85 per cent of WIRand WNR were married while a higher percentageof WNW (92 per cent) were married. It is theWIR group that has a relatively lower per cent ofwomen married. Consequentially, it is this group thathas the highest per cent of women being nevermarried, i.e., 14.1 per cent (44 out of the total312 women in research). The proportion of ‘nevermarried’ WIR is distributed across all the age groupsand does not vary significantly. Twenty two WNR,representing 12.1 per cent of this sub-groupreported being never married. However, the chisquare value was not significant either at .05or .01 level.
When one compares the sub-groups of marriedwomen and men in research (85.9 per cent and97.5 per cent respectively), they significantlyvary at .01 level. The findings are similar to findingson the Campion and Shrum (2004) study which alsoreports that more women than men in Science stayunmarried.
Significant difference is seen among theproportion of women in science researchand men in science research who aremarried. A higher percentage of MIR aremarried compared to WIR.
No significant variation was seen amongthe proportion of WIR who were marriedin relation to age.
One in two men reported marriage afterdoctoral studies while only one in fourwomen reported the same. This isindicative of the winding paths for womenand the straight roads for men inacademic careers.
The earlier practice amongst most Indian familieswas to get girls married on completion of theireducation. However, this is not true in the case ofthose who take up a scientific career as reflected inthe survey. Nearly half (47.2 per cent) of the menscientists married after completing their PhD. Thecorresponding per cent in the case of womenscientists is less than one fourth (23.4 per cent).This may be also due to the fact that the age atmarriage is lower for girls than boys in India. Inother words, a majority of the women scientists havehad to manage a career and family during theirstudies showing that they have had to follow windingpaths rather than straight roads (Elgquist-Saltzman,1992). In the case of men scientists who may havegot married during their education, it is more likelythat they derived support from their spouse, whichmay not be the case for the women scientists. (ReferAppendix II, table 11 and Appendix III, table34 for details).
Interesting differences are seen when the timing ofmarriage is compared for the different cohorts ofwomen scientists surveyed. While a larger majorityof women below 40 years have reported marriageduring or after PhD, the least proportion of womenabove 50 years reported marriage during PhD, and

36
a significantly lower proportion of women between40-50 years reported marriage after PhD. (Refergraph given below).
While there is no conclusive evidence that womenmanage their homes before marriage, it is more likelythat women are expected to manage a home aftermarriage and hence pursuing a PhD would not havebeen as easy as it would have been for women whogot married after their doctoral studies.
Although there is a small difference between the sub-groups of women scientists who have reported livingin nuclear families, close to two-thirds of them reportliving in nuclear families (Refer Appendix III,table 17 for details). While the nuclear family giveswomen a better opportunity to negotiate for theredefinition of power and consequently thedistribution of roles and responsibilities, they alsocome with reduced support mechanisms within thefamily structure. While this has worked as anadvantage for some career women, it has been adisadvantage in the case of some others. Exploringthe advantages and disadvantages of thisarrangement needs to be undertaken with referenceto specific contexts for more conclusive evidences.Higher number of women in the WNW group livingin family structures without additional members forsupport (i.e. parents, grand-parents, siblings, etc)who can share in family responsibilities such ascooking, cleaning, child care, etc, may be a crucialfactor leading to their drop-out from Science. Whileour data did not contain information with respect to
domestic help, it may be an important factor whichcould help women reorganize their responsibilitiesto achieve work-family balance.
An interesting observation drawn from our data iswith respect to employment of the couple within thesame field or organization. The data reveals thatthe largest per cent of WNW have spouses insimilar fields/ organizations (32.4 per cent).This perhaps affected their continuation in Sciencecareers, as many organizations have informal policiesthat discourage spouses working in the sameinstitution. In the Indian context, since men areconsidered to be the primary bread winners offamilies, it would be women who would be expectedto give up their careers in case of a conflict. 23.7per cent of WIR have reported that their spouseswork in similar fields/organizations and a relativelylower per cent of WNR (14.4 per cent) reportedthat their spouses worked in similar fields/organizations as themselves. (Detailsregarding spouse’s qualification andemployment in Appendix II, tables 18 and 19).
A higher proportion of WNW havereported that their spouses are / were inthe same field or organization asthemselves. In contrast a higher per centof WIR and WNR have reported that theirhusbands are/were not in the same field/organization as themselves. With manyinstitutes having informal policies that donot encourage couples to work in thesame institution, women may more oftenhave to sacrifice their careers to resolvethese conflicts of interests. Perhaps,among the large number of women in theWNW category who have reported thisoverlap in field or organization with theirspouses, this has been the cause for theircurrent status.
Over 70 per cent of the women scientists from allthree groups reported having children. One oftwo women scientists from all groups had childrenover 15 years*. The highest proportion of the WNWhave children over 15 years (54.9 per cent). Onein every four women scientists in the sub-groups ofWIR and WNR reported having young childrenbetween 5-15 years. One in every 5 WNW reportedhaving even younger children less than 5 years.

37
Given the fact that most of them live in nuclearfamilies, the absence of organized supportmechanisms especially when the children areyounger could be one of the reasons for women notpursuing a career in Science. (Details regardingchildren is given in Appendix II, tables 13 and 14).
Interesting differences are seen with respect to ageof children for women across the different cohorts.Among younger women (below 40 years), the highestproportion of the group have children between 0 – 5years (48.4 per cent). The highest proportion ofwomen between 40-50 years reported havingchildren between 5 -15 years (65 per cent). Moreimportantly, a significantly higher proportion of WNWhave younger children between 0-5 years in bothage groups, below 40 years (57.1 per cent WNWcompared to 47.8 per cent WIR and 45.3 per centWNR) as well as between 40-50 years (17.6 percent compared to 5.2 per cent WIR and 8.8 percent WNR). Data on help with childcare* also showsthat highest majority of women in the WNW groupshave reported that they received no additionalhelp with childcare/ did not work when the childwas growing up (28 per cent), compared to only2.8 per cent WIR and 4.5 per cent of WNR whohave reported the same. The largest majority of WIRhave reported receiving help from their family forchildcare (25.8 per cent) while the largest majorityof WNR have reported help from husband’s familyfor childcare (34.2 per cent). (Refer Appendix II,table 16 for details).
One in every five women scientists surveyed hadtheir child/children* during their studies. Althoughthe variation within the groups is not very large, theWIR sub-group reported the highest per cent (23.6),followed closely by WNR (21.6 per cent). Nearly10 per cent of the women scientists had their childduring their jobs in junior positions. An equalnumber of women scientists had their children aftera PhD before taking up a job. It will be useful toanalyze the experiences of women who have beenable to balance their studies with marriage andchildren as much as those women who had theirchildren when they were working. The need for thisis not so much to undermine their success asscientists but to help women scientists who maybelieve that this balance is difficult or, for that matter,not possible. When the comparison betweenWIR and MIR sub-groups with regard totiming of having children were made, therewas a significant difference at 0.01 level
between these groups. 57.7 per cent MIR reportedhaving children after PhD, as against 42.2 per centWIR reporting the same.
A majority of the women in all three groups havealso reported taking only minimum maternity breakfor children. The data revealed that the highest percent of WIR (76.4 per cent) had minimum maternitybreaks followed by the WNR (64 per cent). Onlyone in every two WNW reported having taken aminimum maternity break (50.7 per cent).
Finally, with respect to time spent on work, whilechildren were growing up, the groups significantlydiffered. WIR reported spending between 40 – 60hours per week at work (46.8 per cent). Equalproportions of WNR have reported spending eitherbetween 60-70 hours or 20-40 hours per weekat work (24.7 per cent and 23.7 per centrespectively). Nearly two-fifths of the WNW groupshave chosen the not applicable option. This mayeither indicate an unwillingness to respond to thequestion or having not worked when children weregrowing up. However, since a much higher numberof women have used this option compared to theother two groups, it may perhaps indicate that manyof them did not work while children were growingup. The second largest proportion of the groupreported working for 40-60 hours per week (27.0per cent). (Refer Appendix II, table 15 for details).The sub-groups of women scientists significantlydiffered with respect to time spent at work whenchildren were growing up. The chi square valueis significant at the 0.01 level (X2 = 138.066,p = 0.000, p<0.01).
Interesting differences are seen even with respectto the time spent at work when children were growingup among the women in research and men inresearch sub-groups. One in every five MIR havereported spending over 60 hours per week atwork when children were growing as against one inten WIR. On the other hand, 46.8 per cent of WIRreported having worked on an average of 40-60hours. The corresponding figure for men scientistsis 33.5 per cent. One in every four men scientistsalso reported having worked less than 40 hours aweek and in the case of women scientists thecorresponding figure is one in every five (ReferAppendix III, table 40 for details). The differencesbetween the two sub-groups with respect totime spent at work when children weregrowing up is significant at 0.01 level.Contrary to popular perception that more

38
women spend lesser time at work afterchildbirth, the data indicates that men spendlesser time at work after childbirth. The factthat women in research are aware that theywould be watched more carefully couldactually increase the pressure on them to putin more hours of work. It could also be due tothe fact that they have less control over theirtime. Children when young need time that maynot be planned for on account of illness orother associated reasons thus theycompensate, so that their output is notaffected. While these need to be validated throughlarger studies that are more qualitative in nature,suffice it to say that over-compensation is onemechanism that women use so that they are notviewed as taking advantage of their gender. Thesurvey indicates that this is more pronounced amongthe WIR sub-group. However, there is a caveat thatthe number of hours of work does not in itself explainproductivity and the quality is an importantdimension.
There is a significant difference betweenthe timing of child birth for women andmen in research. More men compared towomen reported having their childrenafter PhD. However this may be becausein general, men get married later thanwomen. Early marriage and early timingof children for women is responsible forthe winding paths that women have inscientific careers, as noted earlier.
Among the subgroups of women there isa significant difference with respect tothe time spent at work while childrenwere growing up. More women in theWNW group appear to have not workedwhen children were growing up.
Interestingly, a higher proportion of WIRcompared to MIR have reported spendingbetween 40-60 hours per week at workwhen children were growing up. This isan important finding in the light of thefact that the women are commonlyperceived to spend less time at work afterchildbirth and encounter what has beentermed the ‘maternal wall’.
II. COMPARATIVE STUDY OF SUB-GROUPS OFWOMEN (WIR, WNR, WNW)
Of 568 women scientists surveyed, a total of 494women scientists were employed, while 74 womenscientists were not employed. Of the 494 womenscientists who were employed, 312 women scientistsbelonged to the ‘women in Science research’ (WIR)category associated with tenured positions. Thesewomen scientists were either engaged in onlyresearch (including technology based research) orengaged in research along with teaching at thegraduate and/or post-graduate level. A hundredand eighty-two women scientists belonged to the‘women not in Science research’ (WNR) category,and these women were engaged in only teaching atundergraduate level and below, administrative ormanagement positions, or temporary positions onresearch projects.
Among WIR, the highest proportion of the group(124, 39.7 per cent) were engaged in ‘Researchand Teaching’ at the university or affiliatedcolleges (PG / UG level). The second highestproportion of the group (103, 33 per cent) wasengaged in ‘Research and Teaching in aresearch institution.’ (Refer Appendix II, table 5for details)
Among WNR, a majority of them reported teachingat the undergraduate or school level (105,57.7 per cent). The second highest proportion ofthe group was engaged in administrativepositions such as head of institutions, technicalofficers, etc. (29, 15.9 per cent). Eighteen women(9.9 per cent) were engaged in temporary orpart-time research positions (Refer Appendix II,table 6 for details).
ORGANIZATIONAL FACTORS
Organizational factors play an important role indetermining employees’ satisfaction, performanceand continuation in the organization. Workatmosphere, organizational policies and regulations,number of working hours, location, and nature ofjob all affect the choice of institution/ organizationmade by employees. Hence, it was considered animportant area of analysis even in the study.Organizational factors related to the number ofworking hours, type of organization (e.g.government, private, aided, etc), nature ofemployment, how the present/current job wasobtained, as well as information pertaining to

39
previous jobs were obtained. This section providesan analysis of all the above information.
Number of Working Hours
A significant factor determining the choice oforganization for women scientists as well as for menscientists could be flexibility in working hours. Ananalysis of the number of hours put in at work byWIR and WNR is given below.
62.8 per cent of WIR have reported working on anaverage between 40-60 hours per week; 20.5per cent of this sub-group have reported workingfor 60 hours or more per week. Thecorresponding figures for WNR are 45.1 percent and 6.5 per cent respectively (Refer AppendixII, table 20 for details). The differences in thenumber of hours spent on work by WIR andWNR is significant at 0.01 level. This indicatesthat there is a difference between the twosub-groups with respect to the number ofhours spent at work. The WIR spent morehours at work on an average. The perception ofbeing unable to cope with the long hours that arerequired in research and teaching at post-graduatelevel and above may perhaps be a deterrent forwomen to take up research careers in Science. It isbelieved that longer hours, or/and late hours in theevenings are pre-requisites for a research career inScience. This may be both inconvenient due to theperception of safety at the workplace as well aslong travel hours due to the distance of the researchinstitutions from home, which are few and locatedat specific areas of the city/town. Residences aroundthese areas may be expensive and hence cannot beexplored as an option. This is coupled with familyresponsibilities, childcare and eldercare wherewomen play predominant role in the Indian context.Balancing the family and a research career is achallenge that most women in academic careers face.Combined with other social and family factors suchas caste, class, geographical location, etc, thesefactors play out in various permutations andcombinations and result in several women optingout of research careers.
Therefore significant differences in thetime spent at work for WIR and WNR.. Asignificantly higher proportion of WNRhave reported less than 40 hours perweek of work. Perceptions of long andinflexible hours may thus be a deterrentand flexibility in timings may be a usefulstrategy to attract more women toScience research.
While changes at the family and societal levels areslow and painstaking, a way forward for institutionsin this scenario would be to offer flexibility in timings,as well as option to work from home throughtechnological provisions such as access to internetand online journals and libraries at home; makingmore provisions for housing on campus or arrangingfor transportation; rescheduling meetings and othersuch events during the morning hours; makingprovisions for good quality childcare facilities at work,etc. In contrast to research institutions anduniversities, several corporates have alreadyrecognized the valuable contributions of women andhave offered several of these provisions includingflexibility in timings, work-from-home options,childcare facilities, transport, etc.
Two to 5 per cent of the women scientists reportorganizational factors as responsible for themquitting their earlier job (Refer Appendix II, table22 for details). However, the low reporting oforganizational factors by the women scientists couldbe due to various reasons. The perception thatScience, its practice and organization isalways fair is one perception that mostscientists believe; and the onus of carryingthis image is perceived to rest on womenscientists. Attempts to understand this blackbox has not received adequate attention.Drawing an analogy, in a slightly different butrelated contexts, this has also been the casein India with schools as an institution up tothe 80s. There is a need for a greater volumeof work raising questions beyond traditionalframeworks that may allow one to have a peekinto S&T organizations. At another level, giventhe closed organization of scientists and thein-built hierarchy amongst this group, gettingscientists to report on organizational factorsmay be difficult due to fear of the possibilityof tracing the response to the scientist. It may

40
also be that the organizational culture is takenas given and has not by and large been asubject of enquiry.
The differences between the groups withrespect to reasons for leaving previous posts*
are significant at the 0.01 level. For WNW, itappears that a combination of non-availability oflong-term jobs and family responsibilities affect theirretention in Science research. Since both factors canbe addressed through better organizationalprovisions (e.g., more number of tenured jobs,flexibility in working hours, childcare facilities, etc)greater effort is required at the organizational levelto actively pursue women through such pro-activepolicies.
There appears to be a significantdifference among the sub-groups ofwomen scientists with respect to leavingprevious posts. A combination of non-availability of jobs and family factors hasaffected WNW. For WIR and WNR, thehighest reported reasons for leavingprevious posts was for better professionalprospects and the temporary nature ofthe jobs.
Career Breaks*
Breaks in career crucially affect professional growthfor both women and men scientists. Breaks may bemore common and frequent in the case of womenscientists who have dual responsibilities of lookingafter the family as well as the work front. Acomparison of the number of breaks and reasonsfor breaks was carried out between the sub-groupsof women scientists. The question allowed formultiple responses up to a maximum of three.
47.8 per cent of the responses by WIR indicatethat the reason for the break / breaks were forchildcare and care of elders. Nearly one in fiveresponses by WIR show other family reasonssuch as father’s or spouse’s transfer,marriage, etc for career breaks.
The highest proportion of responses by women fromthe WNR group (51.1 per cent) show the reasonfor breaks in career to be care for children andelders. Nearly one in four responses of WNR (28.3per cent) show reasons ranging from furtherstudies, health or non-availability of fellowship dueto age limit as possible reasons.
Two of five responses by WNW show childcareand elder care as the reason for breaks (42.2per cent). However, a comparatively lowerproportion of responses by women from this grouphave shown this as a reason for the break/ breakscompared to the proportion of WIR and WNR. One-fifth of the responses by WNW (21.9 per cent)show that one of the reasons for break/breaks wasdifficulty in finding jobs, advisors orinstitutions. The corresponding figures for thesub-groups of WIR and WNR is about one tenth.
The differences in responses given by womenof the three sub-groups is statisticallysignificant at the 0.05 level, indicating thatWIR, WNR and WNW have taken breaks fordifferent reasons. Across all age-groups ofwomen, childcare has been the most reportedreason for breaks, though a comparativelylower percentage of responses for the samehave been reported by women above 50 years(50 per cent) compared to women below 40years (78.7 per cent) and women between 40-50 years (74.2 per cent). The difference issignificant at the 0.01 level. Once more it canbe seen that better organizational provisions suchas adequate number of jobs, institutions, andchildcare/eldercare facilities at the workplace canbe important provisions in reducing breaks forwomen and preventing drop out (Refer Appendix II,table 24 for details).
There is a significant difference betweenthe sub-groups with respect to reasonsreported for breaks in career. Among thethree, a higher percentage of WNR havereported childcare and eldercare asreasons, while a higher proportion of theWNW group has reported difficulty infinding institutions, jobs and advisors incomparison to the other groups. Oncemore organizational factors appear to besignificant for women not continuing inScience.
Research and Networking
Research and Networking are important factors thatincrease visibility of scientists and help them gainprestige in the research milieu. Questions regardingparticipation in conferences and workshops, externalprojects, memberships to professional organizations,

41
etc were asked of women scientists to understandtheir research and networking profiles.
Special Schemes and Fellowships:
In the recent past, several notable efforts have beenmade by various agencies, institutes andorganizations to increase participation of women inScience, through special schemes and fellowships(e.g., DST Women ScientistScheme for research). The numberof women scientists aware of theseschemes and those who hadavailed such opportunities, wereanalyzed (Refer Appendix II, table25 for details).
With respect to special schemesfor women, a majority of WIR(81.4 per cent) have reportedbeing aware of these schemesfor women in Science.However, only 29.5 per cent ofthem have reported accessingsuch schemes. A majority of the group (84 percent) also reported that they would like to accesssuch special schemes for women in Sciencein the future.
Among WNR, a comparatively lower proportion(63.7 per cent) reported being aware of specialschemes for women scientists. Among them,only 28.6 per cent reported having taken benefitof these schemes. A larger majority of them (86.8per cent) however reported being interested inaccessing such schemes in the future.
A majority of WNW also were aware of specialschemes for women in Science (78.4 per cent),but only 27 per cent of them had accessed theseschemes. With respect to accessing such schemesin the future, 79.7 per cent reported that theywould like to do so.
The women scientists, irrespective of thesub-group they belong to, have reportedthat they would like to access the specialschemes. This is indicative of the needfor pro-active measures that willencourage the participation of women inScience research. Among the womenscientists who reported not wanting to
use such schemes, the most commonreason was because such schemes wouldfurther increase the tokenism of women,making them stand out and be singled forspecial favours obtained.
Conferences and Workshops*
Note: The question was a multiple response question and the totalnumber of responses received exceed the actual number ofrespondents.
The proportion of WIR who reported attendingconferences and workshops more than twotimes a year (64.1 per cent) is higher comparedto the proportion of WNR and WNW. A majority WIRalso perceived their participation in conferences andworkshops to be similar to men’s (50.6 per cent).With respect to reasons for attending the conferencesand workshops, the highest proportion of theresponses given by women in the group indicatedthe need to learn more and to keep themselvesupdated on knowledge (31.3 per cent).Networking as an important reason for attendingthe conferences and workshops (23.1 per cent)was also reported. A higher proportion of responsesby women in this group (16.9 per cent) also showedattending these events to showcase their workand for visibility.
Among WNR, 50 per cent reported attendingconferences and workshops twice or morethan twice a year. The most stated response forattending conferences and workshops by this groupwas to keep themselves updated and learnmore (35.9 per cent), followed by interest inthe topic (19.5 per cent) and networking (19.2

42
per cent). Fewer responses from the WNR grouphave been reported for showcasing their workand visibility (12.4 per cent) compared to theother two groups.
Fifty per cent of WNW have reported attendingtwo or more conferences or workshops a year.The highest proportion of women in this group (47.3per cent) has reported that their participation inconferences and workshops wasequal to that by menscientists. The least proportionof women in this group alsoreported that their participationwas lower compared to men’s(13.5 per cent). The highestmajority of responses from thegroup indicated that they attendedconferences and workshops tokeep themselves updated andlearn more (33.1 per cent). Theproportion of responses reportedthe WNW group indicatednetworking to be an importantreason for attending conferencesand workshops, which highercompared to the other groups (24.8 per cent).
Thus, the availability of opportunities forconferences and workshops fulfill animportant function for the different sub-groups of women scientists. - allowing WIRto showcase their work and learn more aboutthe work of colleagues and competitors; forWNR, it is also useful to help them keep intouch with Science and topics of their interestwhich they may have given up due toconstraints; and for WNW, it provides animportant mechanism to keep in touch withScience and with scientific networks, whichcan help them return to Science if they wantto. (Refer Appendix II, table 23 for details).
PERCEIVED REASONS FOR DROPPING-OUTFROM SCIENCE*
There have been several theories advanced to explainlow participation and low retention of women inScience. Further, the views on women’s participationand retention differ from that of scienceadministrators and policy makers. Most commonlyadvanced reasons cite the problem in terms ofwomen’s dual responsibilities that limit time for
scientific activities. Other reasons such as lack ofinterest and motivation are also commonly reported.An attempt was made in this study to elicit reasonsfrom the different sub-groups of women scientistsand men scientists for women leaving Scienceresearch. Further, an attempt was also made tounderstand what provisions would be useful to retainwomen in Science through this survey.
Note: The question was a multiple response question and the totalnumber of responses received exceed the actual number ofrespondents.
The graph shows a comparison of the reasonsreported by the sub-groups of womenscientists. Respondents were given a choiceof indicating up to four reasons for the poorretention of women in Science research.Among WIR, more than half of the responses(51.7 per cent) showed that they perceivedfamily responsibilities as the reason forwomen dropping out of Science. Disenablingorganizational factors such as lack offlexibility in timings, discriminatory workpractices, lack of enough number of womencolleagues, mentors and role models,restricted chances for participation, too fewwomen in decision-making posts, harassment,etc, have been also perceived as reasons forwomen dropping out of Science. One in everyfive responses of WIR sub-group (20.2 percent) report the above. Similar patterns ofresponses have been observed for the WNRand the WNW category with very smalldifferences.
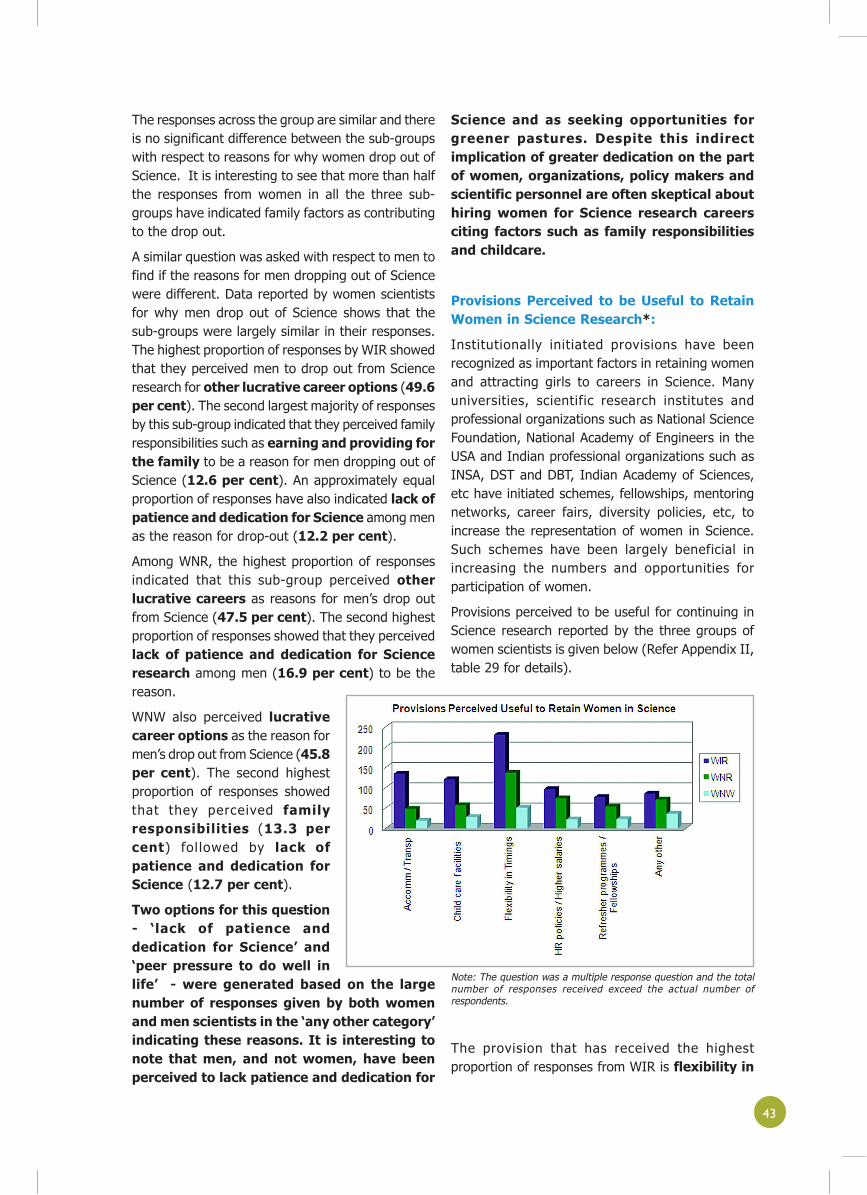
43
The responses across the group are similar and thereis no significant difference between the sub-groupswith respect to reasons for why women drop out ofScience. It is interesting to see that more than halfthe responses from women in all the three sub-groups have indicated family factors as contributingto the drop out.
A similar question was asked with respect to men tofind if the reasons for men dropping out of Sciencewere different. Data reported by women scientistsfor why men drop out of Science shows that thesub-groups were largely similar in their responses.The highest proportion of responses by WIR showedthat they perceived men to drop out from Scienceresearch for other lucrative career options (49.6per cent). The second largest majority of responsesby this sub-group indicated that they perceived familyresponsibilities such as earning and providing forthe family to be a reason for men dropping out ofScience (12.6 per cent). An approximately equalproportion of responses have also indicated lack ofpatience and dedication for Science among menas the reason for drop-out (12.2 per cent).
Among WNR, the highest proportion of responsesindicated that this sub-group perceived otherlucrative careers as reasons for men’s drop outfrom Science (47.5 per cent). The second highestproportion of responses showed that they perceivedlack of patience and dedication for Scienceresearch among men (16.9 per cent) to be thereason.
WNW also perceived lucrativecareer options as the reason formen’s drop out from Science (45.8per cent). The second highestproportion of responses showedthat they perceived familyresponsibilities (13.3 percent) fol lowed by lack ofpatience and dedication forScience (12.7 per cent).
Two options for this question- ‘lack of patience anddedication for Science’ and‘peer pressure to do well inlife’ - were generated based on the largenumber of responses given by both womenand men scientists in the ‘any other category’indicating these reasons. It is interesting tonote that men, and not women, have beenperceived to lack patience and dedication for
Science and as seeking opportunities forgreener pastures. Despite this indirectimplication of greater dedication on the partof women, organizations, policy makers andscientific personnel are often skeptical abouthiring women for Science research careersciting factors such as family responsibilitiesand childcare.
Provisions Perceived to be Useful to RetainWomen in Science Research*:
Institutionally initiated provisions have beenrecognized as important factors in retaining womenand attracting girls to careers in Science. Manyuniversities, scientific research institutes andprofessional organizations such as National ScienceFoundation, National Academy of Engineers in theUSA and Indian professional organizations such asINSA, DST and DBT, Indian Academy of Sciences,etc have initiated schemes, fellowships, mentoringnetworks, career fairs, diversity policies, etc, toincrease the representation of women in Science.Such schemes have been largely beneficial inincreasing the numbers and opportunities forparticipation of women.
Provisions perceived to be useful for continuing inScience research reported by the three groups ofwomen scientists is given below (Refer Appendix II,table 29 for details).
Note: The question was a multiple response question and the totalnumber of responses received exceed the actual number ofrespondents.
The provision that has received the highestproportion of responses from WIR is flexibility in

44
timings (30.9 per cent). Such policies that allowsscientists a three hour bracket to chose from to startand close the day can increase efficiency and helpthem manage both house and office work. This willmean that scientists will start their office hoursbetween 7 and 10 am and close it respectivelybetween 4-7 pm in the evening. Such gender neutralfacilities that will be useful to women as well as menhave already been adopted in Western countries,corporate companies and in select elite Scienceresearch institutes in India.
The second highest number of responses have beenreported for provisions of accommodation closeto workplace and transportation facilities(18.1 per cent). Similarly childcare facilities atworkplace were also considered importantprovisions by this sub-group (16.2 per cent).
Among WNR, the highest proportion of responseshave also reported flexibility in timings as animportant provision to retain women in Scienceresearch (31.1 per cent). This was followed byprovisions of better HR policies (16.8 per cent).Other factors such as job security, reservations,congenial working atmosphere and age limitrelaxations, have also been reported as useful toretain women in Science research (16.1 per cent).
The highest proportion of responses by WNW haveshown that they too perceived flexibility in timingsas the most important provision (28.5 per cent). Asecond largest proportion of the responses haveindicated other factors such as job security,reservations, congenial working atmosphere and agelimit relaxations to be important (20.1 per cent)while 15.6 per cent of the responses have indicatedthe need for childcare facilities at theworkplace.
The differences among the sub-groups withrespect to perceived provisions are significantat the 0.01 level. The differences in theperception of provisions between the sub-groups is an important indicator of theheterogeneity of the groups, and the need toaddress their individual needs instead offorming blanket policies that may not suit allsub-groups.
More importantly the provisions perceived asuseful also differed significantly across thedifferent age groups. Among the youngerwomen (below 40 years) childcare has beenreported as an important provision by a higher
percentage of the group (39.8 per cent)10 whileother considerations such as job security, agelimit relaxation, etc, have been moreimportant for the 40 years and above agegroups. Lesser women in the 50 years andabove have also considered provisions suchas accommodation, transportation andflexibility in timings to be useful in retainingwomen in Science research.
This may perhaps be because of severalreasons:
· Women in the older age group may haveolder children and fewer domesticresponsibilities, thus requiring lesserorganizational provisions to balance careerand family, if the reference point for theirresponse has been themselves;
· It could also be that they may have hadgreater family support with domestic andhousehold responsibilities, since the jointfamily system was largely prevalent up tothe 1990s.
· Women in the older age group may alsohave accepted the system as it was giventhe fact that the relative representation ofwomen in Science was much lower duringtheir period of active Science research.
· Further, it is with the advent of the newcorporate culture, particularly with theadvent of Bio technology, InformationTechnology and software sectors thattechnological advancement and newprovisions such as flexi-time, transport andwork from home options gained currency.Hence, it is likely that these provisions, asindicated more by the younger groups, maybe a reflection of the changing times. Itwould be important to analyze in depth thereasons for the differences in perceivedprovisions that would be useful for womento continue in Science research.
More importantly, the differences inperception of useful provisions among thedifferent age groups indicates the need tobalance policy making and decision makingcommittees with younger women since theycould have important inputs to contribute. Thetrend of appointing only senior and retiredfaculty to such important decision makinggroups needs to be revisited in this context.

45
Significant differences were found in theprovisions considered useful to retainwomen in Science research among thedifferent sub-groups of women. While allthree sub-groups perceived flexibility intimings to be useful, more WIR haveperceived provisions of accommodationand transportation to be useful. MoreWNR have perceived HR policies to beuseful, while more WNW have perceivedprovisions such as job security, age limitrelaxations, congenial workingatmosphere, etc to be useful. Thedifferences in perception perhaps reflectsthe particular experiences of theindividual sub-groups and the nature ofdifficulties they face in balancing careerswith their other responsibilities.
The data importantly reveals the need forpolicies to refrain from developingblanket-provisions that do not meet theneeds of all women scientists, butperhaps address the needs of thosealready in Science. Further, thedifferences seen with respect to thedifferent age-cohorts importantlyindicate the need to reorganize decisionmaking/standing committees at Nationaland State level to promote theparticipation of women in Science to havemembers also from the younger agegroups so their views and experiences arealso represented.
III. COMPARATIVE STUDY OF WOMEN ANDMEN IN SCIENCE
A comparison was made between WIR and MIR. Thisgroup is operationally defined as those who areengaged in research in some form and are holdingtenured positions. These women and men scientistsare either engaged in only research(includingtechnology based research), or engaged in researchalong with teaching at the graduate and/orpostgraduate level. A comparison of these two groupswas undertaken as a part of the survey to observewhether differences in research and workproductivity, educational performances and the
balance of work and family life, are responsible forthe lower participation of women in scientific researchand teaching when compared to men. Other factorssuch as organizational profiles were also studied tosee whether organizational environment andorganizational factors affect women’s participationin Science research. The analysis has been conductedfor the WIR and MIR groups only for two reasons: itterms of sampling, the number of men in the ‘not inScience research’ category and ‘not working’ categorywas comparatively lower and hence did not lend itselffor comparison. Secondly, the comparison attemptsto analyze whether within scientific organizationswhere women’s representation is lower, individualcharacteristics of women and men influence women’sparticipation, and if organizational characteristicsplay a significant role in creating situations thatexclude women in scientific organizations.
ORGANIZATIONAL FACTORS
No. of Working Hours
Although the literature in this field does notindicate variation in the number of workinghours between women and men scientists, theresults of this study showed otherwise.. Thecommonly held perception that women arenot able to put in the long hours of workrequired for scientific research was notvalidated by this study. This commonly heldperception is not only among the menscientists but very often expressed by womenscientists as well. Some studies also indicate thatboth men and women put in the same number ofhours at work, with men reporting slightly highernumber of hours on an average (Campion and Shrum,2004).
A majority of the WIR in our study have reportedworking 40-60 hours on an average per week(62.8 per cent). This is higher than the percentageof men who have reported the same. Also, thepercentage of women who have reported workingbelow 40 hours is significantly lower compared tomen (16.6 per cent) (Refer Appendix III, table 41for details).
Forty-six per cent of MIR reported workingbetween 40-60 hours on an average per week.A higher proportion of MIR, compared to WIR, havereported working above 70 hours per week onan average (11.2 per cent). A higher per cent of

46
MIR have also reported working below 40 hoursper week (25.5 per cent) compared to women.
The difference in working hours for MIR andWIR is statistically significant at the 0.01level. It is however interesting to note that overall,more WIR have reported working 40 or more hoursper week (83.3 per cent) compared to MIR (74.5per cent). Contrary to the common understandingthat women are able to spend less time at work dueto multiple responsibilities the study showsotherwise. This finding is also contrary to the resultsof the Campion and Shrum (2004) study, who havestated that men spend marginally higher time at workthan women, and that this was not statisticallysignificant. While this finding needs to bevalidated through a larger sample, one needsto take note of the fact that, women, evenwhen they balance their work and home, donot compromise on the hours of work.However there is a caveat that the hours ofwork cannot alone be a measure of the outputand quality needs to be examined alongside.
Reasons for Taking the Present Job*
The question was asked to 312 WIR and 161 menwho are currently employed. This was a multipleresponse question with a maximum of four responsesper respondent.
One third (34.5 per cent) of the responses by WIRreport professional advantages andopportunities to be the reason for accepting theirpresent posts. Nearly one in five responses (18.8per cent) by WIR reported enjoyment andsatisfaction as the reason for taking the post. Onein ten responses (10.2 per cent) by WIR reportedorganizational factors such as flexible timings,congenial atmosphere, provisions of daycare,transport, accommodation, etc. as reasons for takingthe post. Organizational factors has once morefigured as important with a higher percentage ofresponses from WIR compared to MIR (10.8 percent) (Refer Appendix II, table 44 for details). Itmay be useful to note that while, the organizationalstudies of S&T institutions have not received the kindof attention it should, it could perhaps be animportant area of research to throw light on ways ofretaining women in Science. This is perhaps not thecase in business or industries where organizationalfactors have been studied in depth and have provideduseful insights to help them move forward.
One in every three responses (33.5 per cent) ofMIR report professional advantages andopportunities as the reason for taking the currentpost. One in five responses of MIR (21.6 per cent)also report enjoyment and personalsatisfaction as an important factor. Among otherreasons for taking the current post, 15.9 per centof responses by MIR have reported autonomy inresearch, previous association with theorganization, etc, as the reasons.
The reasons reported by MIR and WIR aresignificantly different at the 0.01 level. It seemsthat for women, flexibility and organizationalprovisions play an important role in choice of work,and this finding is important as it provides directionsfor the need to change at the organizational level inS&T institutions. The percentage of WIR (15.4 percent) and MIR (13 per cent) reporting familyfactors as responsible for the choice of job, thoughcomparatively lower than the factors discussedabove, is important. Therefore together,organizations that provide special provisions forwomen and men, and also allow them to balancefamily with careers, can go a long way in increasingwomen’s participation, retention and optimalperformance in Science research.
There is a significant difference betweenWIR and MIR with respect to reasons fortaking up present posts. A similarproportion of women and men havereported reasons such as professionaladvantages, enjoyment and satisfaction,and family factors. However, asignificantly higher proportion of womenhave reported organizational factorscompared to men.
The proportion of women and men whohave reported family factors is notinsignificant and hence needs attention.It is interesting to note that for almostequal proportion of men and women,family factors play an important role inselection of jobs. Hence gender neutralorganizational policies and facilities canbe useful provisions for both women andmen.

47
Career Breaks*:
A comparison was made between women and menscientists to identify whether breaks were a factorresponsible for the large number of women leavingscientific careers. A significantly higher number ofwomen compared to men have reported breaks. Withrespect to reasons for breaks, more than one reasonwas given for the breaks by each respondent. Therehas been a clear variations in the reasons reportedfor breaks in career by WIR and MIR (Refer AppendixIII, table 45 for details). A majority of responses byWIR have indicated care for children and/orelders as reasons for taking breaks. On the otherhand, for MIR reasons such as health reasons, forfurther studies or temporary nature of jobs have beenreported.
For WIR, child and elder care and other familyfactors such as marriage or father’s / spouse’stransfer have accounted for 56.6 per cent of theresponses as reasons for the break.
In contrast, a majority of the responses receivedfrom MIR (6, 85.7 per cent) have indicated otherreasons such as completing PhD, further study,health reasons, voluntary retirement, etc.
The difference between WIR and MIRwith respect to reasons for taking breaks,is significant at the 0.01 level. Thus, whilefor men the choice of breaks has beenlargely voluntary and personal s, forwomen the breaks have been taken tofulfill family needs and responsibilities.
RESEARCH AND NETWORKING
Papers and Patents11
A majority of women scientists (549, 96.7 per cent)and all men scientists (226) have reported havingpublications or patents.
Four hundred and eighty-one WIR, i.e., 84.7per cent have reported publishing joint/multi-author research papers in refereed journals.44.5 per cent of WIR reported publishingindividual research papers in refereedjournals. A comparison of the WIR in terms ofindividual publications and joint / multi-authorpublications show that a higher number of womencompared to men reported individual publications.(Refer Appendix III, table 46 for details)
Two hundred and ten men (92.9 per cent) havereported publishing joint / multi-author researchpapers in refereed journals. 38.1 per cent ofmen report publishing individual papers inrefereed journals. More than half (56.6 per cent)of MIR report publishing joint/ multi-authorconference articles / proceedings or abstracts(128, 56.6 per cent). A close look at the tablereveals that men have more multi-author publicationswhen compared to individual publications thanwomen. It can also be see that MIR also havesubstantial number of multi-author publications inconference abstracts/proceedings that will possiblygive them greater visibility. The ability to travel toattend these conferences, given the fact that familyresponsibilities are taken care of by the women, andhaving greater skills at networking may have helpedthem in undertaking multi-author work. This hasworked as a advantage for men in comparison towomen. The modus operandi of getting involved injoint work stems from meeting people, andconferences are a useful vehicle in this endeavour.
While the difference in the rate of individual andjoint publications is noted above, it is important toanalyze this data in relation to the disciplines in whichthe papers have been published, since there is adifference in the pattern of individual and jointpublications across various disciplines. An analysisof the educational backgrounds of the surveyedrespondents did not show large variations betweenwomen and men, except with respect to engineeringand technology. Therefore, perhaps the differencesnoted in publications may still be valid.

48
Conferences and Workshops*
Note: The question was a multiple response question and the totalnumber of responses received exceed the actual number ofrespondents.
With respect to conferences andworkshops, a majority of both womenand men scientists reported attending atleast more than two in a year.
A majority of WIR have reportedattending conferences and workshopstwice or more a year (200, 64.1 percent). With respect to reasons forattending conferences and workshops,31.3 per cent of the responses by WIRshowed that they did so to keepthemselves updated or learn more.23.1 per cent of the responses showed‘Networking’ to be another important reason. WIRalso reported interest in topic (21.8 per cent)and showcasing work or for visibility (16.9 percent) as reasons for attending conferences andworkshops.
A majority of MIR reported attending conferencesand workshops twice or more in a year (116, 72per cent). 31.8 per cent of the responses by MIRreported attending conferences and workshops tokeep themselves updated or learn more. Onefourth of the responses by MIR (27.1 per cent)showed Networking to be an important reasonand 8.5 per cent of the responses by MIR indicatedgaining soft skills as the reasons for attendingconferences and workshops (Refer Appendix III,table 47 for details).
PERCEIVED REASONS FOR DROPPING-OUTFROM SCIENCE*
A majority of WIR (59.3 per cent) andMIR (47.2 per cent) surveyed haveperceived women to drop out ofScience. However, a relatively higherper cent of men than women scientistsperceive that both women and mendrop out of Science.
Note: The question was a multiple response question and the totalnumber of responses received exceed the actual number ofrespondents.
A majority of the responses by WIR have shownthat they perceive family commitments as thereason for women dropping out of Science (51.7per cent). The second highest proportion ofresponses have indicated organizational factorssuch as flexibility in timings, availability of womencolleagues and mentors, chances for participationand promotion, few women in decision making posts,harassments, etc as reasons for women droppingout of Science (20.2 per cent).
A majority of the responses of MIR indicated thatthey also perceived family commitments asreasons for women dropping out of Science (58.5per cent). The second highest number of responsesby MIR also showed organizational factors as animportant reason (14 per cent) for women droppingout of Science. A higher proportion of responses of

49
MIR, when compared to WIR, showed socio-cultural factors and the conservative natureof society as reason for women dropping out ofScience (Refer Appendix III, table 48 for details).
The study also explored reasons for why men dropout of Science. A majority of the responses of WIRshowed that men drop out of Science in search ofother lucrative careers (49.6 percent). Among other reasons for mendropping out os Science WIR reportedfamily responsibilities such asearning and providing for family (12.6per cent) and lack of patience anddedication among men for Science(12.2 per cent) as reasons. A higherper cent of women compared to menhave indicated family responsibilities asa reason.
The highest percentage of responsesfrom MIR indicated other lucrativecareer options as the reason for men droppingout of Science (53.2 per cent). Lack of dedicationand patience in men for scientific careers hasreceived the second highest proportion of responseseven from the men’s group (14.5 per cent) (ReferAppendix III, table 49 for details).
WIR and MIR differ with respect to whywomen drop out of Science. Thesedifferences may be important as theyhave implications for policies developedto address the problems of women inscience. With men forming the majorityof most science organizations, and moremen heading decision makingcommittees, which can take significantactions and make significant efforts inincreasing women’s participation inscience, lesser importance given toreasons such as organizational factors, orlack of sufficient jobs, and greaterimportance given to familyresponsibilities may lead to the formationof inadequate policies that did notaddress these women’s concerns.
Provisions to Retain Women in ScienceResearch*
The survey also collected information regardinguseful provisions to retain women in Scienceresearch. Both WIR and MIR reported. Flexibilityin timings12 as an important provision to retainwomen in Science.
Note: The question was a multiple response question and the totalnumber of responses received exceed the actual number ofrespondents.
Nearly one in every three responses of WIR (30.9per cent) reported flexibility in timings to be animportant provision to retain women in Science. Onein five responses reported by WIR (18.1 per cent)indicated provisions of accommodation andtransportation to be equally important. Betterchildcare facilities at the workplace have alsobeen more frequently reported by WIR (16.2 percent of the responses) compared to men.
An approximately equal proportion of responses ofMIR have indicated flexibility in timings as animportant provision to retain women in Science (29.6per cent). Other factors such as awareness,motivation campaigns, sensitizing family and society,ensuring jobs for women, allowing couples to workat the same institute, safety in the workplace, etc,have been considered important provisions to retainwomen in Science by MIR (17.8 per cent). A higherproportion of MIR have also reported refresherprogrammes and fellowships as critical for retainingwomen in Science research compared to WIR (17.5per cent).

50
Thus, the provisions consideredimportant by WIR and MIR to retainwomen in Science differed significantlyat the 0.01 level. While WIR indicatedprovisions that will helped them balancecareer and family, MIR indicatedprovisions that would increaseopportunities for women, and wouldensure fair play in the practice of Science.Provisions to retain women in Sciencemust use a combination of the factorsreported by both WIR and MIR. Thedifference in perception is important andis a clear pointer to prioritizeorganizational changes. This is not toundermine the attention to be paid tofamily and societal factors but more tomake a point that changes cansimultaneously occur in the sphere of thefamily, workplace and society. A multi-pronged approach would be extremelyuseful if one would want to address thecomplex question of retaining women inScience.
Note:
Questions marked with an asterix (*) were multipleresponse questions and the total number ofresponses received for those questions exceed theactual number of respondents.

51
Women Scientists: Women in ScienceResearch(WIR), Women not in ScienceResearch (WNR), and Women not Working (WNW)
The complexity of developing interventions to retainwomen in Science stems from the diversity in thecharacteristics of women scientists across thedifferent sub-groups of women in Science. Thedifferences also perhaps stem from the differentpriorities the groups have, because even with severalcommonalities among demographic profiles of thewomen, differences on important aspects such asprofessional prospects vs. childcare or familyresponsibilities are seen.
An analysis of the sample details reveals that whilea majority of all the three sub-groups of womenwere married, the highest percentage of WIR were‘never married’ (14.1 per cent). Women who were‘never married’ were distributed across all agecohorts. A majority of the three sub-groups alsoreported having children who were over 15 years.However, more WNW (across all age groups) hadyounger children (between 0-5 years) comparedto the other two sub-groups.
A majority of the women also reported living innuclear families. A significantly higher percentageof WNW reported having received no help withchildcare. Thus for WNW, the absence of supporteither by choice or compulsion could perhaps bean important reason for their dropping out ofScience. In contrast, WIR and WNR reportedreceiving help from a combination of agencies liketheir parental family, marital family andprofessional help.
Interestingly, a significantly higher proportion ofWNW have also had spouses in the same field ororganization, and this could have been anothermajor factor contributing to their drop out.
With respect to organizational details, professionaladvantages and opportunities and getting jobshave been the main factors influencing jobselection. A majority of the responses from allgroups indicated not getting jobs as theprimary reason for not taking up postsapplied to. While more WIR and WNR haveindicated better professional prospects as
reasons for not taking up the posts, none of theresponses from WNW indicated this reason.
With regard to leaving previous jobs, betterprofessional prospects have been the mostimportant consideration for WIR and WNR,while the temporary nature of the post hasbeen the reason most often stated by theWNW. Family reasons have also been reportedas the an important factor by WNW for leavingjobs.
WIR and WNR also significantly differed withrespect to reasons for accepting present post. Agreater proportion of WIR reportedprofessional advantages as a reason fortaking up the post, while for WNR otherreasons such as lack of other suitableoptions, freedom and autonomy in work,permanency of position, etc, figured as animportant reason.
In terms of working hours, both WIR andWNR have reported working between 40-60 hours per week on an average. However,a higher per cent of WIR have reported workingfor 60 hours or more per week compared to WNR,while a greater per cent of WNR have reportedworking between 20-40 hours per week comparedto WIR.
With respect to breaks in career, there is asignificant difference in the reasons reported bythe sub-groups. While childcare and elder carehave been important reasons for all three groups,more WIR have reported other familyfactors such as marriage, husband’s orfather’s transfer as significant reasons;more WNR have reported further studies,health reasons or non-availability offellowship due to age limits; while WNWhave reported difficulties in finding jobs andinstitutions as a significant factors forbreaks in career.
Having noted that there are differences betweenthe three groups of women scientists with respectto reasons for not taking up jobs, or leaving jobs,as well as reasons for breaks, it is hardly surprisingto note the significant differences between thegroups with respect to the provisions considered
SUMMARY AND RECOMMENDATIONS

52
important by them to retain women in Sciencecareers. While all three groups haveconsidered flexibility in timings to be themost important provision, they differ withrespect to other useful provisions. For WIR,who continue to juggle between scientificresearch and teaching careers on the onehand, and family responsibilities on theother, provisions for transportation andaccommodation are important. For WNR,better HR policies have been reported asimportant provisions to retain women inScience. For the third group of WNW,childcare facilities at the workplace arereported as important.
Summary of Women in ScienceResearch(WIR) and Men in Science Research(MIR) :
The analysis of the educational, work and researchprofiles of women and men in research is importantto identify factors that differentiate between womenand men differ, and subsequently contribute to theiradvancement or dropping out from Science.
The data analysis reveals the following:
Sample details have shown that while 14 per centof WIR were ‘never married’, only 2.5 per centMIR report being ‘never married’. In comparisonto 39 per cent women who reported that theirspouses were doctorates and 40 per cent whoreported that their spouses were in Science, only16 per cent men reported that their spouses weredoctorates and 19 per cent reported that theirspouses were in Science.
86 per cent men scientists compared to 74 percent women scientists reported having children.A higher proportion of WIR spent between40-60 hours per week at work compared toMIR; while a higher percentage of MIRreported spending less than 40 hours perweek at work compared to WIR when theirchildren were growing up.
With respect to employment and organizationalfactors, it was observed that a significantly higherproportion of women (46.8 per cent) comparedto men (33.5 per cent) reported workingbetween 40-60 hours per week. More menreported working less than 40 hours perweek compared to women.
For both women and men, getting jobs andprofessional advantages and opportunities havebeen important reasons in determining present andprevious jobs. More men compared to women havereported leaving previous posts for betterprospects. For men and women approximatelyequal proportion of responses were reportedindicating family as an important factor in takingup present posts. However, the proportion ofresponses reported by women indicatingorganizational factors such as flexible timings, daycare facilities, transportation and accommodation,etc for taking present posts is higher compared tothe responses from they men scientists. Theimportance of organizational provisions to helpwomen balance careers and domesticresponsibilities have been highlighted by this data.
Men and women differ significantly with respectto breaks in career also. A significantly lowerproportion of men have reported breaks in careercompared to women. While personal factors suchas health, further studies and voluntary retirementhave led to breaks for men, for women, domesticresponsibilities of childcare and care for elders havebeen the primary reason for the breaks in career.
Perceptions regarding why women drop out ofScience also differed between the groups. Whilehigher responses from men have indicated familyand socio-cultural factors, women have perceivedorganizational factors such as lack of flexibility intimings, lack of role models and mentors,discouraging and uncongenial atmosphere, etc tobe responsible for women dropping out fromScience.
Men and women differed with respect to theprovisions that have been considered importantto retain women in Science. While a majority ofWIR and MIR have reported flexibility intimings as an important provision, a largerpercentage of responses by MIR indicatedthe need for refresher courses, fellowships,awareness and sensitization campaigns toretain women in Science. In contrast,women perceive provisions such asaccommodation and transportation asprovisions that would help them balancetheir career and family. Since most scientificorganizations have a greater proportion of mencompared to women, especially on decision-making posts, the differences in understanding ofthe problem between men and women could haveimportant implications. Provisions that aredesigned without taking into account the

53
experiences of both, women and men, who arepart of this work space will not yield the desiredresults. Thus, it may be important to considerthe view points of gender sensitive menscientists along with gender sensitivewomen scientists who have a nuancedunderstanding of the complex functioningof S&T organizations. It must be emphasizedthat the S&T organizations in our country are variedand hence experiences of one organization cannotrepresent the other. Sociological studies of S&Torganizations with a democratic multidisciplinary team will go a long way toprovide useful insights that will help thecountry frame policies that can retain thetalent pool of both women and men.Excluding the experiences of women in Sciencecan lead to inadequate provisions. Thus, it isimportant that more women are representedon committees and decision making poststo influence the policies that can beconducive to women.
RECOMMENDATIONSThe primary purpose of the study was to develop acomprehensive set of recommendations and policydirections that are evidence-based and that wouldmotivate and retain women in Science research.Various bodies have dealt with this issue andformulated recommendations based on data and/orgroup discussions, meetings and suggestions as wellas feedback from various women scientists. Someof these recommendations are available in reportssuch as:(1) ‘Science career for Indian women: Anexamination of Indian women’s access to andretention in scientific careers’ (October 2004) byIndian National Science Academy (INSA). (2)‘Women in Physics in India’ by Rohini Godbole,Neelima Gupte, Pratibha Jolly, Shobhana Narasimhanand Sumathi Rao presented at the Second IUPAPConference on Women in Physics held at Rio deJaneiro, Brazil between May 23-25, 2005. (3)‘Evaluating and enhancing women’s participation inscientific and technological research: The IndianInitiatives’ (January 2010) by National Task Forcefor Women, Department of Science & Technology,Government of India.Interestingly many of the recommendationsmentioned in the above reports find resonance withthe recommendations of this report. However, sincethis study for the first time has included sub- groupsof women scientists and men scientists that were
not covered by the earlier reports, several differentand nuanced recommendations have emerged fromthis study.
The recommendations have been developed throughinteractions with a wide range of women and menscientists from different parts of the country. Whilethe purview of the survey covered only those with aPhD in Science, Engineering or Medicine, adequatecare was taken to represent members from a rangeof scientific organizational settings like autonomousinstitutions, research organizations, universities andcolleges, industries that are government owned andprivate sectors. For the first time, this study hascovered women scientists who may not be currentlyemployed as well as men scientists. The dataconvincingly revealed that the groups were nothomogenous and the diverse experiences of the sub-groups of women scientists and men scientists hasvitally informed our recommendations. Thus, themyth of ‘one size fits all’ accepted by Sciencepolicy makers has been questioned throughthis study and an attempt was made to representthe many different voices and needs that Sciencepolicy makers have to respond to if there is to be aserious engagement with the central question ofattracting and retaining women in Science.
Integral to retaining women in Science is acquiringinformation on the number of women PhDs inScience. An important move in this direction will beto build on the existing database created by the IASon a mission mode by assigning dedicated staff andtargeting completion of a comprehensive databasewithin one year’s time. It will also be important todedicate resources to the continual maintenance andup-gradation of the database to reflect currentinformation and trends. Since women and also menwho have dropped out of Science are difficult tolocate, media drives and campaigns throughtelevision and newspapers wil l have to beundertaken.
Important headway can be made byaddressing organizational and infrastructuralfacilities as well as undertaking policychanges that may be critical to attract andretain women in Science research. Suchchanges need to move beyond the traditionalframework that locates societal and familyresponsibilities as singular factors responsiblefor women dropping out of Science.
The data has importantly revealed close to 85 percent of the women who are pursuing activecareers in research have competently and invery different ways balanced families and

54
careers. Among those in scientific researchapproximately 14% per cent have reportedbeing ‘never married’ and are distributedacross all disciplines. Among the largest majorityof those married, never married, with or withoutchildren, family and societal pressures havebeen a small but significant factor reportedfor not taking up the job . Even among thosewho are currently not working, the correspondingfigure is only 3.3% indicating that family andsocietal pressures cannot explain completelywhy women drop out of Science.
These facts are important indicators ofwomen’s commitment to pursue scientificresearch. Institutional support through‘gender-neutral’ facilities and policies will bevital in attracting and retaining women inScience. These policies in turn will have a spin-off effect in redefining ‘gender roles’ at homethat could maximize the productivity ofwomen and men scientists. In essence, thiswill lead to maximizing the productivity of theorganization on the whole.
Gender neutral facilities and policies are alsoimportant to prevent, on the one hand, thestereotyping of gender roles and on the other,the stigmatization of women for privileged orspecial treatment. In the West there has alreadybeen a recognition of the importance of having suchgender-neutral facilities and interestingly many menhave availed its benefits. A caution in this regardwould be however useful. Periodic reviews of thenew policies are essential to make sure thatthey do not work against the interest ofwomen in particular and Science practice ingeneral.
ORGANIZATIONAL / INFRASTRUCTURALPROVISIONS
A. Provisions to manage career andhome: Provisions of on campus housing,transportation13, state of art child care and elder carefacilities as well as professionalized domestic helpshould be provided for both women and men facultyat all S&T organizations. This should includeuniversities, research organizations and autonomousorganizations. These provisions are important forscientists to manage their family responsibilities.This will release their time and energy that can beutilized for their scientific research activities. Priorityaccommodation and childcare and eldercare facilities
for those with young children and elders would beimportant.
B. Flexibility in timings: The data revealedthat despite multiple responsibilities, a higherproportion of women scientists in research reportedworking between 40-60 hours per week than menscientists. However flexibility in timings will benefitboth women and men scientists.
It is important to evolve a gender neutral policy offlexible timings in all S&T organizations that allowsone to manage multiple responsibilities. This is notto be construed to mean that scientists would wantto work from home and not spend time in thelaboratories. Rather, it is an indication thatorganizations are willing to introduce policies thatwill allow a greater participation of scientists toengage with research. The policy will have extendedoffice hours which will give a margin of three hoursfor starting and closing work officially. This will meanthat scientists will start their office hours between 7and 10 am and close it respectively between 4-7 pmin the evening. Work can be organized by thescientists so as to use the official timings to interfacewith the administration if necessary and to holdofficial meetings at a time when convenient for allteam members. The quorum required fordepartmental meetings should have an acceptablerepresentation of both genders. The extra timemargin provided could be used productively onresearch.
C. Opportunities for networking andcollaboration: Increasing opportunities fornetworking and collaboration through increasednumber of travel grants; organizing workshops andconferences dedicated to facilitate collaborations;integrating sessions in conferences and workshopsfor honing networking skills are important and suchmeasures to enhance it among women scientistsneeds attention. In considering applications forconferences and workshops, it is important to ensurethat there are adequate number of applications fromboth women and men through active pursuit14. Theselection must take care of representing membersof both groups, even while specifying the meritcriteria. It would be important to have a transparent,publicly displayed checklist indicating therequirements for merit based selection, both toencourage more women to apply through knowledgeof these criteria as well to ensure transparency inthe selection procedure.

55
Mentoring: Mentoring mechanisms and integratingsessions during workshops and conferences toenhance capabilities of women scientists areimportant factors in attracting and retaining womenin Science. As adopted by some corporates,mentoring can also be encouraged by institutingofficial policies that pair senior and junior colleaguesto provide for guidance. Providing incentives formentoring of women scientists and linking it as anassessment criteria on annual reviews andpromotional reviews should be mandatorilyintroduced.
POLICY CHANGES
D. Policy on transparency in selection andevaluation procedures: All institutions must makeavailable the criteria for selection and promotion ofall faculty. According to literature the availability ofactual selection criteria helps increase the pool ofwomen applicants and builds confidence amongthose who contemplate whether to apply or notbecause of the low success rate for women. Studieson the hiring practices of institutions can providevital clues to the evaluation procedures and qualitiesperceived as desirable for a good candidate. Suchstudies would also help institutions develop a readychecklist to be made available to all candidates duringselection.
E. Policy on Time Bound TargetRecruiting System (TRS): For institutions that donot have adequate representation of women at alllevels, starting from students to faculty (includingAssistant Professors, Associate Professors,Professors, Deans, etc), develop a time boundrecruitment target system(TRS). This should bebased on the current representation of women inthe institution as well as the age and the size of theinstitution. Make it mandatory for institutionsto review TRS based on outcomes15 ratherthan restricting it to providing opportunitiesor process based.
F. Increase in recruitment of women topremier research institutions: The governmentmust proactively increase the number of womenscientists in premier institutions to break thestereotype that women scientists are best as collegeor university teachers. Increasing the number ofwomen in premier institutions that gets greatervisibility; that have comparatively higher resourcesand better infrastructural facilities, will have a far
reaching impact on women wanting to choose ascientific career.
G. Mandatory disclosure of gender break-up of faculty and students across departmentsand levels: It must be mandatory that every S&Torganization, within a time frame, puts up genderdisaggregated data of their employees at every levelstarting from students to the professors and deans.The data must be presented department wise.
H. Mandatory composition of one-thirdwomen members in committees: It must bemandatory that all decision-making committees, likethe search/ selection/hiring committees, committeesthat decide on promotions at all levels as well asother decision-making committees have at least onethird women representation (or work towards itwithin a specific time frame). Efforts to get womenrepresentatives from outside the institution, city andstate must be explored. It would also be importantto make mandatory a rotational system of selectionof women representatives to different institutionalas well as national committees based on merit. Thiswill give opportunities to all women to be a part ofthe decision making process. It will broad base theparticipation of women scientists and hence becomemore representative.
Further as the study data has shown, perceptionsand experiences of different age cohorts of womenin Science are very different. More importantly,the differences in perception of usefulprovisions among the different age groupsindicates the need to balance policy makingand decision making committees withyounger women since they could haveimportant inputs to contribute. The trend ofappointing only senior and retired faculty tosuch important decision making groups needsto be revisited in this context. In other wordsmembership to these committees should notbe monopolized.
I. Introduction of Long-term schemes forre-entry: There is a need for modification ofexisting re-entry schemes to cater to long termworking opportunities for women and men whoreturn to scientific career after a break. Provisionsfor short term schemes, temporary positions and postdoc positions limit the potential attracting andretaining them in scientific research careers. It wouldbe important to ensure complete autonomy for thesescientists by making it mandatory for all governmentsupported institutions or labs to take them onindependent projects. To optimize the use of lab

56
facilities supported by the government, incentivescan be given to these institutions for having takenmore independent researchers on governmentschemes. These scientists can be subjected to areview processes once in five years as done in thecase of scientists who are in tenure track positions.Facilities for these scientists like travel grants, PF,transport facilities, and child care/care of elders mustbe extended. It would be important to ensure to theautonomy of these women (or men) scientists. Thiscan be achieved through the constitution of a localadvisory committee that can guide and review theirwork, rather than linking the fellowship to theidentification of a faculty member at a particularinstitute.
J. Increase in job opportunities: The studyhas highlighted the lack of job opportunities in formalspaces in S&T organizations as a significant factorfor women dropping out of Science. While efforts toincrease job opportunities in S&T organizations mustbe made, it may be useful to create entrepreneurialopportunities in S&T fields that require training atthe highest level through the creation of venturecapital. A support mechanism at the national andstate level needs to be created for such an enterprise.
K. Creation of scientific infrastructurethrough venture capital: Alternatively, additionalinfrastructure and lab facilities to increase jobopportunities in basic Sciences through the creationof venture capital could be explored. This couldincrease the capacity of the formal workspace relatedto S&T.
L. Policy on employment of spouses inthe same organization: The study has revealedthat the largest proportion of women who wereunemployed had spouses who worked in the samefield or organizations. A higher proportion of thisgroup also reported that they had difficulty in findingjobs as reasons for their breaks. Together, this datahighlights the importance of ensuring thecontinuation or accommodation of spouses in thesame organization or at least within differentorganizations in the same city or town to preventthe loss of trained scientific women power. It shouldbe made mandatory for all S&T organizations to stateit upfront and bring into practice employing coupleswhen found qualified. This is particularly relevantwith respect to small cities and towns whereopportunities for Science research are limited to oneor two institutions. The government agencies mustplay a proactive role in facilitating employment ofthe spouse when the other is transferred to preventthe loss of trained scientific human power.
Alternatively, provisions to carry the jobs to othermutually agreed upon institutions at other parts ofthe country, when the spouse is transferred shouldalso be introduced to help women continue theircareer without breaks. Such a provision can begender neutral as it would be helpful for men also torelocate while continuing on the job, when their wivesare transferred.
M. All recommendations need to bereviewed periodically to make sure that stepstaken to attract and retain scientific humanpower (including men) are not detrimental tothe interest of promoting equality.
The recommendations developed here are the firststep towards understanding and addressing theissues of the diverse groups of women in Scienceresearch. Several more research studies is requiredto understand the complex process of women’schoices with respect to careers in Science.

57
INTRODUCTION:
1 Kapil Sibal, Former Minister for Science & Technology(at a conference on ‘Women’s Impact on Science &Technology in the New Millennium’, organized by the ThirdWorld Organization for Women in Science, 2005).
2 As cited in Kumar (2009).
3 As quoted in Science Career For Indian Women: Anexamination of Indian women’s access to and retentionin scientific careers. INSA Report, October 2004.
METHODOLOGY:
4 Treating the two working groups of women – WIR andWNR as independent groups was important for this studyin keeping with the objective of the study which was tounderstand the factors responsible for loss of womenfrom scientific careers that require training at the doctorallevel such as scientific research.
ANALYSIS:
5 Flexibility in timings is a gender neutral provision thatwould allow both women and men scientists to maximizetheir output through better management of the day.Flexibility does not imply a complete change in theorganizational day. Rather it implies a consideration forindividual differences such as allowing for early starterswho can come in an hour early and leave earlier; latestarters who can stay on later; allowances for after-dinner work hours when the family has gone to bed;compensation by working through the lunch hour, etc.
6 Includes flexibility in timings, discriminatory workpractices, lack of women colleagues, mentors and rolemodels, restricted chances for participation, too fewwomen in decision making posts, harassment, etc
7 As explained earlier in footnote 5
8 As explained earlier in footnote 5
9 As explained earlier in footnote 5
10 The percentage was calculated based on the totalnumber of responses received from all three groups (WIR,WNR and WNW) with respect to childcare facilities etc,at workplace.
11 Note: The percentage of publications under eachcategory of publication is calculated for the total 568women surveyed and 226 men surveyed.
12 The nature of flexibility in timings has already beendiscussed earlier. Please refer to earlier discussions onflexibility in timings for the same.
SUMMARY AND RECOMMENDATIONS:
13 In the view of the security reasons, it is not just enoughfor organizations to compensate for travel but provideassured transportation facilities for late working hoursfor both women and men. This provision has alreadybeen adopted by the private sector, particularly IT andITES services which has enabled more women also towork in these sectors.
14 Subject specific databases developed by IAS and NIASas well as the data base of DST can be used to send outmails calling for papers/abstracts. Information by andlarge is restricted to premier and well know institutions.
15 Outcomes refer to the actual increased number ofwomen employee across all levels and departments.
ENDNOTES

58
Bal, V. (2005). Women scientists in India: Nowhere nearthe glass ceiling. Current Science: 88( 6) . pp. 872-878.http://www.ias.ac.in/currsci/mar252005/872.pdf
B.K. Anitha and Kasturirangan. K (2007): EngenderingScience and Technology Education in India In theProceedings of International Conference on Women’sImpact on Science and Technology in the NewMillennium organized by TWOWS, TWAS Regional Officefor Central and South Asia, JNCASR, Bangalore (pp- 92-95). Campion, P and Shrum, W. (2004). Gender and Sciencein Development: Women Scientists in Ghana, Kenya,and India. Science Technology Human Values: 29(4).Pp. 459- 485. http://sth.sagepub.com/cgi/content/abstract/29/4/459 Conkey, M. (2003). Has Feminism ChangedArchaeology? Signs: 28(3). pp. 867-880 http://www.jstor.org/stable/3175921
Elgquist-Saltzman, Inga, 1992. Straight Roads andWinding Tracks: Swedish Educational Policy from aGender Equality Perspective. In Gender and Education.Vol.4, No.1/2, pp.41-56. Etzkowitz, H.(2007). The “Athena Paradox:” Bridgingthe Gender Gap in Science.Journal of Technology Management Innovation: 2(1),pp.1-3 Fox, M.F.(2001). Women, Science and Academia:Graduate Education and Careers. Gender and Society:15(5). Pp. 654-666. http://gas.sagepub.com/cgi/content/abstract/15/5/654 Gupta, N and Sharma, A.K. (2002). Women AcademicScientists in India. Social Studies of Science: 32(5/6),pp. 901-915 http://www.jstor.org/stable/3183058. Accessed: 22/12/2009 02:49 Gupta, N & ETZKOWITZ, H. (2006). Women in Science:A Fair Shake? Minerva: 44; pp. 185–199 Gupta, N. (2007). Indian Women in Doctoral Educationin Science and Engineering: A Study of Informal Milieuat the Reputed Indian Institutes of Technology. ScienceTechnology Human Values: 32; pp. 507-533 http://sth.sagepub.com/cgi/content/abstract/32/5/507.Accessed: 28 April, 2009, 12:00 pm Hopkins, N. Diversification of a University Faculty:Observations on Hiring of Women Faculty in the Schoolsof Science and Engineering at MIT. MIT Newsletter, Vol18 (4). March/April 2006. http://web.mit.edu/fnl
Jaiswal, R.P. (1993). Professional Status of Women: AComparative study of Women and Men in Science andTechnology. Jaipur: Rawat Publications.
REFERENCES
Keller, E.F.(1997). Developmental Biology as a FeministCause? Osiris, 2nd Series: Vol. 12, Women, Gender, andScience: New Directions. pp. 16-28 http://www.jstor.org/stable/301896 Krishnan, V (Ed). (2007). Proceedings of theInternational Conference on Science and Technology inthe New Millennium. Bangalore: Third World Academyof Sciences Regional office for central and South Asia Lambert, K.A. (1997). The role of females in FeministPrimatology. Unpublished graduate thesis. http://www.collectionscanada.gc.ca/obj/s4/f2/dsk2/ftp04/mq26926.pdf Levitt, J.W & Gordon, L. (1988). A decade of FeministCritiques in the natural Sciences: An Address by RuthBleier. Signs: 14(1). Pp. 182-195.http://links.jstor.org/sici?sici=0097-9740%28198823%2914%3A1%3C182%AADOFCI%3E2.0.CO%3B2-X
Sengers, J.L. (2009). Women for Science: Action forScience Academies. Presented at the IANASSymposium, Mexico, April 2009. http://www.google.co.in/url?sa=t&source=web&ct=res&cd=2&ved=0CCEQFjAB&url=http%3A%2F%2Fwww.ianas.org%2FWomen%2520for%2520Science%2520Symposium%2Flecture%2FIANAS%2520Mexico%25203%2520jphana%2520levelt%2520sengers%2520%255BNOVO%255D_en.ppt&rct=j&q=Women+scientists+in+National+Academy+of+Sciences+USA&ei=fyHES_yeCM67rAfa_q2NDw&mk=0&mb=2&usg=AFQjCNFHC1lAIwp_lhhhxfygRvNSVkW-GA.Accessed: 13 April, 2010, 1:30 pm Schiebinger, L. 1999. Has Feminism Changed Science?Cambridge, Harvard University Press. Schiebinger, L. (2008. Gendered Innovations in Scienceand Engineering. California: Stanford University Press Subramanian, J. (2007). Perceiving and ProducingMerit: Gender and Doing Science in India. IndianJournal of Gender Studies: 14(2). Pp. 259-284. http://ijg.sagepub.com/cgi/content/abstract/14/2/259
Reports:To Recruit and Advance: Women Students and Facultyin U.S. Science and Engineering (2006). Committee onthe Guide to Recruiting and Advancing WomenScientists and Engineers in Academia, Committee onWomen in Science and Engineering, National ResearchCouncil.http://www.nap.edu/catalog/11624.html INSA (2004): Science Career for Indian Women: AnExamination of Indian Women's Access to andRetention in Scientific Career, INSA Publications, NewDelhi

59
APPENDIX I: DATABASE REGISTRANTS DETAILS
Table 1: Zone Wise Distribution of Database Registrants
Zone Women Men
Frequency Percent Frequency Percent
South 747 38.1 111 27.5
East 194 9.9 47 11.7
West 338 17.2 70 17.4
Central 69 3.5 27 6.7
North-East 42 2.1 22 5.5
North 463 23.6 124 30.8
Outside India 113 5.7 2 0.5
Total 1966 100 403 100
Table 2: Discipline Wise Distribution of Database Registrants
Discipline Women Men
Frequency Percent Frequency Percent
Agriculture 36 1.8 13 3.2
Animal Sciences 152 7.7 39 9.7
Anthropology 13 0.7 0 0
Chemistry 287 14.6 65 16.1
Earth and PlanetarySciences 55 2.8 14 3.5
Engineering andTechnology 171 8.7 73 18.1
EnvironmentalSciences 20 1 4 1
General Biology 400 20.4 40 9.9
Interdisciplinary 35 1.8 8 2
MathematicalSciences 161 8.2 44 10.9
Medicine 73 3.7 19 4.7
Physics 289 14.7 55 13.6
Plant Sciences 274 13.9 29 7.2
Total 1966 100 403 100

60
Table 3: Category Wise Distribution of Database Registrants
Category Women Men
Frequency Percent Frequency Percent
In Science Research 1525 77.6 290 72.0
Not engaged inScience Research 298 15.2 100 24.8
Not Working 142 7.2 3 0.7
Not Specified 1 0.1 10 2.5
Total 1966 100 403 100
Table 4: Age-wise distribution of Database Registrants
Age Break Up Women Men
Frequency Percent Frequency Percent
50 years and Above 128 6.5 156 38.7
40-50 years 501 25.5 133 33.0
30-40 years 684 34.8 105 26.1
30 years and Below 653 33.2 9 2.2
Total 1966 100 403 100

61
APPENDIX II: RESPONSES ON SURVEY OBTAINED FROM WOMEN SCIENTISTS
Table 5: Nature of Employment for WIR
Category Frequency Percent
R&T in Universities/colleges 124 39.7
R&T in academic institutions 103 33.0
Research Only 64 20.5
Any other 21 6.7
Total 312 100
Table 7: Zone Wise Distribution of women surveyed
Zone WIR WNR WNW
Frequency Percent Frequency Percent Frequency Percent
South 127 40.7 63 34.6 32 43.2
East 37 11.9 13 7.1 9 12.2
West 54 17.3 30 16.5 9 12.2
Central 12 3.8 12 6.6 3 4.1
Northeast 4 1.3 4 2. 2 2 2.7
North 78 25 60 33.0 19 25.7
Total 312 100 182 100 74 100
Table 6: Nature of Employment for WNR
Category Frequency Percent
Teaching at UG level or below 105 57.7
Administration 29 15.9
Consultant 9 4.9
Temporary / part-time research 18 9.9
Temporary / part-time Teaching 8 4.4
Others 13 7.1
Total 182 100

62
Table 8: Caste-Wise Distribution of women surveyed
Caste WIR WNR WNW
Frequency Percent Frequency Percent Frequency Percent
General 251 80.4 145 79.7 56 75.7
OBC 17 5.4 15 8.2 5 6.8
SC 6 1.9 3 1.6 2 2.7
ST 1 0.3 0 0 0 0
Others 26 8.3 11 6.0 7 9.5
Not Applicable 11 3.5 8 4. 4 4 5.4
Total 312 100 182 100 74 100
Table 9: Age-wise Distribution of women surveyed
Age-intervals WIR WNR WNW
Frequency Percent Frequency Percent Frequency Percent
<30 years 1 0.3 9 4.9 7 9.5
30-40 years 91 29.2 55 30.2 21 28.4
40-50 years 115 36.9 68 37. 4 17 23.0
50-60 years 94 30.1 45 24.7 15 20.3
60-70 years 10 3.2 3 1.6 13 17.6
70years and above 1 0.3 2 1.0 1 1.4
Total 312 100 182 100 74 100
Table 10: Annual Family incomes reported by women surveyed
Income WIR WNR WNW
Frequency Percent Frequency Percent Frequency Percent
Less than Rs. 2 Lakhs 7 2.2 8 4.4 9 12.2
Rs. 2 – 4 Lakhs 49 15.7 35 19.2 12 16.2
Rs. 4 – 6 Lakhs 75 24.0 64 35.2 21 28.4
Rs. 6 lakhs or above 178 57.1 73 40.1 29 39.2
Not Applicable /Not Replied 3 1.0 2 1.1 3 4.1
Total 312 100 182 100 74 100

63
Table 11: Timing of marriage reported by women surveyed
Timing of marriage WIR WNR WNW
Frequency Percent Frequency Percent Frequency Percent
Before Under-graduation studies 3 1.1 0 0 0 0
During Under-graduation studies 5 1.6 2 1. 1 0 0
After graduation 13 4.4 6 3. 3 3 4.1
During post-graduation studies 8 2.6 4 2. 2 1 1.4
After post graduation 80 25.6 59 32.4 20 27.0
During doctoral studies 84 26.9 51 28.08 24 32.4
After doctoral studies 75 24.0 38 20.9 20 27.0
Not Applicable 44 14.1 22 12. 1 6 8.1
Total 312 100 182 100 74 100
Table 12: Choice of selection of Spouse reported by women surveyed
Choice of Spouse WIR WNR WNW
Frequency Percent Frequency Percent Frequency Percent
Completelypersonal choice 101 32.4 42 23.1 21 28.4
Completelyparental choice 102 32.7 69 37.9 31 41.9
With parentalconsultation 64 20.5 50 27.5 16 21.6
Can’t say /Not applicable 45 14.4 21 11.5 6 8.1
Total 312 100 182 100 74 100
Table 13: Children reported by women surveyed
‘Do you have WIR WNR WNW
children?’ Frequency Percent Frequency Percent Frequency Percent
Yes 232 74.4 147 80.8 62 83.8
No 34 10.9 12 6.6 6 8.1
Not replied /Not applicable 46 14.7 23 12.6 6 8.1
Total 312 100 182 100 74 100

64
Table 14: Age-group of children reported by women surveyed*
Age-group of children WIR WNR WNW
Frequency Percent Frequency Percent Frequency Percent
0-5 years 50 15.3 36 18.2 19 20.9
> 5 – 15 years 119 36.4 71 35.9 21 23.1
> 15 years 158 48.3 91 46.0 50 54.9
Not replied /Not applicable 0 0 0 0 1 1.1
Total 327 100 198 100 91 100
Table 15: Time spent at work per week when children were growing up, reported by
women surveyed
Hours per week WIR WNR WNW
Frequency Percent Frequency Percent Frequency Percent
>70 Hours 7 2.2 14 7.7 3 4.1
60-70 Hours 18 5.8 45 24.7 5 6.8
40-60 Hours 146 46.8 23 12.8 20 27.0
20-40 Hours 54 17.3 43 23.7 11 14.9
< 20 Hours 5 1.6 14 7.7 2 2.7
Not applicable1 82 26.3 43 23.6 33 44.6
Total 312 100 182 100 74 100
Table 16: Help received for childcare as reported by women surveyed*2
Help with childcare WIR WNR WNW
Frequency Percent Frequency Percent Frequency Percent
Day care centreat work place 11 3.4 8 4.0 5 6.7
Day care centreoutside work place 31 9.6 10 5.0 5 6.7
Your family 83 25.8 46 22.8 10 13.3
Your husband’s family 74 23.0 69 34.2 11 14.7
Husband 28 8.7 10 5.0 5 6.7
Paid Professional 76 23.6 47 23.3 13 17.3
Any other 10 3.1 3 1.5 5 6.7
Not applicable / No help 9 2.8 9 4.5 21 28.0
Total 322 100 202 100 75 100
* The question was a multiple response question and hence the number of responses does not match the actual number of women surveyed.1 Not applicable has been used as an option by both women who did not have children as well as those who did not work. The exact break up of the
category is not available from our data2 The table shows responses for women who have reported having children only

65
Table 17: Type of family currently living in reported by women surveyed
Type of family WIR WNR WNW
Frequency Percent Frequency Percent Frequency Percent
Nuclear 218 69.9 116 63.7 58 78.4
Joint 90 28.8 64 35.2 16 21.6
Not replied 4 1.3 2 1.1 0 0
Total 312 100 182 100 74 100
Table 18: Spouse’s qualification reported by women surveyed
Spouse’s qualification WIR WNR WNW
Frequency Percent Frequency Percent Frequency Percent
High School 0 0 0 0 1 1.4
Higher Secondary 1 0.3 0 0 0 0
Graduate 37 11.9 39 21.4 13 17.6
Post-graduate 106 34.0 67 36.8 19 25.7
Doctorate 121 38.8 55 30.2 34 45.9
Not Applicable /Not replied 47 15.1 21 11.5 7 9.5
Total 312 100 182 100 74 100
Table 19: Spouses in science teaching, research or consultancy reported by women surveyed
Spouse in science? WIR WNR WNW
Frequency Percent Frequency Percent Frequency Percent
Yes 125 40.1 50 27.5 32 43.2
No 101 32.4 80 44.0 21 28.4
Not applicable /replied 86 27.6 52 28.6 21 28.4
Total 312 100 182 100 74 100
Table 20: Average number of working hours per week reported by
women surveyed
Hours per week WIR WNR
Frequency Percent Frequency Percent
>70 Hours 13 4.2 1 0.5
60-70 Hours 51 16.3 11 6.0
40-60 Hours 196 62.8 82 45.1
20-40 Hours 46 14.7 68 37.4
< 20 Hours 6 1.9 20 11.0
Not applicable /Not replied 13 4.2 1 0.5
Total 312 100 182 100

66
Table 21: Reasons reported for not taking up previous jobs applied for by women surveyed*1
Reasons WIR WNR WNW
Frequency Percent Frequency Percent Frequency Percent
For better professionalprospects 29 23.4 18 16.4 0 0
Job was temporary 7 5.6 9 8.2 0 0
Due to family reasons 16 12.9 15 13.6 2 3.3
Got present job earlierthan the other post 16 12.9 11 10.0 2 3.3
Did not get the job 35 28.2 46 41.8 40 66.7
Organizationalreasons2 8 6.5 2 1.8 9 15.0
Any other 13 10.5 9 8.2 7 11.7
Total 124 100 110 100 60 100
Table 22: Reasons reported for leaving previous posts by women surveyed*
Reasons WIR WNR WNW
Frequency Percent Frequency Percent Frequency Percent
For better professionalprospects 170 41.1 124 36.7 40 26.1
Job was temporary 97 23.4 116 34.3 46 30.1
Due to family reasons 96 23.2 71 21.0 43 28.1
Organizational factors3 22 5.3 14 4.1 4 2.6
Any other 29 7.0 13 3.9 20 13.1
Total 414 100 338 100 153 100
Table 23: Reasons reported for taking up present posts by women surveyed*
Reasons WIR WNR WNW
Frequency Percent Frequency Percent Frequency Percent
Suitable toqualification 129 12.9 60 11.1 189 12.3
Professional advantagesand opportunities 345 34.5 157 29.0 502 32.6
Enjoyment/ PersonalSatisfaction 188 18.8 101 18.7 289 18.8
Family reasons 154 15.4 89 16.5 243 15.8
OrganizationalReasons4 102 10.2 61 11.3 163 10.6
Any other(please specify) 81 8.1 73 13.5 154 10.0
Total 999 100 541 100 1540 100
* The question was a multiple response question and hence the number of responses does not match the actual number of women surveyed1 Responses of only those who applied to jobs and did not take them up is represented here2 Organizational reasons include long/inflexible hours, no room for professional growth and lack of daycare facilities at the workplace3 Includes uncongenial and discouraging work atmosphere, long/inflexible hours, denial of promotion, lack of childcare facilities4 Includes convenient location, attractive salary, prestige associated, congenial atmosphere, flexible timings, good exit-options, day-care facilities,
transport facilities, accommodation

67
Table 24: Reasons reported for breaks by women surveyed*
Reasons WIR WNR WNW
Frequency Percent Frequency Percent Frequency Percent
Marriage 10 8.8 8 8.7 6 9.4
Care for children /elders 54 47.8 47 51.1 27 42.2
Transfer of Spouse 12 10.6 4 4.3 3 4.7
Transfer of Father 1 0.9 1 1.1 1 1.6
Difficulty finding jobs/guides/institutions 7 6.2 6 6.5 14 21.9
Any other 29 25.7 26 28.3 13 20.3
Total 113 100 92 100 64 100
Table 25: Women’s knowledge and use of special schemes
WIR WNR WNW Total
Heard about 81.4 percent 63.7 percent 78.4 percent 75.4 percent
Have Received 29.5 percent 28.6 percent 27.0 percent 28.9 percent
Would like to receivein the future 84.0 percent 86.8 percent 79.7 percent 83.8 percent
Table 26: Reasons for attending conferences and workshops*
Reasons WIR WNR WNW
Frequency Percent Frequency Percent Frequency Percent
To showcase my work/ visibility 123 16.9 46 12.4 19 14.3
Interest in topic ofconference 158 21.8 72 19.5 16 12.0
To keep myselfupdated / learn more 227 31.3 133 35.9 44 33.1
Networking 168 23.1 71 19.2 33 24.8
To improve soft skills 20 2.8 12 3.2 5 3.8
Any other 22 3.0 19 5.1 2 1.5
Don’t know / Can’t say 1 0.1 0 0 0 0
Not applicable 7 1.0 17 4.6 14 10.5
Total 726 100 370 100 133 100
* The question was a multiple response question and hence the number of responses does not match the actual number of women surveyed

68
Table 27: Perceived Reasons for why women drop out of science given by women surveyed*
Reasons WIR WNR WNW
Frequency Percent Frequency Percent Frequency Percent
Family Commitments 473 51.7 254 50.9 108 53.7
Due to socio-cultural /conservative set upof society 74 8.1 39 7.8 13 6.5
OrganizationalFactors1 185 20.2 97 19.4 45 22.4
Lack of sufficient jobs 41 4.5 27 5.4 9 4.5
Other lucrative careeroptions 38 4.2 29 5.8 10 5.0
Any Other 104 11.4 53 10.6 16 8.0
Total 915 100 499 100 201 100
Table 28: Perceived reasons for why men drop out of science given by women surveyed*
Reasons WIR WNR WNW
Frequency Percent Frequency Percent Frequency Percent
Family Commitments 93 12.6 57 13.4 22 13.3
Other lucrative careeroptions 367 49.6 202 47.5 76 45.8
Organizational factors2 37 5.0 23 5.4 12 7.2
Lack of sufficient jobs 52 7.0 25 5.9 17 10.2
Peer pressure to dowell in life3 40 5.4 26 6.1 7 4.2
Lack of patience anddedication to ascientific career3 90 12.2 72 16.9 21 12.7
Any Other 61 8.2 20 4.7 11 6.6
Total 740 100 425 100 166 100
Table 29: Provisions perceived to be useful to retain women in science reported by thewomen surveyed*
Reasons WIR WNR WNW
Frequency Percent Frequency Percent Frequency Percent
Provisions ofAccommodation /Transportation 135 18.1 48 10.9 19 10.6
Provisions of Child carefacilities at workplace 121 16.2 57 12.9 28 15.6
Flexibility in Timings 231 30.9 137 31.1 51 28.5
HR policies /Higher salaries 97 13 74 16.8 22 12.3
Refresher programmes/ Fellowships 77 10.3 54 12.2 23 12.8
Any other 86 11.5 71 16.1 36 20.1
Total 747 100 441 100 179 100
* The question was a multiple response question and hence the number of responses does not match the actual number of women surveyed1 Includes no flexibility in timings; not enough female colleagues, mentors and role models; discriminatory work practices; marginalization at the job;
restricted chances for participation, advancement and promotion; too few women in decision making posts; sexual or other forms of harassment2 Includes flexibility in timings; discriminatory work practices; marginalization at the job; restricted chances for participation, advancement and
promotion; harassment3 These categories were generated from the ‘any other reasons’ category given by a large number of men and women

69
APPENDIX III: COMPARISON OF MIR AND WIR SURVEYED
Table 30: Zone Wise Distribution of WIR & MIR
Zone WIR MIR
Frequency Percent Frequency Percent
South 127 40.7 56 34.8
East 37 11.9 16 9.9
West 54 17.3 24 14.9
Central 12 3.8 8 5.0
Northeast 4 1.3 7 4.3
North 78 25 50 31.1
Total 312 100 161 100
Table 31: Caste-Wise Distribution of WIR & MIR
Caste WIR MIR
Frequency Percent Frequency Percent
General 251 80.4 121 75.2
OBC 17 5.4 20 12.4
SC 6 1.9 3 1.9
ST 1 0.3 1 0.6
Others 26 8.3 8 5.0
Not Applicable 11 3.5 8 5.0
Total 312 100 161 100
Table 32: Age-wise Distribution of WIR & MIR
Age-intervals WIR MIR
Frequency Percent Frequency Percent
<30 years 1 0.3 2 1.2
30-40 years 91 29.2 50 31.1
40-50 years 115 36.9 54 33.5
50-60 years 94 30.1 46 28.6
60-70 years 10 3.2 9 5.6
70years and above 1 0.3 0 0
Total 312 100 161 100

70
Table 33: Annual Family incomes reported by WIR & MIR
Income WIR MIR
Frequency Percent Frequency Percent
Less than Rs. 2 Lakhs 7 2.2 4 2.5
Rs. 2 – 4 Lakhs 49 15.7 43 26.7
Rs. 4 – 6 Lakhs 75 24.0 64 39.8
Rs. 6 lakhs or above 178 57.1 50 31.1
Not Applicable /Not Replied 3 1.0 0 0
Total 312 100 161 100
Table 34: Timing of marriage reported by WIR & MIR
Timing of Marriage WIR MIR
Frequency Percent Frequency Percent
Before UG studies 3 1.1 0 0
During UG studies 5 1.6 3 1.9
After graduation 13 4.4 9 5.6
During PG studies 8 2.6 2 1.2
After PG 80 25.6 38 23.6
During doctoral studies 84 26.9 29 18.0
After doctoral studies 75 24.0 76 47.2
Not Applicable 44 14.1 4 2.5
Total 312 100 161 100
Table 35: Choice of selection of Spouse reported by WIR & MIR
Choice of Spouse WIR MIR
Frequency Percent Frequency Percent
Completely personalchoice 101 32.4 41 25.5
Completely parentalchoice 102 32.7 41 25.5
With parentalconsultation 64 20.5 72 44.7
Cant say /Not applicable 45 14.4 7 4.3
Total 312 100 161 100

71
Table 36: Spouse’s qualification reported by WIR & MIR
Spouse’s qualification WIR MIR
Frequency Percent Frequency Percent
High School 0 0 5 3.1
Higher SecondarySchool 1 0.3 4 2.5
Graduate 37 11.9 42 26.1
Post-graduate 106 34.0 80 49.7
Doctorate 121 38.8 26 16.1
Not Applicable /Not replied 47 15.1 4 2.5
Total 312 100 161 100
Table 37: Spouses in science teaching, research or consultancy reported by WIR & MIR
Spouse in science? WIR MIR
Frequency Percent Frequency Percent
Yes 125 40.1 30 18.6
No 101 32.4 121 75.2
Not Applicable /Not replied 86 27.6 10 6.2
Total 312 100 161 100
Table 38: Children reported by WIR & MIR
‘Do you have WIR MIR
children?’ Frequency Percent Frequency Percent
Yes 232 74.4 139 86.3
No 34 10.9 17 10.6
Not Applicable /Not replied 46 14.7 5 3.1
Total 312 100 100 100
Table 39: Age-group of children reported by WIR & MIR*
Age-group of children WIR MIR
Frequency Percent Frequency Percent
0-5 years 50 15.3 39 17.4
> 5 – 15 years 119 36.4 84 37.5
> 15 years 158 48.3 100 44.6
Not replied /Not applicable 0 0 1 0.4
Total 327 100 224 100
* The question was a multiple response question and hence the number of responses does not match the actual number of respondents

72
Table 40: Time spent at work per week when children were growing up reported by WIR & MIR
Hours per week WIR MIR
Frequency Percent Frequency Percent
>70 Hours 7 2.2 10 6.2
60-70 Hours 18 5.8 29 18.0
40-60 Hours 146 46.8 54 33.5
20-40 Hours 54 17.3 42 26.1
< 20 Hours 5 1.6 4 2.5
Not applicable1 82 26.3 22 13.7
Total 312 100 161 100
Table 41: Average number of working hours per week reported by WIR & MIR
Hours per week WIR MIR
Frequency Percent Frequency Percent
>70 Hours 13 4.2 18 11.2
60-70 Hours 51 16.3 28 17.4
40-60 Hours 196 62.8 74 46.0
20-40 Hours 46 14.7 37 23.0
< 20 Hours 6 1.9 4 2.5
Not applicable /Not replied 13 4.2 0 0
Total 312 100 161 100
Table 42: Reasons reported for not taking up previous jobs applied for by WIR & MIR*2
Reasons WIR MIR
Frequency Percent Frequency Percent
For better professionalprospects 29 23.4 25 28.1
Job was temporary 7 5.6 2 2.2
Due to family reasons 16 12.9 11 12.4
Got present job earlierthan the other post 16 12.9 8 9.0
Did not get the job 35 28.2 37 41.6
Organizational reasons3 8 6.5 1 1.1
Any other 13 8.2 5 5.6
Total 124 100 89 100
* The question was a multiple response question and hence the number of responses does not match the actual number of respondents1 Not applicable has been used as an option by both women and men who did not have children as well as those who did not work. The exact break up
of the category is not available from our data2 Responses of only those who applied to jobs and did not take them up is represented here3 Organizational reasons include long/inflexible hours, no room for professional growth and lack of daycare facilities at the workplace

73
Table 43: Reasons reported for leaving previous posts by WIR & MIR*
Reasons WIR MIR
Frequency Percent Frequency Percent
For better professionalprospects 170 41.1 162 64.5
Job was temporary 97 23.4 48 19.1
Due to family reasons 96 23.2 7 2.8
Organizational reasons1 22 5.3 18 7.2
Any other 29 7.0 16 6.4
Total 414 100 251 100
Table 44: Reasons reported for taking up present posts by WIR & MIR*
Reasons WIR MIR
Frequency Percent Frequency Percent
Suitable to qualification 129 12.9 49 11.2
Professional advantagesand opportunities 345 34.5 147 33.5
Enjoyment / PersonalSatisfaction 188 18.8 95 21.6
Family reasons 154 15.4 57 13.0
Organizational reasons2 102 10.2 21 4.8
Any other(please specify) 81 8.1 70 15.9
Total 999 100 439 100
Table 45: Reasons reported for breaks by WIR & MIR*
Reasons WIR MIR
Frequency Percent Frequency Percent
Marriage 10 8.8 0 0
Care for children /elders 54 47.8 0 0
Transfer of Spouse 12 10.6 0 0
Transfer of Father 1 0.9 0 0
Difficulty finding jobs /guides / institutions 7 6.2 1 14.3
Any other 29 25.7 6 85.7
Total 113 100 7 100
* The question was a multiple response question and hence the number of responses does not match the actual number of respondents1 Includes uncongenial and discouraging work atmosphere, long/inflexible hours, denial of promotion, lack of childcare facilities2 Includes convenient location, attractive salary, prestige associated, congenial atmosphere, flexible timings, good exit-options, day-care facilities,
transport facilities, accommodation

74
Table 46: Number of women and men reporting publications
Publications / patents Women Men
Freq Percent Freq Percent
Individual research papers in refereed journals 253 44.5 86 38.1
Collaborative research papers in refereed journals 481 84.7 210 92.9
Individual review articles 123 21.7 36 15.9
Collaborative review articles 104 18.3 59 26.1
Individual conference articles/proceedings/abstracts 223 39.3 63 27.9
Collaborative conference articles/proceedings/abstracts 242 42.6 128 56.6
Individual books authored/co-authored 73 12.9 30 13.3
Collaborative books authored/co-authored 52 9.2 44 19.5
Individual books edited / co-edited 36 6.3 22 9.7
Collaborative books authored/co-authored 22 3.9 16 7.1
Individual popular articles 111 19.5 59 26.1
Collaborative popular articles 31 5.6 20 8.8
Individual technical reports 85 15.0 28 12.4
Collaborative technical reports 65 11.4 40 17.7
Individual patents 25 4.4 9 4.1
Collaborative patents 26 4.6 14 6.2
Any other work (Individual) 20 3.5 20 8.8
Any other work (collaborative) 28 4.9 20 8.8
Table 47: Reasons for attending conferences and workshops*
Reasons WIR MIR
Frequency Percent Frequency Percent
To showcase my work/ visibility 123 16.9 47 12.9
Interest in topic ofconference 158 21.8 49 13.4
To keep myselfupdated / learn more 227 31.3 116 31.8
Networking 168 23.1 99 27.1
To improve soft skills 20 2.8 31 8.5
Any other 22 3.0 19 5.2
Don’t know / Can’t say 1 0.1 0 0
Not applicable 7 1.0 4 1.1
Total 726 100 365 100
* The question was a multiple response question and hence the number of responses does not match the actual number of respondents

75
Table 48: Perceived Reasons for why women drop out of science given by WIR & MIR*
Reasons WIR MIR
Frequency Percent Frequency Percent
Family Commitments 473 51.7 226 58.5
Due to socio-cultural /conservative set upof society 74 8.1 51 13.2
Organizational Factors1 185 20.2 54 14.0
Lack of sufficient jobs 41 4.5 11 2.8
Other lucrative careeroptions 38 4.2 19 4.9
Any Other 104 11.4 25 6.6
Total 915 100 386 100
Table 49: Perceived reasons for why men drop out of science given by WIR & MIR*
Reasons WIR MIR
Frequency Percent Frequency Percent
Family Commitments 93 12.6 31 7.9
Other lucrative careeroptions 367 49.6 309 53.2
Organizational factors2 37 5.0 16 4.1
Lack of sufficient jobs 52 7.0 39 9.9
Peer pressure to dowell in life3 40 5.4 29 7.4
Lack of patience anddedication to ascientific career3 90 12.2 57 14.5
Any Other 61 8.2 12 3.1
Total 740 100 393 100
Table 50: Provisions perceived to be useful to retain women in science reported by WIR & MIR*
Reasons WIR MIR
Frequency Percent Frequency Percent
Provisions of Accomm-odation / Transportation 135 18.1 42 11.5
Provisions of Child carefacilities at workplace 121 16.2 44 12.1
Flexibility in Timings 231 30.9 108 29.6
HR policies /Higher salaries 97 13 42 11.5
Refresher programmes/ Fellowships 77 10.3 64 17.5
Any other 86 11.5 65 17.8
Total 747 100 365 100
* The question was a multiple response question and hence the number of responses does not match the actual number of respondents1 Includes no flexibility in timings; not enough female colleagues, mentors and role models; discriminatory work practices; marginalization at the job;
restricted chances for participation, advancement and promotion; too few women in decision making posts; sexual or other forms of harassment2 Includes flexibility in timings; discriminatory work practices; marginalization at the job; restricted chances for participation, advancement and
promotion; harassment3 These categories were generated from the ‘any other reasons’ category given by a large number of men and women