trainable gene regulation networks with applications to...
TRANSCRIPT

Trainable Gene Regulation Networks withApplications to Drosophi la Pattern Formation
Eric Mjolsness
Machine Learning Systems GroupJet Propulsion LaboratoryCalifornia Institute of TechnologyPasadena CA [email protected]
To appear in: Computational Methods for Molecular and Cellular Biology, eds. J.M. Bower and H. Bolouri, MIT Press.
1 Introduction
This chapter will very briefly introduce and review somecomputational experiments in using trainable gene regulationnetwork models to simulate and understand selected episodes in thedevelopment of the fruit fly, Drosophila melanogaster. For detailsthe reader is referred to the papers introduced below. It will thenintroduce a new gene regulation network model which can describepromoter-level substructure in gene regulation.
As described in chapter 2, gene regulation may be thought of as acombination of cis-acting regulation by the extended promoter of agene (including all regulatory sequences) by way of the transcriptioncomplex, and of trans-acting regulation by the transcription factorproducts of other genes. If we simplify the cis-action by using aphenomenological model which can be tuned to data, such as a unitor other small portion of an artificial neural network, then the fulltrans-acting interaction between multiple genes during developmentcan be modelled as a larger network which can again be tuned ortrained to data. The larger network will in general need to haverecurrent (feedback) connections since at least some real generegulation networks do. This is the basic modeling approach taken in(Mjolsness et al. 1991), which describes how a set of recurrent neuralnetworks can be used as a modeling language for multipledevelopmental processes including gene regulation within a singlecell, cell-cell communication, and cell division. Such network modelshave been called “gene circuits”, “gene regulation networks”, or

“genetic regulatory networks”, sometimes without distinguishing themodels from the actual modeled systems.
In (Mjolsness et al. 1991) a number of choices were made informulating the trainable gene regulation network models, whichaffect the spatial and temporal scales at which the models are likelyto be useful. The dynamics was chosen to operate deterministicallyand continuously in time, on continuous-valued concentration-likevariables, so that the dynamical equations for the network arecoupled systems of ordinary differential equations (ODE’s). One suchform was
τ λii
ij j ij
i
dv
dtg T v h v= +
−∑
in whichvi is the continuous-valued state variable for gene product i ,Tij is the matrix of positive, zero, or negative connections by whichone transcription factor can enhance or repress another, and g() is anonlinear monotonic sigmoidal activation function. When aparticular matrix entry Tij is nonzero, there is a regulatory“connection” from gene product j to gene i . The regulation isenhancing if T is positive and repressing if it is negative. If Tij iszero there is no connection. Figure 1 sketches the model, drawing afew representative nonzero connections as arrows between “genes”represented by open circles. The entire network is localized to a cellbut communicates with other such networks in nearby cells.

Figure 1. Sketch of recurrent analog neural network model for generegulation networks. A set of analog-valued units v are connected in acont inuous-t ime, recurrent circui t by a connect ion matr ix T.Communication with circuits in other cells may require additionalconnections, e.g. as formulated in (Mjolsness et al 1991).
Such equations are often stiff due to the nonlinear transfer functiong(u). Optimizing the unknown parameters T, h , λ and τ has so farproven to be computationally difficult: special versions of simulatedannealing optimization (Lam and Delosme 1988a, 1988b) have beenrequired for good results, e.g. to start from expression patternsderived from a known model and recover its parameters reliably(Reinitz and Sharp 1995). As discussed in Chapter 2, this kind oftraining is quite different and much slower than the usual“backpropation of error” training used with feed-forward(nonrecurrent) artificial neural networks. Informatics work onimproving this situation could be important.
In addition to the analog circuit model, the framework of (Mjolsnesset al. 1991) also proposes a dynamic g r a m m a r by which multiplebiological mechanisms can be modeled by networks and thencombined into a consistent overall dynamical model. Thegrammar/circuit combination has some similarities to hybrid modelsincorporating Discrete Event Systems and ODE’s. In this way one canfor example combine intracellular and intercellular regulationnetwork submodels. The grammar is also suitable forimplementation in object-oriented computer simulation programs.
T
v
Extracellularcommunication

2. Three Case Studies
In this section, some of the literature on trainable gene circuitmodels which have been fit to Drosophila gene expression patterns isreviewed. Three applications to pattern formation are shown todemonstrate the generality of the methods. First, a model of gapgene expression patterns along the anterior-posterior axis will bedescribed. Second, the extension of this model to incorporate theimportant pair-rule gene eve and a number of other improvementswill be introduced. Finally, a gene circuit model of neurogenesisincorporating nonlinear signaling between nearby cells through theNotch receptor and the Delta ligand will be briefly described.
2.1 Gap Gene Expression
Such gene regulation network models can be tuned or “trained” withreal gene expression data, and then used to make robust and at leastqualitatively correct experimental predictions, as was shown in(Reinitz et al. 1992). In that study the goal was to understand thenetwork of gap genes expressed in bands (domains) along theanterior-posterior (A-P) axis of the very early embryo (the syncytialblastoderm) of D r o s o p h i l a. This experimental system has theadvantage that there are no cell membranes between adjacent cellnuclei, so elaborate cell-cell signalling mechanisms do not need to bemodeled. Also D r o s o p h i l a is an easy species to manipulategenetically, as for example “saturation mutagenesis” - finding all thegenes affecting a particular process - is possible.
Positional information along the A-P axis of the syncytial blastodermis encoded in a succession of different ways during development. Atfirst the main encoding is a roughly exponential gradient of bicoid(bcd) protein imposed by the mother fly, along with maternalhunchback (hb) expression. These provide gene regulation networkinputs to the gap genes: Kruppel (Kr), knirps (kni), giant (gt), tailless(t l l) , and hunchback (hb) again. These each establish one or twobroad domains of expression along the A-P axis. The gap genes thenserve as network inputs to the pair-rule genes including e v e n -skipped (eve) and fushi tarazu (ftz), which establish narrow, precisestripes of expression and precise positional coding. These in turnprovide input to segment-polarity genes such as e n g r a i l e d andwing less which are the first to retain their expression pattern intoadulthood. For example, engrailed is expressed in bands just one cell

wide which define the anterior borders of the parasegments.Introductions to the relevant Drosophila developmental biology maybe found in (Lawrence 1992) and (Alberts et al. 1994).
An example of a spatial gene expression pattern along the A-P axis ofa triple-stained embryo is shown in Figure 2. Here, fluorescentlylabelled antibodies simultaneously label those nuclei in the syncytialblastoderm expressing Kruppel, giant, and even-skipped.
Figure 2. Spatial pattern of gene expression in a Drosophila syncytialblastoderm for two gap genes and one pair-rule gene. Immunofluorescentstaining of nuclei for Kruppe l (green), g ian t (blue), and e v e n - s k i p p e d(red). Overlap areas of Kr and eve appear yellow, and overlaps of gt andeve appear purple. Image courtesy of John Reinitz.
The first computer experiments with fitting such analog generegulation nets to real expression data concerned the establishmentof the broad gap gene domains (excluding the extreme ends of the A-P axis) from maternally supplied initial conditions, by a generegulation network in which all gap genes interact with all othersand bcd provides input to, but does not receive any input from, thegap genes.
Figure 3 shows the experimentally observed and model-fitted curvesfor gap gene expression. They are in qualitative agreement, which isthe most that can be expected from the expression data that wasavailable at the time. The extra dip in gt expression could not be

predicted by the model, which can be interpreted as an indication ofthe role of circuit components not included in the model.
Figure 3. Data and model for gap gene circuit. Horizontal axes are nucleialong lateral midline from anterior to posterior. Vertical axes are relativeconcentrations. Left: data estimated from immunofluorescence imagessimilar to Figure 2 for pairs of gap genes. Right: output of a circuit modelfit to expression data using a nonlinear least squares criterion andsimulated annealing optimization. From (Reinitz et al. 1992).
The most important predictions of the model concerned theanomalous dose-response observed by (Driever and Nusslein-Volhard 1988). Figure 4 shows the prediction in detail; it may besummarized by saying that positional information for the gap genesystem is specified cooperatively by maternal b c d and h b. Thisqualitative behavior was observed to be robust over many runs ofthe simulated annealing parameter-fitting procedure, and thereforetaken to be a prediction of the model. Essential features of thecooperative control of positional information by maternal bcd and h bwere verified experimentally in (Simpson-Brose et al. ’1994). Thegap gene model predict ion and the experiment ocurredindependently of one another.

Figure 4. Predictions of the model as bicoid dosage is increased: locationof selected landmarks along A-P (horizontal) axis vs. number of bcd copies(vertical axis). (a) Displacement of a landmark (anterior margin of the Krdomain) expected if it were determined by reading off a fixedconcentration value of maternal Bicoid protein alone. (b-c) Smallerdisplacement of the same landmark (anterior margin of the Kr domain)predicted by model. (A retrodiction.) (d) Observed anomalously smalldisplacement of a related landmark: the first eve stripe, not available inthe gap gene model but expected to be offset anteriorly from the Krlandmark. Note anomalously high slope compared to a, but as in b,c. (e)Prediction: return to the behavior of (a) if maternal h u n c h b a c k is setequal to zero. From (Reinitz et al. 1992).
2.2 Eve Stripe Expression
Following the gap gene computer experiments, (Reinitz and Sharp1995) went on to perform a detailed study of the gap gene circuit asextended to include the first of the pair-rule genes, eve. The furtherobservations which could be included in this model allowed animportant milestone to be reached: not only qualitative behaviors,but also the circuit parameter signs and rough magnitudes becamereproducible from one optimization run to another, and someparameters such as connections to eve were still more reproducible.Hence, far more could be predicted. For example the diffusionconstant for eve was much lower than for other transcription factors
in successful runs. This has an experimental interpretation: e v emRNA is expressed in the outer part of each future cell just as thecell membranes are invaginating into the blastoderm embryo,providing an apical obstruction to diffusion.
More importantly, each of the eight boundaries of the four centralstripes of eve expression could be assigned a particular gap gene asthe essential controller of that boundary. This picture is inagreement with experimental results with the possible exception ofthe posterior border of eve stripe 3, the interpretation of which is aninteresting point of disagreement (Small et al. 1996, Reinitz andSharp 1995, Frasch and Levine 1987) and a possible focal point forfurther laboratory and/or computer experiments.
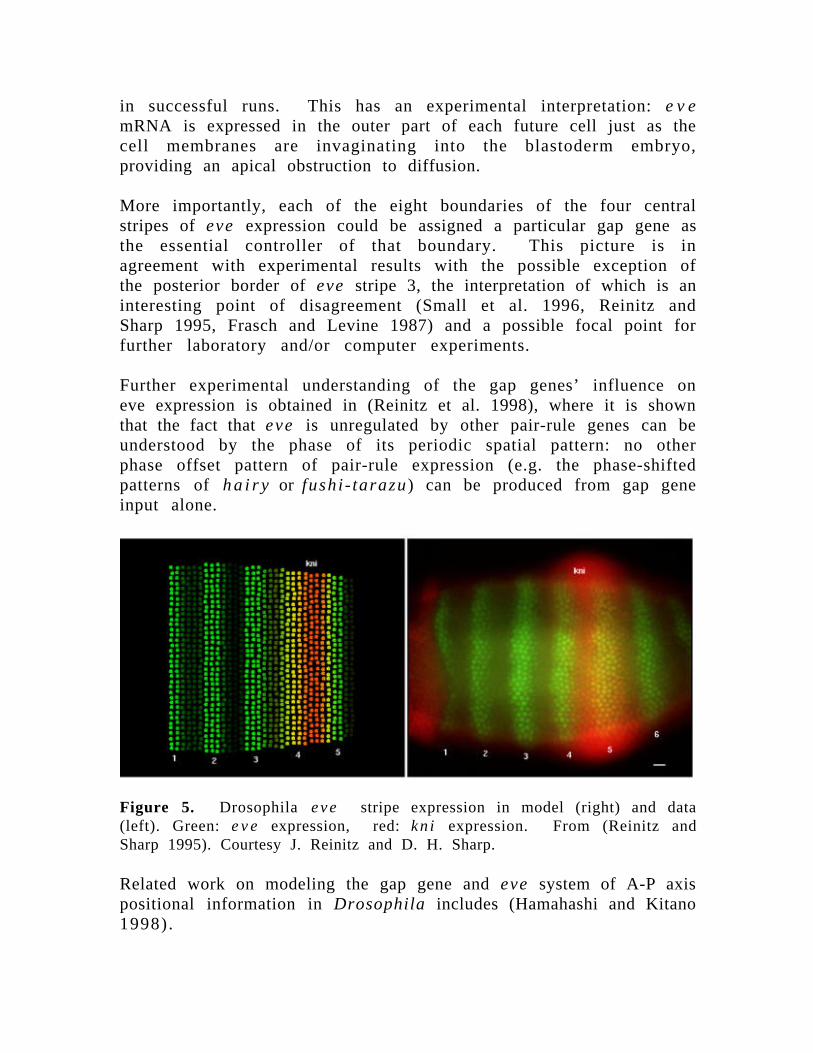
Further experimental understanding of the gap genes’ influence oneve expression is obtained in (Reinitz et al. 1998), where it is shownthat the fact that eve is unregulated by other pair-rule genes can beunderstood by the phase of its periodic spatial pattern: no otherphase offset pattern of pair-rule expression (e.g. the phase-shiftedpatterns of ha i r y or fushi - tarazu) can be produced from gap geneinput alone.
Figure 5. Drosophila eve stripe expression in model (right) and data(left). Green: e v e expression, red: kn i expression. From (Reinitz andSharp 1995). Courtesy J. Reinitz and D. H. Sharp.
Related work on modeling the gap gene and eve system of A-P axispositional information in Drosophila includes (Hamahashi and Kitano1998).

2.3 Neurogenesis and Cell-Cell Signaling
The syncytial blastoderm is very favorable, but also very unusual, asmorphogenetic systems go because there is no cell membraneinterposed between nearby cell nuclei and therefore the elaboratemechanisms of cell-cell signaling do not come into play. But if we areto model development in its generality it is essential to includesignaling along with gene regulation networks. As a first attempt inthis direction, we have modeled the selection of particular cells in anepithelial sheet (later in D r o s o p h i l a development) to becomeneuroblasts. Virtually the same gene network is thought to beinvolved in the selection of particular cells in wing imaginal disks tobe sensor organ precursors. The essential molecule to add is theNotch receptor, a membrane-bound receptor protein responsible forreceiving the intercellular signals which mediate this selectionprocess. It binds to a ligand molecule (“Delta” for this system) onneighboring cells. Recent experiments (Schroeter et al. 1998)indicate that it acts on the nucleus (following activation by a ligandon another cell) by having an intracellular domain cleaved off andtransported there. Variants of the Notch receptor occur in manydevelopmental subsystems where a subpopulation of cells must bepicked out, in Drosophila and homologously across many species.
In (Marnellos 1997) and (Marnellos and Mjolsness 1998a, 1998b) arereported computer experiments incorporating both intracellular andintercellular components in a gene regulation network model ofneurogenesis. A minimal gene circuit model with lateral inhibition(such as depicted in Figure 6) was not quite sufficient to produce theobserved patterns of selection robustly. Incorporating a denserintracellular connection matrix and/or the dynamic effects ofdelamination on the geometry of cell/cell contact area producedbetter results. However, the “data” to which the fits were made washighly abstracted from real gene expression data so it is prematureto draw a unique biological hypothesis from the model. Figure 7shows the resulting model behavior in the case of denseinterconnections.

Figure 6. A hypothesized minimal gene regulation circuit for lateralinhibition mediated by Notch and Delta. Redrawn from (Heitzler et al1996, Figure 6). Two neighboring cells express Notch (N) and Delta (Dl) attheir surfaces. Notch positively regulates transcription of genes of theEnhancer-of-spl i t complex E(spl)-C, which negat ively regulatetranscription of genes of the a c h a e t e - s c u t e complex (AS-C), whichpositively regulate transcription of Del ta. Curved boundaries are the cellmembranes between two neighboring cells. Related circuit diagrams havebeen suggested elsewhere e.g. (Lewis 1996).
Related work on Notch-mediated signal ing in Drosophiladevelopmental models includes the appearance of Notch and Delta inthe ommatidia model of (Morohashi and Kitano 1998).
N
N
Dl
Dl
E(spl)-C
AS-C

Figure 7. Cluster resolution. A circuit “trained” to resolve simpleproneural cluster configurations into individual neuroblasts (or sensoryorgan precursor cells) is tested on more complex and irregularconfigurations. In this case each cluster was successfully resolved into asingle neuroblast, but the large clusters resolve more slowly. Times: t=1(top left), t=76 (top right), t=106 (bottom left), t=476 (bottom right).Similar to [Marnellos and Mjolsness ‘98a]; courtesy George Marnellos.

3 Extending the Modeling Framework to Include PromoterSubs t ruc tu re
A very important scientific problem is to understand the influence ofpromoter substructure on eve stripe formation. The eve promoterhas many transcription factor binding sites, some of which aregrouped more or less tightly into promoter elements such as thestripe 2 “minimal stripe element” (MSE 2) (Small et al. 1992), or asimilar less tightly clustered element for stripes 3 and 7 (Small et al.1996). As an example of the scientific problems that are raised, if ishb an enhancer for MSE 2 but an inhibitor for MSE 3, what is its neteffect on eve and can it change sign (Reinitz et al. 1998)? And howare we to understand the action of “silencer” elements such as theone apparently responsible for long-range repression of z e n bydorsal (Gray et al. 1995)? Such questions point to the need for atleast one additional level of complication in the phenomenologicalmodels of gene networks whose application is described above, todescribe the substructure of promoters: binding sites, theirinteractions, and promoter elements. Otherwise the relevantexperiments cannot even be described, let alone predicted, withnetwork models.
In (Small et al. 1992) an informal model for activation of MSE 2 issuggested: it is activated by bcd and hb “in concert”, and repressedby g t anteriorly and K r posteriorly. A simple “analog logic”expression for the activation of MSE 2 in terms of variables takingvalues in [0,1] might then be (GRN 1998):
u bcd hb gt Kr
v g u
MSE
MSE MSE
2
2 2
1 1= + ×( ) −( ) −( )= ( )
γ
where _ is a weight on the relative contribution of h b vs b c d. Asimilar simplified formula for the model of (Small et al. 1996, figure8) for MSE 3 could be for example:
u Dstat hb kni
v g u
MSE
MSE MSE
3
3 3
1 1= −( ) −( )= ( ) .
(We omit direct activation of MSE3 by tailless (tll) since tll represseskni (Pankratz et al. 1989) which represses MSE3.) The rate of e v etranscription would be approximated by a further analog logic

formula including a weighted “or” of the MSE activations vMSE2 andvMSE3 .
The validation or invalidation of such formulae and theirinterpretation in terms of more detailed models will require aquantitative treatement of the relevant expression data which is notyet available. It may also lead to fitting the parameters inquantitative network models of promoter-level substructure within agene regulation network.
3.1 An Example: Hierarchical Cooperative Activation
As an example of such a gene network model incorporating promoterlevel substructure, I introduce here a “Hierarchical CooperativeActivation” (HCA) model for the degree of activation of atranscription complex. It at least seems more descriptive of knownmechanisms than a previous attempt to derive phenomenologicalrecurrent neural network equations as an approximation to generegulation dynamics (Mjolsness et al. 1991). An earlier suggestionfor including promoter-level substructure in gene regulationnetworks is described in (Sharp et al. 1993). The present HCA modelis more detailed but has not been fit to any experimental data yetand is therefore quite speculative: perhaps a next stage of successfulmodeling will include some of the following ingredients.
The basic idea of the model is to use an equilibrium statisticalmechanics model (complete with partition functions valid for dilutesolutions (Hill 1985)) of “cooperative activation” in activating aprotein complex. Such a model can be constructed from the followingpartition function, which is essentially the Monod-Wyman-Changeux(MWC) model for a concerted state change among subunits (Hill1995):
Z K K v K vb j bb
b j bb
= + + +∏ ∏( ) ( ˆ )( ) ( )1 1
in which the probability of activation of some complex is determinedby relative binding constants for each component b of the complex inthe active and inactive states, but there are no other interactions. Asbefore, vj represents the concentration of gene product j of a genecircuit. In this formula, j is a function of b so that each binding site is

specialized to receive only one particular transcription factor. Toremove this assumption one could write instead
Z K A K v A K vbj bj jjb
bj bj jjb
= + + +∑∏ ∑∏( ) ( ˆ )1 1
where A = 0 or 1 specifies which transcription factors may bind towhich sites by its sparse nonzero elements. For either expression, Kis the relevant binding constant for a binding site when the complexis in its “active” state and K̂ is the binding constant when thecomplex is inactive.
For this partition function, given a global active or inactive state, allbinding sites are independent of one another. For example thecomponents could be the occupants of all the binding sites b within aparticular regulatory region of a eukaryotic promoter. Thisconditional independence leads to the products over the binding sitesin the expression for Z. There are two such products because there isone additional bit of global state which can be “active” or “inactive”.
For this model the probability of activation of the complex underconsideration can be calculated and it is:
P g uKu
Ku
uK v
K vb j b
b j bb
= =+
=++
∏
( )
ˆ( )
( )
1
1
1
so (if Kv << 1)u K K vb b j b
b
≈ + −( )∑1 ˆ( ) .
(Further simplifications result if the binding constants Kb specific fora given transcription factor j (b) are all roughly equal to a commonvalue Kj . The final line above suggests a neural-network likeapproximation for u , although in that regime g could be linearizedalso.) We will use this model as a building block to construct a moredetailed one.
Given the MWC-style model of “cooperative activation”, we’d like touse it hierarchically: to describe the activation of promoter “modules”or “elements” in terms of transcription factor concentrations, andthen again to describe the activation of the whole transcriptioncomplex in terms of the “concentrations” of active promoter

elements, which are proportional to their activities. An additionalwrinkle is to allow either monomeric or homodimeric transcriptionfactor binding. (Heterodimers will be introduced with appropriatenotation later.) The resulting bare-bones hierarchical model wouldreplace the neural-net activation dynamics
τ λii
i i i
i i
i ij j ij
dv
dttranscribing v
transcribing g u
u T v h
= −
= ( )= +∑
[ ]
[ ]
with the two-level model
τ λ
α α
α αα
ii
i i i
i ii
i
ii
dv
dttranscribing v
transcribing g uJu
Ju
uJ P
J P
= −
= ( ) =+
= ++
∈
∏
[ ]
[ ]
ˆ
1
1
1
(the product is taken over enhancer elements __which regulate genei ) and
P g uK u
K u
uK v
K vb j b
n b
b j bn b
b
α α αα α
α α
αα
= =+
=++
∈∏
( ˜ )˜ ˜
˜ ˜
˜ˆ
( )( )
( )( )
1
1
1
Here n(b)=1 for monomers and 2 for homodimers. Note that for thissimple feed-forward version of the model, the parameters Kb and K̂b
are related to observables
fK v
K vf
K v
K vbb j b
n b
b j bn b b
b j bn b
b j bn bα α=
+=
+( )( )
( )( )
( )( )
( )( )
ˆˆ
ˆ1 1
where f bα is the probability that site b ∈α is occupied ifα is active,and f̂ bα is the probability that site b is occupied ifα is inactive. In
principle these quantities could be observed by in vivo footprinting.Such observations could be used to evaluate the parameters Kb touse in the first expression for uα for arbitrary inputs vj .
If we are modeling a network rather than a single gene, then some ofthe quantities listed above require an additional i index.
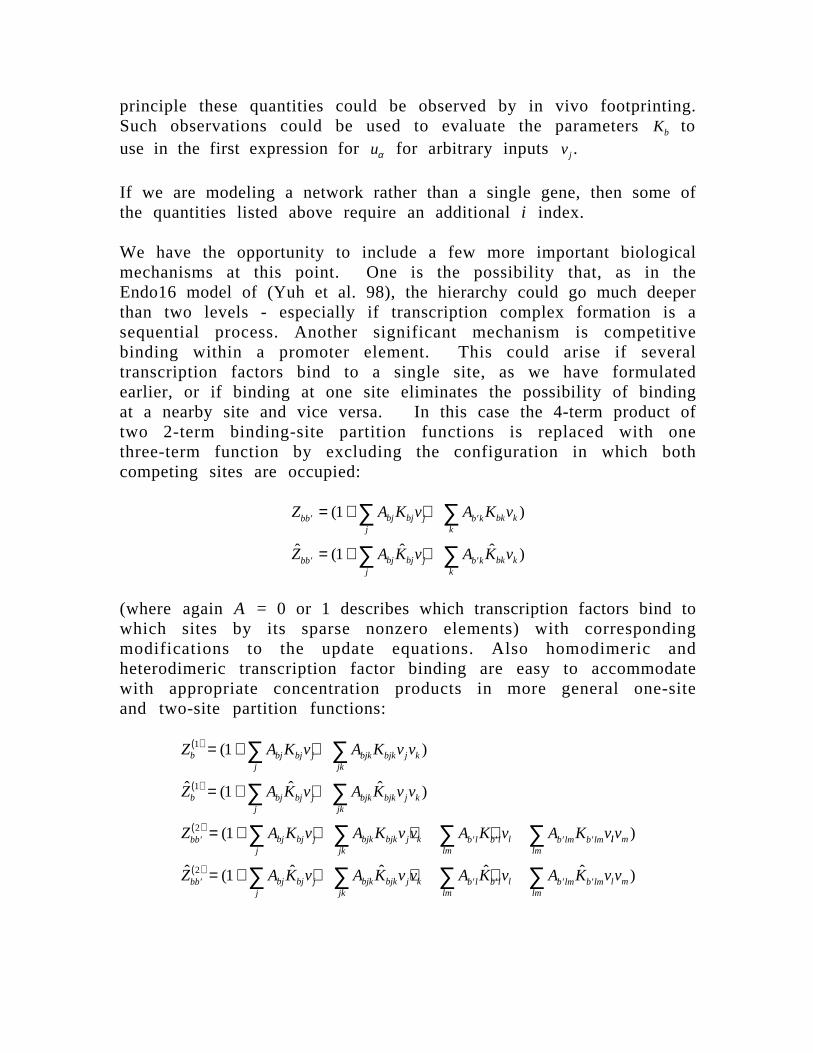
We have the opportunity to include a few more important biologicalmechanisms at this point. One is the possibility that, as in theEndo16 model of (Yuh et al. 98), the hierarchy could go much deeperthan two levels - especially if transcription complex formation is asequential process. Another significant mechanism is competitivebinding within a promoter element. This could arise if severaltranscription factors bind to a single site, as we have formulatedearlier, or if binding at one site eliminates the possibility of bindingat a nearby site and vice versa. In this case the 4-term product oftwo 2-term binding-site partition functions is replaced with onethree-term function by excluding the configuration in which bothcompeting sites are occupied:
Z A K v A K v
Z A K v A K v
bb bjj
bj j b kk
bk k
bb bjj
bj j b kk
bk k
′ ′
′ ′
= + +
= + +
∑ ∑
∑ ∑
( )
ˆ ( ˆ ˆ )
1
1
(where again A = 0 or 1 describes which transcription factors bind towhich sites by its sparse nonzero elements) with correspondingmodifications to the update equations. Also homodimeric andheterodimeric transcription factor binding are easy to accommodatewith appropriate concentration products in more general one-siteand two-site partition functions:
Z A K v A K v v
Z A K v A K v v
Z A K v A K v v A K v A K v
b bjj
bj j bjkjk
bjk j k
b bjj
bj j bjkjk
bjk j k
bb bjj
bj j bjkjk
bjk j k b llm
b l l b lmlm
b lm
1
1
2
1
1
1
( )
( )
′( )
′ ′ ′ ′
= + +
= + +
= + + + +
∑ ∑
∑ ∑
∑ ∑ ∑ ∑
( )
ˆ ( ˆ ˆ )
( ll m
bb bjj
bj j bjkjk
bjk j k b llm
b l l b lmlm
b lm l m
v
Z A K v A K v v A K v A K v v
)
ˆ ( ˆ ˆ ˆ ˆ )′( )
′ ′ ′ ′= + + + +∑ ∑ ∑ ∑2 1

Transcription factor trimers and higher order subcomplexes atadjacent binding sites could be described by suitable generalizationsof these expressions, at the cost of introducing more parameters.
Similarly, constitutive transcription factor binding with activation byphosphorylation or dephosphorylation can be described with minormodifications of the appropriate one-site or two-site partitionfunctions. For example one could use Michaelis-Menton kinetics insteady-state for phosphorylation and dephosphorylation, and theone-site dimeric partition functions would become
Z A K v v x x y
Z A K v v x x y
b bjk lmjk
bjkeff
j k l l m
b bjk lmjk
bjkeff
j k l l m
1
1
1
1
( )
( )
= + +
= + +
∑
∑
( /( ))
ˆ ( ˆ /( ))
,
,
where xl is proportional to the concentration of a kinase for thebound j /k dimer (with proportionality constants depending on thecatalytic reaction rates) and ym is proportional to a correspondingphosphatase concentration. Also A Abjk lm bjk, ≤ , so that the extra indices l
and m just specify the relevant kinase(s) and phosphatase(s) from akinase network. For example MAP kinase mediated signaling couldbe modeled as activating a gene regulation network by thismechanism.
In this model formulation we have omitted lateral interactions otherthan competitive binding between activation of nearby binding sites.Such interactions could be modeled in the manner of an Ising model.For simplicity we just use a tree topology of states and partitionfunctions here.
Given such one-site and two-site partition functions, the overallpartition function for a promoter element in terms of its binding sitesis:
Z K Z Z Z Zbb C
bbbb C
bb C
bbbb C
α α=
+
( )
=′
( )
′ =
( )
=′
( )
′ =∏ ∏ ∏ ∏1
0
2
1
1
0
2
1
ˆ ˆ .
Here each binding site competes with at most one other one asdetermined by the 0/1-valued parametersC Cb bb, ′ .

In this picture, silencers are just particular promoter elements withsufficiently strong negative regulation of transcription to veto anyother elements.
The Hierarchical Cooperative Activation (HCA) dynamics then become
τ λ
α α
α αα
ii
i i i
i ii
i
ii
dv
dttranscribing v
transcribing g uJu
Ju
uJ P
J P
= −
= ( ) =+
= ++
∈
∏
[ ]
[ ]
ˆ
1
1
1
,
a n d
P g uK u
K u
uZ
Z
Z
Zb
bb C
b b
b bb b C
α α αα α
α α
αα α
= =+
=
∈ =
′
′′∈ =∏ ∏
( )˜ ˜
˜ ˜
˜ˆ ˆ
( )
( )|
,( )
,( )
, |
1
1
10
2
21
,
with Z’s as before:
Z A K v A K v v
Z A K v A K v v A K v A K v v
b bjj
bj j bjkjk
bjk j k
bb bjj
bj j bjkjk
bjk j k b llm
b l l b lmlm
b lm l m
1
2
1
1
( )
′( )
′ ′ ′ ′
= + +
= + + + +
∑ ∑
∑ ∑ ∑ ∑
( )
( ) ,
and likewise for inactive-module (hatted) Z’s and K ’s. These partitionfunctions encode monomeric, homodimeric and heterodimericprotein-DNA binding using the various A parameters.
The resulting HCA model (Figure 8) can describe promoter elements,silencer regions, dimeric and competitive binding, and constitutivetranscription factor binding, among other mechanisms. The price isthat there are considerably more unknown parameters in the modelthan in the previous recurrent neural network models - notexponentially many as in the general N-binding site partitionfunction, but enough to pose a challenge to model-fitting proceduresand data sets.

Figure 8. Hierarchical Cooperative Activation (HCA) model for promotersubstructure within a gene “node” in a gene regulation network. Differentlayers of sub-nodes have different forms of dynamics. This network couldbe used to selectively expand some or all of the nodes in Figure 1, forexample just the “eve” gene in a network for the gap genes and eve.
4 Conclusion
Gene regulation networks have been applied to model severalepisodes in the development of Drosophi la, successfully makingcontact with experimental results. A variety of biologicalmechanisms including intercellular signaling can now be included insuch models. We proposed a new version of gene regulation networkmodels for use in describing experiments which involve promotersubstructure, such as transcription factor binding sites or promoterregulatory elements.
A c k n o w l e d g e m e n t s
This work reflects ideas which arose in discussions with HamidBolouri, Michael Gibson, George Marnellos, John Reinitz, David Sharp,and Barbara Wold. It was supported by funding from the Office ofNaval Research and the NASA Advanced Concepts program.
Transcription factor inputs
Binding site occupation -dimerization, competitive binding
Binding site activation
Promoter element activation
Transcription output
n e t w o r k

Re fe rences
B. Alberts, D. Bray, J. Lewis, M. Raff, K. Roberts, J. D. Watson (1994).The Molecular Biology of the Cell, 3rd edition, pp. 1077-1103.
W. Driever and C. Nusslein-Volhard (1988). “A Gradient of BicoidProtein in Drosophila Embryos”. Cell 54:83-93.
M. Frasch and M. Levine (1995). “Complementary Patterns of e v e n -s k i p p e d and fushi tarazu Expression Involve Their DifferentialRegulation by a Common Set of Segmentation Genes in Drosophila”.Genes Dev. 2:981-995.
Gene Regulation Network discussion group (1998). Discussions withH. Bolouri, M. Gibson, T. Mann, 1998.
S. Gray, H. Cai, S. Barol, and M. Levine (1995). “TranscriptionalRepression in the Drosophila Embryo”. Philosophical Transactions R.Soc. Lond. B 349:257-262.
S. Hamahashi and H. Kitano (1998). “Simulation of D r o s o p h i l aEmbryogenesis”, Artificial Life VI: Proceedings of the SixthInternational Conference on Artificial Life, eds. C. Adami, R. Belew, H.Kitano, and C. Taylor, pp. 151-160, MIT Press.
P. Heitzler, M. Bourouis, L. Ruel, C. Carteret and P. Simpson (1996),“Genes of the Enhancer of split and achaete-scute Complexes areRequired for a Regulatory Loop between Notch and Del ta duringLateral Signalling in Drosophila”, Development 122:161-171.
T. L. Hill (1985). Cooperativity Theory in Biochemistry: Steady-State and Equilibrium Systems. Springer Series in Molecular Biology, Springer-Verlag. See especially pp. 6-8, 35-36, and 79-81.
J. Lam and J. M. Delosme (1988). “An Efficient Simulated AnnealingSchedule: Derivation”. Technical Report 8816, Yale UniversityElectrical Engineering Department, New Haven CT.
J. Lam and J. M. Delosme (1988). “An Efficient Simulated AnnealingSchedule: Implementation and Evaluation”. Technical Report 8817,Yale University Electrical Engineering Department, New Haven CT.

P. Lawrence(1992). The Making of a Fly, Blackwell Scientific Publications.
J. Lewis (1996). “Neurogenic Genes and Vertebrate Neurogenesis”,Current Opinion in Neurobiology 6:3-10.
G. Marnellos (1997). “Gene Network Models Applied to Questions inDevelopment and Evolution”. Ph.D. Disseration, Yale University.
G. Marnellos and E. Mjolsness(1998). “A Gene Network Approach toModeling Early Neurogenesis in Drosophila” in Pacific Symposium on Biocomputing ’98, pp. 30-41, World Scientific.
G. Marnellos and E. Mjolsness (1998). “Probing the Dynamics of CellDifferentiation in a Model of Drosophila Neurogenesis”. Artificial LifeVI: Proceedings of the Sixth International Conference on ArtificialLife, eds. C. Adami, R. Belew, H. Kitano, and C. Taylor, pp. 161-170,MIT Press.
E. Mjolsness, D. H. Sharp, and J. Reinitz (1991). “A Connectionist Modelof Development”. Journal of Theoretical Biology 152:429-453.
M. Morohashi and H. Kitano (1998), “A Method to Reconstruct geneticNetworks Applied to the Development of Drosophila’s Eye”, ArtificialLife VI: Proceedings of the Sixth International Conference onArtificial Life, eds. C. Adami, R. Belew, H. Kitano, and C. Taylor, pp.72-80, MIT Press.
M. J. Pankratz, M. Hoch, E. Seifert, H. Jackle (1989). “KruppelRequirement for Knirps Enhancemant Reflects Overlapping Gap GeneActivities in the Drosophila Embryo”. Nature 341:337-340.
J. Reinitz, E. Mjolsness, and D. H. Sharp (1992). “Model for CooperativeControl of Positional Information in Drosoph i la by Bicoid andMaternal Hunchback”. Journal of Experimental Zoology 271:47-56,1995. First available in 1992 as Los Alamos National LaboratoryTechnical Report LAUR-92-2942.
J. Reinitz and D. H. Sharp (1995). “Mechanism of e v e StripeFormation”. Mechanisms of Development 49:133-158.

J. Reinitz, D. Kosman, C. E. Vanario-Alonso, and D. H. Sharp (1998).“Stripe Forming Architecture of the Gap Gene System”, TechnicalReport LAUR-98-1762, Los Alamos National Laboratory.
E. H. Schroeter, J. A. Kisslinger and R. Kopan (1998). “Notch-1Signall ing Requires Ligand-Induced Proteolyt ic Release ofIntracellular Domain”. Nature 393:382-386.
M. Simpson-Brose, J. Triesman, and C. Desplan (1994). “SynergyBetween Two Morphogens, Bicoid and Hunchback, is Required forAnterior Patterning in Drosophila”. Cell 78:855-865.
D. H. Sharp, J. Reinitz, and E. Mjolsness (1993). “Multiscale Models ofDevelopmental Processes”. Open Systems and Information Dynamics2:1,1-10, Nicholas Copernicus University Press, Torun, Poland.
S. Small, A. Blair, and M. Levine (1992). “Regulation of even-skippedStripe 2 in the Drosophila Embryo”. The EMBO Journal 11:11, pp.4047-4057.
S. Small, A. Blair, and M. Levine (1996). “Regulation of Two Pair-RuleStripes by a Single Enhancer in the D r o s o p h i l a Embryo”.Developmental Biology 175:314-324.
C.-H. Yuh, H. Bolouri, and E. H. Davidson (1998). “Genomic Cis-Regulatory Logic: Experimental and Computational Analysis of a SeaUrchin Gene”. Science 279:1896-1902.