traffic planning: designing safer roads using in … convention 2016.pdftraffic planning: designing...
TRANSCRIPT
Traffic Planning: Designing safer roads
Using in-depth crash investigation data
By
Ravishankar RajaramanChairman, RASSI Technical Committee
Technical Director, JP Research India Pvt. Ltd.
SAFE Annual Convention 2016, Jaipur25 April 2016
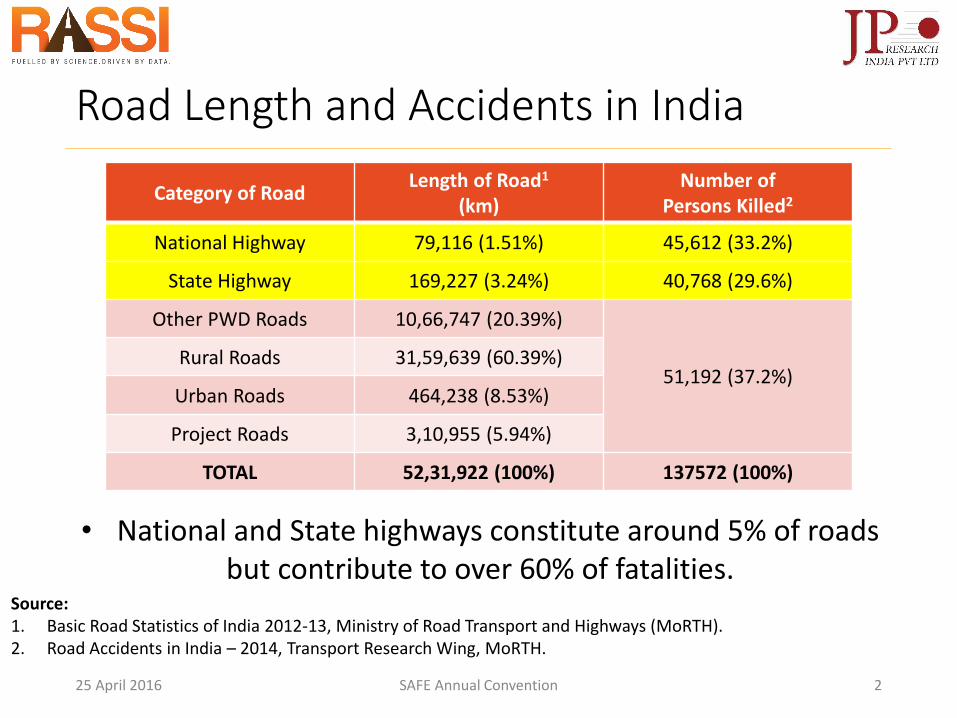
Road Length and Accidents in India
Source: 1. Basic Road Statistics of India 2012-13, Ministry of Road Transport and Highways (MoRTH).2. Road Accidents in India – 2014, Transport Research Wing, MoRTH.
• National and State highways constitute around 5% of roads but contribute to over 60% of fatalities.
Category of RoadLength of Road1
(km)Number of
Persons Killed2
National Highway 79,116 (1.51%) 45,612 (33.2%)
State Highway 169,227 (3.24%) 40,768 (29.6%)
Other PWD Roads 10,66,747 (20.39%)
51,192 (37.2%)Rural Roads 31,59,639 (60.39%)
Urban Roads 464,238 (8.53%)
Project Roads 3,10,955 (5.94%)
TOTAL 52,31,922 (100%) 137572 (100%)
25 April 2016 SAFE Annual Convention 2
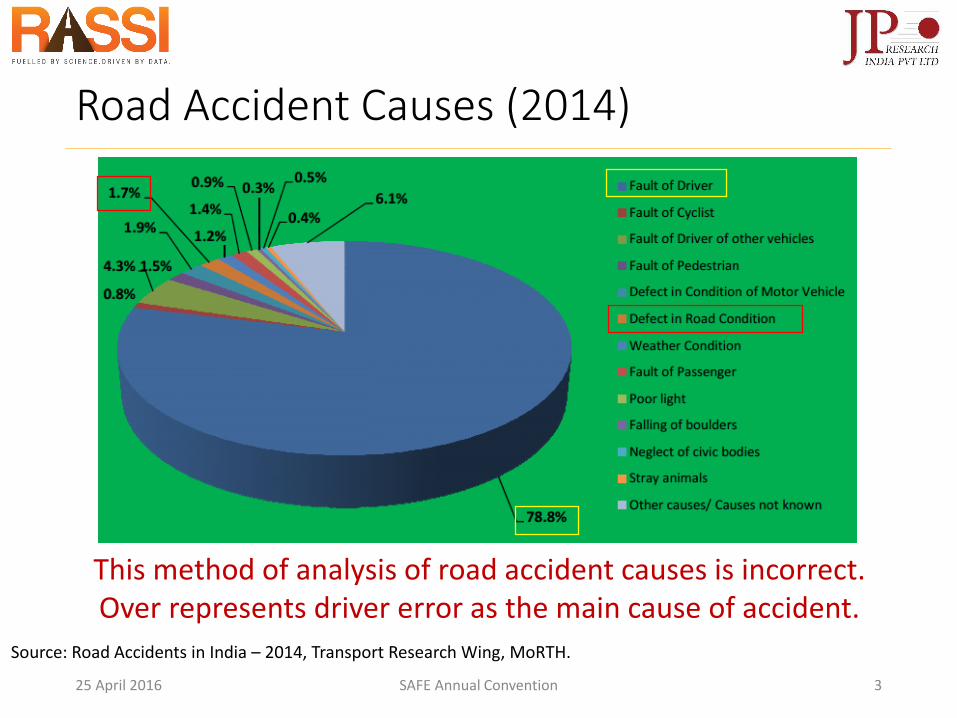
Road Accident Causes (2014)
25 April 2016 SAFE Annual Convention 3
This method of analysis of road accident causes is incorrect. Over represents driver error as the main cause of accident.
Source: Road Accidents in India – 2014, Transport Research Wing, MoRTH.
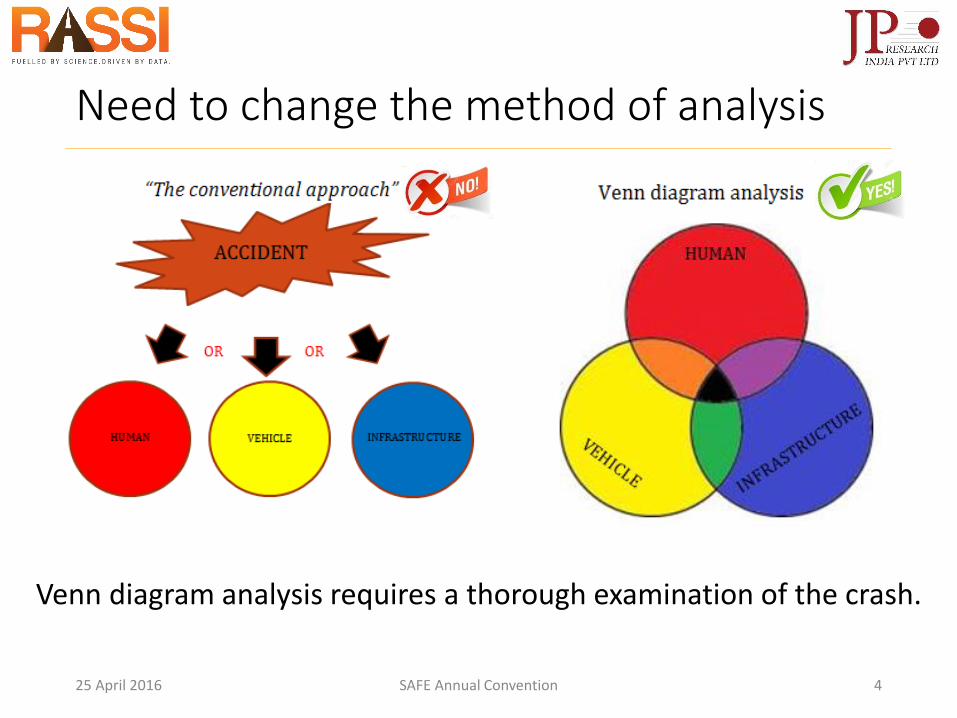
Need to change the method of analysis
Venn diagram analysis requires a thorough examination of the crash.
25 April 2016 SAFE Annual Convention 4
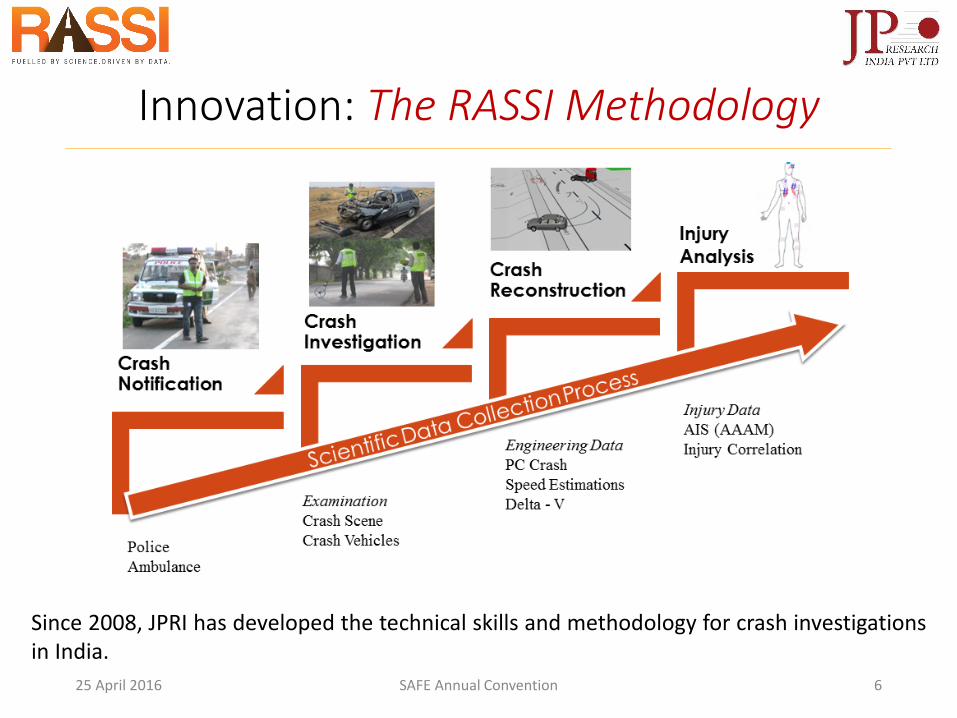
Innovation: The RASSI Methodology
Since 2008, JPRI has developed the technical skills and methodology for crash investigationsin India.
25 April 2016 SAFE Annual Convention 6
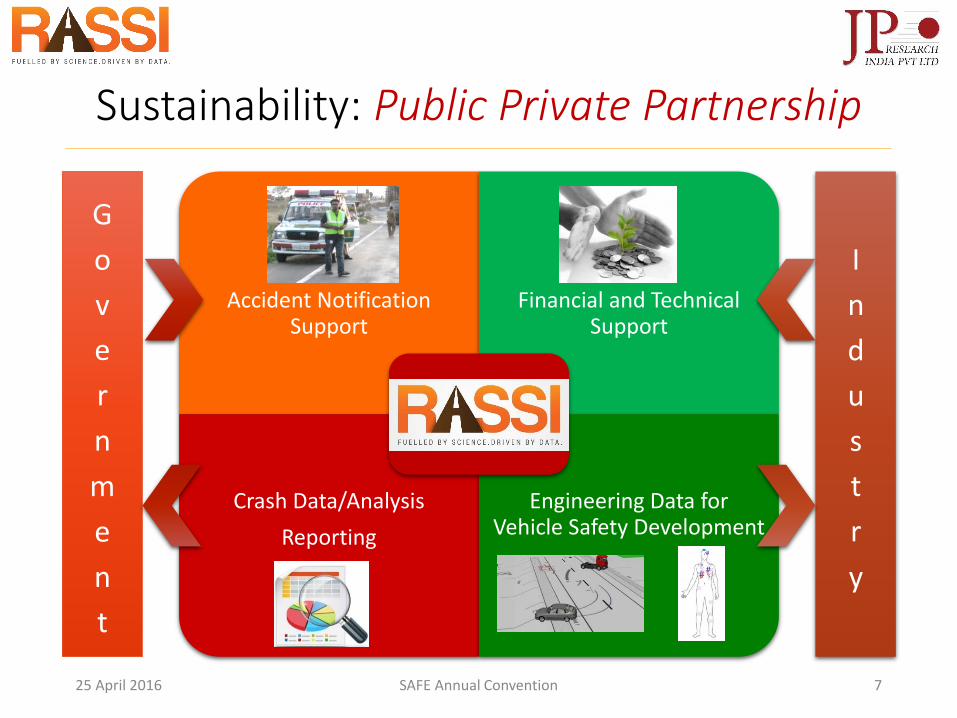
Sustainability: Public Private Partnership
G
o
v
e
r
n
m
e
n
t
I
n
d
u
s
t
r
y
Accident Notification Support
Financial and Technical Support
Crash Data/Analysis
Reporting
Engineering Data for Vehicle Safety Development
25 April 2016 SAFE Annual Convention 7
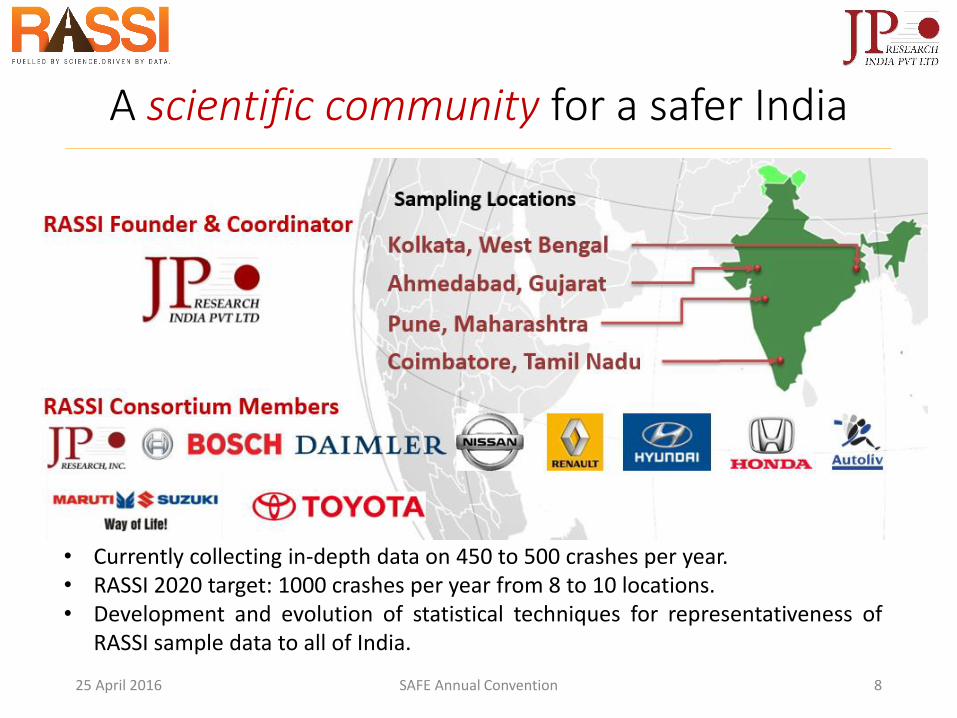
A scientific community for a safer India
• Currently collecting in-depth data on 450 to 500 crashes per year.• RASSI 2020 target: 1000 crashes per year from 8 to 10 locations.• Development and evolution of statistical techniques for representativeness of
RASSI sample data to all of India.
25 April 2016 SAFE Annual Convention 8
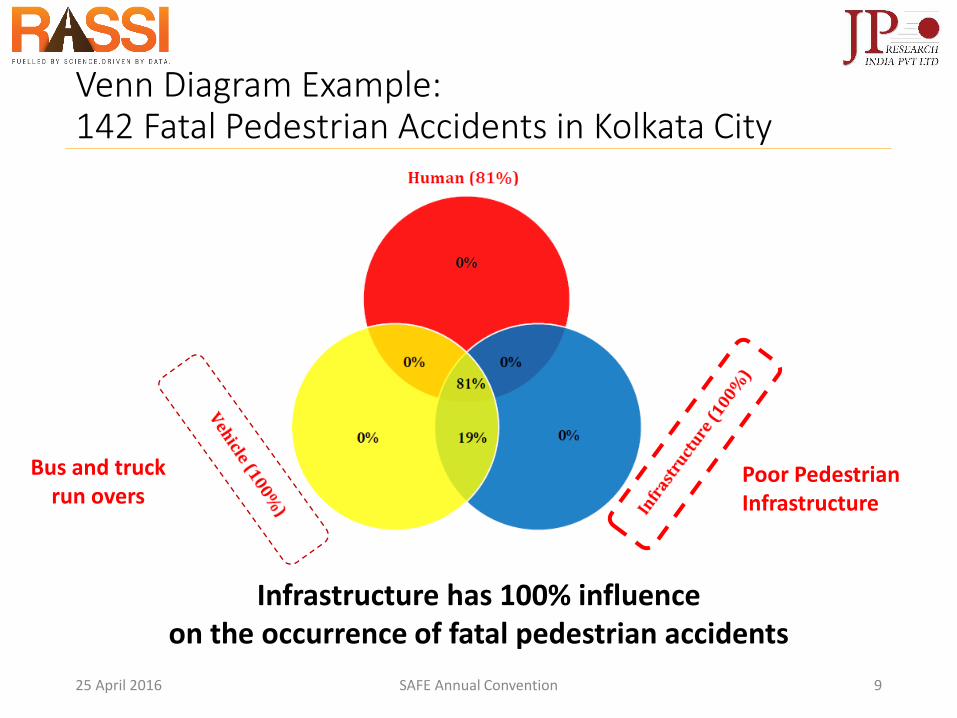
Venn Diagram Example: 142 Fatal Pedestrian Accidents in Kolkata City
25 April 2016 SAFE Annual Convention 9
Infrastructure has 100% influence on the occurrence of fatal pedestrian accidents
Poor Pedestrian Infrastructure
Bus and truck run overs
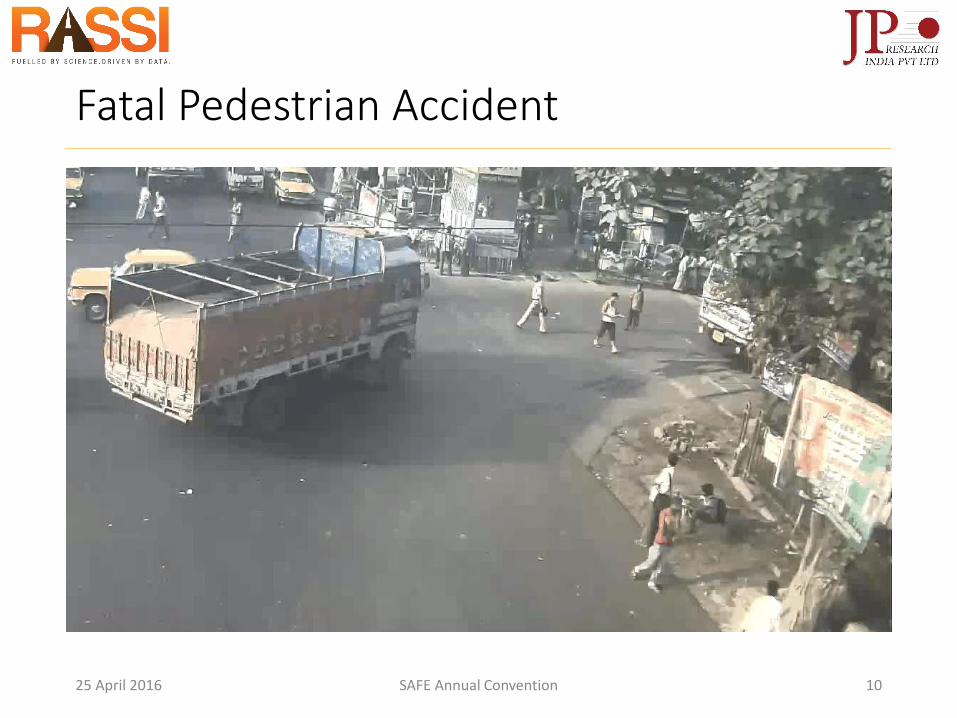
Fatal Pedestrian Accident
25 April 2016 SAFE Annual Convention 10
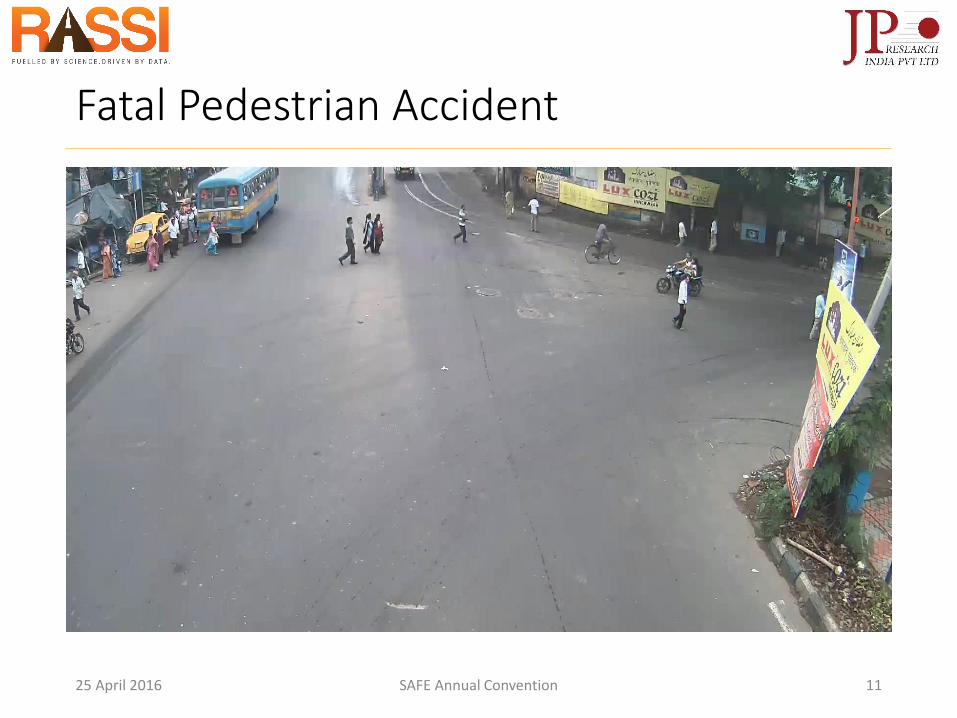
Fatal Pedestrian Accident
25 April 2016 SAFE Annual Convention 11
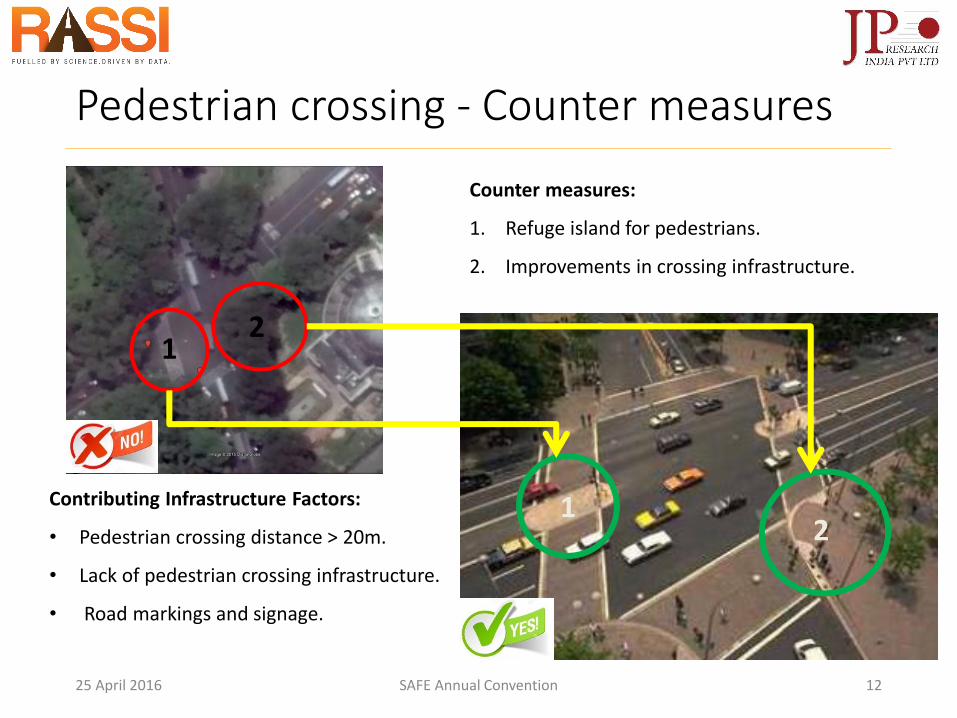
Pedestrian crossing - Counter measures
Counter measures:
1. Refuge island for pedestrians.
2. Improvements in crossing infrastructure.
12
12
Contributing Infrastructure Factors:
• Pedestrian crossing distance > 20m.
• Lack of pedestrian crossing infrastructure.
• Road markings and signage.
25 April 2016 SAFE Annual Convention 12
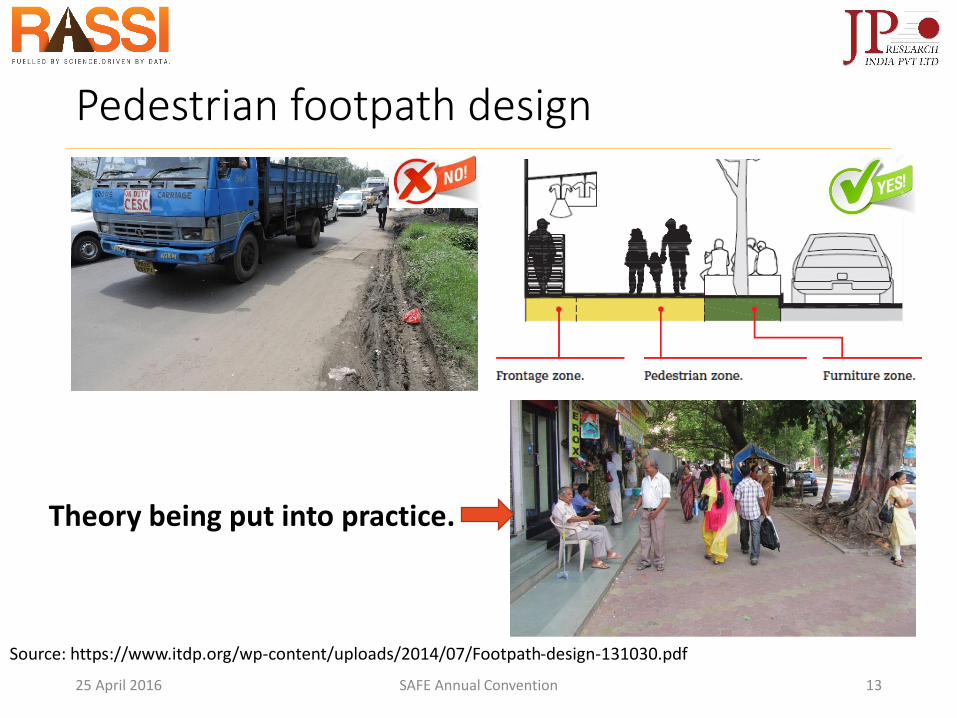
Pedestrian footpath design
25 April 2016 SAFE Annual Convention 13
Source: https://www.itdp.org/wp-content/uploads/2014/07/Footpath-design-131030.pdf
Theory being put into practice.
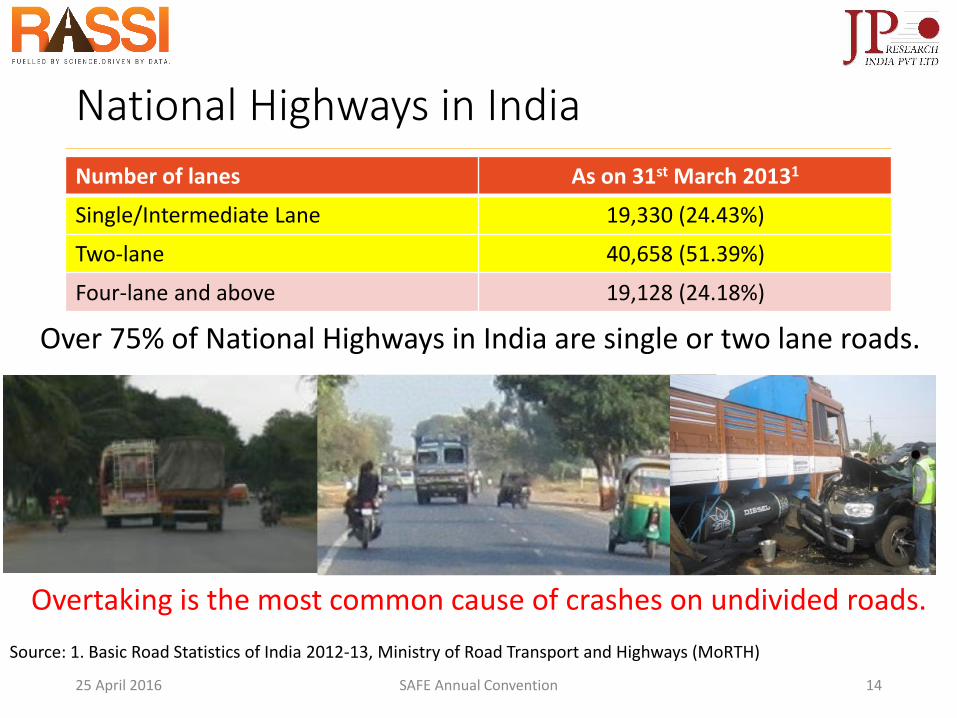
Number of lanes As on 31st March 20131
Single/Intermediate Lane 19,330 (24.43%)
Two-lane 40,658 (51.39%)
Four-lane and above 19,128 (24.18%)
National Highways in India
Over 75% of National Highways in India are single or two lane roads.
Source: 1. Basic Road Statistics of India 2012-13, Ministry of Road Transport and Highways (MoRTH)
25 April 2016 SAFE Annual Convention 14
Overtaking is the most common cause of crashes on undivided roads.
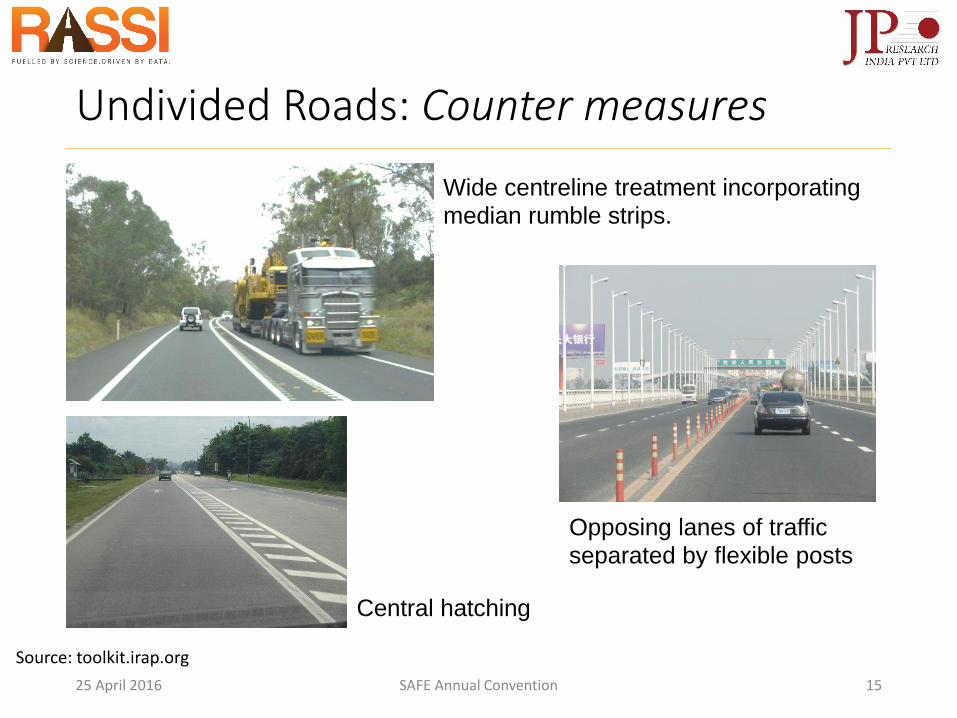
Undivided Roads: Counter measures
Wide centreline treatment incorporating
median rumble strips.
Opposing lanes of traffic
separated by flexible posts
Central hatching
Source: toolkit.irap.org
25 April 2016 SAFE Annual Convention 15
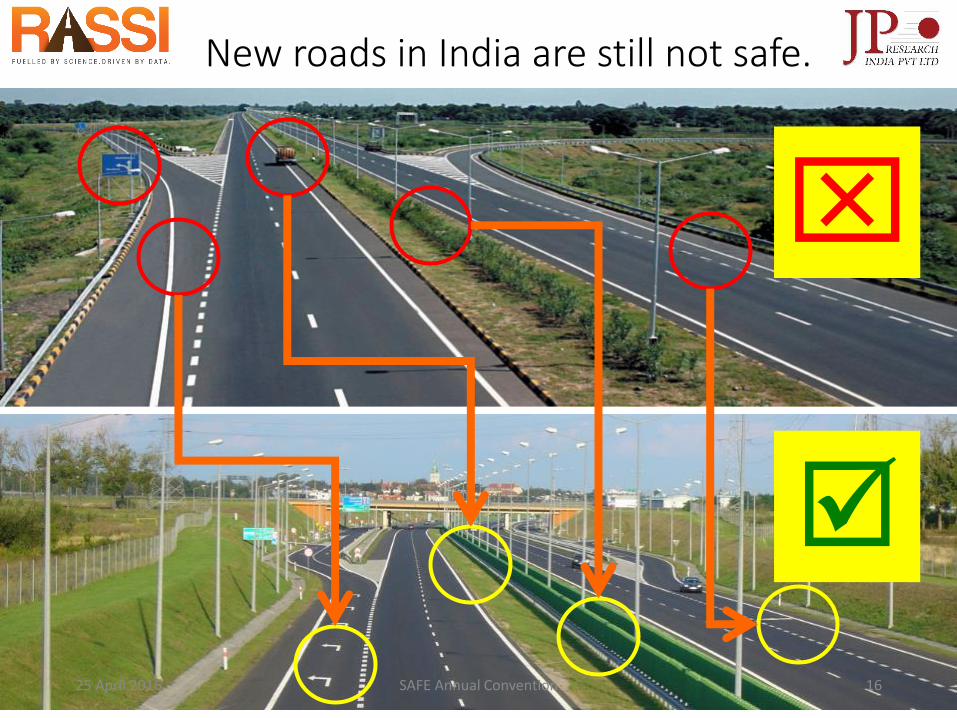
New roads in India are still not safe.
25 April 2016 SAFE Annual Convention 16
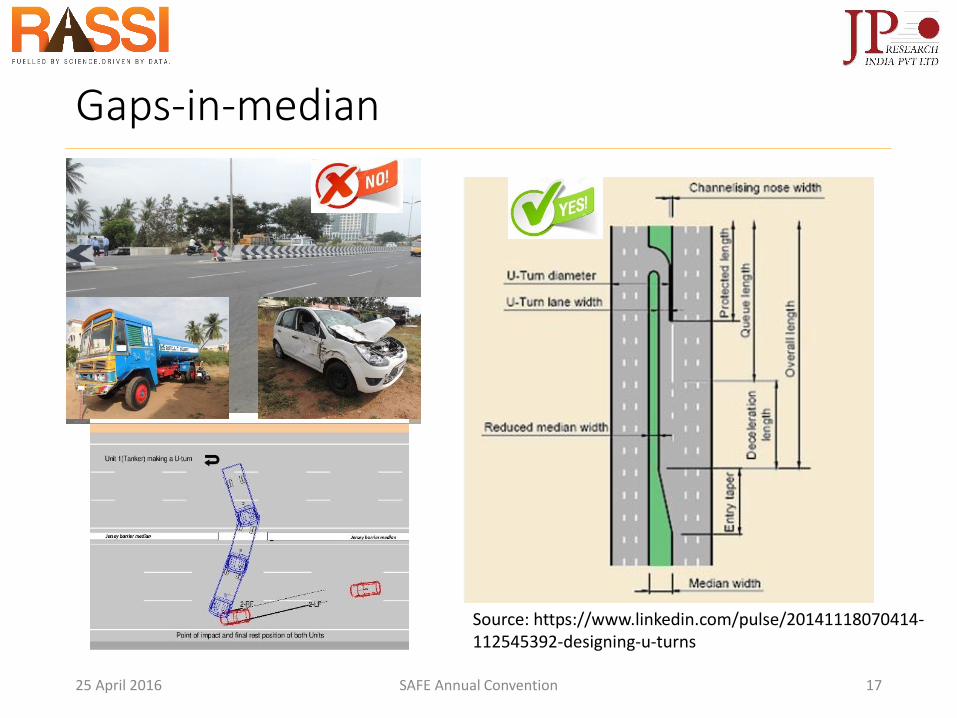
Gaps-in-median
Source: https://www.linkedin.com/pulse/20141118070414-112545392-designing-u-turns
25 April 2016 SAFE Annual Convention 17
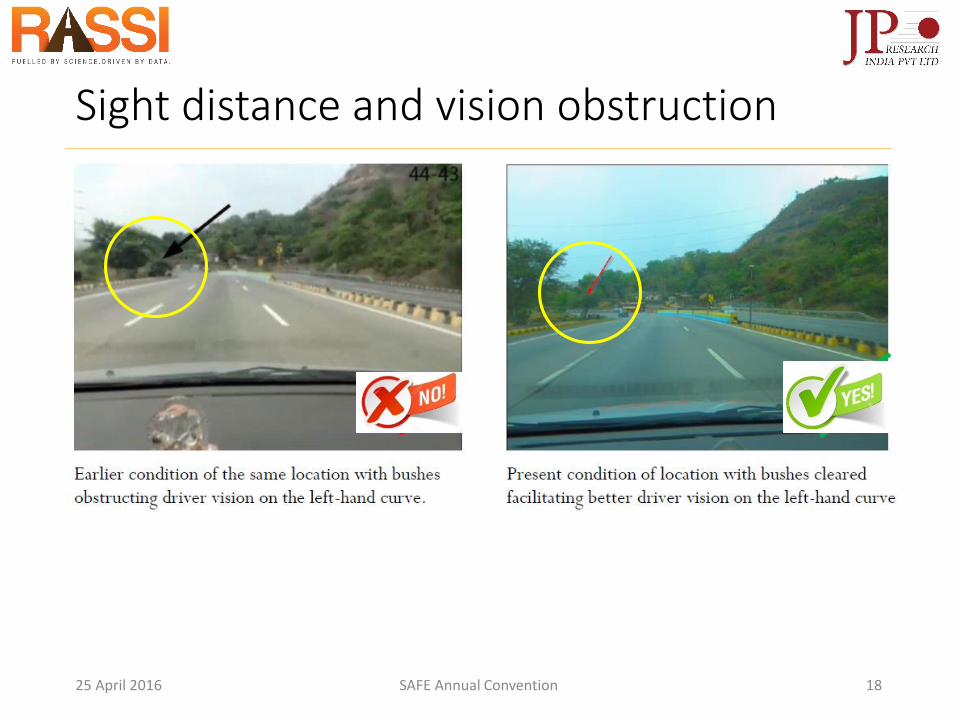
Sight distance and vision obstruction
25 April 2016 SAFE Annual Convention 18
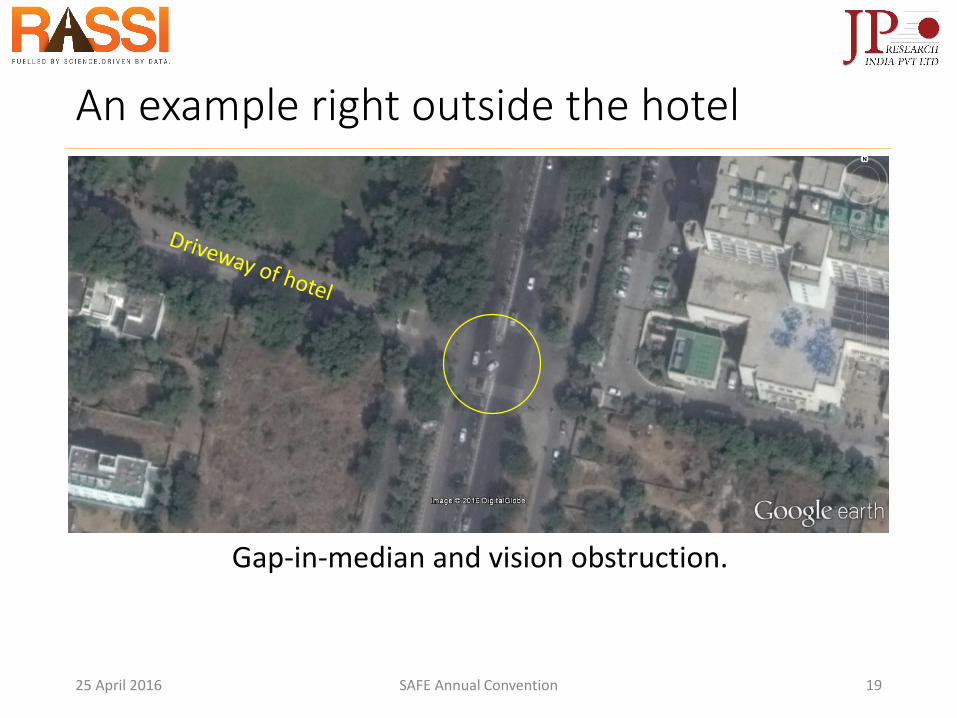
An example right outside the hotel
25 April 2016 SAFE Annual Convention 19
Gap-in-median and vision obstruction.
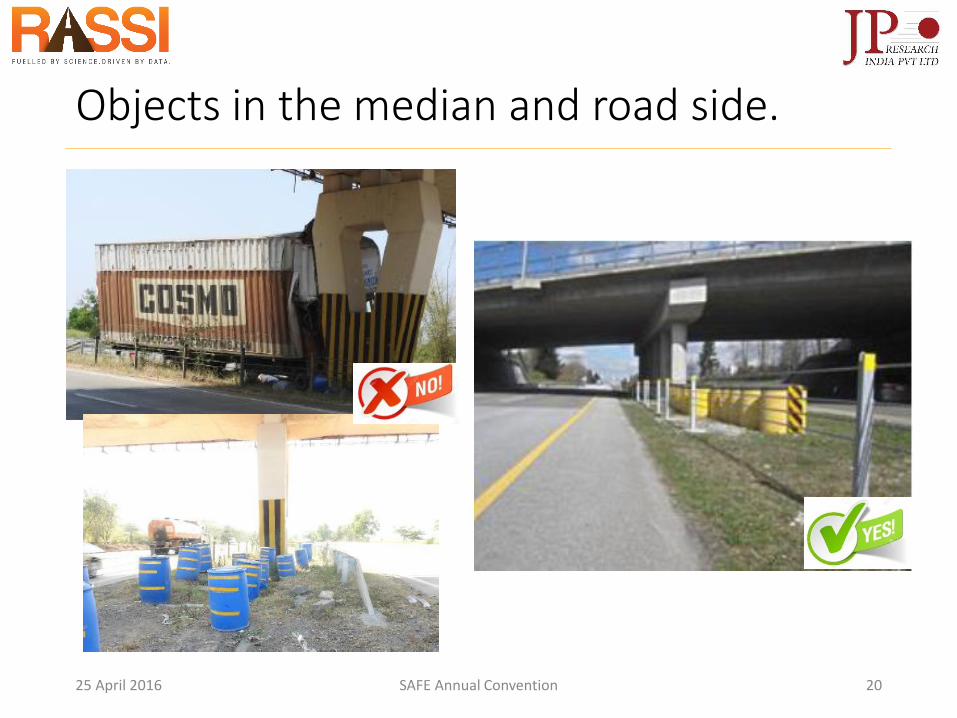
Objects in the median and road side.
25 April 2016 SAFE Annual Convention 20
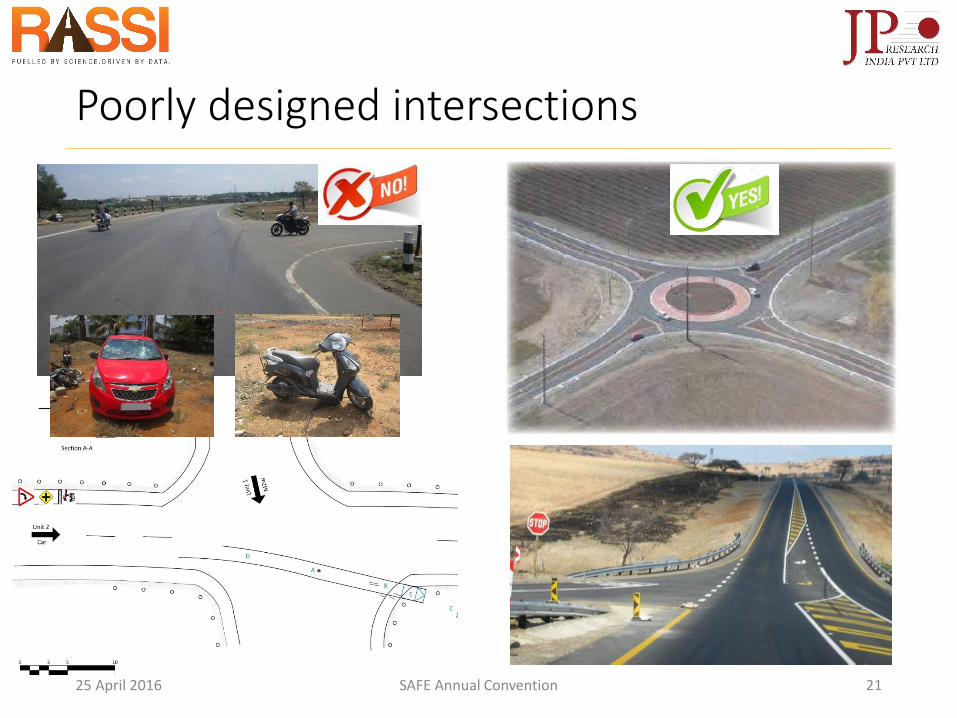
Poorly designed intersections
25 April 2016 SAFE Annual Convention 21
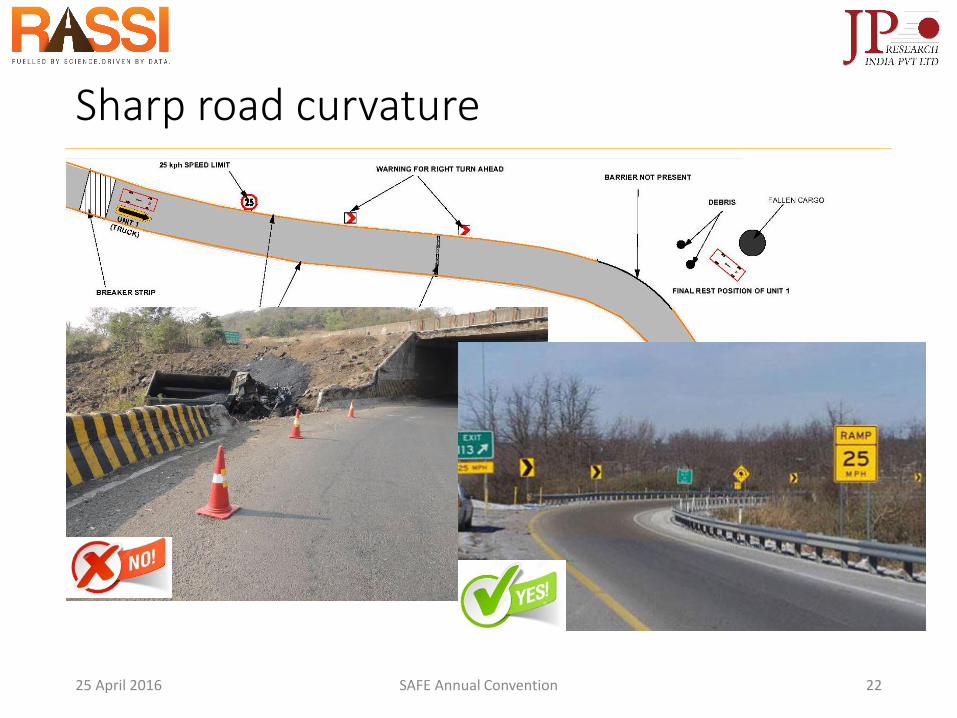
Sharp road curvature
25 April 2016 SAFE Annual Convention 22
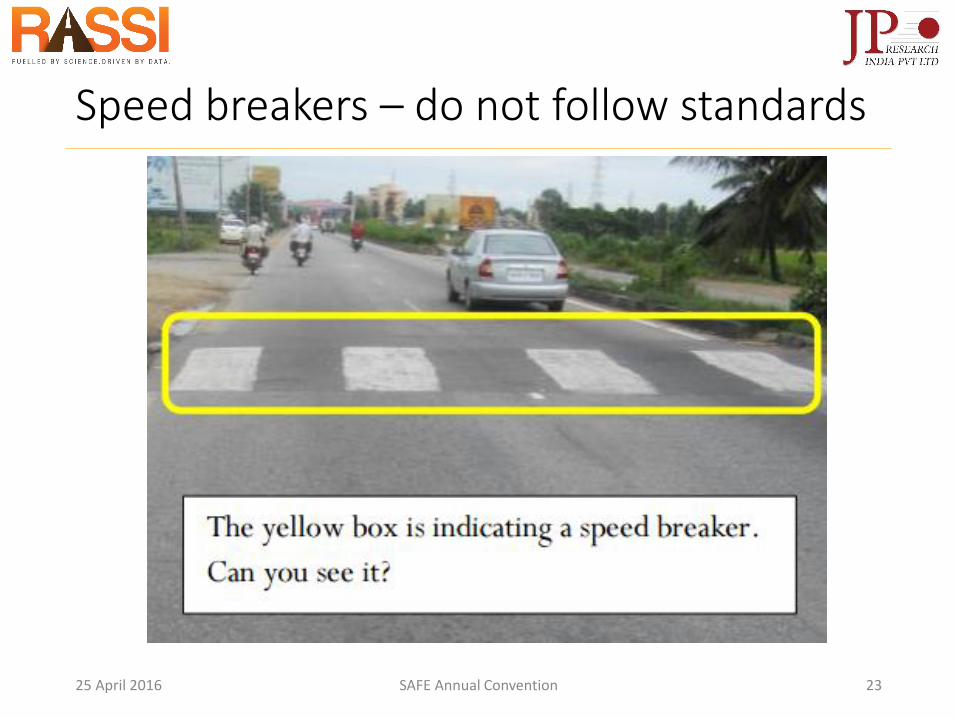
Speed breakers – do not follow standards
25 April 2016 SAFE Annual Convention 23
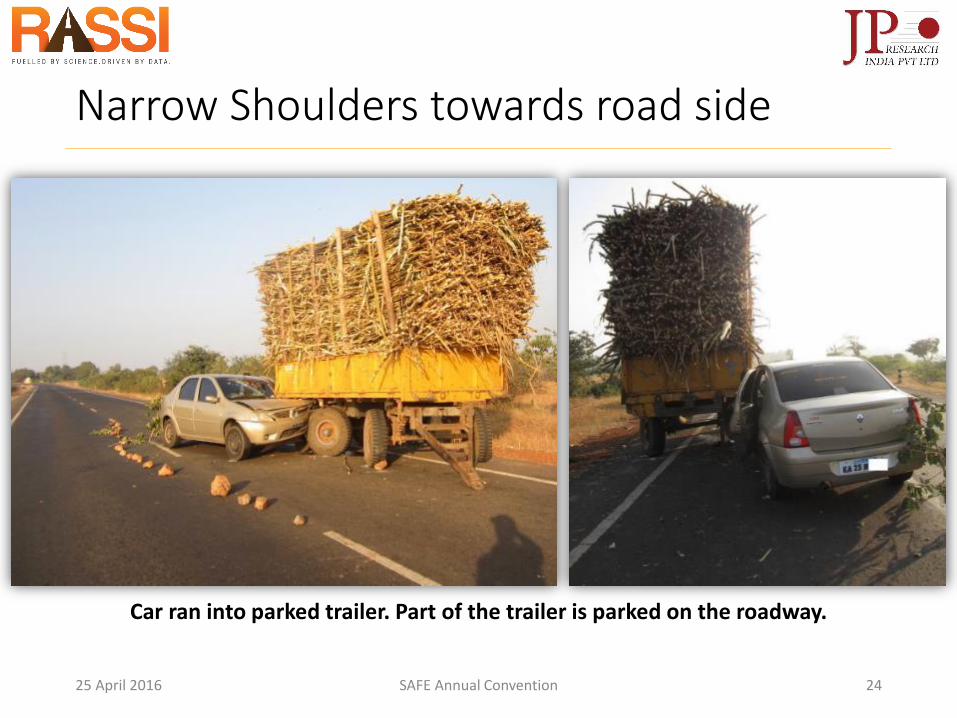
Narrow Shoulders towards road side
Car ran into parked trailer. Part of the trailer is parked on the roadway.
25 April 2016 SAFE Annual Convention 24
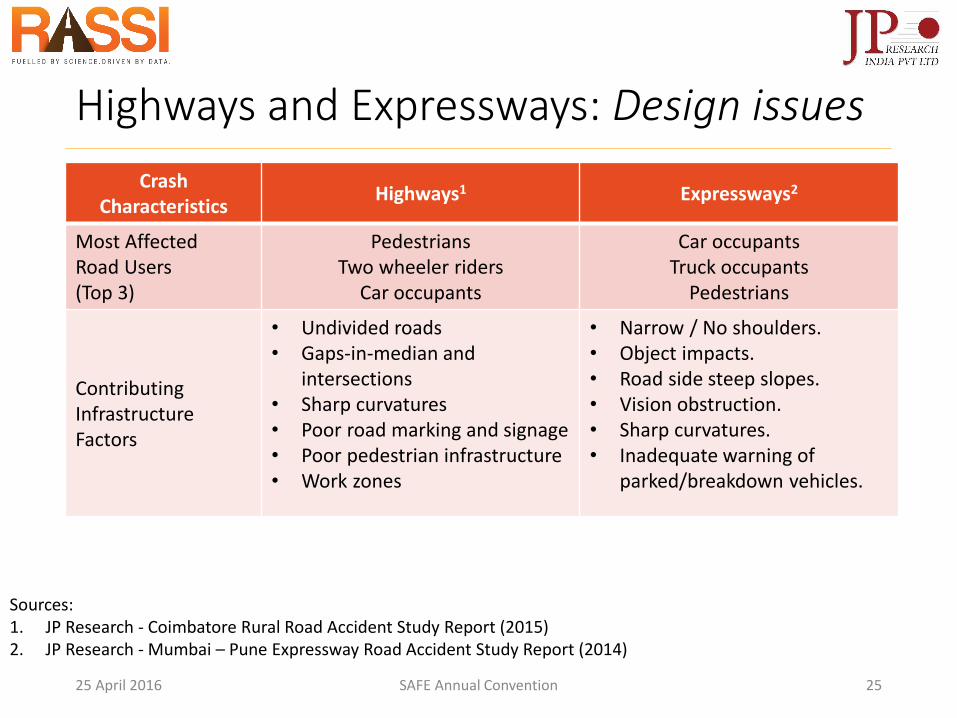
Highways and Expressways: Design issues
Crash Characteristics
Highways1 Expressways2
Most AffectedRoad Users(Top 3)
PedestriansTwo wheeler riders
Car occupants
Car occupants Truck occupants
Pedestrians
ContributingInfrastructure Factors
• Undivided roads• Gaps-in-median and
intersections• Sharp curvatures• Poor road marking and signage• Poor pedestrian infrastructure• Work zones
• Narrow / No shoulders.• Object impacts.• Road side steep slopes.• Vision obstruction.• Sharp curvatures.• Inadequate warning of
parked/breakdown vehicles.
25 April 2016 SAFE Annual Convention 25
Sources:1. JP Research - Coimbatore Rural Road Accident Study Report (2015)2. JP Research - Mumbai – Pune Expressway Road Accident Study Report (2014)
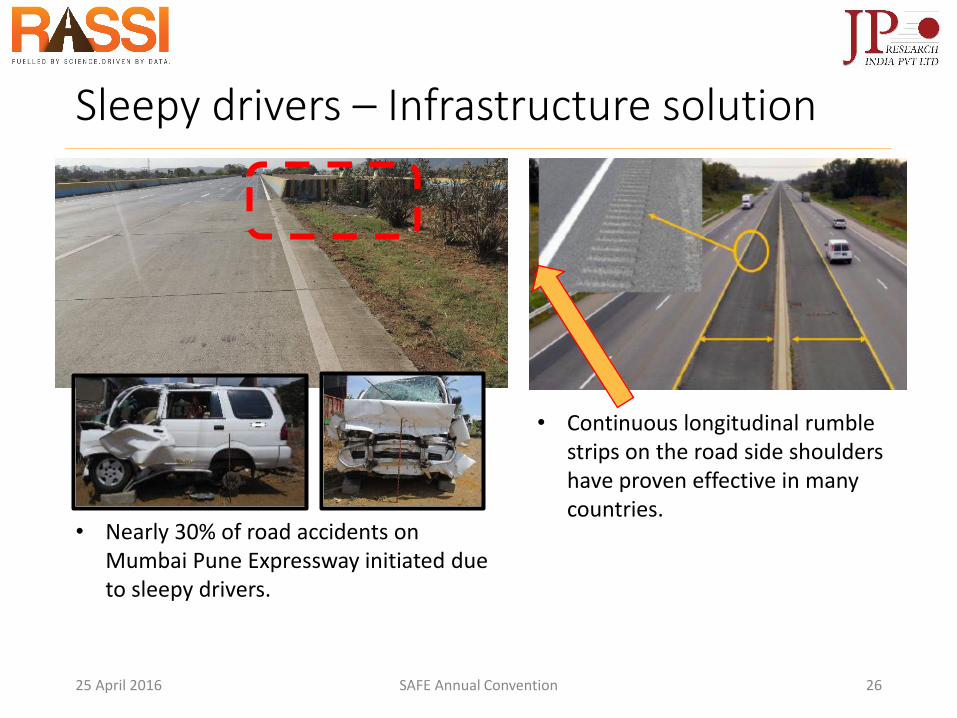
Sleepy drivers – Infrastructure solution
25 April 2016 SAFE Annual Convention 26
• Nearly 30% of road accidents on Mumbai Pune Expressway initiated due to sleepy drivers.
• Continuous longitudinal rumble strips on the road side shoulders have proven effective in many countries.
Conclusion
• Road design is a significant factor influencing the occurrence of accidents and injuries on Indian roads.
• Venn diagram analysis needs to be applied for a better understanding of road accident contributing factors.
• Lack of road design and traffic engineering expertise in India. Functional pedestrian infrastructure in urban areas.
Road geometry based on speed and channelization of traffic.
Driver sight distance and reaction time.
Vehicle deceleration rate and turning radius.
• Huge requirement of capacity building.
25 April 2016 SAFE Annual Convention 27