traffic management hossein naraghi ce 590 special topics safety january 2003 time spent: 13 hrs
TRANSCRIPT
Traffic Management
Hossein Naraghi
CE 590 Special Topics
Safety
January 2003
Time spent: 13 hrs

Road network and functional hierarchy
Traffic management is a process of adjusting or adapting the existing road network to improve traffic operations without major construction
Traffic management objectives may include Traffic efficiency
• Road capacity Improved environment amenity
• Reduced noise
Traffic management objectives (continued)
Enhanced access• Better access for particular group of road
users• Pedestrians• Bicyclists• Freight vehicles
Road safety
These objectives may potentially be in conflict of each other, so priorities may have to be determined.
Road functions and functional hierarchy
The use of traffic management to pursue safety objectives must take place in the context of a clear view of the functions of a road network, which is referred to as functional hierarchy.
Road’s function is the prime determinant of the management of any given road within the overall network.

Road functions and functional hierarchy (continued)
There are essentially two needs from a road function point of view The traffic movement function
• The role of roads in providing a means to transfer people and goods from one place to another; these roads constitute the arterial road network
The access function• The role of these roads is providing access to abutting
properties and land uses; these roads constitute the local road network
Ideally each road would perform one of thesefunctions, but in practice there are many roadsthat perform both functions

Road functions and functional hierarchy (continued)
The only roads that do not have an access function are those which are access controlled The only access is via ramps at interchanges
• Freeways Access from abutting property is oriented away
from the road• Sometimes done with distributor roads in residential
neighborhoods Access via frontage roads paralleling an arterial
roads

Road functions and functional hierarchy (continued)
The roads which carries both functions of access and mobility, create a major challenge for traffic management Tend to have very poor crash record as a result
of their mixed and inherently conflicting functions
People living and working along them seek to use them for
• Access purposes• Exiting and entering properties• Parking in the street
Have significant pedestrians and bicycle activities in residential areas
Road hierarchy as a network planning tool
The basis for any traffic management plan is usually the development of road hierarchy and agreement to it by various stakeholders.
Main objectives Prevent residential areas being used by through
traffics Influence driver behavior to follow planned routes at
moderates speeds, with proper attention being given to pedestrians and bicyclists
Use physical devices in support of legal regulations in order to overcome the lack of enforcement for such measures as speed limits, one way streets and turning prohibitions.

Road hierarchy as a network planning tool (continued)
Local roads, which have solely an access function, will have objectives related to local amenity and safety If road configuration does not allow these
objectives to be met, then there is a need for some form of treatment
Similarly roads with mixed functions will need some kind of treatment in order to satisfactory achieve both safety and mobility
There is also an urban space which is motor vehicle-free
• Mobility is solely provided by walking and bicycling
Road hierarchy as a network planning tool (continued)
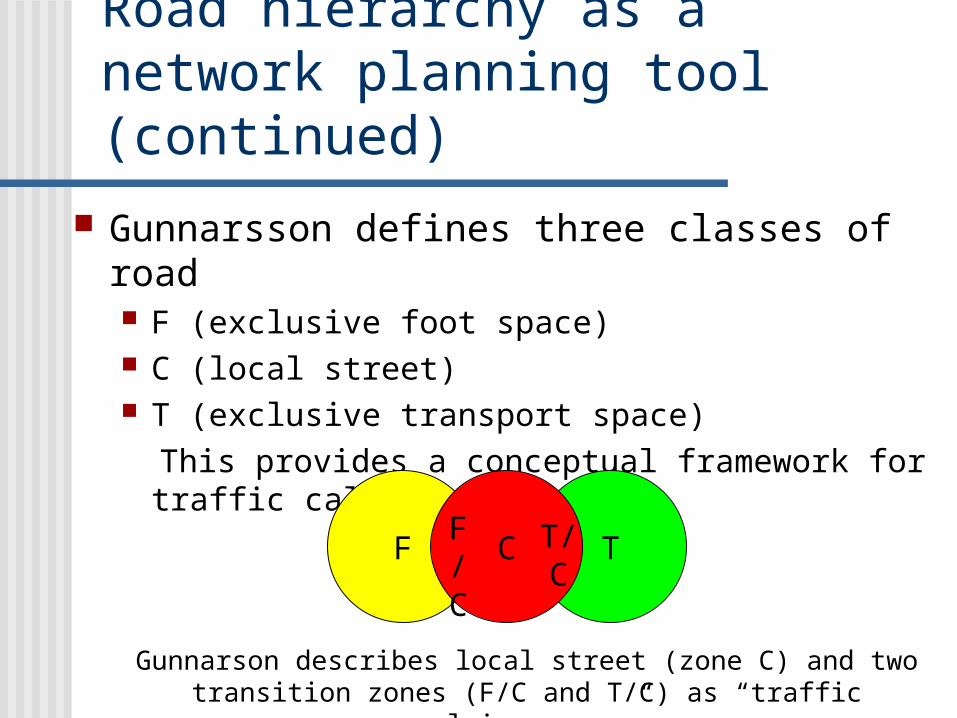
Gunnarsson defines three classes of road F (exclusive foot space) C (local street) T (exclusive transport space) This provides a conceptual framework for traffic
calming
TF CF/C
T/C
Gunnarson describes local street (zone C) and two transition zones (F/C and T/C) as “traffic calming space”

Lessons for new network
Wallwork (1993) said: “Traffic calming is a negative reaction to a
problem caused by bad planning, zoning and/or street design. We need to be proactive in our approach and learn from the past and others”
This is mainly involve• Attention to network layout• Ensure that problems are not built in• Attention to detail in civic design
• To ensure that an appropriate balance of built and open spaces and the connection between them are provided
Lessons for new network (continued)
Research for the safety aspects of road network design summarized the key network planning principles for new residential areas as follows Strict differentiation of streets according to their
traffic function leads to safer residential areas Distribution of traffic into residential area with
multiple access from a ring road is safer than central distribution

Lessons for new network (continued)
Full segregation of vehicle, pedestrians and bicycle movements is accompanied by very low accident rates
Cul-de-sac streets are safer than loop streets, which in turns are safer than ordinary through streets
Crash rate is minimized where frontage access is prohibited

Traffic management or traffic calming
There have been many different interpretations of traffic calming in different countries
A useful resolution of this conflict of interpretation has been proposed by Brindle Traffic calming is used encompasses two axes
• The scope of the measure• Local, intermediate or citywide
• The type of measure• Use of physical devices and regulations• Social/cultural change
Area treatments Area treatments divided into two
distinct types Applicable to low density residential
development• Aim to control speeds which are in excess
of a statutory speed limit of around 30-35 mph
Used in higher density cities• Aim is to reduce speed to around 20 mph
Area treatments (continued)
Safety effectiveness Traffic management schemes are usually successful
in reducing• Vehicle speeds • Sometimes traffic volumes• But whether they increase objective safety; as
measured by accident, is open to question An in depth analysis of accident pattern within case
study area in Sydney concluded that• Many of traffic management devices used extensively
in local area fail to resolve the dominant types of accidents occurring on local streets
Area treatments (continued)
The dominant types of accident were Cross traffic Right-through Rare end Hit parked vehicles
Local area traffic management schemes may not be as effective in reducing accidents as many practitioners believe
However, there were several studies which have revealed the positive effects of traffic management schemes

Area treatments (continued)
Environmentally adapted through roads This is one which retains its status as an
arterial road• Traffic efficiency role is curtailed, so other
environmental or amenity goals may also be realized
There are two typical application• Bypass towns• Adaptation of roads still fulfilling their
arterial function
Area treatments (continued)
In either case, treatments typically involve some or all of the following A form of gateway treatment using signs and
town entry features to• Emphasize the changed status of the road• Encourage slower driving• Provide a sense of identity
Speed restricting devices• Road narrowing• Road humps
Enhanced pedestrians and bicyclists facilities

Area treatments (continued)
Improved parking especially for bypass towns• The town can rejuvenate as a business center when
through traffic is removed Change traffic furniture like lighting and seating Enhanced signing A roundabout at the start and end of the town
• To ensure traffic slows Narrower lanes Change in road surface including color and texture Additional traffic control measures
• Traffic signal• Pedestrian crossing
Area treatments (continued)
Problems and difficulties There is a negative response from affected
parties which needs to be considered Brindle (1992) reported a citizen group
opposition to traffic calming (especially speed humps) in the following terms They discriminating against law-abiding road
users They are dangerous to bicyclists and motor
cyclists, especially when wet
Problems and difficulties (continued)
They cause unnecessary wear and tear on motor vehicles
They disadvantage some local businesses Their lighting is a source of annoyance to some
residents They hinder emergency vehicles They waste taxpayer’s money They make some motorists more aggressive and
impatient They detract from the environment
• lights, signs, noise
Problems and difficulties (continued)
They devalue property They are inappropriate for heavy vehicles They increase road maintenance costs They cost people timeSome of these points are not without validity considerations such as these mean that the
development of traffic calming schemes requires careful design and sensitive implementation
Speed management Speed may be managed in two ways
Traffic calming• Using physical devices aimed to restrict the
speed of vehicles Imposition of speed limits
Speeds and safety There is clear evidence of the effect of
speed on accident rates As travel speeds drop, the impact speeds
drop, and collision may be avoided
Speed management (continued)
Organization for Economic Cooperation and Development has quantified the effect of speed on accidents and accident severity, based on Swedish data The percentage drop in accident rates outside built up area
is n times the percentage drop in mean speed• n = 4 for fatal accidents• n = 3 for injury accidents• n = 2 for all accidents
In urban areas, there are two distinct speed related accident problems Injury to drivers and passengers of vehicles where speed is
in excess of posted speed limits
Speed management (continued) Injury to vulnerable road users
• Pedestrians and bicyclists• In many cases the driver is within the speed limit
• McLean, et al, 1994 based on a detailed study of 146 fatal pedestrian crashes found that 45 percent of these would probably survived if vehicle struck them with 10 km/h slower speed
Speed Limits Speed limits affect travel speed and therefore should
affect accidents specially in urban areas and roads with limited design standards
There is less clear evidence of affect of speed limits on crashes in rural areas
Different studies found different results on affect of increasing speed limit in rural areas

Speed limits and travel speeds
Speed limits affect safety only if they affect actual travel speed
The influence of speed limit relies Reasonableness of speed limit as perceived by
driver On enforcement
Reasonableness of speed limits ‘In order to bring about a reduction in mean
speed and speed dispersion, a speed limit should be set at 85 percentile of existing speeds, or at a lower level ( but not too far below)’
Reasonableness of speed limits (continued)
Road environment factors affecting the perception of driver about the reasonableness of speed limit
• Alignment• Urban or rural environment• Road category• Lane width• Roadside development• Traffic density• Sight distance• Parked vehicles• Pedestrians• Day and night vision

Enforcement Enforcement would result in a reduction in
mean speed and in the spread of speed This will lead to reduction in crash number and
severity Automated speed enforcement have been
effective in reducing speed• Not only on the site where they have been set up• But also in leading to a change in attitudes towards
speeding• The wide spread use of speed cameras has already
produced a change in driver attitude in Australia where portable speed cameras have been in use for several years
Differential speed limits for heavy vehicles
‘There is evidence that accident rates are related to the dispersion or variance of speeds of vehicles in the traffic stream’
Many different studies reported the chance of being involved in an accident follows a U-shaped distribution (Figure 13.4 page 335) The minimum occurring when the vehicle is
traveling at about the average speed of traffic, or slightly above
As vehicle speeds move significantly above or below the average speed, the probability of being involved in a crash increases dramatically
Differential speed limits for heavy vehicles (continued)
There is an argument that there should not be a speed limit differential between heavy vehicles and other road vehicles Evidence to support this produced in US following the
introduction of nationwide 55 mph car speed limits in 1974, the observed speed differential between cars and trucks was reduced
Radwan and Sinha examined the effect of this on truck accidents and found
• There had been reduction in heavy truck crash rates in all severity types (fatality, injury and PDO) on freeways
• On four-lane and two-lane rural highways, the reduction occurred only for injury crashes
• The reductions were attributed to an absolute reduction in speeds and decreased speed dispersion
Setting speed limits
There are four types of speed limits1. General limits
Impose by statute and are applicable to all roads in an area unless signed otherwise A general urban or rural limit
2. Speed zones Speed limits applied to a specific road
depends on the road’s design characteristics and its traffic and land use characteristics Varying by time of day
Setting speed limits (continued)
3. Vehicle limits Apply to specific classes of vehicle
Trucks and buses
4. Driver limits Apply to specific classes of driver
Learners
Formal management of vehicle speeds using any of these legally enforceable speed limits involves
• Establishing a balance between safety, mobility, and amenity for users
Setting speed limits (continued)
• Meeting driver expectation• Making speed limits more or less self enforcing
• Achieving consistency across the jurisdiction • Ability to deter offenders by appropriate levels
of enforcement• Developing a culture of compliance• Minimizing the cost of signing and enforcement
A systematic approach to setting speed limits in a speed zoning context is the expert system called VLIMITS developed by the Australian Road Research Board which considers the factors shown in Table 13.1 page 339
Setting speed limits (continued)
VLIMITS is used as a basis for a major statewide speed limit review in Victoria
The guidelines to use various speed limits are as follow Shared zone (6 mph)
• Vehicles and pedestrians sharing the same road space• Service vehicles in shopping malls
Local traffic area zone (24 mph)• Traffic management works have been undertaken to
physically limit the speed Local street speed limit (30 mph)
• Local access or collector roads with abutting development
Setting speed limits (continued)
General urban limit (36 mph)• Applies to all urban roads that do not meet the
criteria for higher or lower speed limit• Undivided or divided arterial roads with substantial
abutting development• Collector roads with higher standard
• 25 ft between curbs and carrying above 5000 vpd
Urban (42 mph)• Divided roads with direct access to through
roadway• Undivided roads with low traffic volumes, little
or no abutting development

Setting speed limits (continued) Urban (48 mph)
• Divided roads with substantial abutting development with little or no direct access
• Undivided roads with limited amount of abutting development
General rural limit (60 mph)• Little or no abutting development and widely spaced
intersection Rural freeway (66 mph)
• Applies to high standard rural freeways• meet the current design standards• Have a 30 ft roadside clear zone• Accident rate of less than one fatal accident per 1.2 miles
per year• Widely spaced interchanges (greater than 2 miles)
Devices and techniques for managing speed and volume
Type of devices and techniques available for keeping speed low falls into six categories
1. Regulatory devices Speed limits Stop and yield signs No-turn signs One-way operation
2. Network modifications Street closure at intersection Link closure
Devices and techniques for managing speed and volume (continued)
Partial street closure Diagonal closure of intersection
• Placement of a barrier diagonally across a cross-intersection, to create two right-angle bends instead of an intersection
Closure of median opening Pedestrian refuge and/or narrow median
3. Devices used at intersections Roundabouts
• Resolves priority issues in local streets• Vehicle is required to divert from a straight line• Reduce vehicle speed

Devices and techniques for managing speed and volume (continued)
Klyne (1988) established an empirical relationship between speed and path radius
V=6√R/S V = 95 percentile speed (km/h) of through
vehicles R = radius of centerline of vehicle path (meters) S = sight distance factor (S=1.0 for good sight
distance, up to 1.53 for poor sight distance This formula suggests that to keep 95 percentile speeds
through an intersection to 30 km/h, the roundabout geometry should be such that the path radius developed can not be greater than 80 feet
Devices and techniques for managing speed and volume (continued)
Channelization To reallocate priority at an intersection
• At t-intersection to give priority to vehicles traveling around a curve
To deter speeding by motorists on the top of the t-intersection by requiring them to slow down to negotiate the device
3. Devices relying on vertical displacement Road humps
• Bump• A pipe half –buried which can potentially damage the vehicle
and cause loss of control

Devices and techniques for managing speed and volume (continued)
• TRRL or Watts profile hump• Circular in shape, about 2 to 5-inches high and 10-
13 ft in length
• Flat-topped or plateau road hump• Similar in effect with circular humps but more user
friendly (Figure 13.11 page 349)• Has straight approach and departure ramp
(typically 1:10 to 1:15) and a flat top,• Length of flat top varies from 7 to 24 ft, so that
vehicle has both axle on plateau
• Rumble devices• May be placed transversely across the pavement to
alert the driver to approaching hazard• Intersections or pedestrian crossing

Devices and techniques for managing speed and volume (continued)
3. Devices relying on horizontal displacement Chicanes
• Feature extending into the roadway from the curb which referred to as “build outs” in UK and “curb extensions” in Australia (Figure 13.12 page 351)
Pinch points• Sometimes referred to as “slow points” is a short
section of a narrow road• Introduces a sudden change in road configuration
(Figure 13.13 page 352) Restructured parking
• Rearrangement of parking can be an effective speed control measure (Figure 14.2 page 371)

Devices and techniques for managing speed and volume (continued)
3. Gateways May be used at the entrance to towns to
announce the start of the build up environment with devices such as• Pinch points• Changes in surface texture and/or color• Road humps• Signing• Landscaping features
• Planting• Street furniture

Implementation of devices
Useful guidelines in implementing devices introduced based on worldwide researches Network configuration should be such that the
amount of traffic volumes in residential streets are in the range of 2000-3000 vpd
Wide, long streets with house frontages have a poor safety record and should be avoided
Network discontinuities can be made to discourage the entry of non-local traffic
Intersections along street within the residential network should be separated by at least 70 ft
Implementation of devices (continued)
Action is usually required when 85 percentile speeds exceed 35 mph
The effect of speed control devices is localized, which introduce the following relationships between 85 percentile speeds and spacing
• 18 mph : 250 ft spacing• 24 mph : 330 ft• 27 mph : 500 ft• 36 mph : 670 ft
Chicanes should not be used when traffic volume exceeds 600 vph

Implementation of devices (continued)
Chicanes will constraint vehicle speed to less than 20 mph if it is 30-45 ft long
Chicanes and road humps should only used on straight sections
Rumble devices can be problem for bicyclists and pedestrians
• They should not exceed 0.6 inches in height and a gap of about 30 inches be left between the device and curb to allow passage for bicycles
Road humps lower than 2 inches give virtually no slowing effect

Parking An important task for traffic management is
how and where to store the vehicles since they are spending the majority of their time at rest Parked or parking vehicles are particularly
associated with pedestrian fatalities Ross Silcock Partnership suggest that planning for
parking involves consideration of three factors• The need to maximize access to traffic generating
facilities• The need to minimize interruption to moving traffic• The need to minimize traffic accidents

One-way streets One-way streets tend to be inherently safer
than two way streets Friction from an opposing traffic stream has been
removed Generally one-way operation leads to
Higher speeds and longer trips Fewer stops Traffic flow tends to be more orderly More confusing for pedestrians, but on the other
hand conflicts at intersections are reduced Pedestrian accidents and accidents at low volume
unsignalized intersections are particular problems
Truck routes Control of trucks through truck routing is a
means of implementing an urban traffic management scheme Its application is to pursue amenity objectives, not
safety objectives The only reference from the safety stand point is
to trucks routing of hazardous materials Certain ideal guidelines from a number of studies
to address the routing for trucks which are carrying hazardous materials are as follow:
• All freeways and control access facilities are likely to be suitable

Truck routes (continued)• Routes should be as direct as possible• Routes should be less densely populated• Routes should avoid the centers of population
concentration, such as schools, shopping centers, hospitals and so on
• Routes should possibly be free of physical characteristics, such as low overhead clearance, steep grades, narrow lanes
• Rail level crossing should be avoided• Crossing over open water supply should be
avoided