traffic injuries to children and young people. data sources the following data sources were used:...
TRANSCRIPT

Traffic injuries to children and young people

Data sourcesThe following data sources were used:
STATS19
Police reported road accidents
England only
0-24 years
Confidence intervals:
All confidence intervals shown in the slides are 95%.
Hospital Episode Statistics (HES)
Emergency hospital admissions only
England only
0-24 years
ICD-10 codes: V01-V89. Non-traffic injuries filtered out.
2 Traffic injuries to children and young people
DefinitionsThe following definitions are used in STATS19:
Fatally injured/killed: Human casualties who sustained injuries which caused death less than 30 days after the accident. Confirmed suicides are excluded.
Serious injury: An injury for which a person is detained in hospital as an “in-patient”, or any of the following injuries whether or not they are detained in hospital: fractures, concussion, internal injuries, crushings, burns (excluding friction burns), severe cuts, severe general shock requiring medical treatment and injuries causing death 30 or more days after the accident. An injured casualty is recorded as seriously or slightly injured by the police on the basis of information available within a short time of the accident.
Slight injury: An injury of a minor character such as a sprain (including neck whiplash injury), bruise or cut which are not judged to be severe, or slight shock requiring roadside attention.
3 Traffic injuries to children and young people

Data source Severity Males Females Male to
female ratio
STATS19 Killed 1,786 530 3.4 to 1
Seriously injured 25,521 10,259 2.5 to 1
Slightly injured 164,034 120,441 1.4 to 1
HES All admissions 45,420 23,237 1.95 to 1
Road casualties and emergency hospital admissions | 0-24 years | by sex | 2008-12
Traffic injuries to children and young people
Source: DfT, Reported Road Casualties Great Britain (STATS19)
4 Traffic injuries to children and young people

Road user type Fatal injuriesKilled or seriously
injured (KSI)All severities
Pedestrian 412 11,366 55,392
Cyclist 116 3,762 27,422
Motorcyclist 379 7,827 34,538
Car occupant 1,354 14,133 189,446
Taxi/PHV occupant 9 162 3,028
Minibus/bus/coach occupant
8 259 7,013
Other road user 38 590 5,774
Total 2,316 38,099 322,613
Road casualties | 0-24 years | by road user type | 2008-12
Traffic injuries to children and young people
Source: DfT, Reported Road Casualties Great Britain (STATS19)
5 Traffic injuries to children and young people

Emergency hospital admissions | 0-24 years | by road user type | 2008/09 -2012/13
Traffic injuries to children and young people
Road user type Admissions
Pedestrian 16,070
Cyclist 15,050
Motorcyclist 10,472
Car occupant 18,080
Other road user 8,985
Total 68,657
Source: Hospital Episode Statistics (HES). Copyright © 2014 Re‐used with the permission of The Health and Social Care Information Centre. All rights reserved.
6 Traffic injuries to children and young people

Killed or seriously injured | rate per 100,000 population | by age band | 2008 to 2012
Traffic injuries to children and young people
0-4 5-9 10-14 15-19 20-240
20
40
60
80
100
120
20082009201020112012
Age band
KS
I ra
te p
er
10
0,0
00
po
pu
lati
on
Source: DfT, Reported Road Casualties Great Britain (STATS19)
7 Traffic injuries to children and young people

Emergency hospital admissions | rate per 100,000 population | by age band | 2008/09 to 2012/13
Traffic injuries to children and young people
0-4 5-9 10-14 15-19 20-240
20
40
60
80
100
120
140
160
180
20082009201020112012
Age band
Ad
mis
sio
n r
ate
pe
r 1
00
,00
0 p
op
u-
lati
on
Source: Hospital Episode Statistics (HES). Copyright © 2014 Re‐used with the permission of The Health and Social Care Information Centre. All rights reserved
8 Traffic injuries to children and young people

Least deprived Fourth most deprived
Third most deprived Second most deprived
Most deprived270
280
290
300
310
320
330
340
350
360
370
Deprivation quintile
Ca
su
alt
y r
ate
pe
r 1
00
,00
0 p
op
ula
tio
n
Road casualties | 0-24 years | rate per 100,000 population | by IMD quintile | 2008-12
Traffic injuries to children and young people
Source: DfT, Reported Road Casualties Great Britain (STATS19)
9 Traffic injuries to children and young people

Emergency hospital admissions | 0-24 years | rate per 100,000 population | by IMD quintile | 2008/09-2012/13
Traffic injuries to children and young people
Least deprived Fourth most deprived
Third most deprived
Second most deprived
Most deprived0
10
20
30
40
50
60
70
80
90
100
Deprivation quintile
Ad
mis
sio
n r
ate
pe
r 1
00
,00
0 p
op
u-
lati
on
Source: Hospital Episode Statistics (HES). Copyright © 2014 Re‐used with the permission of The Health and Social Care Information Centre. All rights reserved
10 Traffic injuries to children and young people

Pedestrian KSI | 0-24 years | rate per 100,000 population | by IMD quintile | 2008-12
Traffic injuries to children and young people
Least deprived Fourth most deprived
Third most deprived Second most deprived
Most deprived0
2
4
6
8
10
12
14
16
18
20
Deprivation quintile
KS
I ra
te p
er
10
0,0
00
po
pu
lati
on
Source: DfT, Reported Road Casualties Great Britain (STATS19)
11 Traffic injuries to children and young people
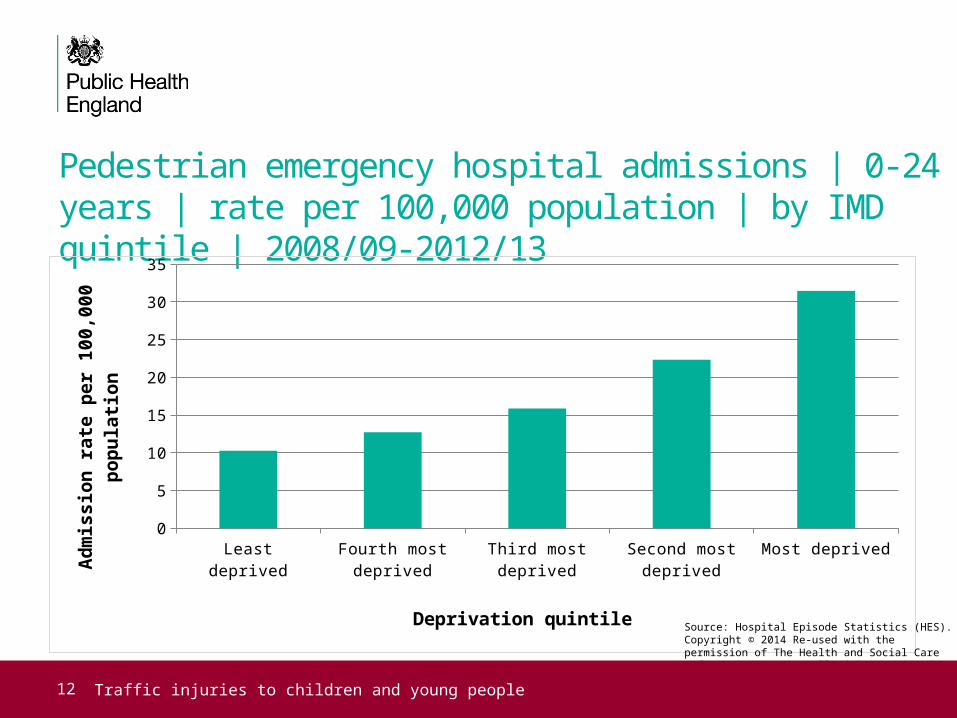
Pedestrian emergency hospital admissions | 0-24 years | rate per 100,000 population | by IMD quintile | 2008/09-2012/13
Traffic injuries to children and young people
Least deprived Fourth most deprived
Third most deprived
Second most deprived
Most deprived0
5
10
15
20
25
30
35
Deprivation quintile
Ad
mis
sio
n r
ate
pe
r 1
00
,00
0 p
op
u-
lati
on
Source: Hospital Episode Statistics (HES). Copyright © 2014 Re‐used with the permission of The Health and Social Care Information Centre. All rights reserved
12 Traffic injuries to children and young people

0-4 5-9 10-14 15-19 20-240
5
10
15
20
25
30
35
40
Least deprivedFourth most deprivedThird most deprivedSecond most deprivedMost deprived
Age band
KS
I ra
te p
er
10
0,0
00
po
pu
lati
on
Pedestrian KSI | rate per 100,000 population | by age band and IMD quintile | 2008-12
Traffic injuries to children and young people
Source: DfT, Reported Road Casualties Great Britain (STATS19)
13 Traffic injuries to children and young people
0-4 5-9 10-14 15-19 20-240
2
4
6
8
10
12
Least deprived
Fourth most deprived
Third most deprived
Second most deprived
Most deprived
Age band
KS
I ra
te p
er 1
00,0
00 p
op
ula
tio
n
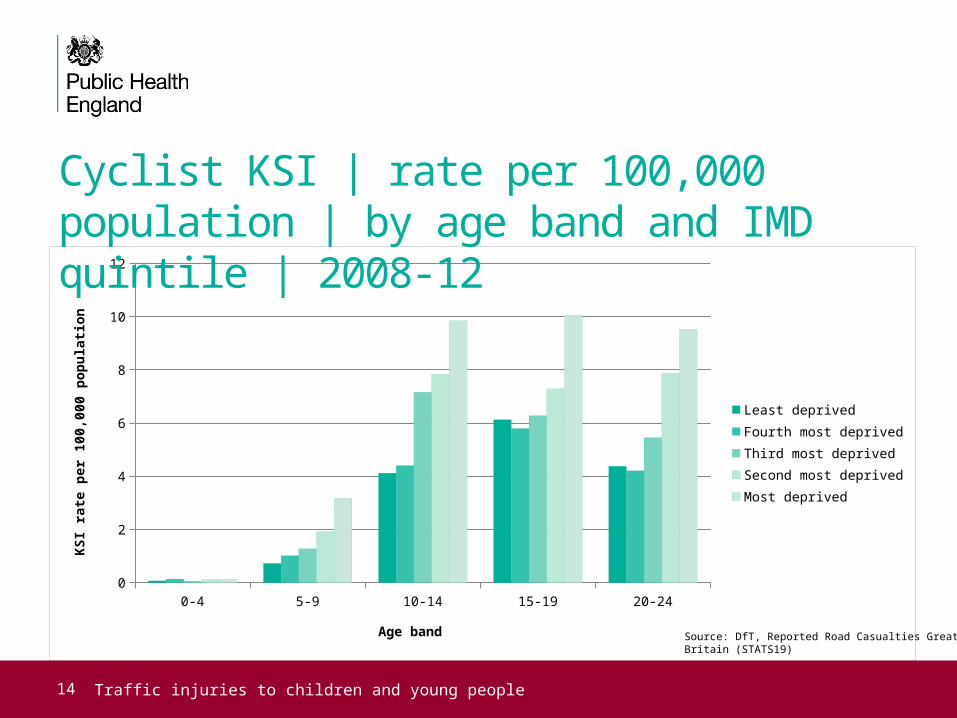
Cyclist KSI | rate per 100,000 population | by age band and IMD quintile | 2008-12
Traffic injuries to children and young people
Source: DfT, Reported Road Casualties Great Britain (STATS19)
14 Traffic injuries to children and young people

Least deprived Fourth most deprived Third most deprived Second most deprived Most deprived0
1
2
3
4
5
6
7
8
9
10
Deprivation quintile
Cas
ualty
rat
e pe
r 10
0,00
0 po
pula
tion
Motorcyclist KSI | rate per 100,000 population |0-24 years | by IMD quintile | 2008-12
Traffic injuries to children and young people
Source: DfT, Reported Road Casualties Great Britain (STATS19)
15 Traffic injuries to children and young people

Car occupant KSI | 0-24 years | rate per 100,000 population | by IMD quintile | 2008-12
Traffic injuries to children and young people
Least deprived Fourth most deprived
Third most deprived Second most deprived
Most deprived0
2
4
6
8
10
12
14
16
18
20
Deprivation quintile
KS
I ra
te p
er
10
0,0
00
po
pu
lati
on
Source: DfT, Reported Road Casualties Great Britain (STATS19)
16 Traffic injuries to children and young people

Car occupant emergency hospital admissions | 0-24 years | rate per 100,000 population | by IMD quintile | 2008-12
Traffic injuries to children and young people
Least deprived Fourth most deprived
Third most deprived
Second most deprived
Most deprived0
5
10
15
20
25
30
Deprivation quintile
Ad
mis
sio
n r
ate
pe
r 1
00
,00
0 p
op
ula
-ti
on
Source: Hospital Episode Statistics (HES). Copyright © 2014 Re‐used with the permission of The Health and Social Care Information Centre. All rights reserved
17 Traffic injuries to children and young people

Pedestrian KSI | rate per 100,000 population | by age and sex | 2008-12
Traffic injuries to children and young people
0 1 2 3 4 5 6 7 8 9 10 11 12 13 14 15 160
5
10
15
20
25
30
35
40
MaleFemale
Age
KS
I ra
te p
er
10
0,0
00
po
pu
lati
on
Source: DfT, Reported Road Casualties Great Britain (STATS19)
18 Traffic injuries to children and young people

Pedestrian KSI | 0-16 years | by hour of the day | 2008-12
Traffic injuries to children and young people
00:0
0 - 0
0:59
01:0
0 - 0
1:59
02:0
0 - 0
2:59
03:0
0 - 0
3:59
04:0
0 - 0
4:59
05:0
0 - 0
5:59
06:0
0 - 0
6:59
07:0
0 - 0
7:59
08:0
0 - 0
8:59
09:0
0 - 0
9:59
10:0
0 - 1
0:59
11:0
0 - 1
1:59
12:0
0 - 1
2:59
13:0
0 - 1
3:59
14:0
0 - 1
4:59
15:0
0 - 1
5:59
16:0
0 - 1
6:59
17:0
0 - 1
7:59
18:0
0 - 1
8:59
19:0
0 - 1
9:59
20:0
0 - 2
0:59
21:0
0 - 2
1:59
22:0
0 - 2
2:59
23:0
0 - 2
3:59
0
200
400
600
800
1000
1200
1400
1600
Hour of the day
Nu
mb
er
of
KS
I
Source: DfT, Reported Road Casualties Great Britain (STATS19)
19 Traffic injuries to children and young people

07:00 - 07:59
08:00 - 08:59
09:00 - 09:59
10:00 - 10:59
11:00 - 11:59
12:00 - 12:59
13:00 - 13:59
14:00 - 14:59
15:00 - 15:59
16:00 - 16:59
17:00 - 17:59
18:00 - 18:59
19:00 - 19:59
20:00 - 20:59
21:00 - 21:59
0
50
100
150
200
250
300
350
400
450
500
Least deprivedFourth most deprivedThird most deprivedSecond most deprivedMost deprived
Hour of the day
Num
ber o
f KSI
Pedestrian KSI | 0-16 years | by hour of the day and IMD quintile | 2008-12
Traffic injuries to children and young people
Source: DfT, Reported Road Casualties Great Britain (STATS19)
20 Traffic injuries to children and young people

14 15 16 17 18 19 20 21 220
5
10
15
20
25
30
35
40
45
Age
KS
I ra
te p
er
10
0,0
00
po
pu
lati
on
Motorcyclist KSI | rate per 100,000 population | by age | 2008-12
Traffic injuries to children and young people
Source: DfT, Reported Road Casualties Great Britain (STATS19)
21 Traffic injuries to children and young people
14 15 16 17 18 19 20 21 220
10
20
30
40
50
60
Age
Ad
mis
sio
n r
ate
pe
r 1
00
,00
0 p
op
u-
lati
on
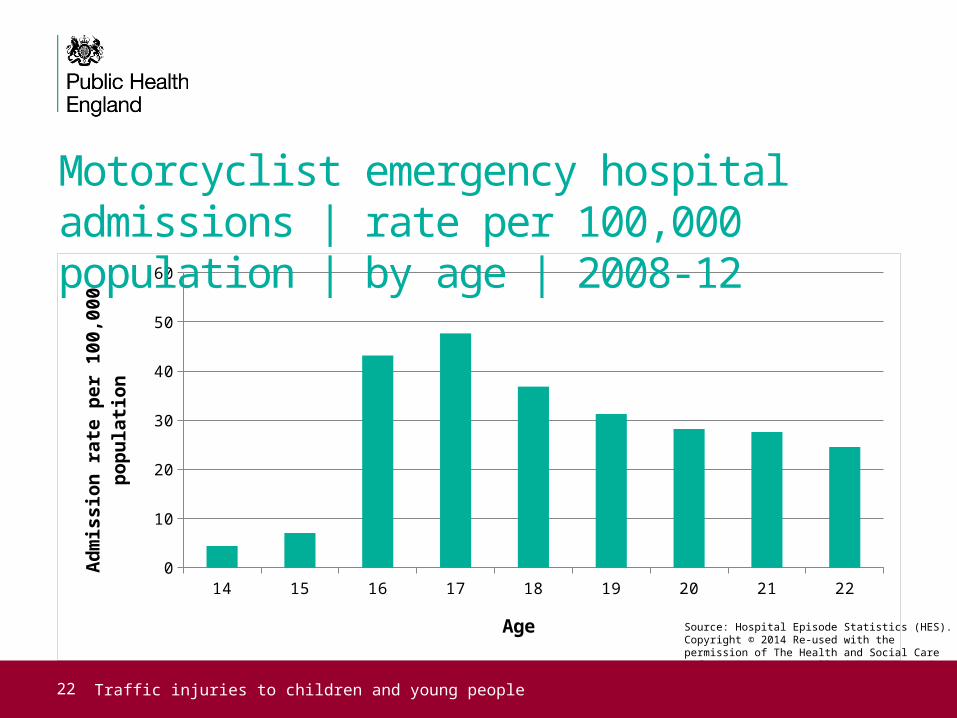
Motorcyclist emergency hospital admissions | rate per 100,000 population | by age | 2008-12
Traffic injuries to children and young people
Source: Hospital Episode Statistics (HES). Copyright © 2014 Re‐used with the permission of The Health and Social Care Information Centre. All rights reserved
22 Traffic injuries to children and young people

Car occupant KSI | rate per 100,000 population | by age and year | 2008 to 2012
Traffic injuries to children and young people
16 17 18 19 20 21 220
10
20
30
40
50
60
70
80
90
20082009201020112012
Age
KS
I ra
te p
er
10
0,0
00
po
pu
lati
on
Source: DfT, Reported Road Casualties Great Britain (STATS19)
23 Traffic injuries to children and young people

Car occupant emergency hospital admissions | rate per 100,000 population | by age and year | 2008/09 to 2012/13
Traffic injuries to children and young people
16 17 18 19 20 21 22 23 240
10
20
30
40
50
60
70
80
90
100
2008/092009/102010/112011/122012/13
Age
Ad
mis
sio
ns
pe
r 1
00
,00
0 p
op
ula
-ti
on
Source: Hospital Episode Statistics (HES). Copyright © 2014 Re‐used with the permission of The Health and Social Care Information Centre. All rights reserved
24 Traffic injuries to children and young people

20 30 40 50 60 700
2,000
4,000
6,000
8,000
10,000
12,000
Speed limit of the road
Nu
mb
er
of
KS
I
Pedestrian KSI | 0-24 years | by speed limit of the road | 2008-12
Traffic injuries to children and young people
Source: DfT, Reported Road Casualties Great Britain (STATS19)
25 Traffic injuries to children and young people

20 30 40 50 60 700
500
1,000
1,500
2,000
2,500
3,000
3,500
Speed limit of the road
Nu
mb
er
of
KS
I
Cyclist KSI | 0-24 years | by speed limit of the road | 2008-12
Traffic injuries to children and young people
Source: DfT, Reported Road Casualties Great Britain (STATS19)
26 Traffic injuries to children and young people

Motorcyclist KSI | 0-24 years | by speed limit of the road | 2008-12
Traffic injuries to children and young people
20 30 40 50 60 700
1,000
2,000
3,000
4,000
5,000
6,000
Speed limit of the road (mph)
Nu
mb
er
of
KS
I
Source: DfT, Reported Road Casualties Great Britain (STATS19)
27 Traffic injuries to children and young people

Car occupant KSI | 0-24 years | by speed limit of the road | 2008-12
Traffic injuries to children and young people
20 30 40 50 60 700
1,000
2,000
3,000
4,000
5,000
6,000
Speed limit of the road (mph)
Nu
mb
r o
f K
SI
Source: DfT, Reported Road Casualties Great Britain (STATS19)
28 Traffic injuries to children and young people

Car occupant fatalities | 0-24 years | by speed limit of the road | 2008-12
Traffic injuries to children and young people
20 30 40 50 60 700
100
200
300
400
500
600
700
Speed limit of the road (mph)
Nu
mb
er
of
fata
litie
s
Source: DfT, Reported Road Casualties Great Britain (STATS19)
29 Traffic injuries to children and young people
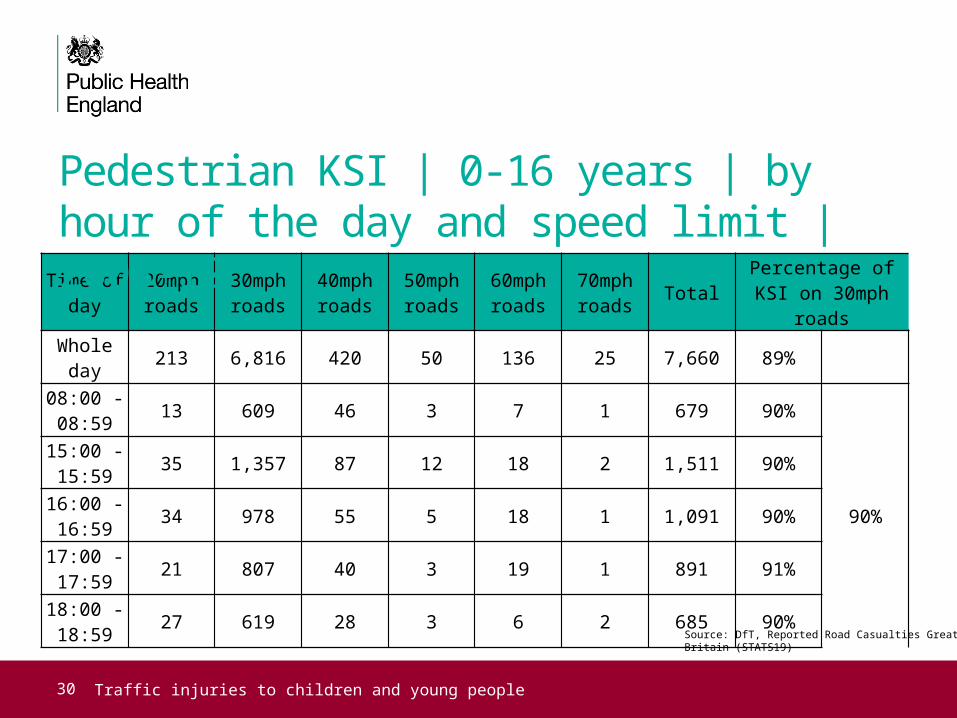
Time of day
20mph roads
30mph roads
40mph roads
50mph roads
60mph roads
70mph roads
TotalPercentage of KSI on 30mph roads
Whole day
213 6,816 420 50 136 25 7,660 89%
08:00 - 08:59
13 609 46 3 7 1 679 90%
90%
15:00 - 15:59
35 1,357 87 12 18 2 1,511 90%
16:00 - 16:59
34 978 55 5 18 1 1,091 90%
17:00 - 17:59
21 807 40 3 19 1 891 91%
18:00 - 18:59
27 619 28 3 6 2 685 90%
Pedestrian KSI | 0-16 years | by hour of the day and speed limit | 2008-12
Traffic injuries to children and young people
Source: DfT, Reported Road Casualties Great Britain (STATS19)
30 Traffic injuries to children and young people
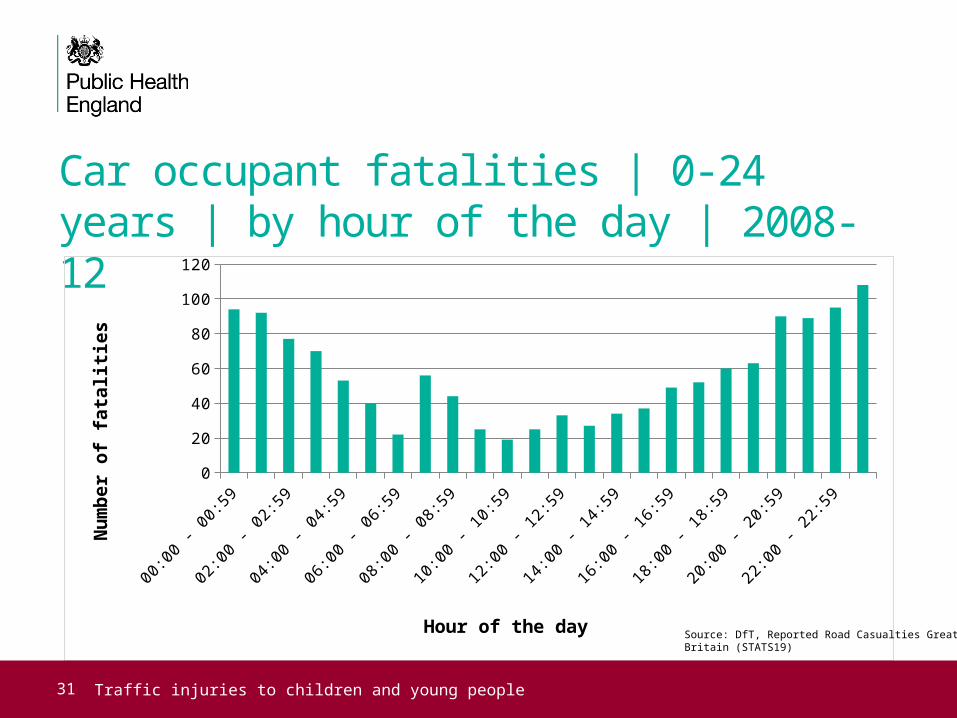
Car occupant fatalities | 0-24 years | by hour of the day | 2008-12
Traffic injuries to children and young people
00:0
0 - 0
0:59
01:0
0 - 0
1:59
02:0
0 - 0
2:59
03:0
0 - 0
3:59
04:0
0 - 0
4:59
05:0
0 - 0
5:59
06:0
0 - 0
6:59
07:0
0 - 0
7:59
08:0
0 - 0
8:59
09:0
0 - 0
9:59
10:0
0 - 1
0:59
11:0
0 - 1
1:59
12:0
0 - 1
2:59
13:0
0 - 1
3:59
14:0
0 - 1
4:59
15:0
0 - 1
5:59
16:0
0 - 1
6:59
17:0
0 - 1
7:59
18:0
0 - 1
8:59
19:0
0 - 1
9:59
20:0
0 - 2
0:59
21:0
0 - 2
1:59
22:0
0 - 2
2:59
23:0
0 - 2
3:59
0
20
40
60
80
100
120
Hour of the day
Nu
mb
er
of
fata
litie
s
Source: DfT, Reported Road Casualties Great Britain (STATS19)
31 Traffic injuries to children and young people