traffic impact study - burlington · traffic impact study july 2013 13 ... to the a&w fast-food...
TRANSCRIPT

Proposed Commercial Development at1215 Appleby Line, Burlington
OMS Management Services
Traffic Impact StudyJuly 2013
13–7956
Submitted by
Dillon ConsultingLimited

1215 Appleby LineTraffic Impact Study, July 2013
Dillon Consulting Limited Page i
TABLE OF CONTENTSPage
1.0 INTRODUCTION .................................................................................................................. 11.1 Background .................................................................................................................. 11.2 Development Land Use Type & Site Plan ................................................................. 21.3 Scope ............................................................................................................................ 21.4 Analysis Periods .......................................................................................................... 2
2.0 EXISTING CONDITIONS ................................................................................................... 42.1 Study Area Roadway Network ................................................................................... 42.2 Existing Pedestrian and Cycling Facilities ................................................................. 52.3 Existing Transit Service .............................................................................................. 52.4 Existing Traffic Counts ............................................................................................... 62.5 Existing Traffic Signal Timings ................................................................................. 62.6 Existing Intersection Operations ................................................................................. 6
3.0 FUTURE BACKGROUND CONDITIONS ...................................................................... 93.1 Traffic Growth ............................................................................................................. 93.2 Future Background Intersection Operations ............................................................ 11
4.0 SITE TRAFFIC .................................................................................................................... 134.1 Trip Generation .......................................................................................................... 134.2 Hotel Trip Generation................................................................................................ 134.3 Retail Trip Generation ............................................................................................... 134.4 Tim Horton’s Trip Generation .................................................................................. 134.5 Moxie’s Trip Generation ........................................................................................... 144.6 Internal Trip Capture ................................................................................................. 144.7 Pass-By Trips ............................................................................................................. 154.8 Trip Distribution and Assignment ............................................................................ 164.9 Total Future Site Traffic ............................................................................................ 17
5.0 TOTAL FUTURE TRAFFIC OPERATIONS ................................................................ 185.1 Total Future Conditions............................................................................................. 185.2 Diversion of Westbound Left Traffic to Appleby Ice Centre Intersection ............ 19
6.0 PARKING ANALYSIS ....................................................................................................... 216.1 Parking Supply ........................................................................................................... 216.2 Parking Requirements ............................................................................................... 216.3 Shared Parking Reduction ......................................................................................... 21
7.0 CONCLUSIONS .................................................................................................................. 24

1215 Appleby LineTraffic Impact Study, July 2013
Page ii Dillon Consulting Limited
LIST OF TABLES
Table 1 — Data Collection Dates and Sources ................................................................................... 6Table 2 — Existing Signalized Intersection Operations .................................................................... 7Table 3 — Existing Unsignalized Intersection Operations ................................................................ 8Table 4 — Other Area Developments ................................................................................................. 9Table 5 — Traffic Generated by Other Area Developments ........................................................... 10Table 6 — Future Background Signalized Intersection Operations ................................................ 11Table 7 — Future Background Unsignalized Intersection Operations ........................................... 12Table 8 — Internal Trip Capture Rates ............................................................................................. 14Table 9 — Weekday PM Trip Generation ........................................................................................ 16Table 10 — Saturday Mid-Day Trip Generation .............................................................................. 16Table 11 — Weekday PM Trips Directional Breakdown ................................................................ 17Table 12 — Saturday Mid-Day Trips Directional Breakdown ........................................................ 17Table 13 — Future Signalized Intersection Operations ................................................................... 18Table 14 — Future Unsignalized Intersection Operations ............................................................... 19Table 15 — Future Unsignalized Intersection Operations with Diversion ..................................... 19Table 16 — Future Signalized Intersection Operations with Diversion ......................................... 20Table 17 — Parking Requirements ................................................................................................... 21Table 18 — Weekday Parking Demand Fluctuation by Hour ......................................................... 22Table 19 — Weekend Parking Demand Fluctuation by Hour ......................................................... 22
LIST OF FIGURES
Figure 1 — Site Location ..................................................................................................................... 1Figure 2 — Appleby Line, approximately 200 m south of Mainway ............................................... 4Figure 3 — Weekend Parking Demand ............................................................................................ 23Figure 4 — Weekend Parking Demand ............................................................................................ 23
LIST OF APPENDICES
Appendix A — Development Concept Site PlanAppendix B — Traffic Count DataAppendix C — Traffic Signal Timing PlansAppendix D — Level of Service De nitionsAppendix E — Traffic FiguresAppendix F — Synchro Analysis Worksheets

1215 Appleby LineTraffic Impact Study, July 2013
Dillon Consulting Limited Page 1
1.0 Introduction
1.1 Background
Dillon Consulting has been retained by OMS Management Services Inc. to conduct atransportation impact study (TIS) and parking study for the proposed development of acommercial retail site at 1215 Appleby Line, in Burlington, Ontario. The objective of the TIS isto assess the general impact of the proposed development on the existing road network. Theparking study will outline the required number of spaces required to service the development,and verify that the proposed supply is adequate.
The site location is shown in Figure 1.
Figure 1 — Site Location
Site Location

1215 Appleby LineTraffic Impact Study, July 2013
Page 2 Dillon Consulting Limited
1.2 Development Land Use Type & Site Plan
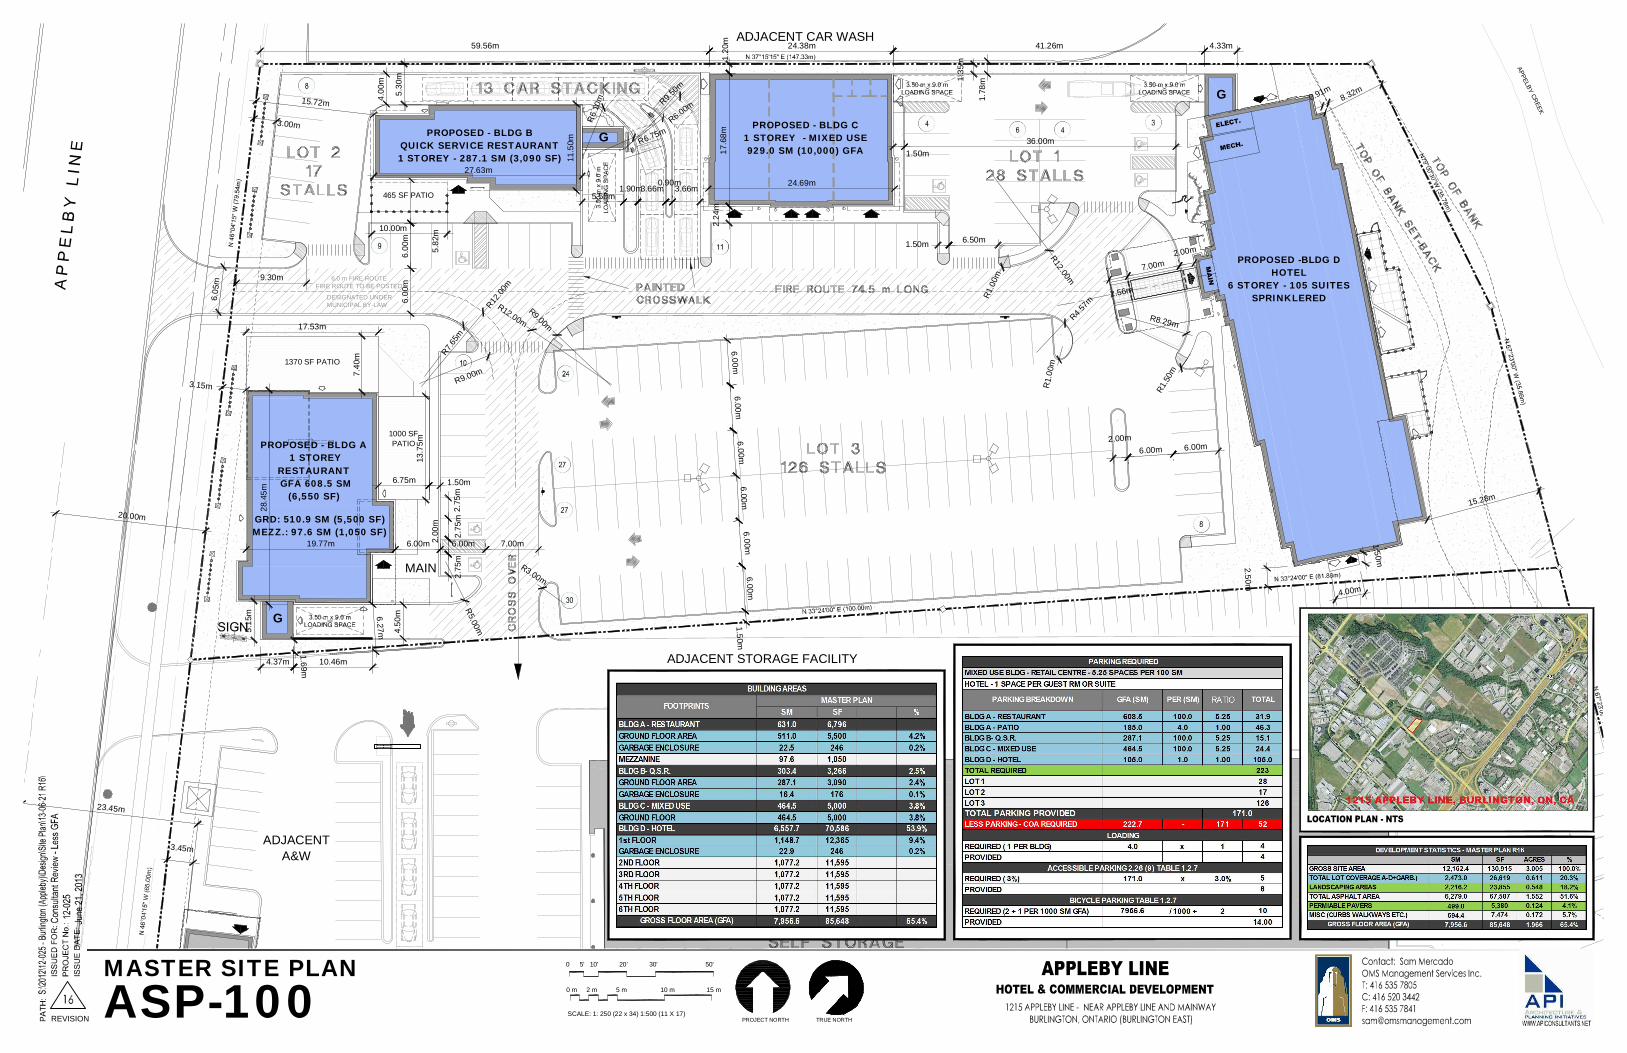
OMS Management Services Inc. is proposing to develop a currently vacant plot of land andconstruct a commercial retail plaza at 1215 Appleby Line in Burlington. The development willinclude a six-storey hotel (containing 105 guest rooms), 465 m2 of mixed-use retail, a 608 m2
Moxie’s restaurant, and a 287 m2 Tim Horton’s restaurant. Access to the site is to be providedby a new driveway to Appleby Line, approximately 55 m north of the existing driveway accessto the A&W fast-food restaurant and Storage Spot self-storage facility. This driveway willpermit access from north and southbound Appleby Line, but vehicles will only be permitted toexit to the north via a right turn (i.e., left and right turns in, and right out only).
Vehicles on the proposed site would have access to the adjacent existing site via an internalconnection near the west end of both properties, near the existing driveway. As a result,secondary access to the site is achievable through this interconnection.
The preliminary development concept site plan is provided in Appendix A.
1.3 Scope
The study focused on the following intersections:
Appleby Line and the proposed development’s driveway;Appleby Line and the A&W/Storage Spot driveway;Appleby Line and the Appleby Ice Centre access road; andAppleby Line and Mainway.
1.4 Analysis Periods
The nature of the proposed development uses results in expected usage peaks during theevenings and weekends. The hotel and restaurant components, in particular, are expected to beat their busiest during the aforementioned periods. As a result, the time periods analyzed in thistransportation impact study are the weekday PM peak period and Saturday midday period.
The PM peak analysis period is taken as being 4:00 - 6:00 p.m., when the traffic generation ofthe multiple site uses overlap. During this period, the hotel begins receiving guests who arechecking-in and the restaurant begins servicing patrons for dinner. The retail uses and the TimHorton’s are not expected to experience any particularly noticeable spikes in traffic generation.

1215 Appleby LineTraffic Impact Study, July 2013
Dillon Consulting Limited Page 3
The Saturday mid-day analysis period is taken as being 11:00 a.m. – 2:00 p.m. During thisperiod, the hotel experiences a significant increase in traffic as guests are both checking-out andchecking-in. The retail portion of the site is expected to be at its busiest during this time period.In addition, the restaurant begins servicing patrons for lunch, while Tim Horton’s traffic isrelatively stable.
The horizon year considered in the study is 2019, five years after the development’s projectedbuild-out.

1215 Appleby LineTraffic Impact Study, July 2013
Page 4 Dillon Consulting Limited
2.0 Existing Conditions
2.1 Study Area Roadway Network
The main roadway running adjacent to the proposed development site is Appleby Line. It isnorth-south arterial roadway with a posted speed limit of 60 km/h. Appleby Line currently has afive-lane cross section in the vicinity of the site, with two lanes used for each principle directionof travel, along with a two-way left-turn lane in the middle of the roadway. Figure 2 shows asection of Appleby Line, looking northbound, immediately adjacent to the proposeddevelopment site.
Figure 2 — Appleby Line, approximately 200 m south of Mainway
Appleby Line runs through the eastern end of Burlington, connecting several neighbourhoodswith differing land use:
primarily older established residential areas south of Fairview Street;primarily light industrial areas between Fairview Street and Upper Middle Road; andprimarily newly-developed residential areas north of Upper Middle Road.
In addition, Appleby Line links several important regional transportation facilities:
Appleby GO Station, which sees frequent train service and heavy commuter flows alongthe Lakeshore West GO Transit line;

1215 Appleby LineTraffic Impact Study, July 2013
Dillon Consulting Limited Page 5
the Queen Elizabeth Way (QEW)/Highway 403, providing access to Hamilton, Oakville,Mississauga, and Toronto; andthe 407 Express Toll Route, a northern bypass route of Burlington and Oakville.
Within the immediate study area, Mainway is the only municipal road other than Appleby Line.The two streets meet at a signalized intersection, located approximately 200 metres north of theproposed development. Mainway is a four-lane road, running primarily in an east-west direction.It provides access to light industrial and warehousing areas and some residential areas to thenorth. The posted speed limit along Mainway is 60 km/h.
The second signalized intersection within the study area is found at the intersection of ApplebyLine and the Appleby Ice Centre driveway. To the east, the driveway provides access to theAppleby Ice Centre and the Storage Spot/A&W site, while providing exiting vehicles with twolanes. The west leg of the intersection provides access to Samuel Metal Processing’s BurlingtonProcessing Centre.
2.2 Existing Pedestrian and Cycling Facilities
Sidewalks are currently located along both sides of Appleby Line within the study area.Mainway has sidewalks on either side of the street to the east of Appleby Line, but only on thenorth side west of Appleby Line. In addition, a sidewalk lines the south side of Appleby IceCentre driveway.
Marked pedestrian crossings exist at both signalized intersections within the study area. Thereare no mid-block pedestrian crossings along Appleby Line.
Bicycle lanes are present in the shoulders of Appleby Line, north of Mainway. No other cyclingfacilities currently exist on any of the streets within the study area.
2.3 Existing Transit Service
Appleby Line is served by Burlington Transit (BT) Route 11. This bus connects The Orchardneighbourhood with Appleby GO Transit Station, by way of Appleby Line. Service is providedevery 30 minutes during AM and PM peak periods, and hourly on evenings and weekends. Anorthbound bus stop (signpost only, no shelter) is located just south of the A&W/Storage Spotdriveway, while the closest southbound stop to the proposed development is located at Mainway.
Bus service is also provided along Mainway by BT Route 81. Service hours are limited to AMand PM peak periods, with a frequency of 30 minutes.
1215 Appleby LineTraffic Impact Study, July 2013
Page 6 Dillon Consulting Limited
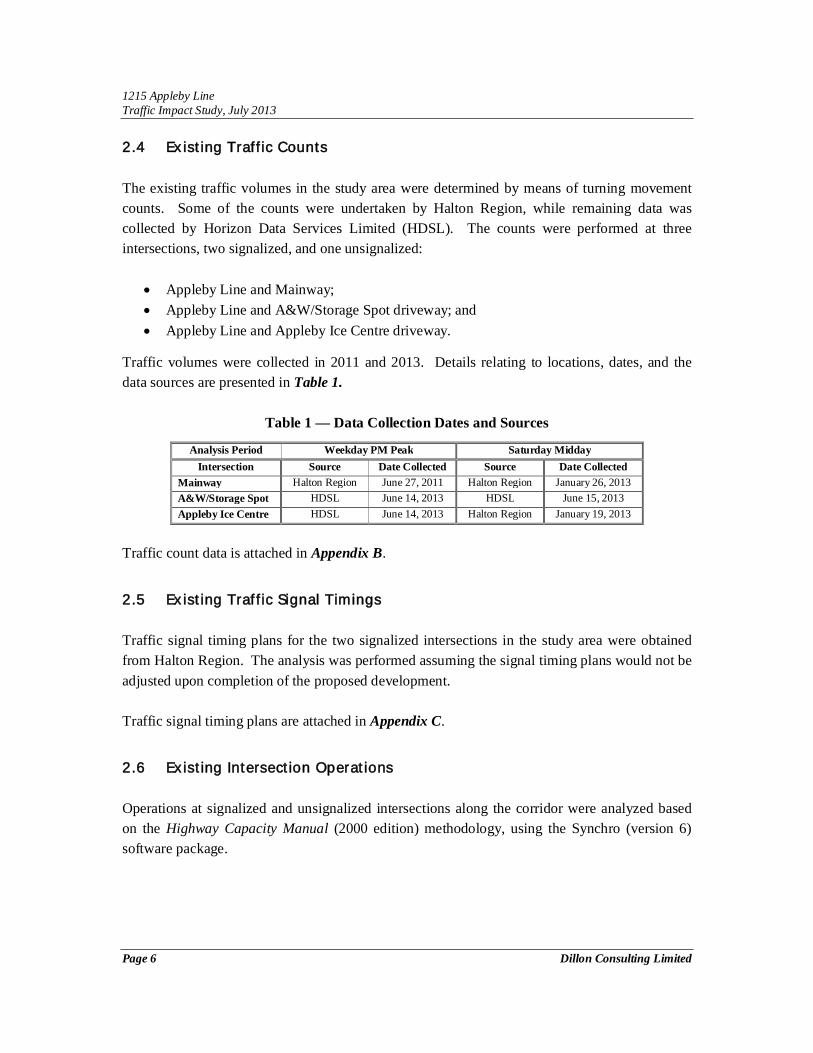
2.4 Existing Traffic Counts
The existing traffic volumes in the study area were determined by means of turning movementcounts. Some of the counts were undertaken by Halton Region, while remaining data wascollected by Horizon Data Services Limited (HDSL). The counts were performed at threeintersections, two signalized, and one unsignalized:
Appleby Line and Mainway;Appleby Line and A&W/Storage Spot driveway; andAppleby Line and Appleby Ice Centre driveway.
Traffic volumes were collected in 2011 and 2013. Details relating to locations, dates, and thedata sources are presented in Table 1.
Table 1 — Data Collection Dates and Sources
Analysis Period Weekday PM Peak Saturday MiddayIntersection Source Date Collected Source Date Collected
Mainway Halton Region June 27, 2011 Halton Region January 26, 2013A&W/Storage Spot HDSL June 14, 2013 HDSL June 15, 2013Appleby Ice Centre HDSL June 14, 2013 Halton Region January 19, 2013
Traffic count data is attached in Appendix B.
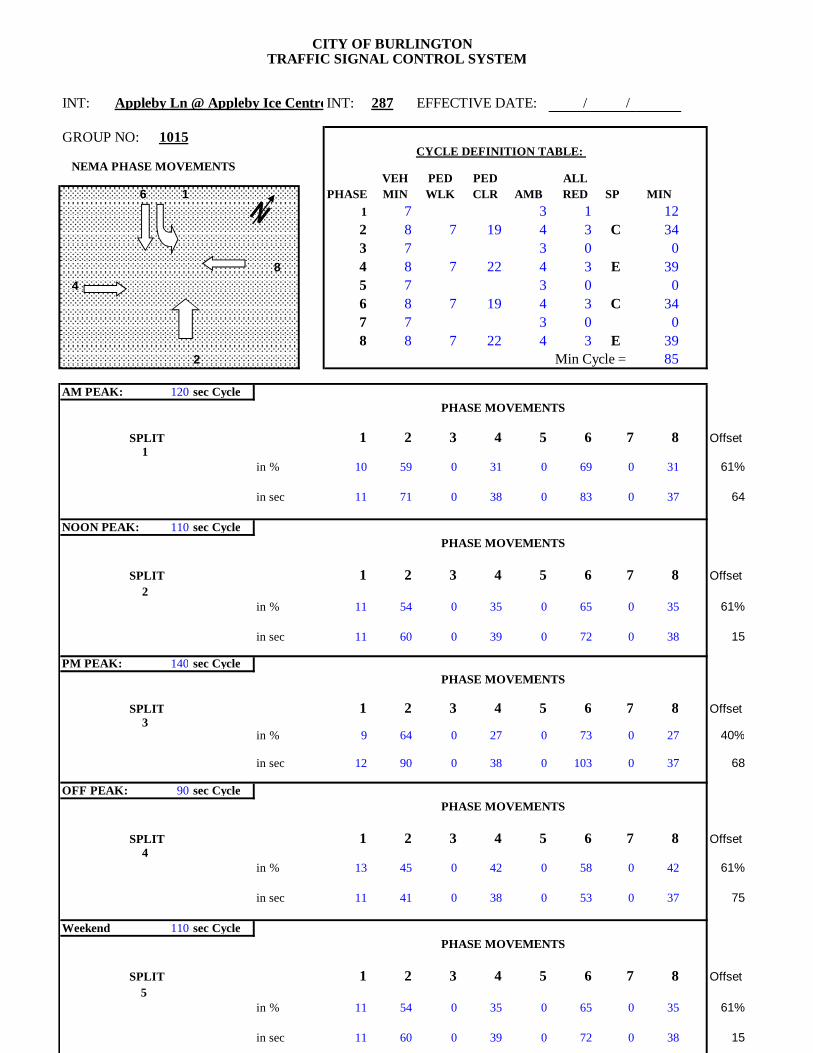
2.5 Existing Traffic Signal Timings
Traffic signal timing plans for the two signalized intersections in the study area were obtainedfrom Halton Region. The analysis was performed assuming the signal timing plans would not beadjusted upon completion of the proposed development.
Traffic signal timing plans are attached in Appendix C.
2.6 Existing Intersection Operations
Operations at signalized and unsignalized intersections along the corridor were analyzed basedon the Highway Capacity Manual (2000 edition) methodology, using the Synchro (version 6)software package.

1215 Appleby LineTraffic Impact Study, July 2013
Dillon Consulting Limited Page 7
For signalized intersections, the overall intersection as well as the individual movements’ levelof service (LOS1), average vehicle delay, volume-to-capacity ratio (v/c), and 95th percentilequeues were noted in Table 2.
For the unsignalized intersections, the LOS, delay, v/c, and 95 th percentile queues were noted forthe driveway exits as well as the southbound left turns.
Critical movements, defined as those having a v/c ratio above 1.0 for turning movements, 0.85for through or shared movements, or a LOS F have been identified in red.
Table 2 — Existing Signalized Intersection Operations
Intersectionwith Appleby Line
AnalysisPeriod
Overall Intersection Individual Movements
LOSDelay(s/veh)
v/c Movement LOSDelay(s/veh)
v/c Queue
Mainway
PM E 72.5 1.24
EBLEBTRWBL
WBTRNBL
NBTRSBL
SBTR
FBDFFDDE
15118.841.989.818135.237.774.9
1.140.330.621.051.290.910.551.03
82.626.563.4194.4204.4253.620.6234.2
Saturday B 15.7 0.64
EBLEBTRWBL
WBTRNBL
NBTRSBL
SBTR
DBDCBBAB
46.814.136.720.817.212.97.214.9
0.530.390.180.280.530.560.210.65
39.815.114.911.818.7105.26.2
125.1
Appleby Ice Centre
PM A 7.0 0.64
EBLTRWBLTR
NBLNBTRSBL
SBTR
CDAAAA
28.040.33.86.44.76.6
0.210.220.020.640.160.43
11.314.61.3
148.82.1
121.3
Saturday B 10.4 0.58
EBLTRWBLTR
NBLNBTRSBL
SBTR
CDABAA
27.043.69.411.07.46.4
0.040.610.050.570.300.54
5.443.42.1
116.37.391.0
1 Level of Service (LOS), applied to an intersection, is a measure qualifying the amount of delay experienced bymotorists, expressed either for speci c turning movements or for the intersection as a whole. A more detailedexplanation of LOS is provided in Appendix D.
1215 Appleby LineTraffic Impact Study, July 2013
Page 8 Dillon Consulting Limited
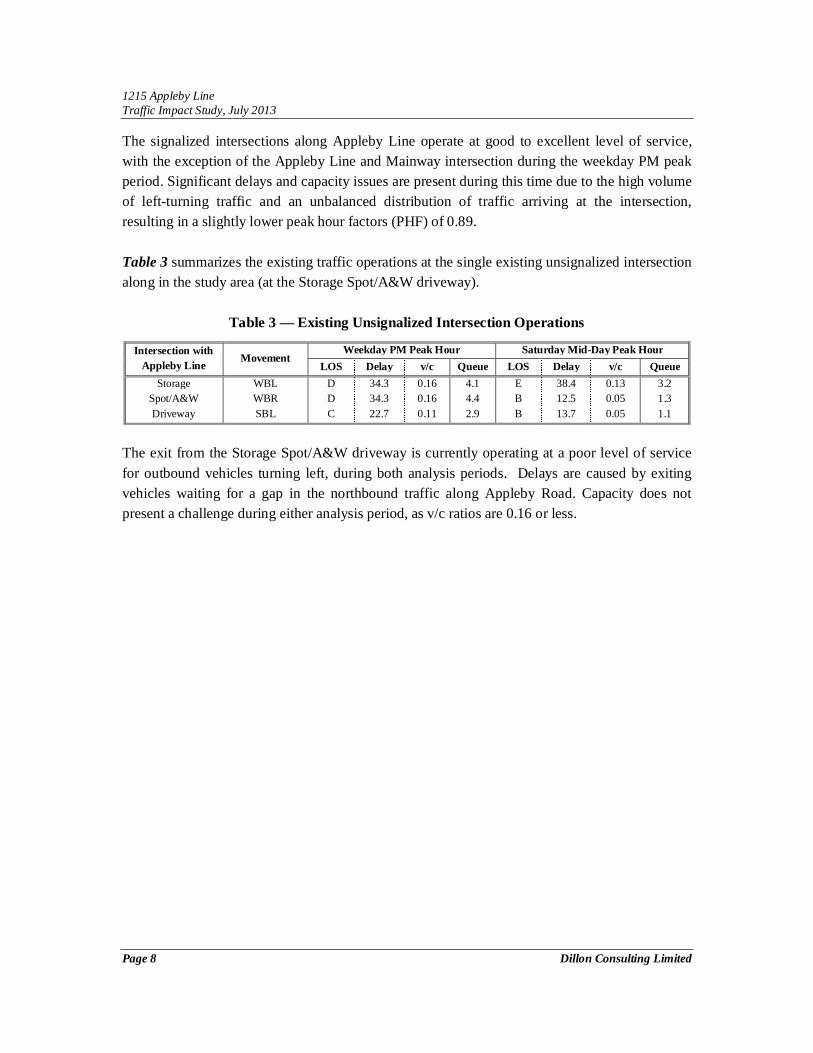
The signalized intersections along Appleby Line operate at good to excellent level of service,with the exception of the Appleby Line and Mainway intersection during the weekday PM peakperiod. Significant delays and capacity issues are present during this time due to the high volumeof left-turning traffic and an unbalanced distribution of traffic arriving at the intersection,resulting in a slightly lower peak hour factors (PHF) of 0.89.
Table 3 summarizes the existing traffic operations at the single existing unsignalized intersectionalong in the study area (at the Storage Spot/A&W driveway).
Table 3 — Existing Unsignalized Intersection Operations
Intersection withAppleby Line
MovementWeekday PM Peak Hour Saturday Mid-Day Peak Hour
LOS Delay v/c Queue LOS Delay v/c QueueStorage
Spot/A&WDriveway
WBLWBRSBL
DDC
34.334.322.7
0.160.160.11
4.14.42.9
EBB
38.412.513.7
0.130.050.05
3.21.31.1
The exit from the Storage Spot/A&W driveway is currently operating at a poor level of servicefor outbound vehicles turning left, during both analysis periods. Delays are caused by exitingvehicles waiting for a gap in the northbound traffic along Appleby Road. Capacity does notpresent a challenge during either analysis period, as v/c ratios are 0.16 or less.
1215 Appleby LineTraffic Impact Study, July 2013
Dillon Consulting Limited Page 9
3.0 Future Background Conditions
3.1 Traffic Growth
Future background traffic volumes are generated as a result of two components: speci c turningmovement increases related to other developments in the immediate area, and a generalbackground growth rate applied to account for development further outside the study area.
1. Other Area Developments
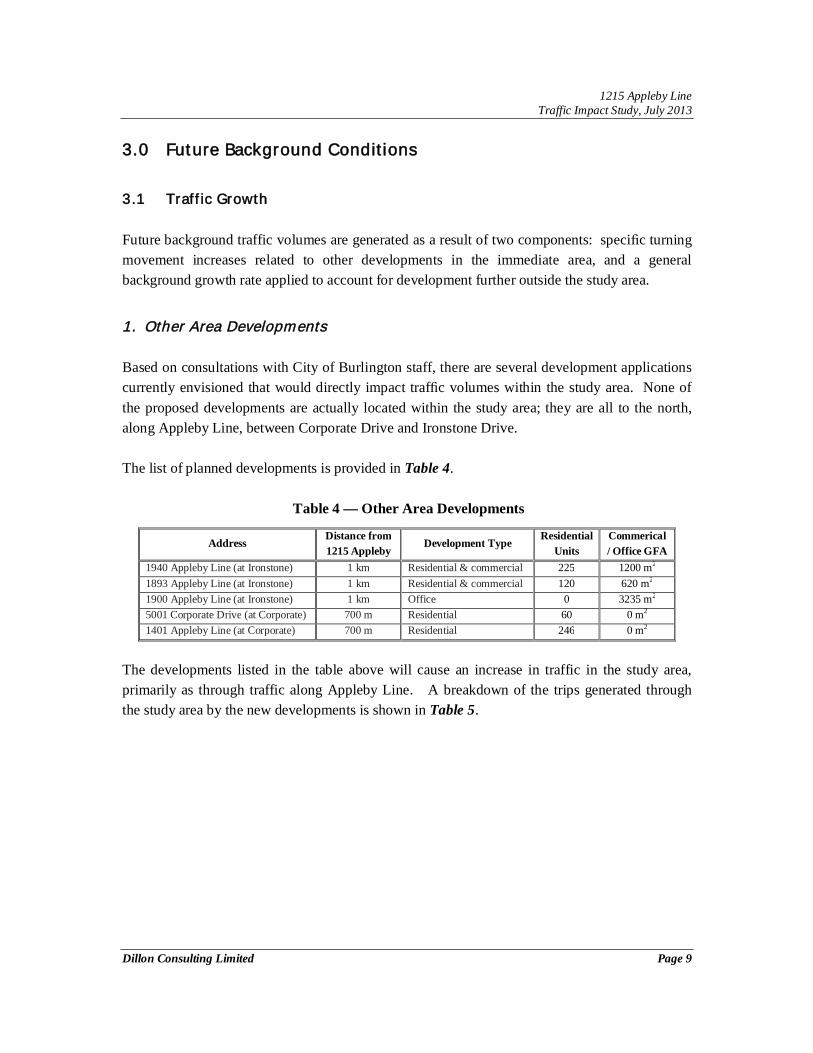
Based on consultations with City of Burlington staff, there are several development applicationscurrently envisioned that would directly impact traf c volumes within the study area. None ofthe proposed developments are actually located within the study area; they are all to the north,along Appleby Line, between Corporate Drive and Ironstone Drive.
The list of planned developments is provided in Table 4.
Table 4 — Other Area Developments
AddressDistance from1215 Appleby
Development TypeResidential
UnitsCommerical/ Office GFA
1940 Appleby Line (at Ironstone) 1 km Residential & commercial 225 1200 m2
1893 Appleby Line (at Ironstone) 1 km Residential & commercial 120 620 m2
1900 Appleby Line (at Ironstone) 1 km Office 0 3235 m2
5001 Corporate Drive (at Corporate) 700 m Residential 60 0 m2
1401 Appleby Line (at Corporate) 700 m Residential 246 0 m2
The developments listed in the table above will cause an increase in traffic in the study area,primarily as through traffic along Appleby Line. A breakdown of the trips generated throughthe study area by the new developments is shown in Table 5.

1215 Appleby LineTraffic Impact Study, July 2013
Page 10 Dillon Consulting Limited
Table 5 — Traffic Generated by Other Area Developments
Development Type AddressTotal Trips Generated Inbound Trips Outbound Trips
PM Saturday PM Saturday PM Saturday
Residential
1940 Appleby Line 79 90 48 51 31 391893 Appleby Line 35 47 17 25 18 22
5001 Corporate Drive 24 24 14 14 10 101401 Appleby Line 87 98 53 56 34 42
Residential Total 131 146 92 11340 % traffic to/from south on Appleby Line 52 59 37 45
Retail/Office
1940 Appleby Line 49 63 24 33 25 301893 Appleby Line 25 33 12 17 13 16Pass-by reduction: -34% PM, -26% Saturday* -12 -13 -13 -121900 Appleby Line 51 15 9 8 43 7
Retail/Office Total 32 45 68 4130 % traffic to/from south on Appleby Line 10 13 20 12
Total 62 72 57 57*See Section 4.7 for an explanation of pass-by trip reduction.
Within the context of the study area, inbound trips related to developments farther north arerecorded as northbound through traffic along Appleby Line, while outbound trips aresouthbound. Mainway and the Appleby Ice Centre driveway are not expected to be see increasedvolumes.
2. Background Traffic Growth
In addition to the traffic related to the new developments to the north of 1215 Appleby Line,changes to traf c volumes in the study area will also occur as a result of general backgroundgrowth. Halton Region staff has indicated that an annual background traffic growth rate of 2% isto be used.

1215 Appleby LineTraffic Impact Study, July 2013
Dillon Consulting Limited Page 11
3.2 Future Background Intersection Operations
Intersection operations were analysed using the revised future background traffic volumes. Theresults are presented in Table 6 and Table 7.
Table 6 — Future Background Signalized Intersection Operations
Intersectionwith Appleby Line
AnalysisPeriod
Overall Intersection Individual Movements
LOSDelay(s/veh)
v/c Movement LOSDelay(s/veh)
v/c Queue
Mainway
PM F 111.9 1.37
EBLEBTRWBL
WBTRNBL
NBTRSBL
SBTR
FBDFFEDF
19219.147.9127
>20073.943.4129
1.260.360.721.161.431.080.611.18
94.828.870.3226.3234.5321.826.8293.4
Saturday B 18.5 0.74
EBLEBTRWBL
WBTRNBL
NBTRSBL
SBTR
DBDCCBAB
46.013.436.520.521.115.77.819.0
0.530.370.180.300.590.680.250.77
43.215.815.912.622.4136.26.9
161.1
Appleby Ice Centre
PM A 8.8 0.73
EBLTRWBLTR
NBLNBTRSBL
SBTR
CDAAAA
27.840.44.58.54.48.2
0.230.250.040.730.180.49
12.415.71.5
212.12.2
128.3
Saturday B 12.3 0.67
EBLTRWBLTR
NBLNBTRSBL
SBTR
CDBBAA
25.544.513.313.58.68.0
0.040.640.100.670.330.63
6.047.22.9
155.88.6
123.1
The intersection of Appleby Line and Mainway will operate at LOS F during the weekday PMpeak period under future background conditions. The future growth in traffic, especially alongAppleby Line, pushes the intersection over its capacity. As a result, significant delays arepresent for almost all movements at the intersection. During the Saturday mid-day peak hour,the intersection continues operating at a very good level of service. The Appleby Line andAppleby Ice Centre intersection will continue to operate at excellent overall levels of service atall times under future background conditions.
1215 Appleby LineTraffic Impact Study, July 2013
Page 12 Dillon Consulting Limited
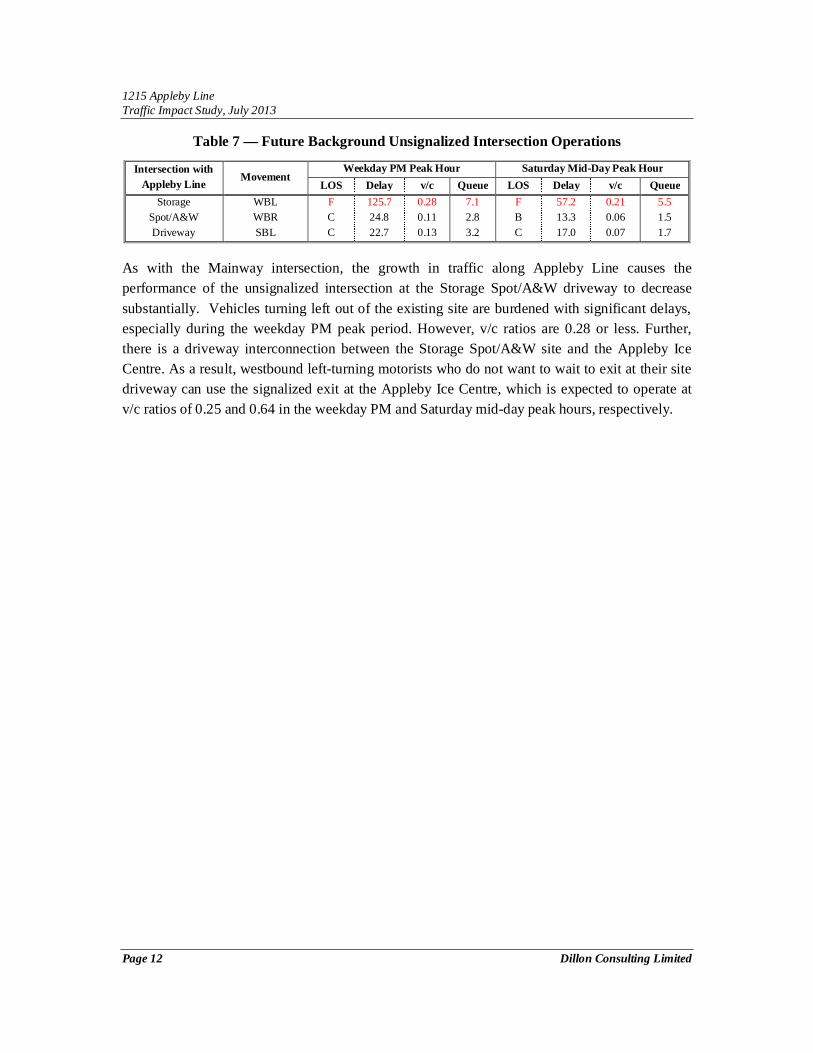
Table 7 — Future Background Unsignalized Intersection Operations
Intersection withAppleby Line
MovementWeekday PM Peak Hour Saturday Mid-Day Peak Hour
LOS Delay v/c Queue LOS Delay v/c QueueStorage
Spot/A&WDriveway
WBLWBRSBL
FCC
125.724.822.7
0.280.110.13
7.12.83.2
FBC
57.213.317.0
0.210.060.07
5.51.51.7
As with the Mainway intersection, the growth in traffic along Appleby Line causes theperformance of the unsignalized intersection at the Storage Spot/A&W driveway to decreasesubstantially. Vehicles turning left out of the existing site are burdened with significant delays,especially during the weekday PM peak period. However, v/c ratios are 0.28 or less. Further,there is a driveway interconnection between the Storage Spot/A&W site and the Appleby IceCentre. As a result, westbound left-turning motorists who do not want to wait to exit at their sitedriveway can use the signalized exit at the Appleby Ice Centre, which is expected to operate atv/c ratios of 0.25 and 0.64 in the weekday PM and Saturday mid-day peak hours, respectively.

1215 Appleby LineTraffic Impact Study, July 2013
Dillon Consulting Limited Page 13
4.0 Site Traffic
4.1 Trip Generation
Trips for the subject development were estimated based on trip rates contained within theInstitute of Transportation Engineers’ Trip Generation Manual, 8th Edition. Since thedevelopment has a mixture of uses (hotel, retail, coffee shop, full-service restaurant), tripgeneration was broken down by category, and is presented in the sections below.
4.2 Hotel Trip Generation
The hotel is expected to generate 0.61 total vehicle trips per room in the weekday PM peak hour.Of those, 58% are trips entering the site while the remaining 42% are exiting. During the mid-day on Saturday, the rate is expected to increase due to the overlap of guests both checking-outand checking-in. In the peak hour, the trip generation rate is expected to be 0.72 vehicle trips perroom, with a breakdown of 56% entering and 44% exiting.
4.3 Retail Trip Generation
The mixed-use retail is expected to generate 3.73 total vehicle trips per 1,000 ft2 in the weekdayPM peak hour. Of those, 49% are trips entering the site while the remaining 51% are exiting.Saturday mid-day peak hour usage is expected to be slightly higher, with 4.89 trips per 1,000 ft2
generated, and an even enter/exit breakdown. Due to the nature of retail uses, a pass-by tripadjustment is made and explained in Section 4.7.
4.4 Tim Horton’s Trip Generation
The Tim Horton’s coffee shop is expected to generate 42.93 total vehicle trips per 1,000 ft2 in theweekday PM peak hour. Saturday mid-day peak usage is expected to be even higher, with 84.52trips per 1,000 ft2 generated. The trips in both analysis periods are evenly distributed, with halfentering the site while the remaining half is exiting. As with the retail use, a significantproportion of the trips attracted by the site are very short in duration and are not necessarilycompletely new trips generated; instead, they are simply pass-by trips diverted from ApplebyLine.

1215 Appleby LineTraffic Impact Study, July 2013
Page 14 Dillon Consulting Limited
4.5 Moxie’s Trip Generation
The Moxie’s restaurant is expected to generate 7.49 trips per 100 m2 in the weekday PM peakhour. As the analysis period of 4:00 – 6:00 p.m. is relatively early for dinner, the majority (67%)of the trips generated by this use is inbound to the site. During the Saturday mid-day peakperiod, the restaurant is expected to generate 10.82 trips per 100 m2, with a breakdown of 59%entering and 41% exiting. Pass-by trips relating to this use were not considered in the analysis,which is a conservative assumption.
4.6 Internal Trip Capture
Multi-use sites, like the proposed development, experience a certain degree of internal tripcapture. This phenomenon occurs when some of the trips generated by a given land use have adestination within the development. These trips reduce the overall number of vehicles utilizingthe external road network to access the site, as both the trip origin and destination would beinternal to the site. In the case of the proposed development at 1215 Appleby Line, a majorsource of internal trip capture will be the synergy between the hotel and Tim Horton’s andMoxie’s restaurant uses. As could be expected, a certain proportion of trips generated by thehotel will be destined to the restaurants, and a certain proportion of the trips attracted by therestaurants will have their origin at the hotel. These trips must be accounted for, as they will notadd any additional strain to the external road network.
Internal trip capture rates are given both as a percentage of trips from the origin and as apercentage of trips to the destination. The lower of the two calculated internal capture trips arethen removed from both uses. The internal capture rates provided in the ITE Trip GenerationHandbook do not include specific data on either restaurants or hotels, both of which are proposedat 1215 Appleby Line. Instead, internal capture rates (see Table 8) taken from a report publishedin 2010 by the Texas Transportation Institute at The Texas A&M University were used.
Table 8 — Internal Trip Capture Rates
From To From Origin To DestinationHotel Restaurant 33% 10%
Restaurant Hotel 3% 5%
The total reduction in trips due to internal capture between the hotel and the Moxie’s restaurantis 6 in the weekday PM peak hour, and 10 during the Saturday mid-day peak hour. The totalreduction in trips due to internal capture between the hotel and the Tim Horton’s is 18 in theweekday PM peak hour, and 26 during the Saturday mid-day peak hour.

1215 Appleby LineTraffic Impact Study, July 2013
Dillon Consulting Limited Page 15
4.7 Pass-By Trips
Pass-by trips occur when vehicles already travelling along a given stretch of road make a detourinto an adjacent site. These are not considered as “new” trips, since these vehicles would beusing the local street network regardless of the existence of the site. Pass-by trips are notdistributed throughout the street network, as only the site entrance/exit intersection itself isaffected. The through movement sees a decrease in traffic, while the turning movements intoand out of the site see a corresponding increase.
In this case, specifically, this would translate into vehicles already utilizing Appleby Linemaking a stop at the proposed commercial development. Two of the four proposed uses arecandidates for a significant amount of pass-by trips: the Tim Horton’s and the retail component.Moxie’s restaurant also has the potential for pass-by trips, but the proportion of these trips isrelatively small and consequently, they were not considered in the analysis.
Pass-by trips, as a proportion of total trips generated by a site, were determined by means of ITEguidelines, in addition to first principles. There are no specific ITE guidelines for pass-by ratesfor a coffee shop, so the most similar site use detailed - land use code 834: “Fast food restaurantwith drive-through window” – was used instead. According to the ITE Trip GenerationHandbook, 50% of trips generated by this land use in the weekday PM peak period are pass-bytrips. It is possible that in the case of a coffee shop, the percentage may be even higher, but the50% figure will be used in order to preserve conservative assumptions. No guidelines currentlyexist for weekend periods. As a result, it is assumed that only 20% of trips generated by the TimHorton’s during the Saturday peak hour will be pass-by trips, also a conservative assumption.
For the retail component of the site, land use code 820 “Shopping Centre” was used. Accordingto the ITE Trip Generation Handbook, 34% of trips generated by this land use in the weekdayPM peak period are pass-by trips. Unlike the Tim Horton’s, estimates for code 820 also includeSaturday statistics for pass-by trip percentage: 26%. Table 9 and Table 10 show the site tripgeneration for the weekday PM peak and Saturday mid-day peak periods, respectively.

1215 Appleby LineTraffic Impact Study, July 2013
Page 16 Dillon Consulting Limited
Table 9 — Weekday PM Trip Generation
Land Use Variable Amount Rate Total Trips % Entering # Entering % Exiting # ExitingHotel Rooms 105 0.61 64 58 37 42 27Moxie’s 1000 ft2 6.55 7.49 49 67 33 33 16Tim Horton’s 1000 ft2 3.09 42.93 132 50 66 50 66Retail 1000 ft2 5.00 3.73 19 49 9 51 10
Subtotal 264 145 119Internal capture adjustment -24 -12 -12
Gross Site Trips 240 133 107Pass-by adjustment (Tim Horton’s) -62 -31 -31
Pass-by adjustment (retail) -6 -3 -3Primary Trips 172 99 73
Table 10 — Saturday Mid-Day Trip Generation
Land Use Variable Amount Rate Total Trips % Entering # Entering % Exiting # ExitingHotel Rooms 105 0.72 76 56 42 44 33Moxie’s 1000 ft2 6.55 10.82 71 59 42 41 29Tim Horton’s 1000 ft2 3.09 84.52 261 50 131 50 131Retail 1000 ft2 5.00 4.89 24 52 13 48 11
Subtotal 432 228 204Internal capture adjustment -36 -18 -18
Gross Site Trips 396 210 186Pass-by adjustment (Tim Horton’s) -50 -25 -25
Pass-by adjustment -6 -3 -3Primary Trips 340 182 158
4.8 Trip Distribution and Assignment
The trip distribution for the site is based on these general assumptions about destinations:
It is assumed that the hotel will have mainly regional, national, and international clients.As a result, the majority (75%) of traffic bound to and from the site will access it via theQEW/Highway 403, located to the south.It is assumed that the Moxie’s restaurant and retail uses will serve a catchment areaprimarily located to the north of the site, due to the abundance of housing to the north andthe QEW/Highway 403 acting as a psychological barrier for those south of it. As a result,a slight majority (60%) of the traffic generated by this site use will access it from thenorth.It is assumed that the Tim Horton’s will have a local catchment area. As a result, thetraffic generated by this site uses will be evenly split between north and south. However,pass-by trips for both the Tim Horton’s as well as the retail uses will have a distribution

1215 Appleby LineTraffic Impact Study, July 2013
Dillon Consulting Limited Page 17
of 100% northbound and 0% southbound, due to the prohibition of left turns out of thesite.All vehicles originating from or destined to points south of the proposed site do so southof the study area; no vehicles originate from or are destined to the Storage Spot/A&Wdriveway or the Appleby Ice Centre. This is considered to be a conservative assumptionsince there will be some interaction between these sites.Vehicles originating from or destined to points north of the proposed site do so in aproportion of 2/3 northbound along Appleby Line and 1/3 westbound along Mainway;this assumption is conservative and may overestimate the number of northbound left turnmovements at the Appleby Line and Mainway intersection.
4.9 Total Future Site Traffic
The results of the distribution assumptions are presented in Table 11 for the weekday PM peakperiod and Table 12 for the Saturday mid-day peak period.
Table 11 — Weekday PM Trips Directional Breakdown
Land Use Trip Type TripsEntering From Exiting To
TotalNorth South
TotalNorth South
% Trips % Trips % Trips % Trips
Hotel Primary 52 35 25 9 75 26 17 25 4 75 13Moxie’s Primary 46 30 60 18 40 12 16 60 10 40 6Tim Horton’s Primary 62 31 50 15 50 16 31 50 16 50 15Tim Horton’s Pass-by 62 31 0 0 100 31 31 100 31 0 0Retail Primary 12 6 60 4 40 2 6 60 4 40 2Retail Pass-by 6 3 0 0 100 3 3 100 3 0 0
Total 240 136 46 90 104 68 36
Table 12 — Saturday Mid-Day Trips Directional Breakdown
Land Use Trip Type TripsEntering From Exiting To
Total North South Total North South% Trips % Trips % Trips % Trips
Hotel Primary 58 40 25 10 75 30 18 25 4 75 14Moxie’s Primary 66 38 60 23 40 15 28 60 17 40 11Tim Horton’s Primary 198 96 50 48 50 48 102 50 51 50 51Tim Horton’s Pass-by 50 25 0 0 100 25 25 100 25 0 0Retail Primary 18 9 60 5 40 4 9 60 5 40 4Retail Pass-by 6 3 0 0 100 3 3 100 3 0 0
Total 396 211 86 125 185 105 80
1215 Appleby LineTraffic Impact Study, July 2013
Page 18 Dillon Consulting Limited
5.0 Total Future Traffic Operations
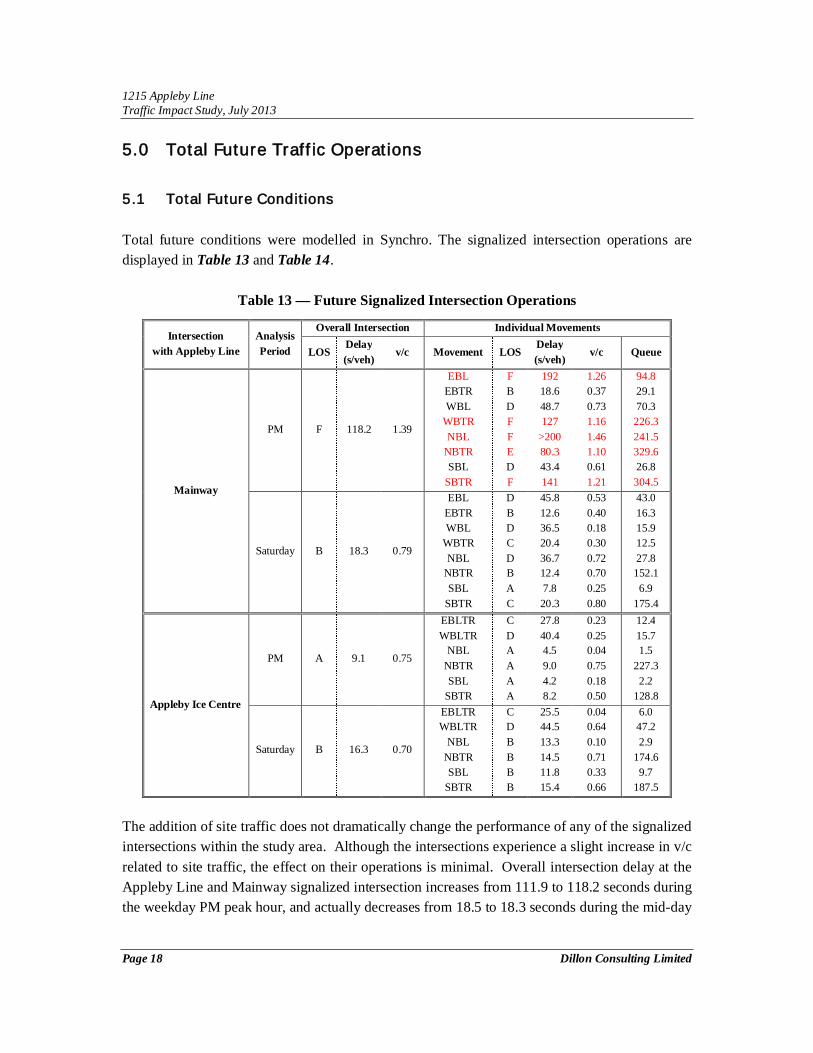
5.1 Total Future Conditions
Total future conditions were modelled in Synchro. The signalized intersection operations aredisplayed in Table 13 and Table 14.
Table 13 — Future Signalized Intersection Operations
Intersectionwith Appleby Line
AnalysisPeriod
Overall Intersection Individual Movements
LOSDelay(s/veh)
v/c Movement LOSDelay(s/veh)
v/c Queue
Mainway
PM F 118.2 1.39
EBLEBTRWBL
WBTRNBL
NBTRSBL
SBTR
FBDFFEDF
19218.648.7127
>20080.343.4141
1.260.370.731.161.461.100.611.21
94.829.170.3226.3241.5329.626.8304.5
Saturday B 18.3 0.79
EBLEBTRWBL
WBTRNBL
NBTRSBL
SBTR
DBDCDBAC
45.812.636.520.436.712.47.820.3
0.530.400.180.300.720.700.250.80
43.016.315.912.527.8152.16.9
175.4
Appleby Ice Centre
PM A 9.1 0.75
EBLTRWBLTR
NBLNBTRSBL
SBTR
CDAAAA
27.840.44.59.04.28.2
0.230.250.040.750.180.50
12.415.71.5
227.32.2
128.8
Saturday B 16.3 0.70
EBLTRWBLTR
NBLNBTRSBL
SBTR
CDBBBB
25.544.513.314.511.815.4
0.040.640.100.710.330.66
6.047.22.9
174.69.7
187.5
The addition of site traffic does not dramatically change the performance of any of the signalizedintersections within the study area. Although the intersections experience a slight increase in v/crelated to site traffic, the effect on their operations is minimal. Overall intersection delay at theAppleby Line and Mainway signalized intersection increases from 111.9 to 118.2 seconds duringthe weekday PM peak hour, and actually decreases from 18.5 to 18.3 seconds during the mid-day

1215 Appleby LineTraffic Impact Study, July 2013
Dillon Consulting Limited Page 19
on Saturday. At the Appleby Line and Appleby Ice Centre signalized intersection, delayincreases from 8.8 to 9.1 seconds during the weekday PM peak hour, and from 12.3 to 16.3seconds during the mid-day Saturday.
Table 14 — Future Unsignalized Intersection Operations
Intersection withAppleby Line
MovementWeekday PM Peak Hour Saturday Mid-Day Peak Hour
LOS Delay v/c Queue (m) LOS Delay v/c Queue (m)New Development
DrivewayWBRSBL
ED
44.826.7
0.560.22
22.66.2
CD
19.125.0
0.430.34
16.410.9
StorageSpot/A&WDriveway
WBLWBRSBL
FDC
137.425.823.8
0.300.120.13
7.63.03.4
FBC
54.513.619.2
0.200.070.08
5.21.62.1
The new development’s driveway experiences acceptable levels of service. The very highvolume of northbound vehicles on Appleby Line contributes to mediocre intersectionperformance for vehicles leaving the site, especially during the PM peak period.
The unsignalized intersection at the Storage Spot/A&W driveway is not significantly affected bytraffic generated by the site at 1215 Appleby Line. In addition, the southbound left turn queue toenter the existing site, which utilizes the two-way left-turn lane in the centre of the roadway,does not stretch far enough north to affect the vehicles attempting to access the new developmentsite.
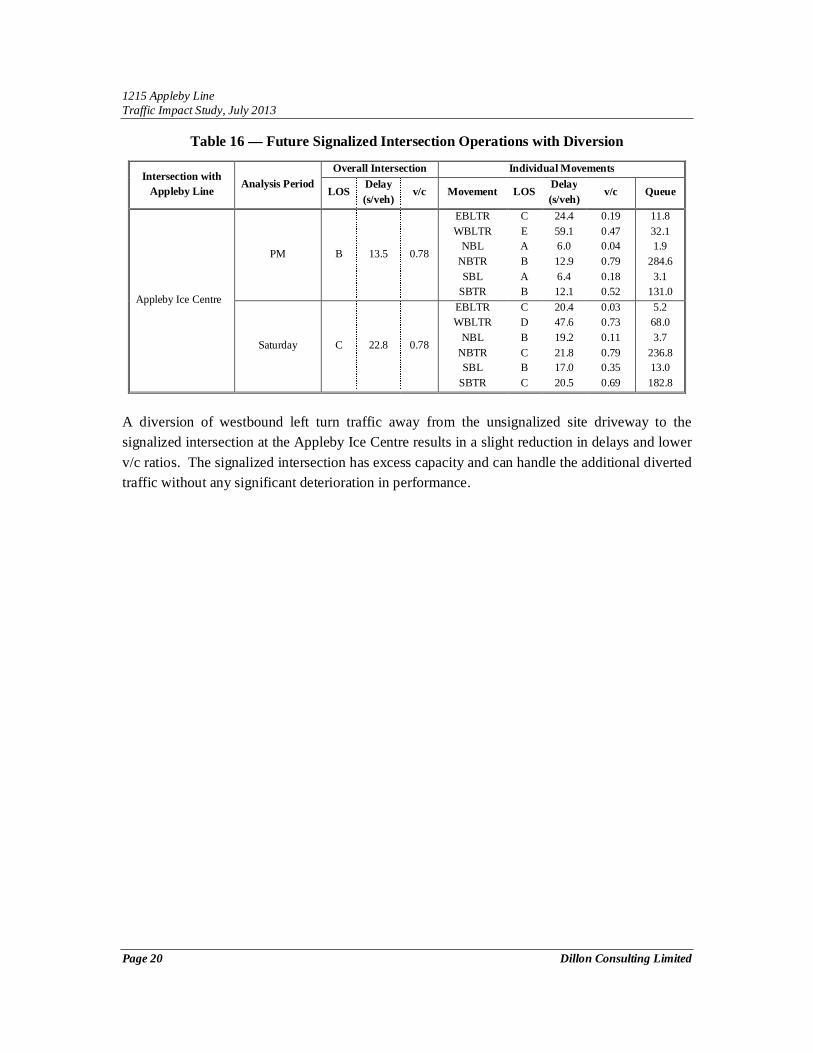
5.2 Diversion of Westbound Left Traffic to Appleby Ice Centre Intersection
As the proposed development will have an interconnection to the A&W/Storage Spot site to thesouth, it is possible for vehicular access/egress to occur via that site. In particular, vehiclesdestined to the south may choose to traverse the site to the south to exit on to Appleby Line at theexisting signalized intersection, instead of being forced to first go northbound out of the site.The effects of a diversion, in which exiting traffic bound to the south uses to the Appleby IceCentre signalized intersection, are presented in Table 15 and Table 16.
Table 15 — Future Unsignalized Intersection Operations with Diversion
Intersection withAppleby Line
MovementWeekday PM Peak Hour Saturday Mid-Day Peak Hour
LOS Delay v/c Queue (m) LOS Delay v/c Queue (m)
New DevelopmentDriveway
WBRSBL
DD
33.426.7
0.350.22
11.46.2
CD
15.725.0
0.250.34
7.310.9
1215 Appleby LineTraffic Impact Study, July 2013
Page 20 Dillon Consulting Limited
Table 16 — Future Signalized Intersection Operations with Diversion
Intersection withAppleby Line
Analysis PeriodOverall Intersection Individual Movements
LOSDelay(s/veh)
v/c Movement LOSDelay(s/veh)
v/c Queue
Appleby Ice Centre
PM B 13.5 0.78
EBLTRWBLTR
NBLNBTRSBL
SBTR
CEABAB
24.459.16.012.96.412.1
0.190.470.040.790.180.52
11.832.11.9
284.63.1
131.0
Saturday C 22.8 0.78
EBLTRWBLTR
NBLNBTRSBL
SBTR
CDBCBC
20.447.619.221.817.020.5
0.030.730.110.790.350.69
5.268.03.7
236.813.0182.8
A diversion of westbound left turn traffic away from the unsignalized site driveway to thesignalized intersection at the Appleby Ice Centre results in a slight reduction in delays and lowerv/c ratios. The signalized intersection has excess capacity and can handle the additional divertedtraffic without any significant deterioration in performance.

1215 Appleby LineTraffic Impact Study, July 2013
Dillon Consulting Limited Page 21
6.0 Parking Analysis
6.1 Parking Supply
The site plan for the proposed development at 1215 Appleby Line in Burlington includes theprovision of 171 parking spaces, amongst which 6 are accessible.
6.2 Parking Requirements
The site parking requirements based on the city’s zoning by-law are presented in Table 17.
Table 17 — Parking Requirements
Site Use Parking Rate Unit Measure Spaces RequiredHotel 1.00 Suites 105 suites 105.0Tim Horton’s 5.25 100 m2 of GFA 287.1 m2 15.1
Moxie’s5.25 100 m2 of GFA 608.5 m2
78.20.25 Serviced patio capacity 185 people
Retail 5.25 100 m2 of GFA 464.5 m2 24.4Total Spaces Required 223
The hotel parking requirements are significantly higher than published Institute of TransportationEngineers data. ITE parking rate for a hotel is 0.89 spaces per occupied room. The maximumexpected occupancy for the subject hotel is 72%. This percentage is consistent with hotelindustry practice. Using this ITE rate equates to a requirement of 67 spaces. This reduces theoverall site requirement to 185 spaces.
The parking requirements outlined above represent conditions where the site uses are operatingin isolation, during their peak demand. However, due to the multi-use nature of the proposeddevelopment, there is an opportunity to reduce the amount of parking required by using theprinciples of shared parking.
6.3 Shared Parking Reduction
A shared parking reduction can be applied in a multi-use development that sees differing usagepeaks amongst its various site uses. It is inefficient to provide the maximum required number ofparking spots for each use individually, without considering the parking demand throughout theday and how it interacts with the other site uses.
1215 Appleby LineTraffic Impact Study, July 2013
Page 22 Dillon Consulting Limited
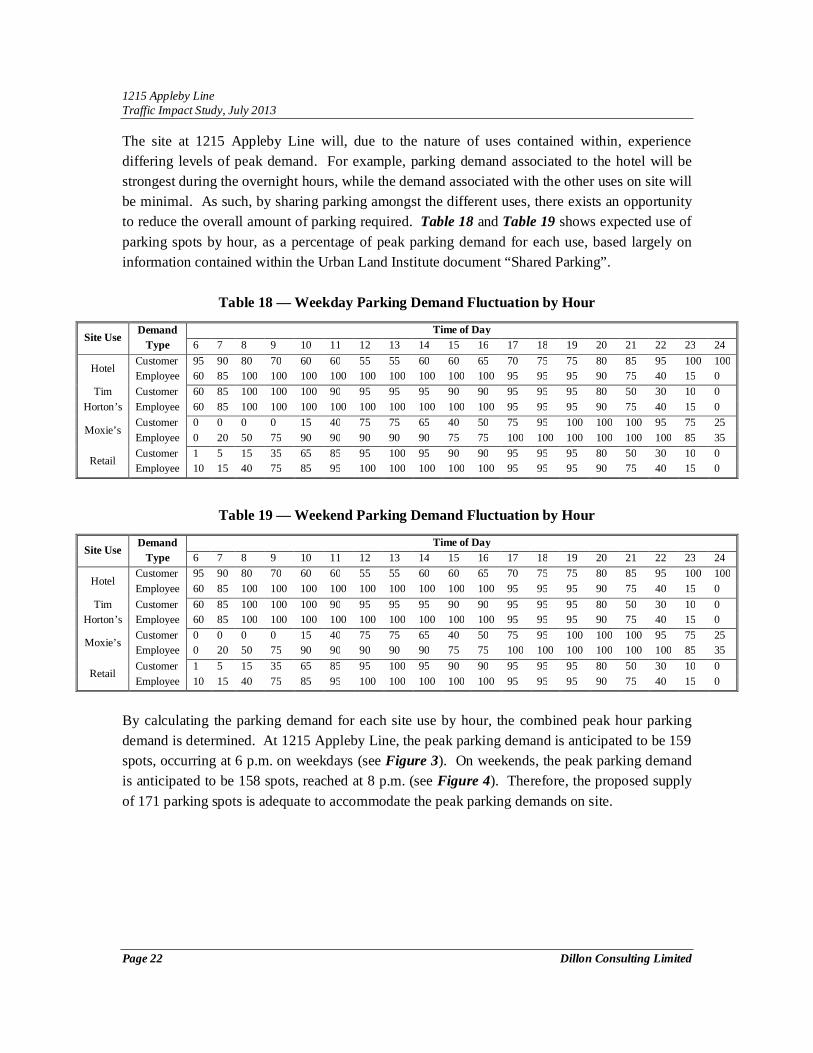
The site at 1215 Appleby Line will, due to the nature of uses contained within, experiencediffering levels of peak demand. For example, parking demand associated to the hotel will bestrongest during the overnight hours, while the demand associated with the other uses on site willbe minimal. As such, by sharing parking amongst the different uses, there exists an opportunityto reduce the overall amount of parking required. Table 18 and Table 19 shows expected use ofparking spots by hour, as a percentage of peak parking demand for each use, based largely oninformation contained within the Urban Land Institute document “Shared Parking”.
Table 18 — Weekday Parking Demand Fluctuation by Hour
Site UseDemand
TypeTime of Day
6 7 8 9 10 11 12 13 14 15 16 17 18 19 20 21 22 23 24
HotelCustomer 95 90 80 70 60 60 55 55 60 60 65 70 75 75 80 85 95 100 100Employee 60 85 100 100 100 100 100 100 100 100 100 95 95 95 90 75 40 15 0
TimHorton’s
Customer 60 85 100 100 100 90 95 95 95 90 90 95 95 95 80 50 30 10 0Employee 60 85 100 100 100 100 100 100 100 100 100 95 95 95 90 75 40 15 0
Moxie’sCustomer 0 0 0 0 15 40 75 75 65 40 50 75 95 100 100 100 95 75 25Employee 0 20 50 75 90 90 90 90 90 75 75 100 100 100 100 100 100 85 35
RetailCustomer 1 5 15 35 65 85 95 100 95 90 90 95 95 95 80 50 30 10 0Employee 10 15 40 75 85 95 100 100 100 100 100 95 95 95 90 75 40 15 0
Table 19 — Weekend Parking Demand Fluctuation by Hour
Site UseDemand
TypeTime of Day
6 7 8 9 10 11 12 13 14 15 16 17 18 19 20 21 22 23 24
HotelCustomer 95 90 80 70 60 60 55 55 60 60 65 70 75 75 80 85 95 100 100Employee 60 85 100 100 100 100 100 100 100 100 100 95 95 95 90 75 40 15 0
TimHorton’s
Customer 60 85 100 100 100 90 95 95 95 90 90 95 95 95 80 50 30 10 0Employee 60 85 100 100 100 100 100 100 100 100 100 95 95 95 90 75 40 15 0
Moxie’sCustomer 0 0 0 0 15 40 75 75 65 40 50 75 95 100 100 100 95 75 25Employee 0 20 50 75 90 90 90 90 90 75 75 100 100 100 100 100 100 85 35
RetailCustomer 1 5 15 35 65 85 95 100 95 90 90 95 95 95 80 50 30 10 0Employee 10 15 40 75 85 95 100 100 100 100 100 95 95 95 90 75 40 15 0
By calculating the parking demand for each site use by hour, the combined peak hour parkingdemand is determined. At 1215 Appleby Line, the peak parking demand is anticipated to be 159spots, occurring at 6 p.m. on weekdays (see Figure 3). On weekends, the peak parking demandis anticipated to be 158 spots, reached at 8 p.m. (see Figure 4). Therefore, the proposed supplyof 171 parking spots is adequate to accommodate the peak parking demands on site.

1215 Appleby LineTraffic Impact Study, July 2013
Dillon Consulting Limited Page 23
Figure 3 — Weekend Parking Demand
Figure 4 — Weekend Parking Demand
0
20
40
60
80
100
120
140
160
180
6 7 8 9 10 11 12 13 14 15 16 17 18 19 20 21 22 23 24
Com
bine
dPa
rkin
gDe
man
d
Time of Day
Weekday Parking Time-of-Day Fluctuations
Moxie's Parking Demand
Tim Horton's Parking Demand
Retail Parking Demand
Hotel Parking Demand
0.0
20.0
40.0
60.0
80.0
100.0
120.0
140.0
160.0
180.0
6 7 8 9 10 11 12 13 14 15 16 17 18 19 20 21 22 23 24
Com
bine
dPa
rkin
gDe
man
d
Time of Day
Weekend Parking Time-of-Day Fluctuations
Moxie's Parking Demand
Tim Horton's Parking Demand
Retail Parking Demand
Hotel Parking Demand
Parking Supply Provided
Parking Supply Provided

1215 Appleby LineTraffic Impact Study, July 2013
Page 24 Dillon Consulting Limited
7.0 Conclusions
This report has been prepared to document the traffic impacts of the proposed commercialdevelopment located at 1215 Appleby Line in Burlington, Ontario. Specific emphasis was givento the operations of the existing intersections and accesses within the study area, in addition tothe performance and suitability of the new site driveway.
Existing Conditions
The intersections within the study area currently operate at good levels of service, with theexception of the Appleby Line and Mainway intersection during the weekday PM peak period,where multiple critical movements have been identified. In addition, the unsignalizedintersection of Appleby Line and the Storage Spot/A&W driveway access suffers from poorlevels of service for vehicles making left turns out of the site driveway.
Background Development
Several background developments have been identi ed to the north of the study area. Trafficgenerated by these developments was added to future background conditions. The study area isaffected by the background developments primarily by means of increased through traffic alongAppleby Line. In addition, future background conditions include the application of an overall 2%annual growth rate to existing volumes, as directed by Halton Region staff.
Future Background Conditions
Background traf c increases on the road network within the study area will further deterioratethe performance of the Appleby Line and Mainway intersection during the weekday PM peakperiod. Similarly, the delay for the westbound left turn movement at the unsignalizedintersection of Appleby Line and the Storage Spot/A&W driveway will increase.
Proposed Development
The proposed development is a mixed-use site, comprising a 105-room hotel, 465 m2 of mixed-use retail, a 608 m2 Moxie’s restaurant, and a 287 m2 Tim Horton’s coffee shop. It will belocated at 1215 Appleby Line, immediately to the north of the existing Storage Spot and A&Wsite.

1215 Appleby LineTraffic Impact Study, July 2013
Dillon Consulting Limited Page 25
Direct access to the site is proposed via a driveway connecting to Appleby Line. Inbound accesswill be permitted from both directions of travel along Appleby Line, while vehicles exiting viathe driveway will be forced to make a right turn and proceed northbound. The proposeddevelopment will also have an interconnection to the existing site to the south.
Site Traffic
Upon full built-out, the site will generate a total of 240 vehicle trips during the weekday PMpeak hour and 396 vehicle trips during the Saturday mid-day peak hour. A certain degree ofinternal trip capture will take place, making use of the synergy between different site uses toreduce the amount of trips generated. In addition, a significant percentage of the vehicle tripsassociated with the site are pass-by trips, and are thus not completely new trips added to the localroad network.
Total Future Conditions
The addition of site traffic to study area intersections does not significantly change theiroperational performance. When all exiting vehicles (regardless of intended destination) use thesite driveway to turn out northbound on to Appleby Line, the performance of the westboundexiting movement, as well as the southbound left turn entering movement, is acceptable.
For vehicles which are destined to points south along Appleby Line, there is a potentialalternative egress via the interconnection to the signalized driveway at the Appleby Ice Centre.There is sufficient residual capacity at this signalized intersection to accommodate left turningvehicles from the subject site.
Parking Analysis
The site plan for the development at 1215 Appleby Line indicates the provision of 171 parkingspaces. When parking requirements for each use are calculated individually, the demand forparking exceeds the proposed supply. However, when shared parking principles are consideredto make use of different peak parking periods amongst the various site uses, the total parkingsupply exceeds the maximum projected demand on both weekdays (159 spots) and weekends(158 spots).

Appendix ADevelopment Concept Site Plan
6.0 m FIRE ROUTEFIRE ROUTE TO BE POSTED
DESIGNATED UNDERMUNICIPAL BY-LAW
APPELBYCREEK
ADJACENT STORAGE FACILITY
PROPOSED -BLDG DHOTEL
6 STOREY - 105 SUITESSPRINKLERED
3.00m
6.00
m6.
00m
5.82
m
ADJACENT CAR WASH
9.30m
6.05
m
B
1370 SF PATIO
1000 SFPATIO
MAIN
PROPOSED - BLDG C1 STOREY - MIXED USE929.0 SM (10,000) GFA
PROPOSED - BLDG BQUICK SERVICE RESTAURANT1 STOREY - 287.1 SM (3,090 SF)
G
G
G
465 SF PATIO
20.00m
PROPOSED - BLDG A 1 STOREY
RESTAURANTGFA 608.5 SM
(6,550 SF)
GRD: 510.9 SM (5,500 SF)MEZZ.: 97.6 SM (1,050 SF)
ADJACENTA&W
23.45m
3.15m
3.45m
15.72m
5.30
m
4.00
m
3.66m0.90m
3.66m1.90m
59.56m 24.38m 41.26m
8.32m0.91m
15.28m
2.50m
4.00m
1.50m
1.69m
6. 27m
6.00m 6.00m 7.00m19.77m
28.4
5m
5.15
m
4.37m 10.46m
2.75
m
2.00
m
2.75
m2.
75m
5.50m
1.20
m17
.68m
24.69m
2.24
m
6. 00m6.00m
6. 00m6.00m
6. 00m6.00m
1.50m
7.00m
2.56m
R12.00m
R4.57mR9.00m
R12.00m
R12.00
m
R7.65m
R9.00m
4.50
m
R5.00m
R3.00m
R1.5
0m
6.00m2.00m
6.00m
2.00m
R8.29m
4.33m
36.00m1.50m
1.50m 6.50m
1.35
m
1.78
m
R6.75m
R6.
10m
R6.00mR9.50m
R1.
00m
R1.0
0m
11.5
0m
27.63m
10.00m
17.53m
7.40
m
6.75m
13.7
5m
1.50m
0 10'5' 20' 30' 50'
5 m0 m 10 m 15 m2 m
SCALE: 1: 250 (22 x 34) 1:500 (11 X 17)
MASTER SITE PLAN
ASP-100TRUE NORTHPROJECT NORTHREVISION

Appendix BTraffic Count Data
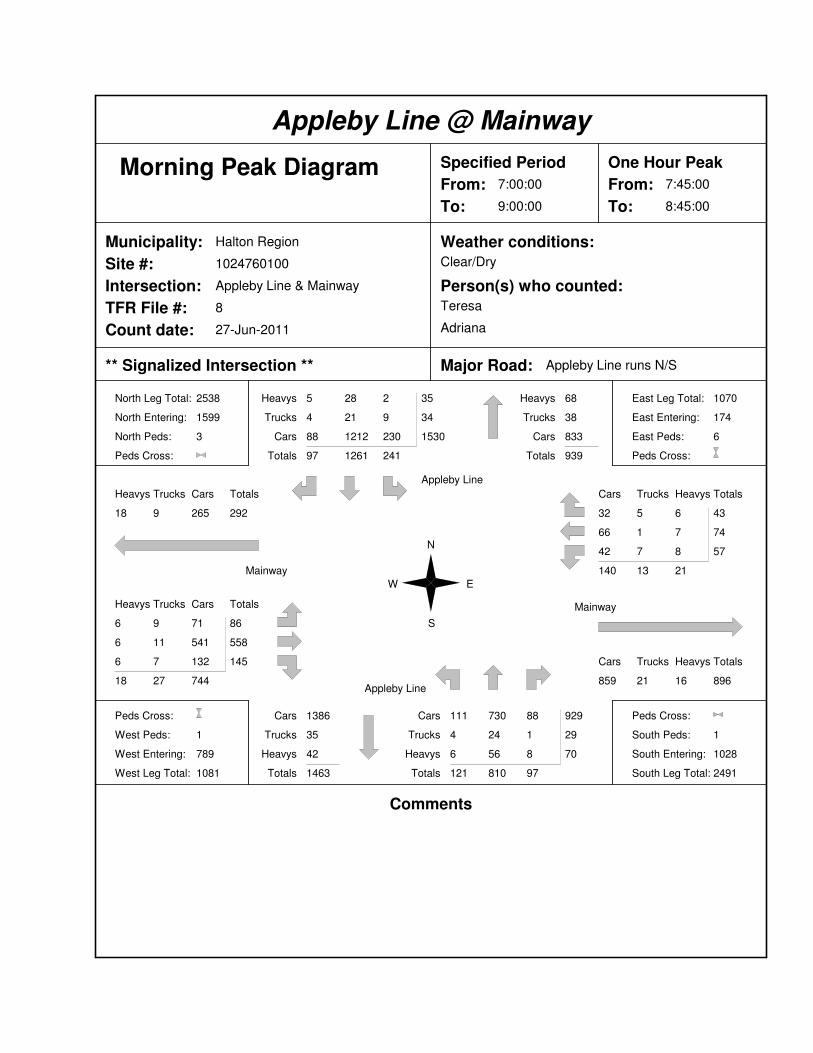
Appleby Line @ Mainway
Morning Peak Diagram Specified Period
From:
To:
7:00:00
9:00:00
One Hour Peak
From:
To:
7:45:00
8:45:00
Municipality:
Site #:
Intersection:
TFR File #:
Count date:
Halton Region
1024760100
Appleby Line & Mainway
8
27-Jun-2011
Weather conditions:Clear/Dry
Person(s) who counted:Teresa
Adriana
** Signalized Intersection ** Major Road: Appleby Line runs N/S
North Leg Total:
North Entering:
North Peds:
Peds Cross:
2538
1599
3
Heavys
Trucks
Cars
Totals
5
4
88
97
28
21
1212
1261
2
9
230
241
35
34
1530
Heavys
Trucks
Cars
Totals
68
38
833
939
Heavys Trucks Cars Totals
18 9 265 292
Heavys Trucks Cars Totals
6 9 71 86
6 11 541 558
6 7 132 145
18 27 744
Peds Cross:
West Peds:
West Entering:
West Leg Total:
1
789
1081
Appleby Line
Mainway
W
N
E
S
Mainway
Appleby Line
East Leg Total:
East Entering:
East Peds:
Peds Cross:
1070
174
6
Cars Trucks Heavys Totals
32 5 6 43
66 1 7 74
42 7 8 57
140 13 21
Cars Trucks Heavys Totals
859 21 16 896
Cars
Trucks
Heavys
Totals
1386
35
42
1463
Cars
Trucks
Heavys
Totals
111
4
6
121
730
24
56
810
88
1
8
97
929
29
70
Peds Cross:
South Peds:
South Entering:
South Leg Total:
1
1028
2491
Comments

Appleby Line @ Mainway
Mid-day Peak Diagram Specified Period
From:
To:
11:00:00
14:00:00
One Hour Peak
From:
To:
12:00:00
13:00:00
Municipality:
Site #:
Intersection:
TFR File #:
Count date:
Halton Region
1024760100
Appleby Line & Mainway
8
27-Jun-2011
Weather conditions:Clear/Dry
Person(s) who counted:Teresa
Adriana
** Signalized Intersection ** Major Road: Appleby Line runs N/S
North Leg Total:
North Entering:
North Peds:
Peds Cross:
2438
1147
0
Heavys
Trucks
Cars
Totals
4
3
92
99
24
20
856
900
1
9
138
148
29
32
1086
Heavys
Trucks
Cars
Totals
59
29
1203
1291
Heavys Trucks Cars Totals
21 20 347 388
Heavys Trucks Cars Totals
3 9 123 135
7 6 93 106
18 8 90 116
28 23 306
Peds Cross:
West Peds:
West Entering:
West Leg Total:
0
357
745
Appleby Line
Mainway
W
N
E
S
Mainway
Appleby Line
East Leg Total:
East Entering:
East Peds:
Peds Cross:
798
465
0
Cars Trucks Heavys Totals
176 5 5 186
147 12 6 165
101 6 7 114
424 23 18
Cars Trucks Heavys Totals
297 23 13 333
Cars
Trucks
Heavys
Totals
1047
34
49
1130
Cars
Trucks
Heavys
Totals
108
5
11
124
904
15
51
970
66
8
5
79
1078
28
67
Peds Cross:
South Peds:
South Entering:
South Leg Total:
0
1173
2303
Comments

Appleby Line @ Mainway
Afternoon Peak Diagram Specified Period
From:
To:
15:00:00
18:00:00
One Hour Peak
From:
To:
16:30:00
17:30:00
Municipality:
Site #:
Intersection:
TFR File #:
Count date:
Halton Region
1024760100
Appleby Line & Mainway
8
27-Jun-2011
Weather conditions:Clear/Dry
Person(s) who counted:Teresa
Adriana
** Signalized Intersection ** Major Road: Appleby Line runs N/S
North Leg Total:
North Entering:
North Peds:
Peds Cross:
2721
1151
2
Heavys
Trucks
Cars
Totals
3
5
100
108
17
11
954
982
0
3
58
61
20
19
1112
Heavys
Trucks
Cars
Totals
19
57
1494
1570
Heavys Trucks Cars Totals
13 20 1154 1187
Heavys Trucks Cars Totals
3 1 137 141
7 4 99 110
6 5 128 139
16 10 364
Peds Cross:
West Peds:
West Entering:
West Leg Total:
0
390
1577
Appleby Line
Mainway
W
N
E
S
Mainway
Appleby Line
East Leg Total:
East Entering:
East Peds:
Peds Cross:
1250
1039
2
Cars Trucks Heavys Totals
161 1 5 167
669 12 8 689
175 2 6 183
1005 15 19
Cars Trucks Heavys Totals
190 10 11 211
Cars
Trucks
Heavys
Totals
1257
18
29
1304
Cars
Trucks
Heavys
Totals
385
3
2
390
1196
55
11
1262
33
3
4
40
1614
61
17
Peds Cross:
South Peds:
South Entering:
South Leg Total:
0
1692
2996
Comments

Appleby Line @ Mainway
Total Count Diagram
Municipality:
Site #:
Intersection:
TFR File #:
Count date:
Halton Region
1024760100
Appleby Line & Mainway
8
27-Jun-2011
Weather conditions:Clear/Dry
Person(s) who counted:Teresa
Adriana
** Signalized Intersection ** Major Road: Appleby Line runs N/S
North Leg Total:
North Entering:
North Peds:
Peds Cross:
18789
9473
7
Heavys
Trucks
Cars
Totals
30
36
565
631
215
162
7480
7857
28
55
902
985
273
253
8947
Heavys
Trucks
Cars
Totals
344
244
8728
9316
Heavys Trucks Cars Totals
181 141 3862 4184
Heavys Trucks Cars Totals
35 33 753 821
57 55 1449 1561
75 39 811 925
167 127 3013
Peds Cross:
West Peds:
West Entering:
West Leg Total:
2
3307
7491
Appleby Line
Mainway
W
N
E
S
Mainway
Appleby Line
East Leg Total:
East Entering:
East Peds:
Peds Cross:
6718
3619
19
Cars Trucks Heavys Totals
725 32 37 794
1866 66 86 2018
690 58 59 807
3281 156 182
Cars Trucks Heavys Totals
2820 143 136 3099
Cars
Trucks
Heavys
Totals
8981
259
349
9589
Cars
Trucks
Heavys
Totals
1431
39
65
1535
7250
179
272
7701
469
33
51
553
9150
251
388
Peds Cross:
South Peds:
South Entering:
South Leg Total:
4
9789
19378
Comments

Appleby Line @ Mainway
Mid-day Peak Diagram Specified Period
From:
To:
10:00:00
14:00:00
One Hour Peak
From:
To:
12:45:00
13:45:00
Municipality:
Site #:
Intersection:
TFR File #:
Count date:
Burlington
1024760100
Appleby Line & Mainway
5
26-Jan-2013
Weather conditions:Sunny/Dry
Person(s) who counted:Eugene
Krystyna
** Signalized Intersection ** Major Road: Appleby Line runs N/S
North Leg Total:
North Entering:
North Peds:
Peds Cross:
2724
1375
0
Heavys
Trucks
Cars
Totals
0
0
54
54
10
11
1256
1277
0
0
44
44
10
11
1354
Heavys
Trucks
Cars
Totals
7
11
1331
1349
Heavys Trucks Cars Totals
0 2 196 198
Heavys Trucks Cars Totals
3 0 117 120
1 0 41 42
1 1 155 157
5 1 313
Peds Cross:
West Peds:
West Entering:
West Leg Total:
0
319
517
Appleby Line
Mainway
W
N
E
S
Mainway
Appleby Line
East Leg Total:
East Entering:
East Peds:
Peds Cross:
265
137
1
Cars Trucks Heavys Totals
64 3 0 67
34 1 0 35
35 0 0 35
133 4 0
Cars Trucks Heavys Totals
124 2 2 128
Cars
Trucks
Heavys
Totals
1446
12
11
1469
Cars
Trucks
Heavys
Totals
108
1
0
109
1150
8
4
1162
39
2
1
42
1297
11
5
Peds Cross:
South Peds:
South Entering:
South Leg Total:
0
1313
2782
Comments

Appleby Line @ Mainway
Afternoon Peak Diagram Specified Period
From:
To:
15:00:00
19:00:00
One Hour Peak
From:
To:
15:00:00
16:00:00
Municipality:
Site #:
Intersection:
TFR File #:
Count date:
Burlington
1024760100
Appleby Line & Mainway
5
26-Jan-2013
Weather conditions:Sunny/Dry
Person(s) who counted:Eugene
Krystyna
** Signalized Intersection ** Major Road: Appleby Line runs N/S
North Leg Total:
North Entering:
North Peds:
Peds Cross:
2549
1282
0
Heavys
Trucks
Cars
Totals
0
0
74
74
2
7
1165
1174
0
0
34
34
2
7
1273
Heavys
Trucks
Cars
Totals
6
10
1251
1267
Heavys Trucks Cars Totals
0 0 246 246
Heavys Trucks Cars Totals
0 1 118 119
0 0 41 41
0 1 115 116
0 2 274
Peds Cross:
West Peds:
West Entering:
West Leg Total:
1
276
522
Appleby Line
Mainway
W
N
E
S
Mainway
Appleby Line
East Leg Total:
East Entering:
East Peds:
Peds Cross:
255
149
0
Cars Trucks Heavys Totals
56 1 0 57
53 0 0 53
39 0 0 39
148 1 0
Cars Trucks Heavys Totals
106 0 0 106
Cars
Trucks
Heavys
Totals
1319
8
2
1329
Cars
Trucks
Heavys
Totals
119
0
0
119
1077
8
6
1091
31
0
0
31
1227
8
6
Peds Cross:
South Peds:
South Entering:
South Leg Total:
1
1241
2570
Comments

Appleby Line @ Mainway
Total Count Diagram
Municipality:
Site #:
Intersection:
TFR File #:
Count date:
Burlington
1024760100
Appleby Line & Mainway
5
26-Jan-2013
Weather conditions:Sunny/Dry
Person(s) who counted:Eugene
Krystyna
** Signalized Intersection ** Major Road: Appleby Line runs N/S
North Leg Total:
North Entering:
North Peds:
Peds Cross:
19214
9529
7
Heavys
Trucks
Cars
Totals
1
2
501
504
31
48
8610
8689
0
3
333
336
32
53
9444
Heavys
Trucks
Cars
Totals
36
50
9599
9685
Heavys Trucks Cars Totals
2 11 1749 1762
Heavys Trucks Cars Totals
5 6 834 845
2 1 383 386
5 4 890 899
12 11 2107
Peds Cross:
West Peds:
West Entering:
West Leg Total:
4
2130
3892
Appleby Line
Mainway
W
N
E
S
Mainway
Appleby Line
East Leg Total:
East Entering:
East Peds:
Peds Cross:
2089
1102
8
Cars Trucks Heavys Totals
453 5 2 460
333 3 0 336
298 6 2 306
1084 14 4
Cars Trucks Heavys Totals
973 9 5 987
Cars
Trucks
Heavys
Totals
9798
58
38
9894
Cars
Trucks
Heavys
Totals
915
6
1
922
8312
39
29
8380
257
5
3
265
9484
50
33
Peds Cross:
South Peds:
South Entering:
South Leg Total:
3
9567
19461
Comments
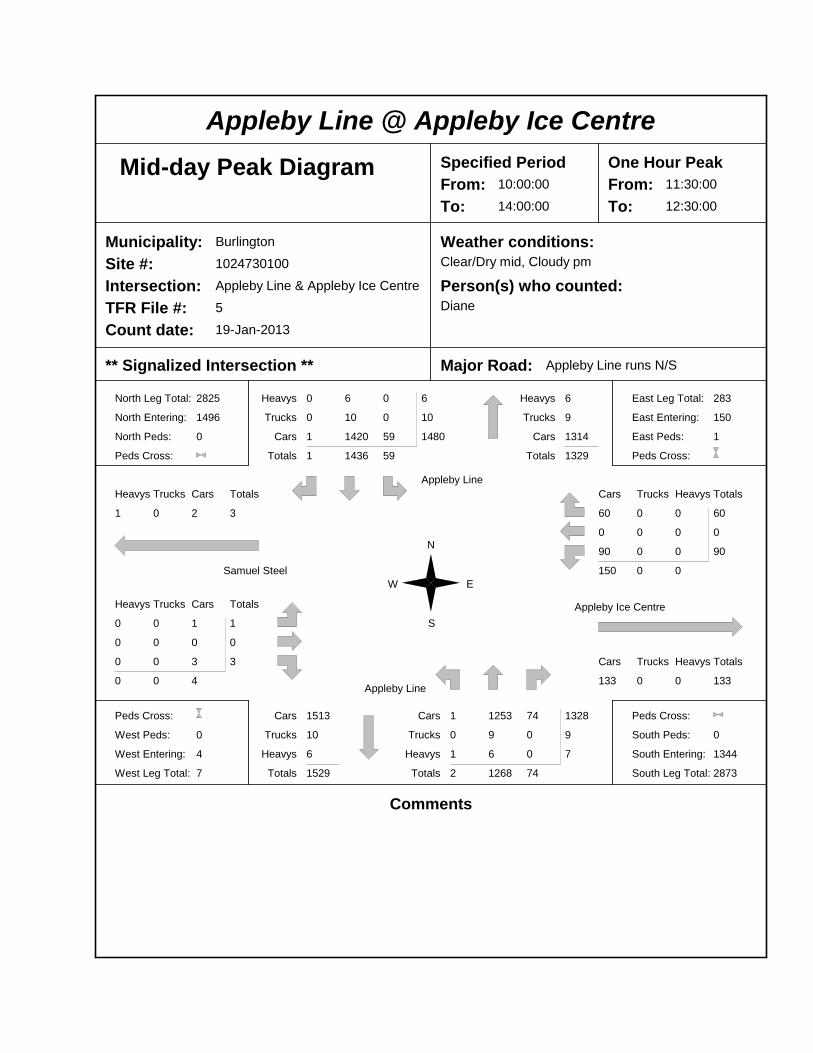
Appleby Line @ Appleby Ice Centre
Mid-day Peak Diagram Specified Period
From:
To:
10:00:00
14:00:00
One Hour Peak
From:
To:
11:30:00
12:30:00
Municipality:
Site #:
Intersection:
TFR File #:
Count date:
Burlington
1024730100
Appleby Line & Appleby Ice Centre
5
19-Jan-2013
Weather conditions:Clear/Dry mid, Cloudy pm
Person(s) who counted:Diane
** Signalized Intersection ** Major Road: Appleby Line runs N/S
North Leg Total:
North Entering:
North Peds:
Peds Cross:
2825
1496
0
Heavys
Trucks
Cars
Totals
0
0
1
1
6
10
1420
1436
0
0
59
59
6
10
1480
Heavys
Trucks
Cars
Totals
6
9
1314
1329
Heavys Trucks Cars Totals
1 0 2 3
Heavys Trucks Cars Totals
0 0 1 1
0 0 0 0
0 0 3 3
0 0 4
Peds Cross:
West Peds:
West Entering:
West Leg Total:
0
4
7
Appleby Line
Samuel Steel
W
N
E
S
Appleby Ice Centre
Appleby Line
East Leg Total:
East Entering:
East Peds:
Peds Cross:
283
150
1
Cars Trucks Heavys Totals
60 0 0 60
0 0 0 0
90 0 0 90
150 0 0
Cars Trucks Heavys Totals
133 0 0 133
Cars
Trucks
Heavys
Totals
1513
10
6
1529
Cars
Trucks
Heavys
Totals
1
0
1
2
1253
9
6
1268
74
0
0
74
1328
9
7
Peds Cross:
South Peds:
South Entering:
South Leg Total:
0
1344
2873
Comments

Appleby Line @ Appleby Ice Centre
Afternoon Peak Diagram Specified Period
From:
To:
15:00:00
19:00:00
One Hour Peak
From:
To:
16:00:00
17:00:00
Municipality:
Site #:
Intersection:
TFR File #:
Count date:
Burlington
1024730100
Appleby Line & Appleby Ice Centre
5
19-Jan-2013
Weather conditions:Clear/Dry mid, Cloudy pm
Person(s) who counted:Diane
** Signalized Intersection ** Major Road: Appleby Line runs N/S
North Leg Total:
North Entering:
North Peds:
Peds Cross:
2518
1234
0
Heavys
Trucks
Cars
Totals
0
0
0
0
2
4
1132
1138
0
0
96
96
2
4
1228
Heavys
Trucks
Cars
Totals
1
3
1280
1284
Heavys Trucks Cars Totals
0 0 2 2
Heavys Trucks Cars Totals
0 0 0 0
0 0 0 0
0 0 2 2
0 0 2
Peds Cross:
West Peds:
West Entering:
West Leg Total:
0
2
4
Appleby Line
Samuel Steel
W
N
E
S
Appleby Ice Centre
Appleby Line
East Leg Total:
East Entering:
East Peds:
Peds Cross:
387
170
0
Cars Trucks Heavys Totals
81 0 0 81
0 0 0 0
89 0 0 89
170 0 0
Cars Trucks Heavys Totals
216 1 0 217
Cars
Trucks
Heavys
Totals
1223
4
2
1229
Cars
Trucks
Heavys
Totals
2
0
0
2
1199
3
1
1203
120
1
0
121
1321
4
1
Peds Cross:
South Peds:
South Entering:
South Leg Total:
0
1326
2555
Comments
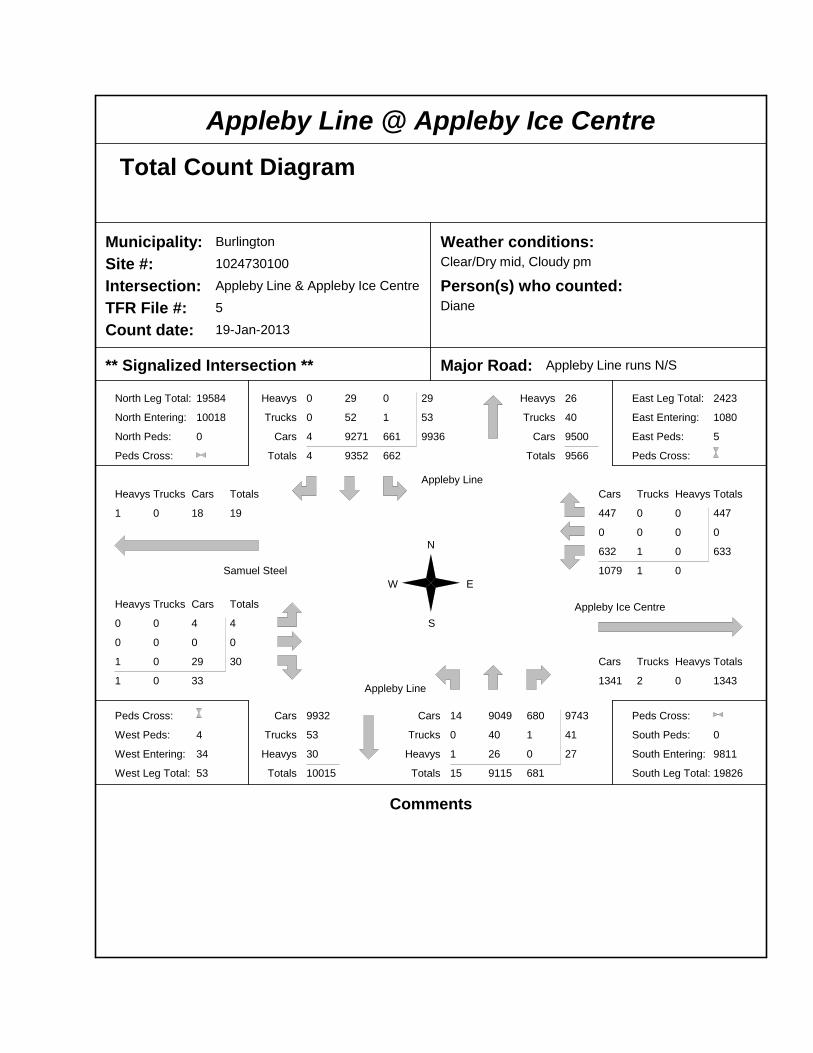
Appleby Line @ Appleby Ice Centre
Total Count Diagram
Municipality:
Site #:
Intersection:
TFR File #:
Count date:
Burlington
1024730100
Appleby Line & Appleby Ice Centre
5
19-Jan-2013
Weather conditions:Clear/Dry mid, Cloudy pm
Person(s) who counted:Diane
** Signalized Intersection ** Major Road: Appleby Line runs N/S
North Leg Total:
North Entering:
North Peds:
Peds Cross:
19584
10018
0
Heavys
Trucks
Cars
Totals
0
0
4
4
29
52
9271
9352
0
1
661
662
29
53
9936
Heavys
Trucks
Cars
Totals
26
40
9500
9566
Heavys Trucks Cars Totals
1 0 18 19
Heavys Trucks Cars Totals
0 0 4 4
0 0 0 0
1 0 29 30
1 0 33
Peds Cross:
West Peds:
West Entering:
West Leg Total:
4
34
53
Appleby Line
Samuel Steel
W
N
E
S
Appleby Ice Centre
Appleby Line
East Leg Total:
East Entering:
East Peds:
Peds Cross:
2423
1080
5
Cars Trucks Heavys Totals
447 0 0 447
0 0 0 0
632 1 0 633
1079 1 0
Cars Trucks Heavys Totals
1341 2 0 1343
Cars
Trucks
Heavys
Totals
9932
53
30
10015
Cars
Trucks
Heavys
Totals
14
0
1
15
9049
40
26
9115
680
1
0
681
9743
41
27
Peds Cross:
South Peds:
South Entering:
South Leg Total:
0
9811
19826
Comments
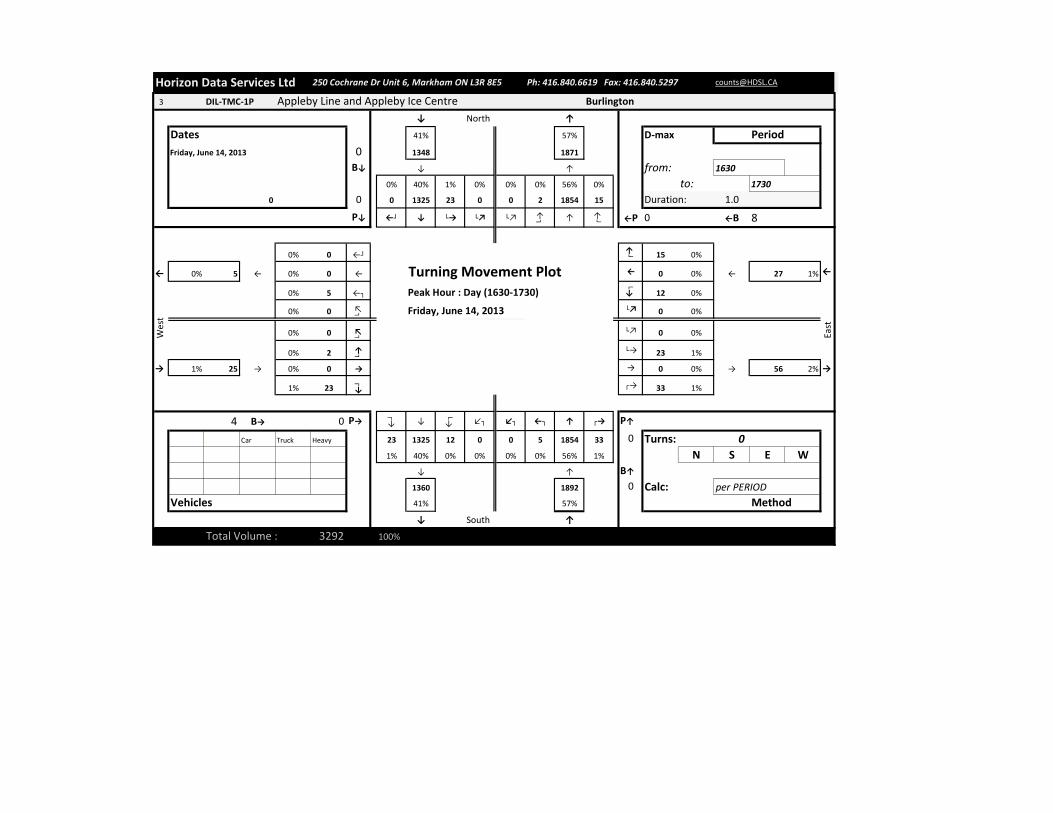
Horizon Data Services Ltd 250 Cochrane Dr Unit 6, Markham ON L3R 8E5 Ph: 416.840.6619 Fax: 416.840.5297 [email protected]
3 DIL-TMC-1P Appleby Line and Appleby Ice Centre Burlington
↓ North ↑
Dates 41% 57% D-max Period
Friday, June 14, 2013 0 1348 1871
B↓ ↓ ↑ from: 1630
0% 40% 1% 0% 0% 0% 56% 0% to: 1730
0 0 0 1325 23 0 0 2 1854 15 Duration: 1.0
P↓ ←┘ ↓ └→ └↗ └↗ └→ ↑
←┘ ←P 0 ←B 8
0% 0 ←┘
←┘ 15 0%
← 0% 5 ← 0% 0 ← ← 0 0% ← 27 1% ←
0% 5 ←┐
└→
12 0%
0% 0 └↗ └↗ 0 0%
0% 0 └↗ └↗ 0 0%
0% 2 └→ └→ 23 1%
→ 1% 25 → 0% 0 → → 0 0% → 56 2% →
1% 23 ←┘ ┌→ 33 1%
4 B→ 0 P→ ←┘ ↓
└→ ↙┐ ↙┐ ←┐ ↑ ┌→ P↑
Peds Bikes Car Truck Heavy 23 1325 12 0 0 5 1854 33 0 Turns: 0
1% 40% 0% 0% 0% 0% 56% 1% N S E W
↓ ↑ B↑
1360 1892 0 Calc: per PERIOD
Vehicles 41% 57% Method
↓ South ↑
Total Volume : 3292 100%
East
Friday, June 14, 2013
Turning Movement Plot
Wes
t
Peak Hour : Day (1630-1730)

Horizon Data Services Ltd 250 Cochrane Dr Unit 6, Markham ON L3R 8E5 Ph: 416.840.6619 Fax: 416.840.5297 [email protected]
4 DIL-TMC-1P Appleby Line and Appleby Ice Centre Burlington
↓ North ↑
Dates 43% 55% Total Period
Friday, June 14, 2013 0 2687 3419
B↓ ↓ ↑ from: 1600
0% 42% 1% 0% 0% 0% 54% 0% to: 1800
0 1 2 2643 42 0 0 6 3383 30 Duration: 2.0
P↓ ←┘ ↓ └→ └↗ └↗ └→ ↑
←┘ ←P 0 ←B 15
0% 2 ←┘
←┘ 30 0%
← 0% 8 ← 0% 0 ← ← 0 0% ← 65 1% ←
0% 6 ←┐
└→
35 1%
0% 0 └↗ └↗ 0 0%
0% 0 └↗ └↗ 0 0%
0% 6 └→ └→ 42 1%
→ 1% 44 → 0% 1 → → 1 0% → 90 1% →
1% 37 ←┘ ┌→ 47 1%
6 B→ 0 P→ ←┘ ↓
└→ ↙┐ ↙┐ ←┐ ↑ ┌→ P↑
Peds Bikes Car Truck Heavy 37 2643 35 0 0 6 3383 47 2 Turns: 0
1% 42% 1% 0% 0% 0% 54% 1% N S E W
↓ ↑ B↑
2715 3436 0 Calc: per PERIOD
Vehicles 44% 55% Method
↓ South ↑
Total Volume : 6232 100%
Friday, June 14, 2013
Wes
t
East
Turning Movement PlotTotal : (1600-1800)

Dillon Consulting 0:15Driveway CountFriday, June 14th, 2013Appleby Line and A&W/Storage Spot driveway
NBR SBL WBR WBL16:00 - 16:15 2 3 3 1 9 3816:15 - 16:30 4 3 2 9 4416:30 - 16:45 3 1 1 3 8 4716:45 - 17:00 2 3 7 12 5417:00 - 17:15 1 6 6 2 15 5817:15 - 17:30 3 5 4 1217:30 - 17:45 2 4 8 1 1517:45 - 18:00 1 9 2 4 16
7 24 20 7 581 1 1 1 84 9 8 4 16
Time INs OUTs Total Hourly
PeakMinMax

Dillon Consulting 0:15Driveway CountSaturday, June 15th, 2013Appleby Line and A&W/Storage Spot driveway
NBR SBL WBR WBL16:00 - 16:15 2 2 3 3 10 3616:15 - 16:30 1 2 1 2 6 4616:30 - 16:45 3 3 6 12 5616:45 - 17:00 1 5 2 8 5917:00 - 17:15 4 6 4 6 20 7017:15 - 17:30 3 3 7 3 16 6217:30 - 17:45 2 6 5 2 15 6117:45 - 18:00 1 7 7 4 19 5918:00 - 18:15 1 3 6 2 12 5518:15 - 18:30 2 3 7 3 1518:30 - 18:45 2 4 7 1318:45 - 19:00 2 5 7 1 15
10 22 23 15 701 2 1 1 64 7 7 6 20
MinMax
INs OUTs Total
Peak Hour
HourlyTime
Appendix CTraffic Signal Timing Plans

CITY OF BURLINGTON TRAFFIC SIGNAL CONTROL SYSTEM
INT: Appleby Ln @ Mainway INT: 284 EFFECTIVE DATE: / /
GROUP NO: 1015CYCLE DEFINITION TABLE:
NEMA PHASE MOVEMENTS VEH PED PED ALL
6 1 PHASE MIN WLK CLR AMB RED SP MIN1 7 3 1 122 8 7 22 4 3 C 373 7 3 1 12
7 8 4 8 7 24 4 3 E 414 3 5 7 3 1 12
6 8 7 22 4 3 C 377 7 3 1 128 8 7 24 4 3 E 41
5 2 Min Cycle = 102
AM PEAK: 120 sec Cycle
SPLIT 1 2 3 4 5 6 7 8 Offset 1
in % 10 47 10 33 10 47 10 33 61%
in sec 11 57 12 40 11 57 12 40 57
NOON PEAK: 110 sec Cycle
SPLIT 1 2 3 4 5 6 7 8 Offset 2
in % 11 42 10 37 11 42 10 37 61%
in sec 11 47 12 40 11 47 12 40 46
PM PEAK: 140 sec Cycle
SPLIT 1 2 3 4 5 6 7 8 Offset 3
in % 9 52 10 29 21 40 8 31 40%
in sec 11 73 15 41 28 56 12 44 85
OFF PEAK: 90 sec Cycle
SPLIT 1 2 3 4 5 6 7 8 Offset 4
in % 13 43 13 31 13 43 13 31 61%
in sec 11 39 12 28 11 39 12 28 59
Weekend 110 sec Cycle
SPLIT 1 2 3 4 5 6 7 8 Offset5
in % 11 42 10 37 11 42 10 37 61%
in sec 11 47 12 40 11 47 12 40 46
PHASE MOVEMENTS
PHASE MOVEMENTS
PHASE MOVEMENTS
PHASE MOVEMENTS
PHASE MOVEMENTS
CITY OF BURLINGTON TRAFFIC SIGNAL CONTROL SYSTEM
INT: Appleby Ln @ Appleby Ice CentreINT: 287 EFFECTIVE DATE: / /
GROUP NO: 1015CYCLE DEFINITION TABLE:
NEMA PHASE MOVEMENTS VEH PED PED ALL
6 1 PHASE MIN WLK CLR AMB RED SP MIN1 7 3 1 122 8 7 19 4 3 C 343 7 3 0 0
8 4 8 7 22 4 3 E 394 5 7 3 0 0
6 8 7 19 4 3 C 347 7 3 0 08 8 7 22 4 3 E 39
2 Min Cycle = 85
AM PEAK: 120 sec Cycle
SPLIT 1 2 3 4 5 6 7 8 Offset 1
in % 10 59 0 31 0 69 0 31 61%
in sec 11 71 0 38 0 83 0 37 64
NOON PEAK: 110 sec Cycle
SPLIT 1 2 3 4 5 6 7 8 Offset 2
in % 11 54 0 35 0 65 0 35 61%
in sec 11 60 0 39 0 72 0 38 15
PM PEAK: 140 sec Cycle
SPLIT 1 2 3 4 5 6 7 8 Offset 3
in % 9 64 0 27 0 73 0 27 40%
in sec 12 90 0 38 0 103 0 37 68
OFF PEAK: 90 sec Cycle
SPLIT 1 2 3 4 5 6 7 8 Offset 4
in % 13 45 0 42 0 58 0 42 61%
in sec 11 41 0 38 0 53 0 37 75
Weekend 110 sec Cycle
SPLIT 1 2 3 4 5 6 7 8 Offset5
in % 11 54 0 35 0 65 0 35 61%
in sec 11 60 0 39 0 72 0 38 15
PHASE MOVEMENTS
PHASE MOVEMENTS
PHASE MOVEMENTS
PHASE MOVEMENTS
PHASE MOVEMENTS

Appendix DLevel of Service Definitions

1 Transportation Research Board: Highway Capacity Manual 1965, 2000
2 Control delay is defined as the component of delay that results when a control signal causes a lanegroup to reduce speed or to stop; it is measured by comparison with the uncontrolled condition.
LEVEL OF SERVICE1
Level of Service (LOS) is defined as a qualitative measure describing operational conditions withina traffic stream, and their perception by motorists and/or passengers. This concept was introducedin the 1965 Highway Capacity Manual as a criteria for interrupted flow conditions. The 2000Highway Capacity Manual changed the basis for measuring Level of Service at intersections tocontrol delay2.
Six Levels of Service are defined with LOS A representing the best operating conditions, and LOSF the worst (briefly described below). It should be noted that there is often significant variabilityin the amount of delay experienced by individual drivers.
LOS A: This Level of Service describes the highest quality of traffic flow and is referred toas free flow. The approach appears open, turning movements are easily made anddrivers have freedom of operation. Control delay is less than 10 seconds/vehicle.
LOS B: This Level of Service is referred to as a stable flow. Drivers feel somewhat restrictedand occasionally may have to wait to complete the minor movement. Control delayis 10-15 seconds/vehicle for unsignalized intersections and 10-20 seconds/vehiclefor signalized intersections.
LOS C: At this level, the operation is stable. Drivers feel more restricted and may have towait, with queues developing for short periods. Control delay is 15-25 seconds/vehicle at unsignalized intersections and 20-35 seconds/vehicle atsignalized intersections.
LOS D: At this level, traffic is approaching unstable flow. The motorist experiencesincreasing restriction and instability of flow. There are substantial delays toapproaching vehicles during short peaks within the peak period, but there areenough gaps to lower demand to permit occasional clearance of developingqueues and prevent excessive back-ups. Control delay is 25-35 seconds/vehicleat unsignalized intersections and 35-55 seconds/vehicle at signalized intersections.
LOS E: At this level capacity occurs. Long queues of vehicles exist and delays to vehiclesmay extend. Control delay is 35-50 seconds/vehicle at unsignalized intersectionsand 55-80 seconds/vehicle at signalized intersections.
LOS F: At this Level of Service, the intersection has failed. Capacity of the intersection hasbeen exceeded. Control delay exceeds 50 seconds/vehicle at unsignalizedintersections and exceeds 80 seconds/vehicle at signalized intersections.

Appendix ADevelopment Concept Site Plan
ETraffic Figures

1215 Appleby Line, BurlingtonTraffic Analysis
July 2013
Figure E-1:XISTING RAFFIC OLUMESE T V
NOT TOSCALE
Appleby Ice Centre
123 (123)123 (123)123 (123)
Weekend PM Peak Hour (Saturday Mid-Day Peak Hour)Existing turning movement volumes
Legend:
175 (65)715 (35)190 (35)
145 (120)115 (40)145 (155)
15 (60)0 (0)15 (90)
5 (5)0 (0)
25 (5)
20 (25)10 (15)
Samuel Metal Processing
MainwayMainway
Storage Spot/A&W
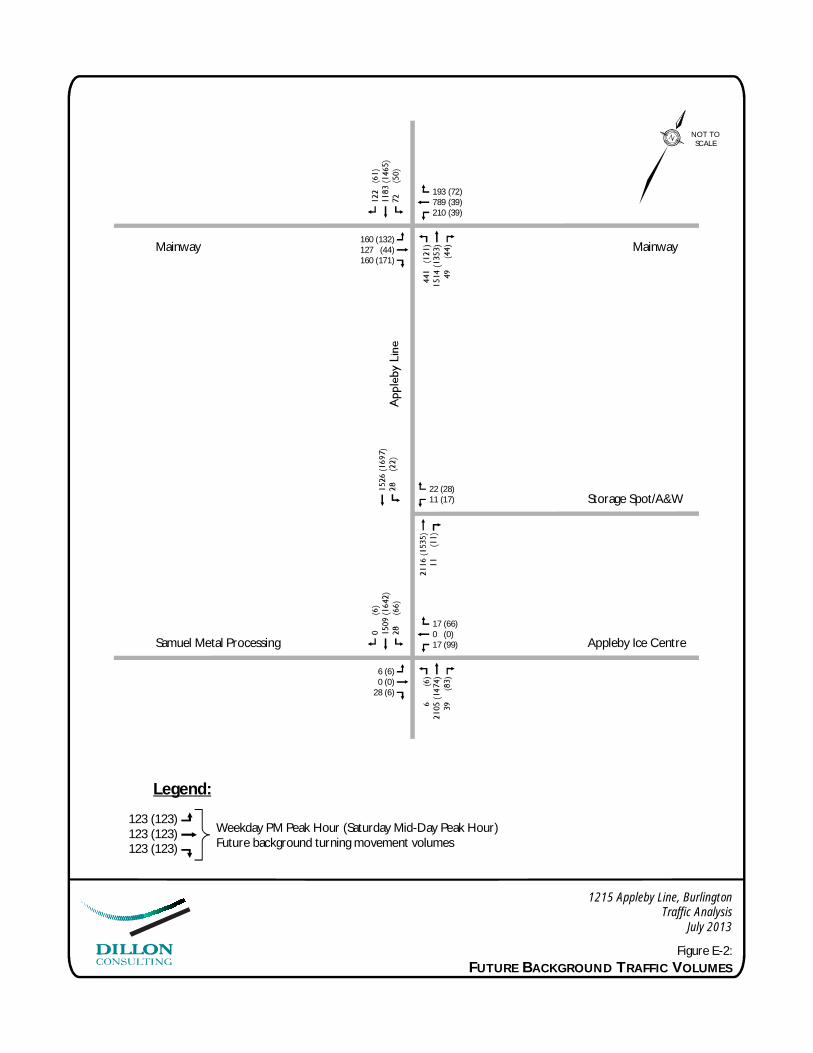
1215 Appleby Line, BurlingtonTraffic Analysis
July 2013
Figure E-2:UTURE ACKGROUND RAFFIC OLUMESF B T V
NOT TOSCALE
Appleby Ice Centre
123 (123)123 (123)123 (123)
Weekday PM Peak Hour (Saturday Mid-Day Peak Hour)Future background turning movement volumes
Legend:
193 (72)789 (39)210 (39)
160 (132)127 (44)160 (171)
17 (66)0 (0)17 (99)
6 (6)0 (0)
28 (6)
22 (28)11 (17)
Samuel Metal Processing
MainwayMainway
Storage Spot/A&W

1215 Appleby Line, BurlingtonTraffic Analysis
July 2013
Figure E-3:ITE RAFFIC OLUMESS T V
NOT TOSCALE
Appleby Ice Centre
123 (123)123 (123)123 (123)
Weekend PM Peak Hour (Saturday Mid-Day Peak Hour)Site traffic turning movement volumes
Legend:
0 (0)0 (0)0 (0)
0 (0)0 (0)
13 (25)
0 (0)0 (0)0 (0)
0 (0)0 (0)0 (0)
0 (0)0 (0)
Samuel Metal Processing
MainwayMainway
Storage Spot/A&W
104 (185) 1215 Appleby
0 (0)0 (0)36 (80)
0 (0)0 (0)0 (0)
0 (0)0 (0)
68 (80)
With Diversion of Westbound LeftTurn Exiting Traffic
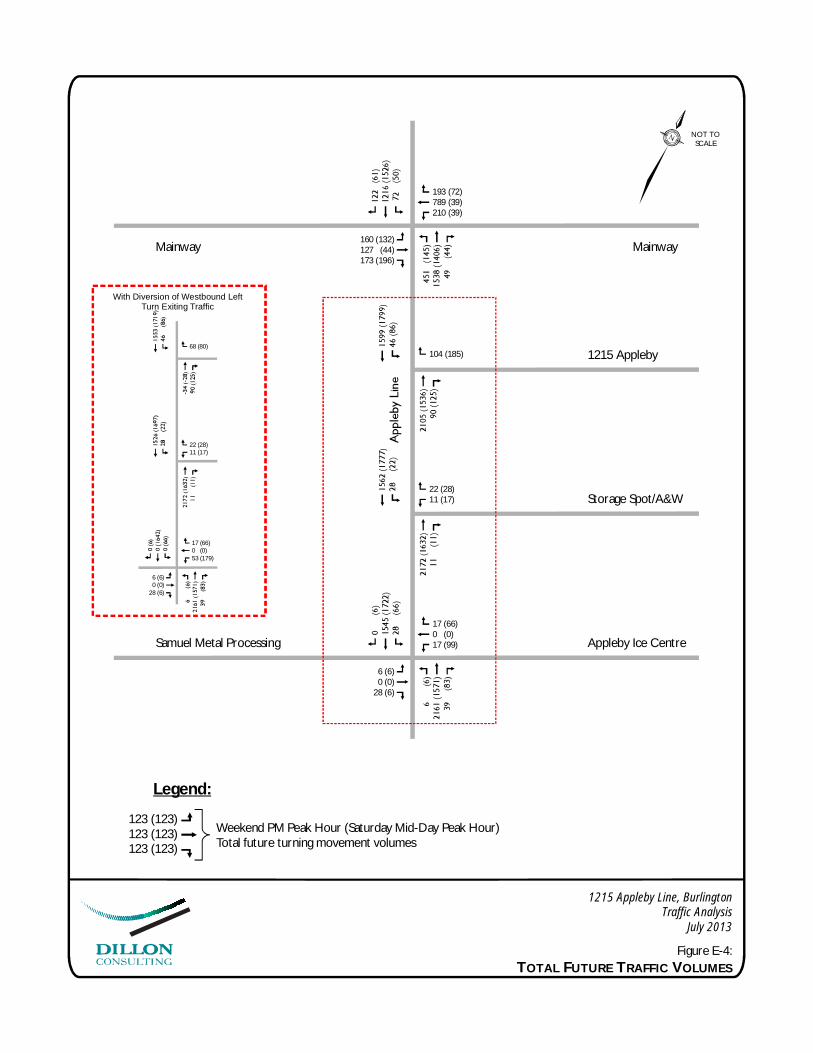
1215 Appleby Line, BurlingtonTraffic Analysis
July 2013
Figure E-4:OTAL UTURE RAFFIC OLUMEST F T V
NOT TOSCALE
Appleby Ice Centre
123 (123)123 (123)123 (123)
Weekend PM Peak Hour (Saturday Mid-Day Peak Hour)Total future turning movement volumes
Legend:
193 (72)789 (39)210 (39)
160 (132)127 (44)173 (196)
17 (66)0 (0)17 (99)
6 (6)0 (0)
28 (6)
22 (28)11 (17)
Samuel Metal Processing
MainwayMainway
Storage Spot/A&W
104 (185) 1215 Appleby
17 (66)0 (0)53 (179)
6 (6)0 (0)
28 (6)
22 (28)11 (17)
68 (80)
With Diversion of Westbound LeftTurn Exiting Traffic

Appendix ADevelopment Concept Site Plan
ETraffic Figures
FSynchro Worksheets

Lanes, Volumes, Timings PM Peak Hour3: Mainway & Appleby Line Existing Traffic
Synchro 6 ReportDillon Consulting Limited
Lane Group EBL EBT EBR WBL WBT WBR NBL NBT NBR SBL SBT SBRLane ConfigurationsIdeal Flow (vphpl) 1900 1900 1900 1900 1900 1900 1900 1900 1900 1900 1900 1900Lane Width (m) 3.0 3.3 3.3 3.0 3.3 3.3 3.3 3.3 3.3 3.3 3.3 3.3Storage Length (m) 50.0 0.0 65.0 0.0 90.0 0.0 45.0 0.0Storage Lanes 1 0 1 0 1 0 1 0Total Lost Time (s) 4.0 4.0 4.0 4.0 4.0 4.0 4.0 4.0 4.0 4.0 4.0 4.0Leading Detector (m) 15.2 15.2 15.2 15.2 15.2 15.2 15.2 15.2Trailing Detector (m) 0.0 0.0 0.0 0.0 0.0 0.0 0.0 0.0Turning Speed (k/h) 24 14 24 14 24 14 24 14Lane Util. Factor 1.00 0.95 0.95 1.00 0.95 0.95 1.00 0.95 0.95 1.00 0.95 0.95Frt 0.916 0.970 0.995 0.985Flt Protected 0.950 0.950 0.950 0.950Satd. Flow (prot) 1636 2936 0 1604 3280 0 1728 3293 0 1662 3321 0Flt Permitted 0.108 0.450 0.071 0.077Satd. Flow (perm) 186 2936 0 760 3280 0 129 3293 0 135 3321 0Right Turn on Red Yes Yes Yes YesSatd. Flow (RTOR) 163 22 3 9Headway Factor 1.09 1.04 1.04 1.09 1.04 1.04 1.04 1.04 1.04 1.04 1.04 1.04Link Speed (k/h) 60 60 60 60Link Distance (m) 253.6 343.3 198.4 116.9Travel Time (s) 15.2 20.6 11.9 7.0Volume (vph) 145 115 145 190 715 175 400 1315 45 65 1020 110Peak Hour Factor 0.89 0.89 0.89 0.89 0.89 0.89 0.89 0.89 0.89 0.89 0.89 0.89Heavy Vehicles (%) 3% 10% 8% 5% 3% 4% 1% 5% 18% 5% 3% 8%Adj. Flow (vph) 163 129 163 213 803 197 449 1478 51 73 1146 124Lane Group Flow (vph) 163 292 0 213 1000 0 449 1529 0 73 1270 0Turn Type pm+pt pm+pt pm+pt pm+ptProtected Phases 7 4 3 8 5 2 1 6Permitted Phases 4 8 2 6Detector Phases 7 4 3 8 5 2 1 6Minimum Initial (s) 7.0 8.0 7.0 8.0 7.0 8.0 7.0 8.0Minimum Split (s) 11.0 33.0 11.0 33.0 11.0 29.0 11.0 29.0Total Split (s) 12.0 41.0 0.0 15.0 44.0 0.0 28.0 73.0 0.0 11.0 56.0 0.0Total Split (%) 8.6% 29.3% 0.0% 10.7% 31.4% 0.0% 20.0% 52.1% 0.0% 7.9% 40.0% 0.0%Maximum Green (s) 8.0 34.0 11.0 37.0 24.0 66.0 7.0 49.0Yellow Time (s) 3.0 4.0 3.0 4.0 3.0 4.0 3.0 4.0All-Red Time (s) 1.0 3.0 1.0 3.0 1.0 3.0 1.0 3.0Lead/Lag Lead Lag Lead Lag Lead Lag Lead LagLead-Lag Optimize? Yes Yes Yes Yes Yes Yes Yes YesVehicle Extension (s) 3.0 3.0 3.0 3.0 3.0 3.0 3.0 3.0Recall Mode None None None None None C-Max None C-MaxWalk Time (s) 7.0 7.0 7.0 7.0Flash Dont Walk (s) 17.0 17.0 15.0 15.0Pedestrian Calls (#/hr) 0 0 0 0Act Effct Green (s) 45.0 37.0 51.0 40.0 80.0 71.2 59.0 52.0Actuated g/C Ratio 0.32 0.26 0.36 0.29 0.57 0.51 0.42 0.37v/c Ratio 1.14 0.33 0.62 1.05 1.29 0.91 0.55 1.03Control Delay 150.9 18.8 41.9 89.8 180.7 35.2 37.7 74.9Queue Delay 0.0 0.0 0.0 0.0 0.0 0.0 0.0 0.0
Lanes, Volumes, Timings PM Peak Hour3: Mainway & Appleby Line Existing Traffic
Synchro 6 ReportDillon Consulting Limited
Lane Group EBL EBT EBR WBL WBT WBR NBL NBT NBR SBL SBT SBRTotal Delay 150.9 18.8 41.9 89.8 180.7 35.2 37.7 74.9LOS F B D F F D D EApproach Delay 66.1 81.4 68.2 72.9Approach LOS E F E E
Intersection SummaryArea Type: OtherCycle Length: 140Actuated Cycle Length: 140Offset: 85 (61%), Referenced to phase 2:NBTL and 6:SBTL, Start of YellowNatural Cycle: 135Control Type: Actuated-CoordinatedMaximum v/c Ratio: 1.29Intersection Signal Delay: 72.5 Intersection LOS: EIntersection Capacity Utilization 100.6% ICU Level of Service GAnalysis Period (min) 15
Splits and Phases: 3: Mainway & Appleby Line

HCM Signalized Intersection Capacity Analysis PM Peak Hour3: Mainway & Appleby Line Existing Traffic
Synchro 6 ReportDillon Consulting Limited
Movement EBL EBT EBR WBL WBT WBR NBL NBT NBR SBL SBT SBRLane ConfigurationsIdeal Flow (vphpl) 1900 1900 1900 1900 1900 1900 1900 1900 1900 1900 1900 1900Lane Width 3.0 3.3 3.3 3.0 3.3 3.3 3.3 3.3 3.3 3.3 3.3 3.3Total Lost time (s) 4.0 4.0 4.0 4.0 4.0 4.0 4.0 4.0Lane Util. Factor 1.00 0.95 1.00 0.95 1.00 0.95 1.00 0.95Frt 1.00 0.92 1.00 0.97 1.00 0.99 1.00 0.99Flt Protected 0.95 1.00 0.95 1.00 0.95 1.00 0.95 1.00Satd. Flow (prot) 1636 2937 1604 3282 1728 3293 1662 3323Flt Permitted 0.11 1.00 0.45 1.00 0.07 1.00 0.08 1.00Satd. Flow (perm) 186 2937 760 3282 130 3293 135 3323Volume (vph) 145 115 145 190 715 175 400 1315 45 65 1020 110Peak-hour factor, PHF 0.89 0.89 0.89 0.89 0.89 0.89 0.89 0.89 0.89 0.89 0.89 0.89Adj. Flow (vph) 163 129 163 213 803 197 449 1478 51 73 1146 124RTOR Reduction (vph) 0 120 0 0 16 0 0 1 0 0 6 0Lane Group Flow (vph) 163 172 0 213 984 0 449 1528 0 73 1264 0Heavy Vehicles (%) 3% 10% 8% 5% 3% 4% 1% 5% 18% 5% 3% 8%Turn Type pm+pt pm+pt pm+pt pm+ptProtected Phases 7 4 3 8 5 2 1 6Permitted Phases 4 8 2 6Actuated Green, G (s) 42.0 34.0 48.0 37.0 77.0 67.4 54.6 49.0Effective Green, g (s) 45.0 37.0 51.0 40.0 80.0 70.4 57.6 52.0Actuated g/C Ratio 0.32 0.26 0.36 0.29 0.57 0.50 0.41 0.37Clearance Time (s) 4.0 7.0 4.0 7.0 4.0 7.0 4.0 7.0Vehicle Extension (s) 3.0 3.0 3.0 3.0 3.0 3.0 3.0 3.0Lane Grp Cap (vph) 143 776 343 938 348 1656 117 1234v/s Ratio Prot c0.07 0.06 c0.05 0.30 c0.22 0.46 0.03 0.38v/s Ratio Perm c0.30 0.18 c0.52 0.23v/c Ratio 1.14 0.22 0.62 1.05 1.29 0.92 0.62 1.02Uniform Delay, d1 42.7 40.2 34.4 50.0 46.9 32.3 30.4 44.0Progression Factor 1.00 1.00 1.00 1.00 0.90 0.85 1.00 1.00Incremental Delay, d2 117.8 0.1 3.5 43.2 146.9 8.3 9.9 32.0Delay (s) 160.5 40.4 37.9 93.2 189.2 35.7 40.4 76.0Level of Service F D D F F D D EApproach Delay (s) 83.4 83.5 70.5 74.1Approach LOS F F E E
Intersection SummaryHCM Average Control Delay 75.8 HCM Level of Service EHCM Volume to Capacity ratio 1.24Actuated Cycle Length (s) 140.0 Sum of lost time (s) 16.0Intersection Capacity Utilization 100.6% ICU Level of Service GAnalysis Period (min) 15c Critical Lane Group
Lanes, Volumes, Timings PM Peak Hour6: IcePlex & Appleby Line Existing Traffic
Synchro 6 ReportDillon Consulting Limited
Lane Group EBL EBT EBR WBL WBT WBR NBL NBT NBR SBL SBT SBRLane ConfigurationsIdeal Flow (vphpl) 1900 1900 1900 1900 1900 1900 1900 1900 1900 1900 1900 1900Storage Length (m) 0.0 0.0 0.0 0.0 30.0 0.0 30.0 0.0Storage Lanes 0 0 0 0 1 0 1 0Total Lost Time (s) 4.0 4.0 4.0 4.0 4.0 4.0 4.0 4.0 4.0 4.0 4.0 4.0Leading Detector (m) 15.2 15.2 15.2 15.2 15.2 15.2 15.2 15.2Trailing Detector (m) 0.0 0.0 0.0 0.0 0.0 0.0 0.0 0.0Turning Speed (k/h) 24 14 24 14 24 14 24 14Lane Util. Factor 1.00 1.00 1.00 1.00 1.00 1.00 1.00 0.95 0.95 1.00 0.95 0.95Frt 0.887 0.932 0.997Flt Protected 0.992 0.976 0.950 0.950Satd. Flow (prot) 0 1524 0 0 1748 0 1304 3535 0 1825 3510 0Flt Permitted 0.971 0.889 0.170 0.044Satd. Flow (perm) 0 1492 0 0 1592 0 233 3535 0 85 3510 0Right Turn on Red Yes Yes Yes YesSatd. Flow (RTOR) 26 16 2Headway Factor 0.99 0.99 0.99 0.99 0.99 0.99 0.99 0.99 0.99 0.99 0.99 0.99Link Speed (k/h) 25 25 60 60Link Distance (m) 111.2 81.8 173.7 63.0Travel Time (s) 16.0 11.8 10.4 3.8Volume (vph) 5 0 25 15 0 15 5 1850 35 25 1315 0Peak Hour Factor 0.96 0.96 0.96 0.96 0.96 0.96 0.96 0.96 0.96 0.96 0.96 0.96Heavy Vehicles (%) 0% 0% 13% 0% 0% 0% 40% 3% 0% 0% 4% 0%Adj. Flow (vph) 5 0 26 16 0 16 5 1927 36 26 1370 0Lane Group Flow (vph) 0 31 0 0 32 0 5 1963 0 26 1370 0Turn Type Perm Perm Perm pm+ptProtected Phases 4 8 2 1 6Permitted Phases 4 8 2 6Detector Phases 4 4 8 8 2 2 1 6Minimum Initial (s) 8.0 8.0 8.0 8.0 8.0 8.0 7.0 8.0Minimum Split (s) 29.0 29.0 29.0 29.0 29.0 29.0 11.0 29.0Total Split (s) 38.0 38.0 0.0 38.0 38.0 0.0 90.0 90.0 0.0 12.0 102.0 0.0Total Split (%) 27.1% 27.1% 0.0% 27.1% 27.1% 0.0% 64.3% 64.3% 0.0% 8.6% 72.9% 0.0%Maximum Green (s) 31.0 31.0 31.0 31.0 83.0 83.0 8.0 95.0Yellow Time (s) 4.0 4.0 4.0 4.0 4.0 4.0 3.0 4.0All-Red Time (s) 3.0 3.0 3.0 3.0 3.0 3.0 1.0 3.0Lead/Lag Lag Lag LeadLead-Lag Optimize? Yes Yes YesVehicle Extension (s) 3.0 3.0 3.0 3.0 3.0 3.0 3.0 3.0Recall Mode None None None None C-Max C-Max None C-MaxWalk Time (s) 7.0 7.0 7.0 7.0 7.0 7.0 7.0Flash Dont Walk (s) 15.0 15.0 15.0 15.0 12.0 12.0 12.0Pedestrian Calls (#/hr) 0 0 0 0 0 0 0Act Effct Green (s) 11.3 11.3 121.6 121.6 126.7 128.3Actuated g/C Ratio 0.08 0.08 0.87 0.87 0.90 0.92v/c Ratio 0.21 0.22 0.02 0.64 0.16 0.43Control Delay 28.0 40.3 3.8 6.4 4.7 6.6Queue Delay 0.0 0.0 0.0 0.0 0.0 0.0Total Delay 28.0 40.3 3.8 6.4 4.7 6.6
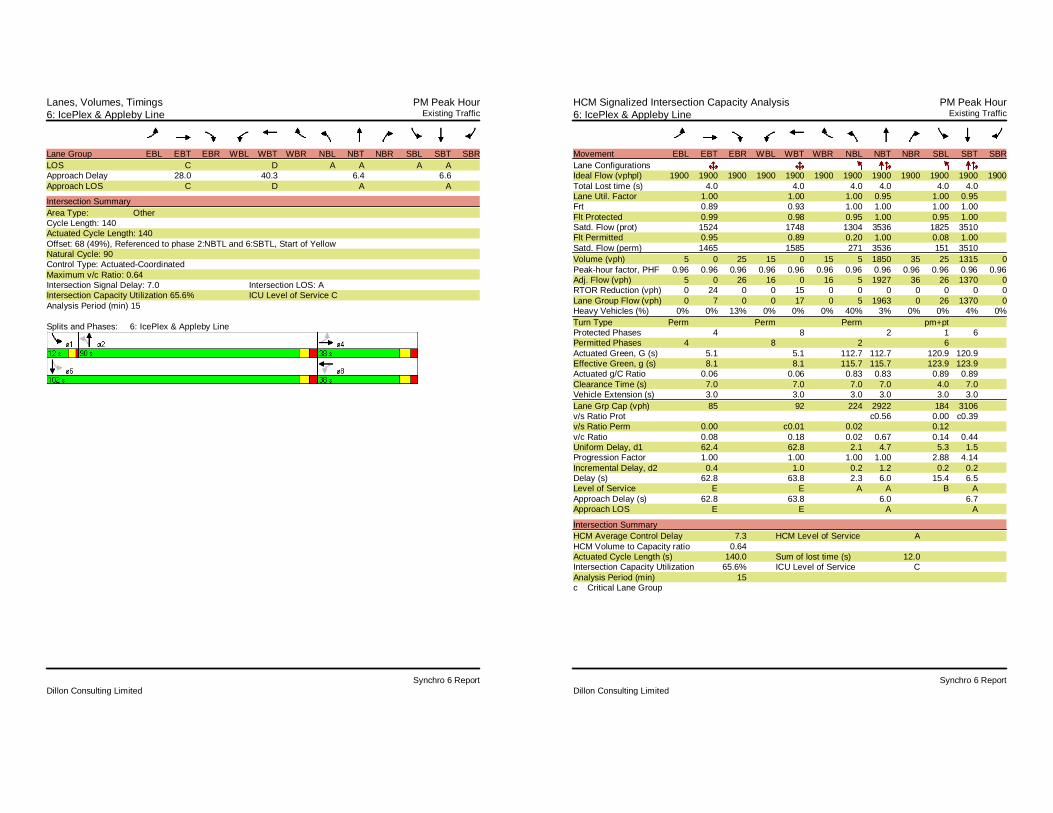
Lanes, Volumes, Timings PM Peak Hour6: IcePlex & Appleby Line Existing Traffic
Synchro 6 ReportDillon Consulting Limited
Lane Group EBL EBT EBR WBL WBT WBR NBL NBT NBR SBL SBT SBRLOS C D A A A AApproach Delay 28.0 40.3 6.4 6.6Approach LOS C D A A
Intersection SummaryArea Type: OtherCycle Length: 140Actuated Cycle Length: 140Offset: 68 (49%), Referenced to phase 2:NBTL and 6:SBTL, Start of YellowNatural Cycle: 90Control Type: Actuated-CoordinatedMaximum v/c Ratio: 0.64Intersection Signal Delay: 7.0 Intersection LOS: AIntersection Capacity Utilization 65.6% ICU Level of Service CAnalysis Period (min) 15
Splits and Phases: 6: IcePlex & Appleby Line
HCM Signalized Intersection Capacity Analysis PM Peak Hour6: IcePlex & Appleby Line Existing Traffic
Synchro 6 ReportDillon Consulting Limited
Movement EBL EBT EBR WBL WBT WBR NBL NBT NBR SBL SBT SBRLane ConfigurationsIdeal Flow (vphpl) 1900 1900 1900 1900 1900 1900 1900 1900 1900 1900 1900 1900Total Lost time (s) 4.0 4.0 4.0 4.0 4.0 4.0Lane Util. Factor 1.00 1.00 1.00 0.95 1.00 0.95Frt 0.89 0.93 1.00 1.00 1.00 1.00Flt Protected 0.99 0.98 0.95 1.00 0.95 1.00Satd. Flow (prot) 1524 1748 1304 3536 1825 3510Flt Permitted 0.95 0.89 0.20 1.00 0.08 1.00Satd. Flow (perm) 1465 1585 271 3536 151 3510Volume (vph) 5 0 25 15 0 15 5 1850 35 25 1315 0Peak-hour factor, PHF 0.96 0.96 0.96 0.96 0.96 0.96 0.96 0.96 0.96 0.96 0.96 0.96Adj. Flow (vph) 5 0 26 16 0 16 5 1927 36 26 1370 0RTOR Reduction (vph) 0 24 0 0 15 0 0 0 0 0 0 0Lane Group Flow (vph) 0 7 0 0 17 0 5 1963 0 26 1370 0Heavy Vehicles (%) 0% 0% 13% 0% 0% 0% 40% 3% 0% 0% 4% 0%Turn Type Perm Perm Perm pm+ptProtected Phases 4 8 2 1 6Permitted Phases 4 8 2 6Actuated Green, G (s) 5.1 5.1 112.7 112.7 120.9 120.9Effective Green, g (s) 8.1 8.1 115.7 115.7 123.9 123.9Actuated g/C Ratio 0.06 0.06 0.83 0.83 0.89 0.89Clearance Time (s) 7.0 7.0 7.0 7.0 4.0 7.0Vehicle Extension (s) 3.0 3.0 3.0 3.0 3.0 3.0Lane Grp Cap (vph) 85 92 224 2922 184 3106v/s Ratio Prot c0.56 0.00 c0.39v/s Ratio Perm 0.00 c0.01 0.02 0.12v/c Ratio 0.08 0.18 0.02 0.67 0.14 0.44Uniform Delay, d1 62.4 62.8 2.1 4.7 5.3 1.5Progression Factor 1.00 1.00 1.00 1.00 2.88 4.14Incremental Delay, d2 0.4 1.0 0.2 1.2 0.2 0.2Delay (s) 62.8 63.8 2.3 6.0 15.4 6.5Level of Service E E A A B AApproach Delay (s) 62.8 63.8 6.0 6.7Approach LOS E E A A
Intersection SummaryHCM Average Control Delay 7.3 HCM Level of Service AHCM Volume to Capacity ratio 0.64Actuated Cycle Length (s) 140.0 Sum of lost time (s) 12.0Intersection Capacity Utilization 65.6% ICU Level of Service CAnalysis Period (min) 15c Critical Lane Group
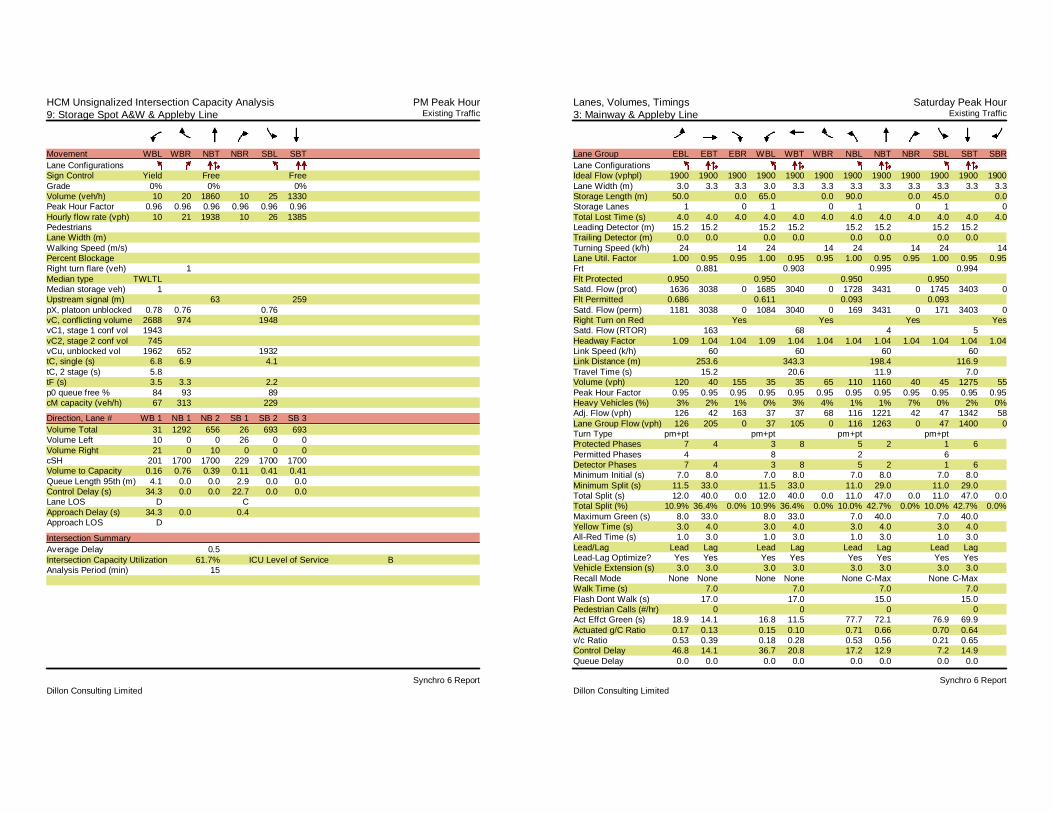
HCM Unsignalized Intersection Capacity Analysis PM Peak Hour9: Storage Spot A&W & Appleby Line Existing Traffic
Synchro 6 ReportDillon Consulting Limited
Movement WBL WBR NBT NBR SBL SBTLane ConfigurationsSign Control Yield Free FreeGrade 0% 0% 0%Volume (veh/h) 10 20 1860 10 25 1330Peak Hour Factor 0.96 0.96 0.96 0.96 0.96 0.96Hourly flow rate (vph) 10 21 1938 10 26 1385PedestriansLane Width (m)Walking Speed (m/s)Percent BlockageRight turn flare (veh) 1Median type TWLTLMedian storage veh) 1Upstream signal (m) 63 259pX, platoon unblocked 0.78 0.76 0.76vC, conflicting volume 2688 974 1948vC1, stage 1 conf vol 1943vC2, stage 2 conf vol 745vCu, unblocked vol 1962 652 1932tC, single (s) 6.8 6.9 4.1tC, 2 stage (s) 5.8tF (s) 3.5 3.3 2.2p0 queue free % 84 93 89cM capacity (veh/h) 67 313 229
Direction, Lane # WB 1 NB 1 NB 2 SB 1 SB 2 SB 3Volume Total 31 1292 656 26 693 693Volume Left 10 0 0 26 0 0Volume Right 21 0 10 0 0 0cSH 201 1700 1700 229 1700 1700Volume to Capacity 0.16 0.76 0.39 0.11 0.41 0.41Queue Length 95th (m) 4.1 0.0 0.0 2.9 0.0 0.0Control Delay (s) 34.3 0.0 0.0 22.7 0.0 0.0Lane LOS D CApproach Delay (s) 34.3 0.0 0.4Approach LOS D
Intersection SummaryAverage Delay 0.5Intersection Capacity Utilization 61.7% ICU Level of Service BAnalysis Period (min) 15
Lanes, Volumes, Timings Saturday Peak Hour3: Mainway & Appleby Line Existing Traffic
Synchro 6 ReportDillon Consulting Limited
Lane Group EBL EBT EBR WBL WBT WBR NBL NBT NBR SBL SBT SBRLane ConfigurationsIdeal Flow (vphpl) 1900 1900 1900 1900 1900 1900 1900 1900 1900 1900 1900 1900Lane Width (m) 3.0 3.3 3.3 3.0 3.3 3.3 3.3 3.3 3.3 3.3 3.3 3.3Storage Length (m) 50.0 0.0 65.0 0.0 90.0 0.0 45.0 0.0Storage Lanes 1 0 1 0 1 0 1 0Total Lost Time (s) 4.0 4.0 4.0 4.0 4.0 4.0 4.0 4.0 4.0 4.0 4.0 4.0Leading Detector (m) 15.2 15.2 15.2 15.2 15.2 15.2 15.2 15.2Trailing Detector (m) 0.0 0.0 0.0 0.0 0.0 0.0 0.0 0.0Turning Speed (k/h) 24 14 24 14 24 14 24 14Lane Util. Factor 1.00 0.95 0.95 1.00 0.95 0.95 1.00 0.95 0.95 1.00 0.95 0.95Frt 0.881 0.903 0.995 0.994Flt Protected 0.950 0.950 0.950 0.950Satd. Flow (prot) 1636 3038 0 1685 3040 0 1728 3431 0 1745 3403 0Flt Permitted 0.686 0.611 0.093 0.093Satd. Flow (perm) 1181 3038 0 1084 3040 0 169 3431 0 171 3403 0Right Turn on Red Yes Yes Yes YesSatd. Flow (RTOR) 163 68 4 5Headway Factor 1.09 1.04 1.04 1.09 1.04 1.04 1.04 1.04 1.04 1.04 1.04 1.04Link Speed (k/h) 60 60 60 60Link Distance (m) 253.6 343.3 198.4 116.9Travel Time (s) 15.2 20.6 11.9 7.0Volume (vph) 120 40 155 35 35 65 110 1160 40 45 1275 55Peak Hour Factor 0.95 0.95 0.95 0.95 0.95 0.95 0.95 0.95 0.95 0.95 0.95 0.95Heavy Vehicles (%) 3% 2% 1% 0% 3% 4% 1% 1% 7% 0% 2% 0%Adj. Flow (vph) 126 42 163 37 37 68 116 1221 42 47 1342 58Lane Group Flow (vph) 126 205 0 37 105 0 116 1263 0 47 1400 0Turn Type pm+pt pm+pt pm+pt pm+ptProtected Phases 7 4 3 8 5 2 1 6Permitted Phases 4 8 2 6Detector Phases 7 4 3 8 5 2 1 6Minimum Initial (s) 7.0 8.0 7.0 8.0 7.0 8.0 7.0 8.0Minimum Split (s) 11.5 33.0 11.5 33.0 11.0 29.0 11.0 29.0Total Split (s) 12.0 40.0 0.0 12.0 40.0 0.0 11.0 47.0 0.0 11.0 47.0 0.0Total Split (%) 10.9% 36.4% 0.0% 10.9% 36.4% 0.0% 10.0% 42.7% 0.0% 10.0% 42.7% 0.0%Maximum Green (s) 8.0 33.0 8.0 33.0 7.0 40.0 7.0 40.0Yellow Time (s) 3.0 4.0 3.0 4.0 3.0 4.0 3.0 4.0All-Red Time (s) 1.0 3.0 1.0 3.0 1.0 3.0 1.0 3.0Lead/Lag Lead Lag Lead Lag Lead Lag Lead LagLead-Lag Optimize? Yes Yes Yes Yes Yes Yes Yes YesVehicle Extension (s) 3.0 3.0 3.0 3.0 3.0 3.0 3.0 3.0Recall Mode None None None None None C-Max None C-MaxWalk Time (s) 7.0 7.0 7.0 7.0Flash Dont Walk (s) 17.0 17.0 15.0 15.0Pedestrian Calls (#/hr) 0 0 0 0Act Effct Green (s) 18.9 14.1 16.8 11.5 77.7 72.1 76.9 69.9Actuated g/C Ratio 0.17 0.13 0.15 0.10 0.71 0.66 0.70 0.64v/c Ratio 0.53 0.39 0.18 0.28 0.53 0.56 0.21 0.65Control Delay 46.8 14.1 36.7 20.8 17.2 12.9 7.2 14.9Queue Delay 0.0 0.0 0.0 0.0 0.0 0.0 0.0 0.0
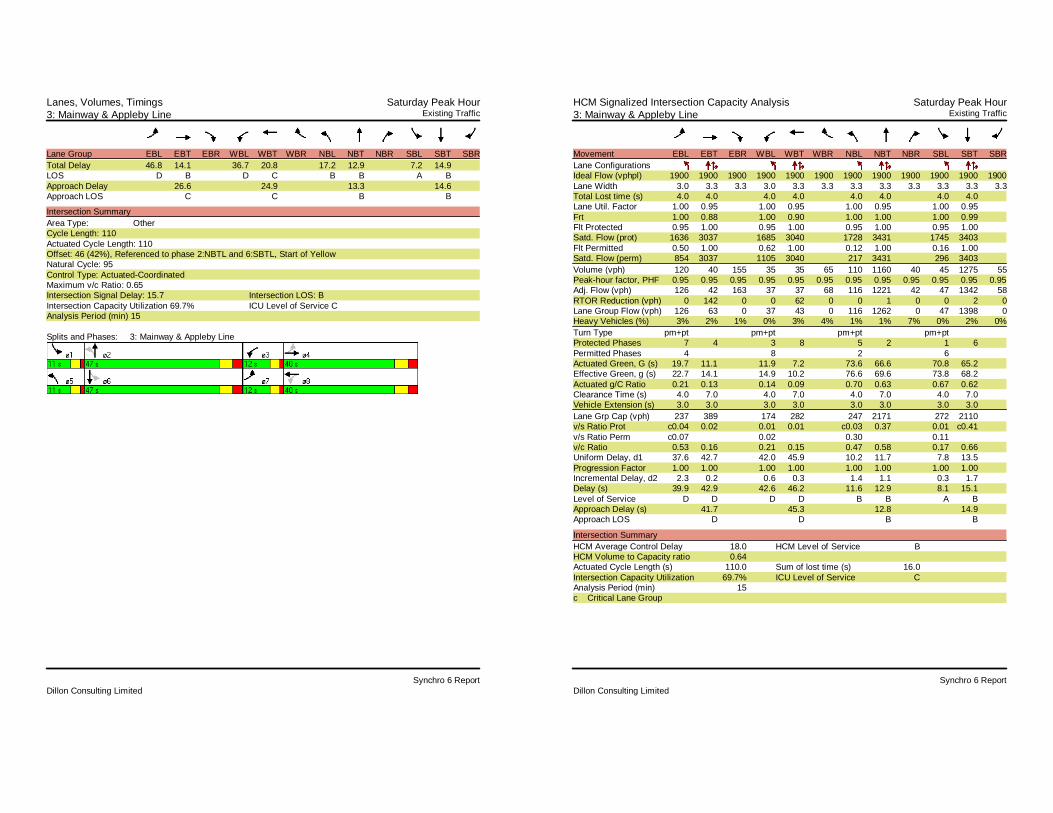
Lanes, Volumes, Timings Saturday Peak Hour3: Mainway & Appleby Line Existing Traffic
Synchro 6 ReportDillon Consulting Limited
Lane Group EBL EBT EBR WBL WBT WBR NBL NBT NBR SBL SBT SBRTotal Delay 46.8 14.1 36.7 20.8 17.2 12.9 7.2 14.9LOS D B D C B B A BApproach Delay 26.6 24.9 13.3 14.6Approach LOS C C B B
Intersection SummaryArea Type: OtherCycle Length: 110Actuated Cycle Length: 110Offset: 46 (42%), Referenced to phase 2:NBTL and 6:SBTL, Start of YellowNatural Cycle: 95Control Type: Actuated-CoordinatedMaximum v/c Ratio: 0.65Intersection Signal Delay: 15.7 Intersection LOS: BIntersection Capacity Utilization 69.7% ICU Level of Service CAnalysis Period (min) 15
Splits and Phases: 3: Mainway & Appleby Line
HCM Signalized Intersection Capacity Analysis Saturday Peak Hour3: Mainway & Appleby Line Existing Traffic
Synchro 6 ReportDillon Consulting Limited
Movement EBL EBT EBR WBL WBT WBR NBL NBT NBR SBL SBT SBRLane ConfigurationsIdeal Flow (vphpl) 1900 1900 1900 1900 1900 1900 1900 1900 1900 1900 1900 1900Lane Width 3.0 3.3 3.3 3.0 3.3 3.3 3.3 3.3 3.3 3.3 3.3 3.3Total Lost time (s) 4.0 4.0 4.0 4.0 4.0 4.0 4.0 4.0Lane Util. Factor 1.00 0.95 1.00 0.95 1.00 0.95 1.00 0.95Frt 1.00 0.88 1.00 0.90 1.00 1.00 1.00 0.99Flt Protected 0.95 1.00 0.95 1.00 0.95 1.00 0.95 1.00Satd. Flow (prot) 1636 3037 1685 3040 1728 3431 1745 3403Flt Permitted 0.50 1.00 0.62 1.00 0.12 1.00 0.16 1.00Satd. Flow (perm) 854 3037 1105 3040 217 3431 296 3403Volume (vph) 120 40 155 35 35 65 110 1160 40 45 1275 55Peak-hour factor, PHF 0.95 0.95 0.95 0.95 0.95 0.95 0.95 0.95 0.95 0.95 0.95 0.95Adj. Flow (vph) 126 42 163 37 37 68 116 1221 42 47 1342 58RTOR Reduction (vph) 0 142 0 0 62 0 0 1 0 0 2 0Lane Group Flow (vph) 126 63 0 37 43 0 116 1262 0 47 1398 0Heavy Vehicles (%) 3% 2% 1% 0% 3% 4% 1% 1% 7% 0% 2% 0%Turn Type pm+pt pm+pt pm+pt pm+ptProtected Phases 7 4 3 8 5 2 1 6Permitted Phases 4 8 2 6Actuated Green, G (s) 19.7 11.1 11.9 7.2 73.6 66.6 70.8 65.2Effective Green, g (s) 22.7 14.1 14.9 10.2 76.6 69.6 73.8 68.2Actuated g/C Ratio 0.21 0.13 0.14 0.09 0.70 0.63 0.67 0.62Clearance Time (s) 4.0 7.0 4.0 7.0 4.0 7.0 4.0 7.0Vehicle Extension (s) 3.0 3.0 3.0 3.0 3.0 3.0 3.0 3.0Lane Grp Cap (vph) 237 389 174 282 247 2171 272 2110v/s Ratio Prot c0.04 0.02 0.01 0.01 c0.03 0.37 0.01 c0.41v/s Ratio Perm c0.07 0.02 0.30 0.11v/c Ratio 0.53 0.16 0.21 0.15 0.47 0.58 0.17 0.66Uniform Delay, d1 37.6 42.7 42.0 45.9 10.2 11.7 7.8 13.5Progression Factor 1.00 1.00 1.00 1.00 1.00 1.00 1.00 1.00Incremental Delay, d2 2.3 0.2 0.6 0.3 1.4 1.1 0.3 1.7Delay (s) 39.9 42.9 42.6 46.2 11.6 12.9 8.1 15.1Level of Service D D D D B B A BApproach Delay (s) 41.7 45.3 12.8 14.9Approach LOS D D B B
Intersection SummaryHCM Average Control Delay 18.0 HCM Level of Service BHCM Volume to Capacity ratio 0.64Actuated Cycle Length (s) 110.0 Sum of lost time (s) 16.0Intersection Capacity Utilization 69.7% ICU Level of Service CAnalysis Period (min) 15c Critical Lane Group

Lanes, Volumes, Timings Saturday Peak Hour6: IcePlex & Appleby Line Existing Traffic
Synchro 6 ReportDillon Consulting Limited
Lane Group EBL EBT EBR WBL WBT WBR NBL NBT NBR SBL SBT SBRLane ConfigurationsIdeal Flow (vphpl) 1900 1900 1900 1900 1900 1900 1900 1900 1900 1900 1900 1900Storage Length (m) 0.0 0.0 0.0 0.0 30.0 0.0 30.0 0.0Storage Lanes 0 0 0 0 1 0 1 0Total Lost Time (s) 4.0 4.0 4.0 4.0 4.0 4.0 4.0 4.0 4.0 4.0 4.0 4.0Leading Detector (m) 15.2 15.2 15.2 15.2 15.2 15.2 15.2 15.2Trailing Detector (m) 0.0 0.0 0.0 0.0 0.0 0.0 0.0 0.0Turning Speed (k/h) 24 14 24 14 24 14 24 14Lane Util. Factor 1.00 1.00 1.00 1.00 1.00 1.00 1.00 0.95 0.95 1.00 0.95 0.95Frt 0.932 0.946 0.992Flt Protected 0.976 0.971 0.950 0.950Satd. Flow (prot) 0 1748 0 0 1765 0 1217 3587 0 1825 3614 0Flt Permitted 0.902 0.821 0.112 0.069Satd. Flow (perm) 0 1615 0 0 1492 0 143 3587 0 133 3614 0Right Turn on Red Yes Yes Yes YesSatd. Flow (RTOR) 5 32 8 1Headway Factor 0.99 0.99 0.99 0.99 0.99 0.99 0.99 0.99 0.99 0.99 0.99 0.99Link Speed (k/h) 25 25 60 60Link Distance (m) 111.2 81.8 173.7 63.0Travel Time (s) 16.0 11.8 10.4 3.8Volume (vph) 5 0 5 90 0 60 5 1270 75 60 1435 5Peak Hour Factor 0.95 0.95 0.95 0.95 0.95 0.95 0.95 0.95 0.95 0.95 0.95 0.95Heavy Vehicles (%) 0% 0% 0% 0% 0% 0% 50% 1% 0% 0% 1% 0%Adj. Flow (vph) 5 0 5 95 0 63 5 1337 79 63 1511 5Lane Group Flow (vph) 0 10 0 0 158 0 5 1416 0 63 1516 0Turn Type Perm Perm Perm pm+ptProtected Phases 4 8 2 1 6Permitted Phases 4 8 2 6Detector Phases 4 4 8 8 2 2 1 6Minimum Initial (s) 8.0 8.0 8.0 8.0 8.0 8.0 7.0 8.0Minimum Split (s) 29.0 29.0 29.0 29.0 29.0 29.0 11.0 29.0Total Split (s) 39.0 39.0 0.0 39.0 39.0 0.0 60.0 60.0 0.0 11.0 71.0 0.0Total Split (%) 35.5% 35.5% 0.0% 35.5% 35.5% 0.0% 54.5% 54.5% 0.0% 10.0% 64.5% 0.0%Maximum Green (s) 32.0 32.0 32.0 32.0 53.0 53.0 7.0 64.0Yellow Time (s) 4.0 4.0 4.0 4.0 4.0 4.0 3.0 4.0All-Red Time (s) 3.0 3.0 3.0 3.0 3.0 3.0 1.0 3.0Lead/Lag Lag Lag LeadLead-Lag Optimize? Yes Yes YesVehicle Extension (s) 3.0 3.0 3.0 3.0 3.0 3.0 3.0 3.0Recall Mode None None None None C-Max C-Max None C-MaxWalk Time (s) 7.0 7.0 7.0 7.0 7.0 7.0 7.0Flash Dont Walk (s) 15.0 15.0 15.0 15.0 12.0 12.0 12.0Pedestrian Calls (#/hr) 0 0 0 0 0 0 0Act Effct Green (s) 17.1 17.1 76.1 76.1 84.9 84.9Actuated g/C Ratio 0.16 0.16 0.69 0.69 0.77 0.77v/c Ratio 0.04 0.61 0.05 0.57 0.30 0.54Control Delay 27.0 43.6 9.4 11.0 7.4 6.4Queue Delay 0.0 0.0 0.0 0.0 0.0 0.0Total Delay 27.0 43.6 9.4 11.0 7.4 6.4
Lanes, Volumes, Timings Saturday Peak Hour6: IcePlex & Appleby Line Existing Traffic
Synchro 6 ReportDillon Consulting Limited
Lane Group EBL EBT EBR WBL WBT WBR NBL NBT NBR SBL SBT SBRLOS C D A B A AApproach Delay 27.0 43.6 11.0 6.4Approach LOS C D B A
Intersection SummaryArea Type: OtherCycle Length: 110Actuated Cycle Length: 110Offset: 15 (14%), Referenced to phase 2:NBTL and 6:SBTL, Start of YellowNatural Cycle: 75Control Type: Actuated-CoordinatedMaximum v/c Ratio: 0.61Intersection Signal Delay: 10.4 Intersection LOS: BIntersection Capacity Utilization 68.1% ICU Level of Service CAnalysis Period (min) 15
Splits and Phases: 6: IcePlex & Appleby Line

HCM Signalized Intersection Capacity Analysis Saturday Peak Hour6: IcePlex & Appleby Line Existing Traffic
Synchro 6 ReportDillon Consulting Limited
Movement EBL EBT EBR WBL WBT WBR NBL NBT NBR SBL SBT SBRLane ConfigurationsIdeal Flow (vphpl) 1900 1900 1900 1900 1900 1900 1900 1900 1900 1900 1900 1900Total Lost time (s) 4.0 4.0 4.0 4.0 4.0 4.0Lane Util. Factor 1.00 1.00 1.00 0.95 1.00 0.95Frt 0.93 0.95 1.00 0.99 1.00 1.00Flt Protected 0.98 0.97 0.95 1.00 0.95 1.00Satd. Flow (prot) 1748 1765 1217 3586 1825 3612Flt Permitted 0.88 0.81 0.16 1.00 0.13 1.00Satd. Flow (perm) 1577 1472 200 3586 251 3612Volume (vph) 5 0 5 90 0 60 5 1270 75 60 1435 5Peak-hour factor, PHF 0.95 0.95 0.95 0.95 0.95 0.95 0.95 0.95 0.95 0.95 0.95 0.95Adj. Flow (vph) 5 0 5 95 0 63 5 1337 79 63 1511 5RTOR Reduction (vph) 0 4 0 0 27 0 0 3 0 0 0 0Lane Group Flow (vph) 0 6 0 0 131 0 5 1413 0 63 1516 0Heavy Vehicles (%) 0% 0% 0% 0% 0% 0% 50% 1% 0% 0% 1% 0%Turn Type Perm Perm Perm pm+ptProtected Phases 4 8 2 1 6Permitted Phases 4 8 2 6Actuated Green, G (s) 14.1 14.1 72.3 72.3 81.9 81.9Effective Green, g (s) 17.1 17.1 75.3 75.3 84.9 84.9Actuated g/C Ratio 0.16 0.16 0.68 0.68 0.77 0.77Clearance Time (s) 7.0 7.0 7.0 7.0 4.0 7.0Vehicle Extension (s) 3.0 3.0 3.0 3.0 3.0 3.0Lane Grp Cap (vph) 245 229 137 2455 274 2788v/s Ratio Prot c0.39 0.01 c0.42v/s Ratio Perm 0.00 c0.09 0.03 0.17v/c Ratio 0.02 0.57 0.04 0.58 0.23 0.54Uniform Delay, d1 39.4 43.1 5.6 9.0 6.3 4.9Progression Factor 1.00 1.00 1.00 1.00 1.00 1.00Incremental Delay, d2 0.0 3.4 0.5 1.0 0.4 0.8Delay (s) 39.4 46.5 6.1 10.0 6.7 5.7Level of Service D D A B A AApproach Delay (s) 39.4 46.5 10.0 5.7Approach LOS D D B A
Intersection SummaryHCM Average Control Delay 9.8 HCM Level of Service AHCM Volume to Capacity ratio 0.58Actuated Cycle Length (s) 110.0 Sum of lost time (s) 12.0Intersection Capacity Utilization 68.1% ICU Level of Service CAnalysis Period (min) 15c Critical Lane Group
HCM Unsignalized Intersection Capacity Analysis Saturday Peak Hour9: Storage Spot A&W & Appleby Line Existing Traffic
Synchro 6 ReportDillon Consulting Limited
Movement WBL WBR NBT NBR SBL SBTLane ConfigurationsSign Control Yield Free FreeGrade 0% 0% 0%Volume (veh/h) 15 25 1325 10 20 1485Peak Hour Factor 0.95 0.95 0.95 0.95 0.95 0.95Hourly flow rate (vph) 16 26 1395 11 21 1563PedestriansLane Width (m)Walking Speed (m/s)Percent BlockageRight turn flare (veh)Median type TWLTLMedian storage veh) 1Upstream signal (m) 63 259pX, platoon unblocked 0.79 0.79 0.79vC, conflicting volume 2224 703 1405vC1, stage 1 conf vol 1400vC2, stage 2 conf vol 824vCu, unblocked vol 2283 360 1248tC, single (s) 6.8 6.9 4.1tC, 2 stage (s) 5.8tF (s) 3.5 3.3 2.2p0 queue free % 87 95 95cM capacity (veh/h) 124 503 438
Direction, Lane # WB 1 WB 2 NB 1 NB 2 SB 1 SB 2 SB 3Volume Total 16 26 930 475 21 782 782Volume Left 16 0 0 0 21 0 0Volume Right 0 26 0 11 0 0 0cSH 124 503 1700 1700 438 1700 1700Volume to Capacity 0.13 0.05 0.55 0.28 0.05 0.46 0.46Queue Length 95th (m) 3.2 1.3 0.0 0.0 1.1 0.0 0.0Control Delay (s) 38.4 12.5 0.0 0.0 13.6 0.0 0.0Lane LOS E B BApproach Delay (s) 22.2 0.0 0.2Approach LOS C
Intersection SummaryAverage Delay 0.4Intersection Capacity Utilization 51.0% ICU Level of Service AAnalysis Period (min) 15

Lanes, Volumes, Timings PM Peak Hour3: Mainway & Appleby Line Future Background Volumes
Synchro 6 ReportDillon Consulting Limited
Lane Group EBL EBT EBR WBL WBT WBR NBL NBT NBR SBL SBT SBRLane ConfigurationsIdeal Flow (vphpl) 1900 1900 1900 1900 1900 1900 1900 1900 1900 1900 1900 1900Lane Width (m) 3.0 3.3 3.3 3.0 3.3 3.3 3.3 3.3 3.3 3.3 3.3 3.3Storage Length (m) 50.0 0.0 65.0 0.0 90.0 0.0 45.0 0.0Storage Lanes 1 0 1 0 1 0 1 0Total Lost Time (s) 4.0 4.0 4.0 4.0 4.0 4.0 4.0 4.0 4.0 4.0 4.0 4.0Leading Detector (m) 15.2 15.2 15.2 15.2 15.2 15.2 15.2 15.2Trailing Detector (m) 0.0 0.0 0.0 0.0 0.0 0.0 0.0 0.0Turning Speed (k/h) 24 14 24 14 24 14 24 14Lane Util. Factor 1.00 0.95 0.95 1.00 0.95 0.95 1.00 0.95 0.95 1.00 0.95 0.95Frt 0.916 0.971 0.995 0.986Flt Protected 0.950 0.950 0.950 0.950Satd. Flow (prot) 1636 2936 0 1604 3284 0 1728 3294 0 1662 3326 0Flt Permitted 0.108 0.421 0.071 0.077Satd. Flow (perm) 186 2936 0 711 3284 0 129 3294 0 135 3326 0Right Turn on Red Yes Yes Yes YesSatd. Flow (RTOR) 180 21 3 9Headway Factor 1.09 1.04 1.04 1.09 1.04 1.04 1.04 1.04 1.04 1.04 1.04 1.04Link Speed (k/h) 60 60 60 60Link Distance (m) 253.6 343.3 198.4 116.9Travel Time (s) 15.2 20.6 11.9 7.0Volume (vph) 160 127 160 210 789 193 441 1514 49 72 1183 122Peak Hour Factor 0.89 0.89 0.89 0.89 0.89 0.89 0.89 0.89 0.89 0.89 0.89 0.89Heavy Vehicles (%) 3% 10% 8% 5% 3% 4% 1% 5% 18% 5% 3% 8%Adj. Flow (vph) 180 143 180 236 887 217 496 1701 55 81 1329 137Lane Group Flow (vph) 180 323 0 236 1104 0 496 1756 0 81 1466 0Turn Type pm+pt pm+pt pm+pt pm+ptProtected Phases 7 4 3 8 5 2 1 6Permitted Phases 4 8 2 6Detector Phases 7 4 3 8 5 2 1 6Minimum Initial (s) 7.0 8.0 7.0 8.0 7.0 8.0 7.0 8.0Minimum Split (s) 11.0 33.0 11.0 33.0 11.0 29.0 11.0 29.0Total Split (s) 12.0 41.0 0.0 15.0 44.0 0.0 28.0 73.0 0.0 11.0 56.0 0.0Total Split (%) 8.6% 29.3% 0.0% 10.7% 31.4% 0.0% 20.0% 52.1% 0.0% 7.9% 40.0% 0.0%Maximum Green (s) 8.0 34.0 11.0 37.0 24.0 66.0 7.0 49.0Yellow Time (s) 3.0 4.0 3.0 4.0 3.0 4.0 3.0 4.0All-Red Time (s) 1.0 3.0 1.0 3.0 1.0 3.0 1.0 3.0Lead/Lag Lead Lag Lead Lag Lead Lag Lead LagLead-Lag Optimize? Yes Yes Yes Yes Yes Yes Yes YesVehicle Extension (s) 3.0 3.0 3.0 3.0 3.0 3.0 3.0 3.0Recall Mode None None None None None C-Max None C-MaxWalk Time (s) 7.0 7.0 7.0 7.0Flash Dont Walk (s) 17.0 17.0 15.0 15.0Pedestrian Calls (#/hr) 0 0 0 0Act Effct Green (s) 45.0 37.0 51.0 40.0 80.0 69.0 59.0 52.0Actuated g/C Ratio 0.32 0.26 0.36 0.29 0.57 0.49 0.42 0.37v/c Ratio 1.26 0.36 0.72 1.16 1.43 1.08 0.61 1.18Control Delay 191.9 19.1 47.9 126.6 235.2 73.9 43.4 129.2Queue Delay 0.0 0.0 0.0 0.0 0.0 0.0 0.0 0.0
Lanes, Volumes, Timings PM Peak Hour3: Mainway & Appleby Line Future Background Volumes
Synchro 6 ReportDillon Consulting Limited
Lane Group EBL EBT EBR WBL WBT WBR NBL NBT NBR SBL SBT SBRTotal Delay 191.9 19.1 47.9 126.6 235.2 73.9 43.4 129.2LOS F B D F F E D FApproach Delay 81.0 112.7 109.5 124.7Approach LOS F F F F
Intersection SummaryArea Type: OtherCycle Length: 140Actuated Cycle Length: 140Offset: 85 (61%), Referenced to phase 2:NBTL and 6:SBTL, Start of YellowNatural Cycle: 145Control Type: Actuated-CoordinatedMaximum v/c Ratio: 1.43Intersection Signal Delay: 111.9 Intersection LOS: FIntersection Capacity Utilization 111.2% ICU Level of Service HAnalysis Period (min) 15
Splits and Phases: 3: Mainway & Appleby Line

HCM Signalized Intersection Capacity Analysis PM Peak Hour3: Mainway & Appleby Line Future Background Volumes
Synchro 6 ReportDillon Consulting Limited
Movement EBL EBT EBR WBL WBT WBR NBL NBT NBR SBL SBT SBRLane ConfigurationsIdeal Flow (vphpl) 1900 1900 1900 1900 1900 1900 1900 1900 1900 1900 1900 1900Lane Width 3.0 3.3 3.3 3.0 3.3 3.3 3.3 3.3 3.3 3.3 3.3 3.3Total Lost time (s) 4.0 4.0 4.0 4.0 4.0 4.0 4.0 4.0Lane Util. Factor 1.00 0.95 1.00 0.95 1.00 0.95 1.00 0.95Frt 1.00 0.92 1.00 0.97 1.00 1.00 1.00 0.99Flt Protected 0.95 1.00 0.95 1.00 0.95 1.00 0.95 1.00Satd. Flow (prot) 1636 2937 1604 3282 1728 3295 1662 3325Flt Permitted 0.11 1.00 0.42 1.00 0.07 1.00 0.08 1.00Satd. Flow (perm) 186 2937 711 3282 130 3295 135 3325Volume (vph) 160 127 160 210 789 193 441 1514 49 72 1183 122Peak-hour factor, PHF 0.89 0.89 0.89 0.89 0.89 0.89 0.89 0.89 0.89 0.89 0.89 0.89Adj. Flow (vph) 180 143 180 236 887 217 496 1701 55 81 1329 137RTOR Reduction (vph) 0 132 0 0 15 0 0 2 0 0 6 0Lane Group Flow (vph) 180 191 0 236 1089 0 496 1754 0 81 1460 0Heavy Vehicles (%) 3% 10% 8% 5% 3% 4% 1% 5% 18% 5% 3% 8%Turn Type pm+pt pm+pt pm+pt pm+ptProtected Phases 7 4 3 8 5 2 1 6Permitted Phases 4 8 2 6Actuated Green, G (s) 42.0 34.0 48.0 37.0 77.0 66.0 56.0 49.0Effective Green, g (s) 45.0 37.0 51.0 40.0 80.0 69.0 59.0 52.0Actuated g/C Ratio 0.32 0.26 0.36 0.29 0.57 0.49 0.42 0.37Clearance Time (s) 4.0 7.0 4.0 7.0 4.0 7.0 4.0 7.0Vehicle Extension (s) 3.0 3.0 3.0 3.0 3.0 3.0 3.0 3.0Lane Grp Cap (vph) 143 776 329 938 348 1624 133 1235v/s Ratio Prot c0.07 0.06 c0.06 0.33 c0.24 0.53 0.03 0.44v/s Ratio Perm c0.33 0.20 c0.57 0.23v/c Ratio 1.26 0.25 0.72 1.16 1.43 1.08 0.61 1.18Uniform Delay, d1 68.2 40.5 36.3 50.0 60.2 35.5 66.4 44.0Progression Factor 1.00 1.00 1.00 1.00 0.94 0.83 1.00 1.00Incremental Delay, d2 160.8 0.2 7.3 84.3 202.7 44.5 7.7 90.7Delay (s) 229.0 40.7 43.6 134.3 259.1 73.9 74.1 134.7Level of Service F D D F F E E FApproach Delay (s) 108.1 118.4 114.7 131.5Approach LOS F F F F
Intersection SummaryHCM Average Control Delay 119.6 HCM Level of Service FHCM Volume to Capacity ratio 1.37Actuated Cycle Length (s) 140.0 Sum of lost time (s) 16.0Intersection Capacity Utilization 111.2% ICU Level of Service HAnalysis Period (min) 15c Critical Lane Group
Lanes, Volumes, Timings PM Peak Hour6: IcePlex & Appleby Line Future Background Volumes
Synchro 6 ReportDillon Consulting Limited
Lane Group EBL EBT EBR WBL WBT WBR NBL NBT NBR SBL SBT SBRLane ConfigurationsIdeal Flow (vphpl) 1900 1900 1900 1900 1900 1900 1900 1900 1900 1900 1900 1900Storage Length (m) 0.0 0.0 0.0 0.0 30.0 0.0 30.0 0.0Storage Lanes 0 0 0 0 1 0 1 0Total Lost Time (s) 4.0 4.0 4.0 4.0 4.0 4.0 4.0 4.0 4.0 4.0 4.0 4.0Leading Detector (m) 15.2 15.2 15.2 15.2 15.2 15.2 15.2 15.2Trailing Detector (m) 0.0 0.0 0.0 0.0 0.0 0.0 0.0 0.0Turning Speed (k/h) 24 14 24 14 24 14 24 14Lane Util. Factor 1.00 1.00 1.00 1.00 1.00 1.00 1.00 0.95 0.95 1.00 0.95 0.95Frt 0.888 0.932 0.997Flt Protected 0.992 0.976 0.950 0.950Satd. Flow (prot) 0 1528 0 0 1748 0 1304 3535 0 1825 3510 0Flt Permitted 0.968 0.884 0.124 0.044Satd. Flow (perm) 0 1491 0 0 1583 0 170 3535 0 85 3510 0Right Turn on Red Yes Yes Yes YesSatd. Flow (RTOR) 29 18 2Headway Factor 0.99 0.99 0.99 0.99 0.99 0.99 0.99 0.99 0.99 0.99 0.99 0.99Link Speed (k/h) 25 25 60 60Link Distance (m) 111.2 81.8 173.7 63.0Travel Time (s) 16.0 11.8 10.4 3.8Volume (vph) 6 0 28 17 0 17 6 2105 39 28 1509 0Peak Hour Factor 0.96 0.96 0.96 0.96 0.96 0.96 0.96 0.96 0.96 0.96 0.96 0.96Heavy Vehicles (%) 0% 0% 13% 0% 0% 0% 40% 3% 0% 0% 4% 0%Adj. Flow (vph) 6 0 29 18 0 18 6 2193 41 29 1572 0Lane Group Flow (vph) 0 35 0 0 36 0 6 2234 0 29 1572 0Turn Type Perm Perm Perm pm+ptProtected Phases 4 8 2 1 6Permitted Phases 4 8 2 6Detector Phases 4 4 8 8 2 2 1 6Minimum Initial (s) 8.0 8.0 8.0 8.0 8.0 8.0 7.0 8.0Minimum Split (s) 29.0 29.0 29.0 29.0 29.0 29.0 11.0 29.0Total Split (s) 38.0 38.0 0.0 38.0 38.0 0.0 90.0 90.0 0.0 12.0 102.0 0.0Total Split (%) 27.1% 27.1% 0.0% 27.1% 27.1% 0.0% 64.3% 64.3% 0.0% 8.6% 72.9% 0.0%Maximum Green (s) 31.0 31.0 31.0 31.0 83.0 83.0 8.0 95.0Yellow Time (s) 4.0 4.0 4.0 4.0 4.0 4.0 3.0 4.0All-Red Time (s) 3.0 3.0 3.0 3.0 3.0 3.0 1.0 3.0Lead/Lag Lag Lag LeadLead-Lag Optimize? Yes Yes YesVehicle Extension (s) 3.0 3.0 3.0 3.0 3.0 3.0 3.0 3.0Recall Mode None None None None C-Max C-Max None C-MaxWalk Time (s) 7.0 7.0 7.0 7.0 7.0 7.0 7.0Flash Dont Walk (s) 15.0 15.0 15.0 15.0 12.0 12.0 12.0Pedestrian Calls (#/hr) 0 0 0 0 0 0 0Act Effct Green (s) 11.5 11.5 121.4 121.4 126.5 128.1Actuated g/C Ratio 0.08 0.08 0.87 0.87 0.90 0.92v/c Ratio 0.23 0.25 0.04 0.73 0.18 0.49Control Delay 27.8 40.4 4.5 8.5 4.4 8.2Queue Delay 0.0 0.0 0.0 0.0 0.0 0.0Total Delay 27.8 40.4 4.5 8.5 4.4 8.2
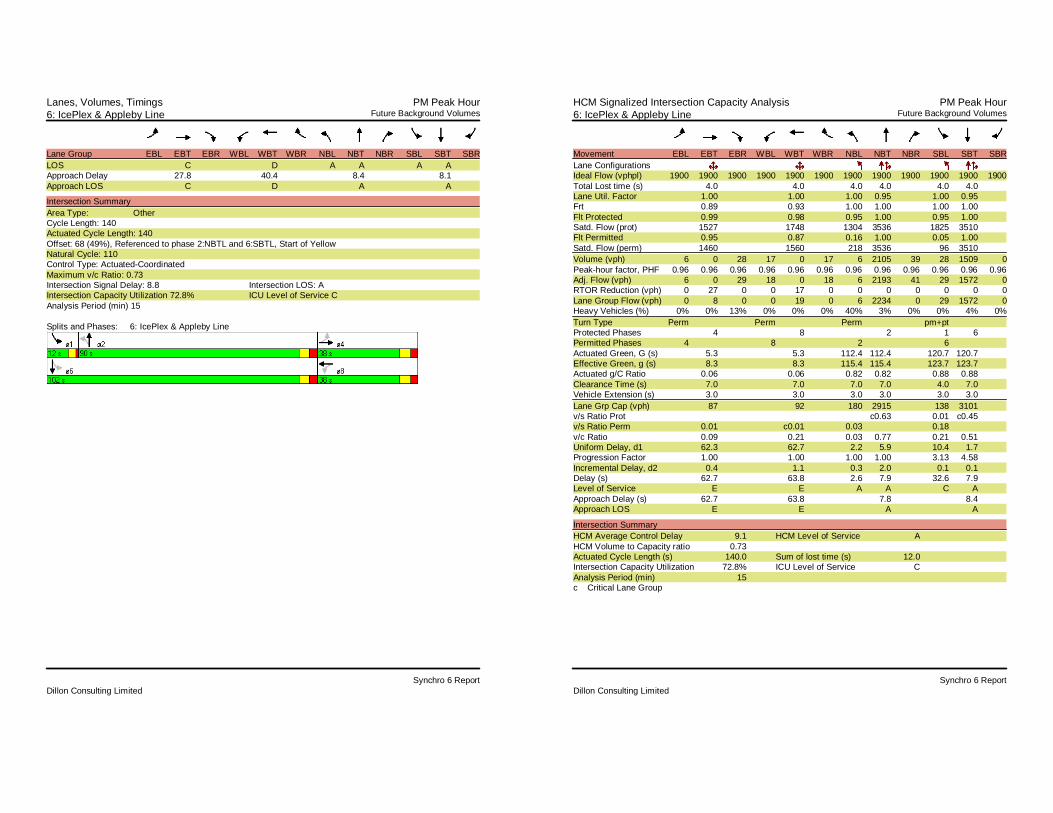
Lanes, Volumes, Timings PM Peak Hour6: IcePlex & Appleby Line Future Background Volumes
Synchro 6 ReportDillon Consulting Limited
Lane Group EBL EBT EBR WBL WBT WBR NBL NBT NBR SBL SBT SBRLOS C D A A A AApproach Delay 27.8 40.4 8.4 8.1Approach LOS C D A A
Intersection SummaryArea Type: OtherCycle Length: 140Actuated Cycle Length: 140Offset: 68 (49%), Referenced to phase 2:NBTL and 6:SBTL, Start of YellowNatural Cycle: 110Control Type: Actuated-CoordinatedMaximum v/c Ratio: 0.73Intersection Signal Delay: 8.8 Intersection LOS: AIntersection Capacity Utilization 72.8% ICU Level of Service CAnalysis Period (min) 15
Splits and Phases: 6: IcePlex & Appleby Line
HCM Signalized Intersection Capacity Analysis PM Peak Hour6: IcePlex & Appleby Line Future Background Volumes
Synchro 6 ReportDillon Consulting Limited
Movement EBL EBT EBR WBL WBT WBR NBL NBT NBR SBL SBT SBRLane ConfigurationsIdeal Flow (vphpl) 1900 1900 1900 1900 1900 1900 1900 1900 1900 1900 1900 1900Total Lost time (s) 4.0 4.0 4.0 4.0 4.0 4.0Lane Util. Factor 1.00 1.00 1.00 0.95 1.00 0.95Frt 0.89 0.93 1.00 1.00 1.00 1.00Flt Protected 0.99 0.98 0.95 1.00 0.95 1.00Satd. Flow (prot) 1527 1748 1304 3536 1825 3510Flt Permitted 0.95 0.87 0.16 1.00 0.05 1.00Satd. Flow (perm) 1460 1560 218 3536 96 3510Volume (vph) 6 0 28 17 0 17 6 2105 39 28 1509 0Peak-hour factor, PHF 0.96 0.96 0.96 0.96 0.96 0.96 0.96 0.96 0.96 0.96 0.96 0.96Adj. Flow (vph) 6 0 29 18 0 18 6 2193 41 29 1572 0RTOR Reduction (vph) 0 27 0 0 17 0 0 0 0 0 0 0Lane Group Flow (vph) 0 8 0 0 19 0 6 2234 0 29 1572 0Heavy Vehicles (%) 0% 0% 13% 0% 0% 0% 40% 3% 0% 0% 4% 0%Turn Type Perm Perm Perm pm+ptProtected Phases 4 8 2 1 6Permitted Phases 4 8 2 6Actuated Green, G (s) 5.3 5.3 112.4 112.4 120.7 120.7Effective Green, g (s) 8.3 8.3 115.4 115.4 123.7 123.7Actuated g/C Ratio 0.06 0.06 0.82 0.82 0.88 0.88Clearance Time (s) 7.0 7.0 7.0 7.0 4.0 7.0Vehicle Extension (s) 3.0 3.0 3.0 3.0 3.0 3.0Lane Grp Cap (vph) 87 92 180 2915 138 3101v/s Ratio Prot c0.63 0.01 c0.45v/s Ratio Perm 0.01 c0.01 0.03 0.18v/c Ratio 0.09 0.21 0.03 0.77 0.21 0.51Uniform Delay, d1 62.3 62.7 2.2 5.9 10.4 1.7Progression Factor 1.00 1.00 1.00 1.00 3.13 4.58Incremental Delay, d2 0.4 1.1 0.3 2.0 0.1 0.1Delay (s) 62.7 63.8 2.6 7.9 32.6 7.9Level of Service E E A A C AApproach Delay (s) 62.7 63.8 7.8 8.4Approach LOS E E A A
Intersection SummaryHCM Average Control Delay 9.1 HCM Level of Service AHCM Volume to Capacity ratio 0.73Actuated Cycle Length (s) 140.0 Sum of lost time (s) 12.0Intersection Capacity Utilization 72.8% ICU Level of Service CAnalysis Period (min) 15c Critical Lane Group

HCM Unsignalized Intersection Capacity Analysis PM Peak Hour15: Storage Spot & Appleby Line Future Background Volumes
Synchro 6 ReportDillon Consulting Limited
Movement WBL WBR NBT NBR SBL SBTLane ConfigurationsSign Control Yield Free FreeGrade 0% 0% 0%Volume (veh/h) 11 22 2116 11 28 1526Peak Hour Factor 0.96 0.96 0.96 0.96 0.96 0.96Hourly flow rate (vph) 11 23 2204 11 29 1590PedestriansLane Width (m)Walking Speed (m/s)Percent BlockageRight turn flare (veh)Median type TWLTLMedian storage veh) 0Upstream signal (m)pX, platoon unblockedvC, conflicting volume 3063 1108 2216vC1, stage 1 conf vol 2210vC2, stage 2 conf vol 853vCu, unblocked vol 3063 1108 2216tC, single (s) 6.8 6.9 4.1tC, 2 stage (s) 5.8tF (s) 3.5 3.3 2.2p0 queue free % 72 89 87cM capacity (veh/h) 41 205 233
Direction, Lane # WB 1 WB 2 NB 1 NB 2 SB 1 SB 2 SB 3Volume Total 11 23 1469 746 29 795 795Volume Left 11 0 0 0 29 0 0Volume Right 0 23 0 11 0 0 0cSH 41 205 1700 1700 233 1700 1700Volume to Capacity 0.28 0.11 0.86 0.44 0.13 0.47 0.47Queue Length 95th (m) 7.1 2.8 0.0 0.0 3.2 0.0 0.0Control Delay (s) 125.7 24.8 0.0 0.0 22.7 0.0 0.0Lane LOS F C CApproach Delay (s) 58.4 0.0 0.4Approach LOS F
Intersection SummaryAverage Delay 0.7Intersection Capacity Utilization 68.8% ICU Level of Service CAnalysis Period (min) 15
Lanes, Volumes, Timings Saturday Peak Hour3: Mainway & Appleby Line Future Background Volumes
Synchro 6 ReportDillon Consulting Limited
Lane Group EBL EBT EBR WBL WBT WBR NBL NBT NBR SBL SBT SBRLane ConfigurationsIdeal Flow (vphpl) 1900 1900 1900 1900 1900 1900 1900 1900 1900 1900 1900 1900Lane Width (m) 3.0 3.3 3.3 3.0 3.3 3.3 3.3 3.3 3.3 3.3 3.3 3.3Storage Length (m) 50.0 0.0 65.0 0.0 90.0 0.0 45.0 0.0Storage Lanes 1 0 1 0 1 0 1 0Total Lost Time (s) 4.0 4.0 4.0 4.0 4.0 4.0 4.0 4.0 4.0 4.0 4.0 4.0Leading Detector (m) 15.2 15.2 15.2 15.2 15.2 15.2 15.2 15.2Trailing Detector (m) 0.0 0.0 0.0 0.0 0.0 0.0 0.0 0.0Turning Speed (k/h) 24 14 24 14 24 14 24 14Lane Util. Factor 1.00 0.95 0.95 1.00 0.95 0.95 1.00 0.95 0.95 1.00 0.95 0.95Frt 0.881 0.903 0.995 0.994Flt Protected 0.950 0.950 0.950 0.950Satd. Flow (prot) 1636 3038 0 1685 3040 0 1728 3431 0 1745 3403 0Flt Permitted 0.678 0.590 0.093 0.093Satd. Flow (perm) 1167 3038 0 1046 3040 0 169 3431 0 171 3403 0Right Turn on Red Yes Yes Yes YesSatd. Flow (RTOR) 180 76 3 4Headway Factor 1.09 1.04 1.04 1.09 1.04 1.04 1.04 1.04 1.04 1.04 1.04 1.04Link Speed (k/h) 60 60 60 60Link Distance (m) 253.6 343.3 198.4 116.9Travel Time (s) 15.2 20.6 11.9 7.0Volume (vph) 132 44 171 39 39 72 121 1353 44 50 1465 61Peak Hour Factor 0.95 0.95 0.95 0.95 0.95 0.95 0.95 0.95 0.95 0.95 0.95 0.95Heavy Vehicles (%) 3% 2% 1% 0% 3% 4% 1% 1% 7% 0% 2% 0%Adj. Flow (vph) 139 46 180 41 41 76 127 1424 46 53 1542 64Lane Group Flow (vph) 139 226 0 41 117 0 127 1470 0 53 1606 0Turn Type pm+pt pm+pt pm+pt pm+ptProtected Phases 7 4 3 8 5 2 1 6Permitted Phases 4 8 2 6Detector Phases 7 4 3 8 5 2 1 6Minimum Initial (s) 7.0 8.0 7.0 8.0 7.0 8.0 7.0 8.0Minimum Split (s) 11.5 33.0 11.5 33.0 11.0 29.0 11.0 29.0Total Split (s) 12.0 40.0 0.0 12.0 40.0 0.0 11.0 47.0 0.0 11.0 47.0 0.0Total Split (%) 10.9% 36.4% 0.0% 10.9% 36.4% 0.0% 10.0% 42.7% 0.0% 10.0% 42.7% 0.0%Maximum Green (s) 8.0 33.0 8.0 33.0 7.0 40.0 7.0 40.0Yellow Time (s) 3.0 4.0 3.0 4.0 3.0 4.0 3.0 4.0All-Red Time (s) 1.0 3.0 1.0 3.0 1.0 3.0 1.0 3.0Lead/Lag Lead Lag Lead Lag Lead Lag Lead LagLead-Lag Optimize? Yes Yes Yes Yes Yes Yes Yes YesVehicle Extension (s) 3.0 3.0 3.0 3.0 3.0 3.0 3.0 3.0Recall Mode None None None None None C-Max None C-MaxWalk Time (s) 7.0 7.0 7.0 7.0Flash Dont Walk (s) 17.0 17.0 15.0 15.0Pedestrian Calls (#/hr) 0 0 0 0Act Effct Green (s) 21.3 16.5 19.2 11.6 75.2 69.6 74.4 67.4Actuated g/C Ratio 0.19 0.15 0.17 0.11 0.68 0.63 0.68 0.61v/c Ratio 0.53 0.37 0.18 0.30 0.59 0.68 0.25 0.77Control Delay 46.0 13.4 36.5 20.5 21.1 15.7 7.8 19.0Queue Delay 0.0 0.0 0.0 0.0 0.0 0.0 0.0 0.0

Lanes, Volumes, Timings Saturday Peak Hour3: Mainway & Appleby Line Future Background Volumes
Synchro 6 ReportDillon Consulting Limited
Lane Group EBL EBT EBR WBL WBT WBR NBL NBT NBR SBL SBT SBRTotal Delay 46.0 13.4 36.5 20.5 21.1 15.7 7.8 19.0LOS D B D C C B A BApproach Delay 25.8 24.6 16.1 18.6Approach LOS C C B B
Intersection SummaryArea Type: OtherCycle Length: 110Actuated Cycle Length: 110Offset: 46 (42%), Referenced to phase 2:NBTL and 6:SBTL, Start of YellowNatural Cycle: 105Control Type: Actuated-CoordinatedMaximum v/c Ratio: 0.77Intersection Signal Delay: 18.5 Intersection LOS: BIntersection Capacity Utilization 76.5% ICU Level of Service DAnalysis Period (min) 15
Splits and Phases: 3: Mainway & Appleby Line
HCM Signalized Intersection Capacity Analysis Saturday Peak Hour3: Mainway & Appleby Line Future Background Volumes
Synchro 6 ReportDillon Consulting Limited
Movement EBL EBT EBR WBL WBT WBR NBL NBT NBR SBL SBT SBRLane ConfigurationsIdeal Flow (vphpl) 1900 1900 1900 1900 1900 1900 1900 1900 1900 1900 1900 1900Lane Width 3.0 3.3 3.3 3.0 3.3 3.3 3.3 3.3 3.3 3.3 3.3 3.3Total Lost time (s) 4.0 4.0 4.0 4.0 4.0 4.0 4.0 4.0Lane Util. Factor 1.00 0.95 1.00 0.95 1.00 0.95 1.00 0.95Frt 1.00 0.88 1.00 0.90 1.00 1.00 1.00 0.99Flt Protected 0.95 1.00 0.95 1.00 0.95 1.00 0.95 1.00Satd. Flow (prot) 1636 3036 1685 3039 1728 3433 1745 3403Flt Permitted 0.54 1.00 0.61 1.00 0.07 1.00 0.11 1.00Satd. Flow (perm) 934 3036 1083 3039 129 3433 194 3403Volume (vph) 132 44 171 39 39 72 121 1353 44 50 1465 61Peak-hour factor, PHF 0.95 0.95 0.95 0.95 0.95 0.95 0.95 0.95 0.95 0.95 0.95 0.95Adj. Flow (vph) 139 46 180 41 41 76 127 1424 46 53 1542 64RTOR Reduction (vph) 0 153 0 0 67 0 0 1 0 0 2 0Lane Group Flow (vph) 139 73 0 41 50 0 127 1469 0 53 1604 0Heavy Vehicles (%) 3% 2% 1% 0% 3% 4% 1% 1% 7% 0% 2% 0%Turn Type pm+pt pm+pt pm+pt pm+ptProtected Phases 7 4 3 8 5 2 1 6Permitted Phases 4 8 2 6Actuated Green, G (s) 21.5 13.5 14.9 10.2 71.2 64.2 68.4 62.8Effective Green, g (s) 24.5 16.5 17.9 13.2 74.2 67.2 71.4 65.8Actuated g/C Ratio 0.22 0.15 0.16 0.12 0.67 0.61 0.65 0.60Clearance Time (s) 4.0 7.0 4.0 7.0 4.0 7.0 4.0 7.0Vehicle Extension (s) 3.0 3.0 3.0 3.0 3.0 3.0 3.0 3.0Lane Grp Cap (vph) 259 455 202 365 189 2097 205 2036v/s Ratio Prot c0.04 0.02 0.01 0.02 c0.04 0.43 0.01 c0.47v/s Ratio Perm c0.08 0.02 0.41 0.15v/c Ratio 0.54 0.16 0.20 0.14 0.67 0.70 0.26 0.79Uniform Delay, d1 36.4 40.7 39.5 43.3 17.3 14.6 10.9 16.8Progression Factor 1.00 1.00 1.00 1.00 1.00 1.00 1.00 1.00Incremental Delay, d2 2.1 0.2 0.5 0.2 9.0 2.0 0.7 3.2Delay (s) 38.5 40.9 40.0 43.5 26.3 16.5 11.6 20.0Level of Service D D D D C B B BApproach Delay (s) 40.0 42.6 17.3 19.7Approach LOS D D B B
Intersection SummaryHCM Average Control Delay 21.6 HCM Level of Service CHCM Volume to Capacity ratio 0.74Actuated Cycle Length (s) 110.0 Sum of lost time (s) 16.0Intersection Capacity Utilization 76.5% ICU Level of Service DAnalysis Period (min) 15c Critical Lane Group

Lanes, Volumes, Timings Saturday Peak Hour6: IcePlex & Appleby Line Future Background Volumes
Synchro 6 ReportDillon Consulting Limited
Lane Group EBL EBT EBR WBL WBT WBR NBL NBT NBR SBL SBT SBRLane ConfigurationsIdeal Flow (vphpl) 1900 1900 1900 1900 1900 1900 1900 1900 1900 1900 1900 1900Storage Length (m) 0.0 0.0 0.0 0.0 30.0 0.0 30.0 0.0Storage Lanes 0 0 0 0 1 0 1 0Total Lost Time (s) 4.0 4.0 4.0 4.0 4.0 4.0 4.0 4.0 4.0 4.0 4.0 4.0Leading Detector (m) 15.2 15.2 15.2 15.2 15.2 15.2 15.2 15.2Trailing Detector (m) 0.0 0.0 0.0 0.0 0.0 0.0 0.0 0.0Turning Speed (k/h) 24 14 24 14 24 14 24 14Lane Util. Factor 1.00 1.00 1.00 1.00 1.00 1.00 1.00 0.95 0.95 1.00 0.95 0.95Frt 0.932 0.946 0.992 0.999Flt Protected 0.976 0.971 0.950 0.950Satd. Flow (prot) 0 1748 0 0 1765 0 1217 3587 0 1825 3610 0Flt Permitted 0.893 0.817 0.071 0.067Satd. Flow (perm) 0 1599 0 0 1485 0 91 3587 0 129 3610 0Right Turn on Red Yes Yes Yes YesSatd. Flow (RTOR) 6 32 7 1Headway Factor 0.99 0.99 0.99 0.99 0.99 0.99 0.99 0.99 0.99 0.99 0.99 0.99Link Speed (k/h) 25 25 60 60Link Distance (m) 111.2 81.8 173.7 63.0Travel Time (s) 16.0 11.8 10.4 3.8Volume (vph) 6 0 6 99 0 66 6 1474 83 66 1642 6Peak Hour Factor 0.95 0.95 0.95 0.95 0.95 0.95 0.95 0.95 0.95 0.95 0.95 0.95Heavy Vehicles (%) 0% 0% 0% 0% 0% 0% 50% 1% 0% 0% 1% 0%Adj. Flow (vph) 6 0 6 104 0 69 6 1552 87 69 1728 6Lane Group Flow (vph) 0 12 0 0 173 0 6 1639 0 69 1734 0Turn Type Perm Perm Perm pm+ptProtected Phases 4 8 2 1 6Permitted Phases 4 8 2 6Detector Phases 4 4 8 8 2 2 1 6Minimum Initial (s) 8.0 8.0 8.0 8.0 8.0 8.0 7.0 8.0Minimum Split (s) 29.0 29.0 29.0 29.0 29.0 29.0 11.0 29.0Total Split (s) 39.0 39.0 0.0 39.0 39.0 0.0 60.0 60.0 0.0 11.0 71.0 0.0Total Split (%) 35.5% 35.5% 0.0% 35.5% 35.5% 0.0% 54.5% 54.5% 0.0% 10.0% 64.5% 0.0%Maximum Green (s) 32.0 32.0 32.0 32.0 53.0 53.0 7.0 64.0Yellow Time (s) 4.0 4.0 4.0 4.0 4.0 4.0 3.0 4.0All-Red Time (s) 3.0 3.0 3.0 3.0 3.0 3.0 1.0 3.0Lead/Lag Lag Lag LeadLead-Lag Optimize? Yes Yes YesVehicle Extension (s) 3.0 3.0 3.0 3.0 3.0 3.0 3.0 3.0Recall Mode None None None None C-Max C-Max None C-MaxWalk Time (s) 7.0 7.0 7.0 7.0 7.0 7.0 7.0Flash Dont Walk (s) 15.0 15.0 15.0 15.0 12.0 12.0 12.0Pedestrian Calls (#/hr) 0 0 0 0 0 0 0Act Effct Green (s) 18.2 18.2 75.0 75.0 83.8 83.8Actuated g/C Ratio 0.17 0.17 0.68 0.68 0.76 0.76v/c Ratio 0.04 0.64 0.10 0.67 0.33 0.63Control Delay 25.5 44.5 13.3 13.5 8.6 8.0Queue Delay 0.0 0.0 0.0 0.0 0.0 0.0Total Delay 25.5 44.5 13.3 13.5 8.6 8.0
Lanes, Volumes, Timings Saturday Peak Hour6: IcePlex & Appleby Line Future Background Volumes
Synchro 6 ReportDillon Consulting Limited
Lane Group EBL EBT EBR WBL WBT WBR NBL NBT NBR SBL SBT SBRLOS C D B B A AApproach Delay 25.5 44.5 13.5 8.0Approach LOS C D B A
Intersection SummaryArea Type: OtherCycle Length: 110Actuated Cycle Length: 110Offset: 15 (14%), Referenced to phase 2:NBTL and 6:SBTL, Start of YellowNatural Cycle: 80Control Type: Actuated-CoordinatedMaximum v/c Ratio: 0.67Intersection Signal Delay: 12.3 Intersection LOS: BIntersection Capacity Utilization 74.3% ICU Level of Service DAnalysis Period (min) 15
Splits and Phases: 6: IcePlex & Appleby Line

HCM Signalized Intersection Capacity Analysis Saturday Peak Hour6: IcePlex & Appleby Line Future Background Volumes
Synchro 6 ReportDillon Consulting Limited
Movement EBL EBT EBR WBL WBT WBR NBL NBT NBR SBL SBT SBRLane ConfigurationsIdeal Flow (vphpl) 1900 1900 1900 1900 1900 1900 1900 1900 1900 1900 1900 1900Total Lost time (s) 4.0 4.0 4.0 4.0 4.0 4.0Lane Util. Factor 1.00 1.00 1.00 0.95 1.00 0.95Frt 0.93 0.95 1.00 0.99 1.00 1.00Flt Protected 0.98 0.97 0.95 1.00 0.95 1.00Satd. Flow (prot) 1748 1765 1217 3587 1825 3612Flt Permitted 0.87 0.81 0.11 1.00 0.09 1.00Satd. Flow (perm) 1567 1470 143 3587 167 3612Volume (vph) 6 0 6 99 0 66 6 1474 83 66 1642 6Peak-hour factor, PHF 0.95 0.95 0.95 0.95 0.95 0.95 0.95 0.95 0.95 0.95 0.95 0.95Adj. Flow (vph) 6 0 6 104 0 69 6 1552 87 69 1728 6RTOR Reduction (vph) 0 5 0 0 27 0 0 2 0 0 0 0Lane Group Flow (vph) 0 7 0 0 146 0 6 1637 0 69 1734 0Heavy Vehicles (%) 0% 0% 0% 0% 0% 0% 50% 1% 0% 0% 1% 0%Turn Type Perm Perm Perm pm+ptProtected Phases 4 8 2 1 6Permitted Phases 4 8 2 6Actuated Green, G (s) 15.2 15.2 71.2 71.2 80.8 80.8Effective Green, g (s) 18.2 18.2 74.2 74.2 83.8 83.8Actuated g/C Ratio 0.17 0.17 0.67 0.67 0.76 0.76Clearance Time (s) 7.0 7.0 7.0 7.0 4.0 7.0Vehicle Extension (s) 3.0 3.0 3.0 3.0 3.0 3.0Lane Grp Cap (vph) 259 243 96 2420 212 2752v/s Ratio Prot c0.46 0.02 c0.48v/s Ratio Perm 0.00 c0.10 0.04 0.23v/c Ratio 0.03 0.60 0.06 0.68 0.33 0.63Uniform Delay, d1 38.5 42.5 6.1 10.7 9.7 6.0Progression Factor 1.00 1.00 1.00 1.00 1.00 1.00Incremental Delay, d2 0.0 4.2 1.2 1.5 0.9 1.1Delay (s) 38.5 46.7 7.3 12.3 10.6 7.1Level of Service D D A B B AApproach Delay (s) 38.5 46.7 12.2 7.2Approach LOS D D B A
Intersection SummaryHCM Average Control Delay 11.5 HCM Level of Service BHCM Volume to Capacity ratio 0.67Actuated Cycle Length (s) 110.0 Sum of lost time (s) 12.0Intersection Capacity Utilization 74.3% ICU Level of Service DAnalysis Period (min) 15c Critical Lane Group
HCM Unsignalized Intersection Capacity Analysis Saturday Peak Hour9: Storage Spot A&W & Appleby Line Future Background Volumes
Synchro 6 ReportDillon Consulting Limited
Movement WBL WBR NBT NBR SBL SBTLane ConfigurationsSign Control Yield Free FreeGrade 0% 0% 0%Volume (veh/h) 17 28 1535 11 22 1697Peak Hour Factor 0.95 0.95 0.95 0.95 0.95 0.95Hourly flow rate (vph) 18 29 1616 12 23 1786PedestriansLane Width (m)Walking Speed (m/s)Percent BlockageRight turn flare (veh)Median type TWLTLMedian storage veh) 1Upstream signal (m) 63 259pX, platoon unblocked 0.72 0.72 0.72vC, conflicting volume 2561 814 1627vC1, stage 1 conf vol 1622vC2, stage 2 conf vol 939vCu, unblocked vol 2780 351 1482tC, single (s) 6.8 6.9 4.1tC, 2 stage (s) 5.8tF (s) 3.5 3.3 2.2p0 queue free % 79 94 93cM capacity (veh/h) 87 464 324
Direction, Lane # WB 1 WB 2 NB 1 NB 2 SB 1 SB 2 SB 3Volume Total 18 29 1077 550 23 893 893Volume Left 18 0 0 0 23 0 0Volume Right 0 29 0 12 0 0 0cSH 87 464 1700 1700 324 1700 1700Volume to Capacity 0.21 0.06 0.63 0.32 0.07 0.53 0.53Queue Length 95th (m) 5.5 1.5 0.0 0.0 1.7 0.0 0.0Control Delay (s) 57.2 13.3 0.0 0.0 17.0 0.0 0.0Lane LOS F B CApproach Delay (s) 29.9 0.0 0.2Approach LOS D
Intersection SummaryAverage Delay 0.5Intersection Capacity Utilization 56.9% ICU Level of Service BAnalysis Period (min) 15

Lanes, Volumes, Timings PM Peak Hour3: Mainway & Appleby Line Total Future Volumes
Synchro 6 ReportDillon Consulting Limited
Lane Group EBL EBT EBR WBL WBT WBR NBL NBT NBR SBL SBT SBRLane ConfigurationsIdeal Flow (vphpl) 1900 1900 1900 1900 1900 1900 1900 1900 1900 1900 1900 1900Lane Width (m) 3.0 3.3 3.3 3.0 3.3 3.3 3.3 3.3 3.3 3.3 3.3 3.3Storage Length (m) 50.0 0.0 65.0 0.0 90.0 0.0 45.0 0.0Storage Lanes 1 0 1 0 1 0 1 0Total Lost Time (s) 4.0 4.0 4.0 4.0 4.0 4.0 4.0 4.0 4.0 4.0 4.0 4.0Leading Detector (m) 15.2 15.2 15.2 15.2 15.2 15.2 15.2 15.2Trailing Detector (m) 0.0 0.0 0.0 0.0 0.0 0.0 0.0 0.0Turning Speed (k/h) 24 14 24 14 24 14 24 14Lane Util. Factor 1.00 0.95 0.95 1.00 0.95 0.95 1.00 0.95 0.95 1.00 0.95 0.95Frt 0.914 0.971 0.995 0.986Flt Protected 0.950 0.950 0.950 0.950Satd. Flow (prot) 1636 2930 0 1604 3284 0 1728 3294 0 1662 3326 0Flt Permitted 0.108 0.411 0.071 0.077Satd. Flow (perm) 186 2930 0 694 3284 0 129 3294 0 135 3326 0Right Turn on Red Yes Yes Yes YesSatd. Flow (RTOR) 191 21 3 9Headway Factor 1.09 1.04 1.04 1.09 1.04 1.04 1.04 1.04 1.04 1.04 1.04 1.04Link Speed (k/h) 60 60 60 60Link Distance (m) 253.6 343.3 198.4 116.9Travel Time (s) 15.2 20.6 11.9 7.0Volume (vph) 160 127 170 210 789 193 451 1538 49 72 1216 122Peak Hour Factor 0.89 0.89 0.89 0.89 0.89 0.89 0.89 0.89 0.89 0.89 0.89 0.89Heavy Vehicles (%) 3% 10% 8% 5% 3% 4% 1% 5% 18% 5% 3% 8%Adj. Flow (vph) 180 143 191 236 887 217 507 1728 55 81 1366 137Lane Group Flow (vph) 180 334 0 236 1104 0 507 1783 0 81 1503 0Turn Type pm+pt pm+pt pm+pt pm+ptProtected Phases 7 4 3 8 5 2 1 6Permitted Phases 4 8 2 6Detector Phases 7 4 3 8 5 2 1 6Minimum Initial (s) 7.0 8.0 7.0 8.0 7.0 8.0 7.0 8.0Minimum Split (s) 11.0 33.0 11.0 33.0 11.0 29.0 11.0 29.0Total Split (s) 12.0 41.0 0.0 15.0 44.0 0.0 28.0 73.0 0.0 11.0 56.0 0.0Total Split (%) 8.6% 29.3% 0.0% 10.7% 31.4% 0.0% 20.0% 52.1% 0.0% 7.9% 40.0% 0.0%Maximum Green (s) 8.0 34.0 11.0 37.0 24.0 66.0 7.0 49.0Yellow Time (s) 3.0 4.0 3.0 4.0 3.0 4.0 3.0 4.0All-Red Time (s) 1.0 3.0 1.0 3.0 1.0 3.0 1.0 3.0Lead/Lag Lead Lag Lead Lag Lead Lag Lead LagLead-Lag Optimize? Yes Yes Yes Yes Yes Yes Yes YesVehicle Extension (s) 3.0 3.0 3.0 3.0 3.0 3.0 3.0 3.0Recall Mode None None None None None C-Max None C-MaxWalk Time (s) 7.0 7.0 7.0 7.0Flash Dont Walk (s) 17.0 17.0 15.0 15.0Pedestrian Calls (#/hr) 0 0 0 0Act Effct Green (s) 45.0 37.0 51.0 40.0 80.0 69.0 59.0 52.0Actuated g/C Ratio 0.32 0.26 0.36 0.29 0.57 0.49 0.42 0.37v/c Ratio 1.26 0.37 0.73 1.16 1.46 1.10 0.61 1.21Control Delay 191.9 18.6 48.7 126.6 249.0 80.4 43.4 141.1Queue Delay 0.0 0.0 0.0 0.0 0.0 0.0 0.0 0.0
Lanes, Volumes, Timings PM Peak Hour3: Mainway & Appleby Line Total Future Volumes
Synchro 6 ReportDillon Consulting Limited
Lane Group EBL EBT EBR WBL WBT WBR NBL NBT NBR SBL SBT SBRTotal Delay 191.9 18.6 48.7 126.6 249.0 80.4 43.4 141.1LOS F B D F F F D FApproach Delay 79.3 112.9 117.7 136.1Approach LOS E F F F
Intersection SummaryArea Type: OtherCycle Length: 140Actuated Cycle Length: 140Offset: 85 (61%), Referenced to phase 2:NBTL and 6:SBTL, Start of YellowNatural Cycle: 145Control Type: Actuated-CoordinatedMaximum v/c Ratio: 1.46Intersection Signal Delay: 118.2 Intersection LOS: FIntersection Capacity Utilization 112.7% ICU Level of Service HAnalysis Period (min) 15
Splits and Phases: 3: Mainway & Appleby Line

HCM Signalized Intersection Capacity Analysis PM Peak Hour3: Mainway & Appleby Line Total Future Volumes
Synchro 6 ReportDillon Consulting Limited
Movement EBL EBT EBR WBL WBT WBR NBL NBT NBR SBL SBT SBRLane ConfigurationsIdeal Flow (vphpl) 1900 1900 1900 1900 1900 1900 1900 1900 1900 1900 1900 1900Lane Width 3.0 3.3 3.3 3.0 3.3 3.3 3.3 3.3 3.3 3.3 3.3 3.3Total Lost time (s) 4.0 4.0 4.0 4.0 4.0 4.0 4.0 4.0Lane Util. Factor 1.00 0.95 1.00 0.95 1.00 0.95 1.00 0.95Frt 1.00 0.91 1.00 0.97 1.00 1.00 1.00 0.99Flt Protected 0.95 1.00 0.95 1.00 0.95 1.00 0.95 1.00Satd. Flow (prot) 1636 2931 1604 3282 1728 3296 1662 3327Flt Permitted 0.11 1.00 0.41 1.00 0.07 1.00 0.08 1.00Satd. Flow (perm) 186 2931 694 3282 130 3296 135 3327Volume (vph) 160 127 170 210 789 193 451 1538 49 72 1216 122Peak-hour factor, PHF 0.89 0.89 0.89 0.89 0.89 0.89 0.89 0.89 0.89 0.89 0.89 0.89Adj. Flow (vph) 180 143 191 236 887 217 507 1728 55 81 1366 137RTOR Reduction (vph) 0 141 0 0 15 0 0 2 0 0 6 0Lane Group Flow (vph) 180 193 0 236 1089 0 507 1781 0 81 1497 0Heavy Vehicles (%) 3% 10% 8% 5% 3% 4% 1% 5% 18% 5% 3% 8%Turn Type pm+pt pm+pt pm+pt pm+ptProtected Phases 7 4 3 8 5 2 1 6Permitted Phases 4 8 2 6Actuated Green, G (s) 42.0 34.0 48.0 37.0 77.0 66.0 56.0 49.0Effective Green, g (s) 45.0 37.0 51.0 40.0 80.0 69.0 59.0 52.0Actuated g/C Ratio 0.32 0.26 0.36 0.29 0.57 0.49 0.42 0.37Clearance Time (s) 4.0 7.0 4.0 7.0 4.0 7.0 4.0 7.0Vehicle Extension (s) 3.0 3.0 3.0 3.0 3.0 3.0 3.0 3.0Lane Grp Cap (vph) 143 775 324 938 348 1624 133 1236v/s Ratio Prot c0.07 0.07 c0.06 0.33 c0.25 0.54 0.03 0.45v/s Ratio Perm c0.33 0.21 c0.58 0.23v/c Ratio 1.26 0.25 0.73 1.16 1.46 1.10 0.61 1.21Uniform Delay, d1 68.2 40.6 36.5 50.0 60.2 35.5 66.4 44.0Progression Factor 1.00 1.00 1.00 1.00 0.96 0.82 1.00 1.00Incremental Delay, d2 160.8 0.2 7.9 84.3 216.6 51.1 7.7 102.9Delay (s) 229.0 40.7 44.4 134.3 274.1 80.4 74.1 146.9Level of Service F D D F F F E FApproach Delay (s) 106.7 118.5 123.3 143.1Approach LOS F F F F
Intersection SummaryHCM Average Control Delay 126.2 HCM Level of Service FHCM Volume to Capacity ratio 1.39Actuated Cycle Length (s) 140.0 Sum of lost time (s) 16.0Intersection Capacity Utilization 112.7% ICU Level of Service HAnalysis Period (min) 15c Critical Lane Group
Lanes, Volumes, Timings PM Peak Hour6: IcePlex & Appleby Line Total Future Volumes
Synchro 6 ReportDillon Consulting Limited
Lane Group EBL EBT EBR WBL WBT WBR NBL NBT NBR SBL SBT SBRLane ConfigurationsIdeal Flow (vphpl) 1900 1900 1900 1900 1900 1900 1900 1900 1900 1900 1900 1900Storage Length (m) 0.0 0.0 0.0 0.0 30.0 0.0 30.0 0.0Storage Lanes 0 0 0 0 1 0 1 0Total Lost Time (s) 4.0 4.0 4.0 4.0 4.0 4.0 4.0 4.0 4.0 4.0 4.0 4.0Leading Detector (m) 15.2 15.2 15.2 15.2 15.2 15.2 15.2 15.2Trailing Detector (m) 0.0 0.0 0.0 0.0 0.0 0.0 0.0 0.0Turning Speed (k/h) 24 14 24 14 24 14 24 14Lane Util. Factor 1.00 1.00 1.00 1.00 1.00 1.00 1.00 0.95 0.95 1.00 0.95 0.95Frt 0.888 0.932 0.997Flt Protected 0.992 0.976 0.950 0.950Satd. Flow (prot) 0 1528 0 0 1748 0 1304 3535 0 1825 3510 0Flt Permitted 0.968 0.884 0.116 0.044Satd. Flow (perm) 0 1491 0 0 1583 0 159 3535 0 85 3510 0Right Turn on Red Yes Yes Yes YesSatd. Flow (RTOR) 29 18 2Headway Factor 0.99 0.99 0.99 0.99 0.99 0.99 0.99 0.99 0.99 0.99 0.99 0.99Link Speed (k/h) 25 25 60 60Link Distance (m) 111.2 81.8 173.7 63.0Travel Time (s) 16.0 11.8 10.4 3.8Volume (vph) 6 0 28 17 0 17 6 2160 39 28 1547 0Peak Hour Factor 0.96 0.96 0.96 0.96 0.96 0.96 0.96 0.96 0.96 0.96 0.96 0.96Heavy Vehicles (%) 0% 0% 13% 0% 0% 0% 40% 3% 0% 0% 4% 0%Adj. Flow (vph) 6 0 29 18 0 18 6 2250 41 29 1611 0Lane Group Flow (vph) 0 35 0 0 36 0 6 2291 0 29 1611 0Turn Type Perm Perm Perm pm+ptProtected Phases 4 8 2 1 6Permitted Phases 4 8 2 6Detector Phases 4 4 8 8 2 2 1 6Minimum Initial (s) 8.0 8.0 8.0 8.0 8.0 8.0 7.0 8.0Minimum Split (s) 29.0 29.0 29.0 29.0 29.0 29.0 11.0 29.0Total Split (s) 38.0 38.0 0.0 38.0 38.0 0.0 90.0 90.0 0.0 12.0 102.0 0.0Total Split (%) 27.1% 27.1% 0.0% 27.1% 27.1% 0.0% 64.3% 64.3% 0.0% 8.6% 72.9% 0.0%Maximum Green (s) 31.0 31.0 31.0 31.0 83.0 83.0 8.0 95.0Yellow Time (s) 4.0 4.0 4.0 4.0 4.0 4.0 3.0 4.0All-Red Time (s) 3.0 3.0 3.0 3.0 3.0 3.0 1.0 3.0Lead/Lag Lag Lag LeadLead-Lag Optimize? Yes Yes YesVehicle Extension (s) 3.0 3.0 3.0 3.0 3.0 3.0 3.0 3.0Recall Mode None None None None C-Max C-Max None C-MaxWalk Time (s) 7.0 7.0 7.0 7.0 7.0 7.0 7.0Flash Dont Walk (s) 15.0 15.0 15.0 15.0 12.0 12.0 12.0Pedestrian Calls (#/hr) 0 0 0 0 0 0 0Act Effct Green (s) 11.5 11.5 121.4 121.4 126.5 128.1Actuated g/C Ratio 0.08 0.08 0.87 0.87 0.90 0.92v/c Ratio 0.23 0.25 0.04 0.75 0.18 0.50Control Delay 27.8 40.4 4.5 9.0 4.3 8.3Queue Delay 0.0 0.0 0.0 0.0 0.0 0.0Total Delay 27.8 40.4 4.5 9.0 4.3 8.3

Lanes, Volumes, Timings PM Peak Hour6: IcePlex & Appleby Line Total Future Volumes
Synchro 6 ReportDillon Consulting Limited
Lane Group EBL EBT EBR WBL WBT WBR NBL NBT NBR SBL SBT SBRLOS C D A A A AApproach Delay 27.8 40.4 9.0 8.3Approach LOS C D A A
Intersection SummaryArea Type: OtherCycle Length: 140Actuated Cycle Length: 140Offset: 68 (49%), Referenced to phase 2:NBTL and 6:SBTL, Start of YellowNatural Cycle: 120Control Type: Actuated-CoordinatedMaximum v/c Ratio: 0.75Intersection Signal Delay: 9.1 Intersection LOS: AIntersection Capacity Utilization 74.3% ICU Level of Service DAnalysis Period (min) 15
Splits and Phases: 6: IcePlex & Appleby Line
HCM Signalized Intersection Capacity Analysis PM Peak Hour6: IcePlex & Appleby Line Total Future Volumes
Synchro 6 ReportDillon Consulting Limited
Movement EBL EBT EBR WBL WBT WBR NBL NBT NBR SBL SBT SBRLane ConfigurationsIdeal Flow (vphpl) 1900 1900 1900 1900 1900 1900 1900 1900 1900 1900 1900 1900Total Lost time (s) 4.0 4.0 4.0 4.0 4.0 4.0Lane Util. Factor 1.00 1.00 1.00 0.95 1.00 0.95Frt 0.89 0.93 1.00 1.00 1.00 1.00Flt Protected 0.99 0.98 0.95 1.00 0.95 1.00Satd. Flow (prot) 1527 1748 1304 3536 1825 3510Flt Permitted 0.95 0.87 0.15 1.00 0.04 1.00Satd. Flow (perm) 1460 1560 208 3536 86 3510Volume (vph) 6 0 28 17 0 17 6 2160 39 28 1547 0Peak-hour factor, PHF 0.96 0.96 0.96 0.96 0.96 0.96 0.96 0.96 0.96 0.96 0.96 0.96Adj. Flow (vph) 6 0 29 18 0 18 6 2250 41 29 1611 0RTOR Reduction (vph) 0 27 0 0 17 0 0 0 0 0 0 0Lane Group Flow (vph) 0 8 0 0 19 0 6 2291 0 29 1611 0Heavy Vehicles (%) 0% 0% 13% 0% 0% 0% 40% 3% 0% 0% 4% 0%Turn Type Perm Perm Perm pm+ptProtected Phases 4 8 2 1 6Permitted Phases 4 8 2 6Actuated Green, G (s) 5.3 5.3 112.4 112.4 120.7 120.7Effective Green, g (s) 8.3 8.3 115.4 115.4 123.7 123.7Actuated g/C Ratio 0.06 0.06 0.82 0.82 0.88 0.88Clearance Time (s) 7.0 7.0 7.0 7.0 4.0 7.0Vehicle Extension (s) 3.0 3.0 3.0 3.0 3.0 3.0Lane Grp Cap (vph) 87 92 171 2915 129 3101v/s Ratio Prot c0.65 0.01 c0.46v/s Ratio Perm 0.01 c0.01 0.03 0.19v/c Ratio 0.09 0.21 0.04 0.79 0.22 0.52Uniform Delay, d1 62.3 62.7 2.2 6.1 12.0 1.8Progression Factor 1.00 1.00 1.00 1.00 3.07 4.55Incremental Delay, d2 0.4 1.1 0.4 2.2 0.1 0.1Delay (s) 62.7 63.8 2.6 8.4 37.1 8.0Level of Service E E A A D AApproach Delay (s) 62.7 63.8 8.3 8.6Approach LOS E E A A
Intersection SummaryHCM Average Control Delay 9.4 HCM Level of Service AHCM Volume to Capacity ratio 0.75Actuated Cycle Length (s) 140.0 Sum of lost time (s) 12.0Intersection Capacity Utilization 74.3% ICU Level of Service DAnalysis Period (min) 15c Critical Lane Group

HCM Unsignalized Intersection Capacity Analysis PM Peak Hour15: Storage Spot & Appleby Total Future Volumes
Synchro 6 ReportDillon Consulting Limited
Movement WBL WBR NBT NBR SBL SBTLane ConfigurationsSign Control Yield Free FreeGrade 0% 0% 0%Volume (veh/h) 11 22 2171 11 28 1563Peak Hour Factor 0.96 0.96 0.96 0.96 0.96 0.96Hourly flow rate (vph) 11 23 2261 11 29 1628PedestriansLane Width (m)Walking Speed (m/s)Percent BlockageRight turn flare (veh)Median type TWLTLMedian storage veh) 0Upstream signal (m)pX, platoon unblockedvC, conflicting volume 3140 1136 2273vC1, stage 1 conf vol 2267vC2, stage 2 conf vol 872vCu, unblocked vol 3140 1136 2273tC, single (s) 6.8 6.9 4.1tC, 2 stage (s) 5.8tF (s) 3.5 3.3 2.2p0 queue free % 70 88 87cM capacity (veh/h) 38 196 221
Direction, Lane # WB 1 WB 2 NB 1 NB 2 SB 1 SB 2 SB 3Volume Total 11 23 1508 765 29 814 814Volume Left 11 0 0 0 29 0 0Volume Right 0 23 0 11 0 0 0cSH 38 196 1700 1700 221 1700 1700Volume to Capacity 0.30 0.12 0.89 0.45 0.13 0.48 0.48Queue Length 95th (m) 7.6 3.0 0.0 0.0 3.4 0.0 0.0Control Delay (s) 137.4 25.8 0.0 0.0 23.8 0.0 0.0Lane LOS F D CApproach Delay (s) 63.0 0.0 0.4Approach LOS F
Intersection SummaryAverage Delay 0.7Intersection Capacity Utilization 70.4% ICU Level of Service CAnalysis Period (min) 15
HCM Unsignalized Intersection Capacity Analysis PM Peak Hour19: 1215 Appleby & Appleby Total Future Volumes
Synchro 6 ReportDillon Consulting Limited
Movement WBL WBR NBT NBR SBL SBTLane ConfigurationsSign Control Yield Free FreeGrade 0% 0% 0%Volume (veh/h) 0 104 2105 88 45 1553Peak Hour Factor 0.96 0.96 0.96 0.96 0.96 0.96Hourly flow rate (vph) 0 108 2193 92 47 1618PedestriansLane Width (m)Walking Speed (m/s)Percent BlockageRight turn flare (veh)Median type TWLTLMedian storage veh) 0Upstream signal (m)pX, platoon unblockedvC, conflicting volume 3141 1142 2284vC1, stage 1 conf vol 2239vC2, stage 2 conf vol 903vCu, unblocked vol 3141 1142 2284tC, single (s) 6.8 6.9 4.2tC, 2 stage (s) 5.8tF (s) 3.5 3.3 2.2p0 queue free % 100 44 78cM capacity (veh/h) 38 194 212
Direction, Lane # WB 1 NB 1 NB 2 SB 1 SB 2 SB 3Volume Total 108 1462 823 47 809 809Volume Left 0 0 0 47 0 0Volume Right 108 0 92 0 0 0cSH 194 1700 1700 212 1700 1700Volume to Capacity 0.56 0.86 0.48 0.22 0.48 0.48Queue Length 95th (m) 22.6 0.0 0.0 6.2 0.0 0.0Control Delay (s) 44.8 0.0 0.0 26.7 0.0 0.0Lane LOS E DApproach Delay (s) 44.8 0.0 0.8Approach LOS E
Intersection SummaryAverage Delay 1.5Intersection Capacity Utilization 74.1% ICU Level of Service DAnalysis Period (min) 15
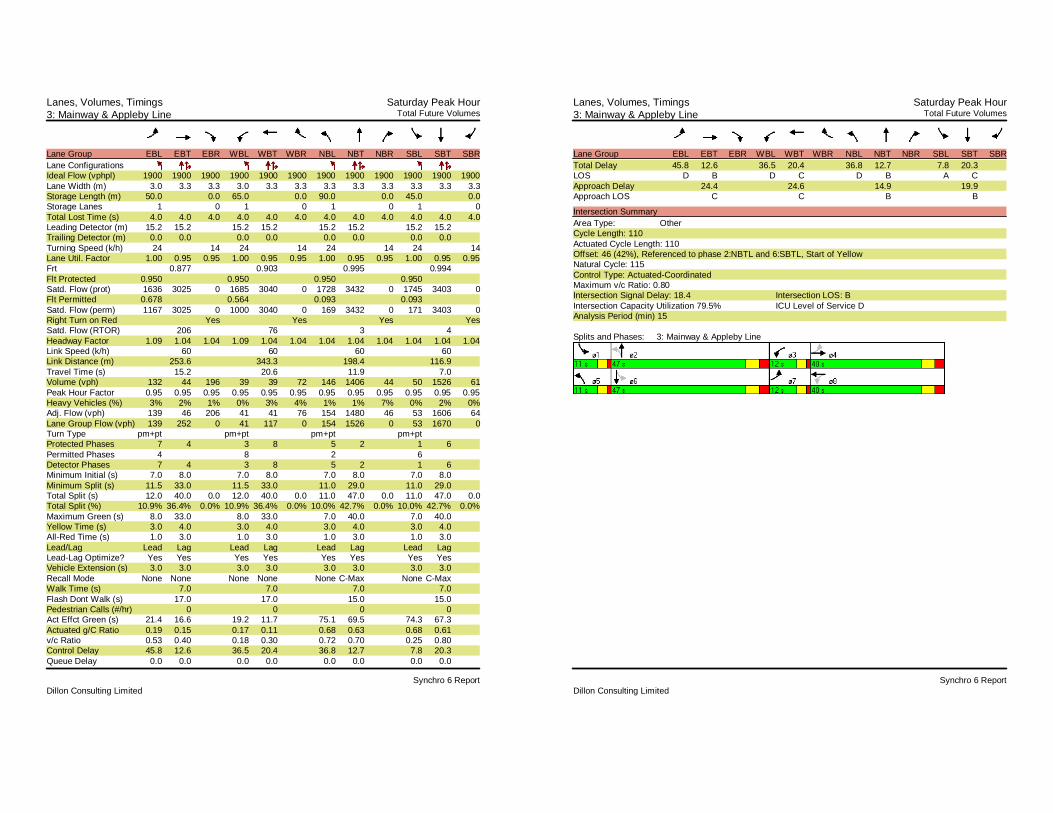
Lanes, Volumes, Timings Saturday Peak Hour3: Mainway & Appleby Line Total Future Volumes
Synchro 6 ReportDillon Consulting Limited
Lane Group EBL EBT EBR WBL WBT WBR NBL NBT NBR SBL SBT SBRLane ConfigurationsIdeal Flow (vphpl) 1900 1900 1900 1900 1900 1900 1900 1900 1900 1900 1900 1900Lane Width (m) 3.0 3.3 3.3 3.0 3.3 3.3 3.3 3.3 3.3 3.3 3.3 3.3Storage Length (m) 50.0 0.0 65.0 0.0 90.0 0.0 45.0 0.0Storage Lanes 1 0 1 0 1 0 1 0Total Lost Time (s) 4.0 4.0 4.0 4.0 4.0 4.0 4.0 4.0 4.0 4.0 4.0 4.0Leading Detector (m) 15.2 15.2 15.2 15.2 15.2 15.2 15.2 15.2Trailing Detector (m) 0.0 0.0 0.0 0.0 0.0 0.0 0.0 0.0Turning Speed (k/h) 24 14 24 14 24 14 24 14Lane Util. Factor 1.00 0.95 0.95 1.00 0.95 0.95 1.00 0.95 0.95 1.00 0.95 0.95Frt 0.877 0.903 0.995 0.994Flt Protected 0.950 0.950 0.950 0.950Satd. Flow (prot) 1636 3025 0 1685 3040 0 1728 3432 0 1745 3403 0Flt Permitted 0.678 0.564 0.093 0.093Satd. Flow (perm) 1167 3025 0 1000 3040 0 169 3432 0 171 3403 0Right Turn on Red Yes Yes Yes YesSatd. Flow (RTOR) 206 76 3 4Headway Factor 1.09 1.04 1.04 1.09 1.04 1.04 1.04 1.04 1.04 1.04 1.04 1.04Link Speed (k/h) 60 60 60 60Link Distance (m) 253.6 343.3 198.4 116.9Travel Time (s) 15.2 20.6 11.9 7.0Volume (vph) 132 44 196 39 39 72 146 1406 44 50 1526 61Peak Hour Factor 0.95 0.95 0.95 0.95 0.95 0.95 0.95 0.95 0.95 0.95 0.95 0.95Heavy Vehicles (%) 3% 2% 1% 0% 3% 4% 1% 1% 7% 0% 2% 0%Adj. Flow (vph) 139 46 206 41 41 76 154 1480 46 53 1606 64Lane Group Flow (vph) 139 252 0 41 117 0 154 1526 0 53 1670 0Turn Type pm+pt pm+pt pm+pt pm+ptProtected Phases 7 4 3 8 5 2 1 6Permitted Phases 4 8 2 6Detector Phases 7 4 3 8 5 2 1 6Minimum Initial (s) 7.0 8.0 7.0 8.0 7.0 8.0 7.0 8.0Minimum Split (s) 11.5 33.0 11.5 33.0 11.0 29.0 11.0 29.0Total Split (s) 12.0 40.0 0.0 12.0 40.0 0.0 11.0 47.0 0.0 11.0 47.0 0.0Total Split (%) 10.9% 36.4% 0.0% 10.9% 36.4% 0.0% 10.0% 42.7% 0.0% 10.0% 42.7% 0.0%Maximum Green (s) 8.0 33.0 8.0 33.0 7.0 40.0 7.0 40.0Yellow Time (s) 3.0 4.0 3.0 4.0 3.0 4.0 3.0 4.0All-Red Time (s) 1.0 3.0 1.0 3.0 1.0 3.0 1.0 3.0Lead/Lag Lead Lag Lead Lag Lead Lag Lead LagLead-Lag Optimize? Yes Yes Yes Yes Yes Yes Yes YesVehicle Extension (s) 3.0 3.0 3.0 3.0 3.0 3.0 3.0 3.0Recall Mode None None None None None C-Max None C-MaxWalk Time (s) 7.0 7.0 7.0 7.0Flash Dont Walk (s) 17.0 17.0 15.0 15.0Pedestrian Calls (#/hr) 0 0 0 0Act Effct Green (s) 21.4 16.6 19.2 11.7 75.1 69.5 74.3 67.3Actuated g/C Ratio 0.19 0.15 0.17 0.11 0.68 0.63 0.68 0.61v/c Ratio 0.53 0.40 0.18 0.30 0.72 0.70 0.25 0.80Control Delay 45.8 12.6 36.5 20.4 36.8 12.7 7.8 20.3Queue Delay 0.0 0.0 0.0 0.0 0.0 0.0 0.0 0.0
Lanes, Volumes, Timings Saturday Peak Hour3: Mainway & Appleby Line Total Future Volumes
Synchro 6 ReportDillon Consulting Limited
Lane Group EBL EBT EBR WBL WBT WBR NBL NBT NBR SBL SBT SBRTotal Delay 45.8 12.6 36.5 20.4 36.8 12.7 7.8 20.3LOS D B D C D B A CApproach Delay 24.4 24.6 14.9 19.9Approach LOS C C B B
Intersection SummaryArea Type: OtherCycle Length: 110Actuated Cycle Length: 110Offset: 46 (42%), Referenced to phase 2:NBTL and 6:SBTL, Start of YellowNatural Cycle: 115Control Type: Actuated-CoordinatedMaximum v/c Ratio: 0.80Intersection Signal Delay: 18.4 Intersection LOS: BIntersection Capacity Utilization 79.5% ICU Level of Service DAnalysis Period (min) 15
Splits and Phases: 3: Mainway & Appleby Line

HCM Signalized Intersection Capacity Analysis Saturday Peak Hour3: Mainway & Appleby Line Total Future Volumes
Synchro 6 ReportDillon Consulting Limited
Movement EBL EBT EBR WBL WBT WBR NBL NBT NBR SBL SBT SBRLane ConfigurationsIdeal Flow (vphpl) 1900 1900 1900 1900 1900 1900 1900 1900 1900 1900 1900 1900Lane Width 3.0 3.3 3.3 3.0 3.3 3.3 3.3 3.3 3.3 3.3 3.3 3.3Total Lost time (s) 4.0 4.0 4.0 4.0 4.0 4.0 4.0 4.0Lane Util. Factor 1.00 0.95 1.00 0.95 1.00 0.95 1.00 0.95Frt 1.00 0.88 1.00 0.90 1.00 1.00 1.00 0.99Flt Protected 0.95 1.00 0.95 1.00 0.95 1.00 0.95 1.00Satd. Flow (prot) 1636 3026 1685 3039 1728 3433 1745 3404Flt Permitted 0.54 1.00 0.59 1.00 0.06 1.00 0.09 1.00Satd. Flow (perm) 935 3026 1046 3039 108 3433 172 3404Volume (vph) 132 44 196 39 39 72 146 1406 44 50 1526 61Peak-hour factor, PHF 0.95 0.95 0.95 0.95 0.95 0.95 0.95 0.95 0.95 0.95 0.95 0.95Adj. Flow (vph) 139 46 206 41 41 76 154 1480 46 53 1606 64RTOR Reduction (vph) 0 175 0 0 67 0 0 1 0 0 2 0Lane Group Flow (vph) 139 77 0 41 50 0 154 1525 0 53 1668 0Heavy Vehicles (%) 3% 2% 1% 0% 3% 4% 1% 1% 7% 0% 2% 0%Turn Type pm+pt pm+pt pm+pt pm+ptProtected Phases 7 4 3 8 5 2 1 6Permitted Phases 4 8 2 6Actuated Green, G (s) 21.6 13.6 15.0 10.3 71.1 64.1 68.3 62.7Effective Green, g (s) 24.6 16.6 18.0 13.3 74.1 67.1 71.3 65.7Actuated g/C Ratio 0.22 0.15 0.16 0.12 0.67 0.61 0.65 0.60Clearance Time (s) 4.0 7.0 4.0 7.0 4.0 7.0 4.0 7.0Vehicle Extension (s) 3.0 3.0 3.0 3.0 3.0 3.0 3.0 3.0Lane Grp Cap (vph) 260 457 198 367 176 2094 192 2033v/s Ratio Prot c0.04 0.03 0.01 0.02 c0.06 0.44 0.01 0.49v/s Ratio Perm c0.08 0.02 c0.53 0.16v/c Ratio 0.53 0.17 0.21 0.14 0.88 0.73 0.28 0.82Uniform Delay, d1 36.3 40.7 39.4 43.2 28.3 15.1 11.7 17.5Progression Factor 1.00 1.00 1.00 1.00 1.79 0.77 1.00 1.00Incremental Delay, d2 2.1 0.2 0.5 0.2 29.3 1.8 0.8 3.9Delay (s) 38.4 40.9 40.0 43.4 80.0 13.4 12.5 21.4Level of Service D D D D F B B CApproach Delay (s) 40.0 42.5 19.5 21.1Approach LOS D D B C
Intersection SummaryHCM Average Control Delay 23.1 HCM Level of Service CHCM Volume to Capacity ratio 0.79Actuated Cycle Length (s) 110.0 Sum of lost time (s) 12.0Intersection Capacity Utilization 79.5% ICU Level of Service DAnalysis Period (min) 15c Critical Lane Group
Lanes, Volumes, Timings Saturday Peak Hour6: IcePlex & Appleby Line Total Future Volumes
Synchro 6 ReportDillon Consulting Limited
Lane Group EBL EBT EBR WBL WBT WBR NBL NBT NBR SBL SBT SBRLane ConfigurationsIdeal Flow (vphpl) 1900 1900 1900 1900 1900 1900 1900 1900 1900 1900 1900 1900Storage Length (m) 0.0 0.0 0.0 0.0 30.0 0.0 30.0 0.0Storage Lanes 0 0 0 0 1 0 1 0Total Lost Time (s) 4.0 4.0 4.0 4.0 4.0 4.0 4.0 4.0 4.0 4.0 4.0 4.0Leading Detector (m) 15.2 15.2 15.2 15.2 15.2 15.2 15.2 15.2Trailing Detector (m) 0.0 0.0 0.0 0.0 0.0 0.0 0.0 0.0Turning Speed (k/h) 24 14 24 14 24 14 24 14Lane Util. Factor 1.00 1.00 1.00 1.00 1.00 1.00 1.00 0.95 0.95 1.00 0.95 0.95Frt 0.932 0.946 0.992Flt Protected 0.976 0.971 0.950 0.950Satd. Flow (prot) 0 1748 0 0 1765 0 1217 3587 0 1825 3614 0Flt Permitted 0.893 0.817 0.071 0.067Satd. Flow (perm) 0 1599 0 0 1485 0 91 3587 0 129 3614 0Right Turn on Red Yes Yes Yes YesSatd. Flow (RTOR) 6 32 7 1Headway Factor 0.99 0.99 0.99 0.99 0.99 0.99 0.99 0.99 0.99 0.99 0.99 0.99Link Speed (k/h) 25 25 60 60Link Distance (m) 111.2 81.8 173.7 63.0Travel Time (s) 16.0 11.8 10.4 3.8Volume (vph) 6 0 6 99 0 66 6 1570 83 66 1721 6Peak Hour Factor 0.95 0.95 0.95 0.95 0.95 0.95 0.95 0.95 0.95 0.95 0.95 0.95Heavy Vehicles (%) 0% 0% 0% 0% 0% 0% 50% 1% 0% 0% 1% 0%Adj. Flow (vph) 6 0 6 104 0 69 6 1653 87 69 1812 6Lane Group Flow (vph) 0 12 0 0 173 0 6 1740 0 69 1818 0Turn Type Perm Perm Perm pm+ptProtected Phases 4 8 2 1 6Permitted Phases 4 8 2 6Detector Phases 4 4 8 8 2 2 1 6Minimum Initial (s) 8.0 8.0 8.0 8.0 8.0 8.0 7.0 8.0Minimum Split (s) 29.0 29.0 29.0 29.0 29.0 29.0 11.0 29.0Total Split (s) 39.0 39.0 0.0 39.0 39.0 0.0 60.0 60.0 0.0 11.0 71.0 0.0Total Split (%) 35.5% 35.5% 0.0% 35.5% 35.5% 0.0% 54.5% 54.5% 0.0% 10.0% 64.5% 0.0%Maximum Green (s) 32.0 32.0 32.0 32.0 53.0 53.0 7.0 64.0Yellow Time (s) 4.0 4.0 4.0 4.0 4.0 4.0 3.0 4.0All-Red Time (s) 3.0 3.0 3.0 3.0 3.0 3.0 1.0 3.0Lead/Lag Lag Lag LeadLead-Lag Optimize? Yes Yes YesVehicle Extension (s) 3.0 3.0 3.0 3.0 3.0 3.0 3.0 3.0Recall Mode None None None None C-Max C-Max None C-MaxWalk Time (s) 7.0 7.0 7.0 7.0 7.0 7.0 7.0Flash Dont Walk (s) 15.0 15.0 15.0 15.0 12.0 12.0 12.0Pedestrian Calls (#/hr) 0 0 0 0 0 0 0Act Effct Green (s) 18.2 18.2 75.0 75.0 83.8 83.8Actuated g/C Ratio 0.17 0.17 0.68 0.68 0.76 0.76v/c Ratio 0.04 0.64 0.10 0.71 0.33 0.66Control Delay 25.5 44.5 13.3 14.5 11.9 15.4Queue Delay 0.0 0.0 0.0 0.0 0.0 0.0Total Delay 25.5 44.5 13.3 14.5 11.9 15.4

Lanes, Volumes, Timings Saturday Peak Hour6: IcePlex & Appleby Line Total Future Volumes
Synchro 6 ReportDillon Consulting Limited
Lane Group EBL EBT EBR WBL WBT WBR NBL NBT NBR SBL SBT SBRLOS C D B B B BApproach Delay 25.5 44.5 14.5 15.3Approach LOS C D B B
Intersection SummaryArea Type: OtherCycle Length: 110Actuated Cycle Length: 110Offset: 15 (14%), Referenced to phase 2:NBTL and 6:SBTL, Start of YellowNatural Cycle: 90Control Type: Actuated-CoordinatedMaximum v/c Ratio: 0.71Intersection Signal Delay: 16.3 Intersection LOS: BIntersection Capacity Utilization 74.3% ICU Level of Service DAnalysis Period (min) 15
Splits and Phases: 6: IcePlex & Appleby Line
HCM Signalized Intersection Capacity Analysis Saturday Peak Hour6: IcePlex & Appleby Line Total Future Volumes
Synchro 6 ReportDillon Consulting Limited
Movement EBL EBT EBR WBL WBT WBR NBL NBT NBR SBL SBT SBRLane ConfigurationsIdeal Flow (vphpl) 1900 1900 1900 1900 1900 1900 1900 1900 1900 1900 1900 1900Total Lost time (s) 4.0 4.0 4.0 4.0 4.0 4.0Lane Util. Factor 1.00 1.00 1.00 0.95 1.00 0.95Frt 0.93 0.95 1.00 0.99 1.00 1.00Flt Protected 0.98 0.97 0.95 1.00 0.95 1.00Satd. Flow (prot) 1748 1765 1217 3589 1825 3612Flt Permitted 0.87 0.81 0.10 1.00 0.07 1.00Satd. Flow (perm) 1567 1470 126 3589 137 3612Volume (vph) 6 0 6 99 0 66 6 1570 83 66 1721 6Peak-hour factor, PHF 0.95 0.95 0.95 0.95 0.95 0.95 0.95 0.95 0.95 0.95 0.95 0.95Adj. Flow (vph) 6 0 6 104 0 69 6 1653 87 69 1812 6RTOR Reduction (vph) 0 5 0 0 27 0 0 2 0 0 0 0Lane Group Flow (vph) 0 7 0 0 146 0 6 1738 0 69 1818 0Heavy Vehicles (%) 0% 0% 0% 0% 0% 0% 50% 1% 0% 0% 1% 0%Turn Type Perm Perm Perm pm+ptProtected Phases 4 8 2 1 6Permitted Phases 4 8 2 6Actuated Green, G (s) 15.2 15.2 71.2 71.2 80.8 80.8Effective Green, g (s) 18.2 18.2 74.2 74.2 83.8 83.8Actuated g/C Ratio 0.17 0.17 0.67 0.67 0.76 0.76Clearance Time (s) 7.0 7.0 7.0 7.0 4.0 7.0Vehicle Extension (s) 3.0 3.0 3.0 3.0 3.0 3.0Lane Grp Cap (vph) 259 243 85 2421 190 2752v/s Ratio Prot c0.48 0.02 c0.50v/s Ratio Perm 0.00 c0.10 0.05 0.26v/c Ratio 0.03 0.60 0.07 0.72 0.36 0.66Uniform Delay, d1 38.5 42.5 6.1 11.3 11.7 6.3Progression Factor 1.00 1.00 1.00 1.00 2.06 2.01Incremental Delay, d2 0.0 4.2 1.6 1.9 0.9 0.9Delay (s) 38.5 46.7 7.7 13.2 25.0 13.6Level of Service D D A B C BApproach Delay (s) 38.5 46.7 13.1 14.0Approach LOS D D B B
Intersection SummaryHCM Average Control Delay 15.2 HCM Level of Service BHCM Volume to Capacity ratio 0.70Actuated Cycle Length (s) 110.0 Sum of lost time (s) 12.0Intersection Capacity Utilization 74.3% ICU Level of Service DAnalysis Period (min) 15c Critical Lane Group

HCM Unsignalized Intersection Capacity Analysis Saturday Peak Hour9: Storage Spot A&W & Appleby Line Total Future Volumes
Synchro 6 ReportDillon Consulting Limited
Movement WBL WBR NBT NBR SBL SBTLane ConfigurationsSign Control Yield Free FreeGrade 0% 0% 0%Volume (veh/h) 17 28 1631 11 22 1777Peak Hour Factor 0.95 0.95 0.95 0.95 0.95 0.95Hourly flow rate (vph) 18 29 1717 12 23 1871PedestriansLane Width (m)Walking Speed (m/s)Percent BlockageRight turn flare (veh)Median type TWLTLMedian storage veh) 1Upstream signal (m) 63 259pX, platoon unblocked 0.77 0.68 0.68vC, conflicting volume 2704 864 1728vC1, stage 1 conf vol 1723vC2, stage 2 conf vol 982vCu, unblocked vol 1681 339 1603tC, single (s) 6.8 6.9 4.1tC, 2 stage (s) 5.8tF (s) 3.5 3.3 2.2p0 queue free % 80 93 92cM capacity (veh/h) 90 449 276
Direction, Lane # WB 1 WB 2 NB 1 NB 2 SB 1 SB 2 SB 3Volume Total 18 29 1145 584 23 935 935Volume Left 18 0 0 0 23 0 0Volume Right 0 29 0 12 0 0 0cSH 90 449 1700 1700 276 1700 1700Volume to Capacity 0.20 0.07 0.67 0.34 0.08 0.55 0.55Queue Length 95th (m) 5.2 1.6 0.0 0.0 2.1 0.0 0.0Control Delay (s) 54.5 13.6 0.0 0.0 19.2 0.0 0.0Lane LOS F B CApproach Delay (s) 29.1 0.0 0.2Approach LOS D
Intersection SummaryAverage Delay 0.5Intersection Capacity Utilization 59.1% ICU Level of Service BAnalysis Period (min) 15
HCM Unsignalized Intersection Capacity Analysis Saturday Peak Hour11: New Development & Appleby Line Total Future Volumes
Synchro 6 ReportDillon Consulting Limited
Movement WBL WBR NBT NBR SBL SBTLane ConfigurationsSign Control Yield Free FreeGrade 0% 0% 0%Volume (veh/h) 0 184 1536 122 86 1719Peak Hour Factor 0.95 0.95 0.95 0.95 0.95 0.95Hourly flow rate (vph) 0 194 1617 128 91 1809PedestriansLane Width (m)Walking Speed (m/s)Percent BlockageRight turn flare (veh)Median type TWLTLMedian storage veh) 1Upstream signal (m) 124 198pX, platoon unblocked 0.77 0.68 0.68vC, conflicting volume 2767 873 1745vC1, stage 1 conf vol 1681vC2, stage 2 conf vol 1086vCu, unblocked vol 1742 338 1625tC, single (s) 6.8 6.9 4.1tC, 2 stage (s) 5.8tF (s) 3.5 3.3 2.2p0 queue free % 100 57 66cM capacity (veh/h) 84 446 269
Direction, Lane # WB 1 NB 1 NB 2 SB 1 SB 2 SB 3Volume Total 194 1078 667 91 905 905Volume Left 0 0 0 91 0 0Volume Right 194 0 128 0 0 0cSH 446 1700 1700 269 1700 1700Volume to Capacity 0.43 0.63 0.39 0.34 0.53 0.53Queue Length 95th (m) 16.4 0.0 0.0 10.9 0.0 0.0Control Delay (s) 19.1 0.0 0.0 25.0 0.0 0.0Lane LOS C DApproach Delay (s) 19.1 0.0 1.2Approach LOS C
Intersection SummaryAverage Delay 1.6Intersection Capacity Utilization 64.4% ICU Level of Service CAnalysis Period (min) 15

Lanes, Volumes, Timings PM Peak Hour6: IcePlex & Appleby Line Total Future Volume - Diversion
Synchro 6 ReportDillon Consulting Limited
Lane Group EBL EBT EBR WBL WBT WBR NBL NBT NBR SBL SBT SBRLane ConfigurationsIdeal Flow (vphpl) 1900 1900 1900 1900 1900 1900 1900 1900 1900 1900 1900 1900Storage Length (m) 0.0 0.0 0.0 0.0 30.0 0.0 30.0 0.0Storage Lanes 0 0 0 0 1 0 1 0Total Lost Time (s) 4.0 4.0 4.0 4.0 4.0 4.0 4.0 4.0 4.0 4.0 4.0 4.0Leading Detector (m) 15.2 15.2 15.2 15.2 15.2 15.2 15.2 15.2Trailing Detector (m) 0.0 0.0 0.0 0.0 0.0 0.0 0.0 0.0Turning Speed (k/h) 24 14 24 14 24 14 24 14Lane Util. Factor 1.00 1.00 1.00 1.00 1.00 1.00 1.00 0.95 0.95 1.00 0.95 0.95Frt 0.888 0.968 0.997Flt Protected 0.992 0.963 0.950 0.950Satd. Flow (prot) 0 1528 0 0 1791 0 1304 3535 0 1825 3510 0Flt Permitted 0.963 0.780 0.124 0.044Satd. Flow (perm) 0 1483 0 0 1451 0 170 3535 0 85 3510 0Right Turn on Red Yes Yes Yes YesSatd. Flow (RTOR) 29 11 2Headway Factor 0.99 0.99 0.99 0.99 0.99 0.99 0.99 0.99 0.99 0.99 0.99 0.99Link Speed (k/h) 25 25 60 60Link Distance (m) 111.2 81.8 173.7 63.0Travel Time (s) 16.0 11.8 10.4 3.8Volume (vph) 6 0 28 55 0 17 6 2160 39 28 1509 0Peak Hour Factor 0.96 0.96 0.96 0.96 0.96 0.96 0.96 0.96 0.96 0.96 0.96 0.96Heavy Vehicles (%) 0% 0% 13% 0% 0% 0% 40% 3% 0% 0% 4% 0%Adj. Flow (vph) 6 0 29 57 0 18 6 2250 41 29 1572 0Lane Group Flow (vph) 0 35 0 0 75 0 6 2291 0 29 1572 0Turn Type Perm Perm Perm pm+ptProtected Phases 4 8 2 1 6Permitted Phases 4 8 2 6Detector Phases 4 4 8 8 2 2 1 6Minimum Initial (s) 8.0 8.0 8.0 8.0 8.0 8.0 7.0 8.0Minimum Split (s) 29.0 29.0 29.0 29.0 29.0 29.0 11.0 29.0Total Split (s) 38.0 38.0 0.0 38.0 38.0 0.0 90.0 90.0 0.0 12.0 102.0 0.0Total Split (%) 27.1% 27.1% 0.0% 27.1% 27.1% 0.0% 64.3% 64.3% 0.0% 8.6% 72.9% 0.0%Maximum Green (s) 31.0 31.0 31.0 31.0 83.0 83.0 8.0 95.0Yellow Time (s) 4.0 4.0 4.0 4.0 4.0 4.0 3.0 4.0All-Red Time (s) 3.0 3.0 3.0 3.0 3.0 3.0 1.0 3.0Lead/Lag Lag Lag LeadLead-Lag Optimize? Yes Yes YesVehicle Extension (s) 3.0 3.0 3.0 3.0 3.0 3.0 3.0 3.0Recall Mode None None None None C-Max C-Max None C-MaxWalk Time (s) 7.0 7.0 7.0 7.0 7.0 7.0 7.0Flash Dont Walk (s) 15.0 15.0 15.0 15.0 12.0 12.0 12.0Pedestrian Calls (#/hr) 0 0 0 0 0 0 0Act Effct Green (s) 14.5 14.5 114.5 114.5 120.5 121.3Actuated g/C Ratio 0.10 0.10 0.82 0.82 0.86 0.87v/c Ratio 0.19 0.47 0.04 0.79 0.18 0.52Control Delay 24.4 59.1 6.0 12.9 6.4 12.1Queue Delay 0.0 0.0 0.0 0.0 0.0 0.0Total Delay 24.4 59.1 6.0 12.9 6.4 12.1
Lanes, Volumes, Timings PM Peak Hour6: IcePlex & Appleby Line Total Future Volume - Diversion
Synchro 6 ReportDillon Consulting Limited
Lane Group EBL EBT EBR WBL WBT WBR NBL NBT NBR SBL SBT SBRLOS C E A B A BApproach Delay 24.4 59.1 12.8 12.0Approach LOS C E B B
Intersection SummaryArea Type: OtherCycle Length: 140Actuated Cycle Length: 140Offset: 68 (49%), Referenced to phase 2:NBTL and 6:SBTL, Start of YellowNatural Cycle: 120Control Type: Actuated-CoordinatedMaximum v/c Ratio: 0.79Intersection Signal Delay: 13.5 Intersection LOS: BIntersection Capacity Utilization 78.4% ICU Level of Service DAnalysis Period (min) 15
Splits and Phases: 6: IcePlex & Appleby Line
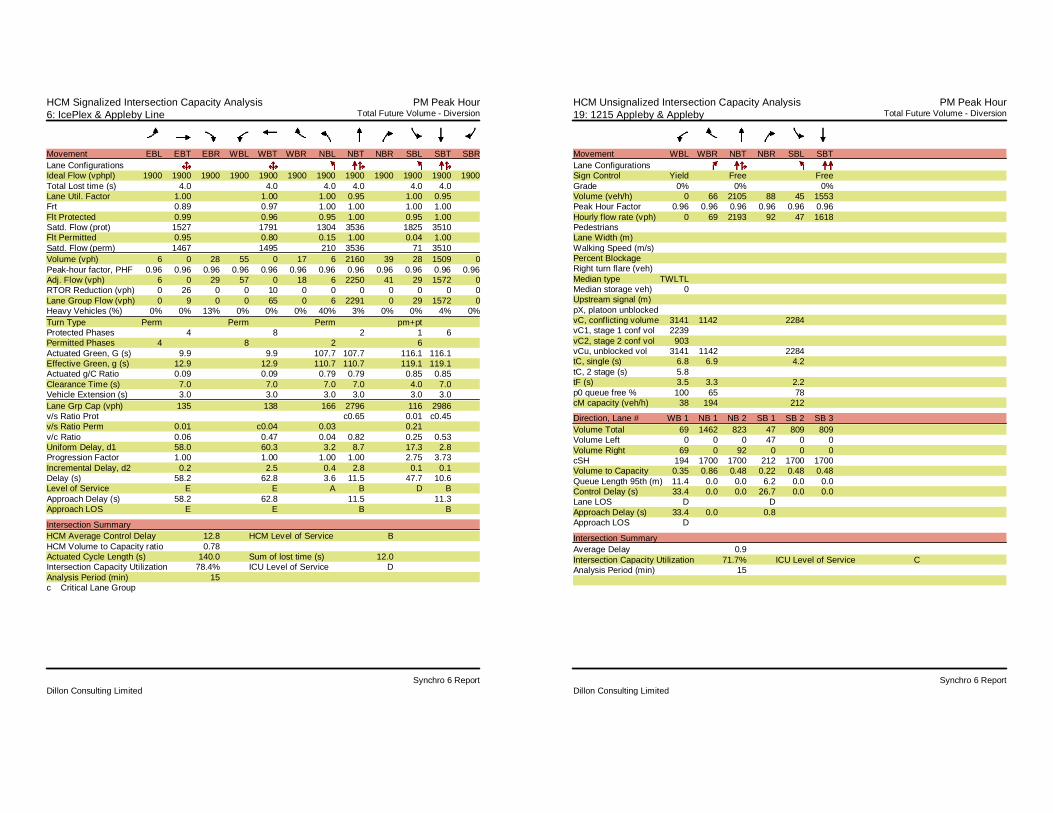
HCM Signalized Intersection Capacity Analysis PM Peak Hour6: IcePlex & Appleby Line Total Future Volume - Diversion
Synchro 6 ReportDillon Consulting Limited
Movement EBL EBT EBR WBL WBT WBR NBL NBT NBR SBL SBT SBRLane ConfigurationsIdeal Flow (vphpl) 1900 1900 1900 1900 1900 1900 1900 1900 1900 1900 1900 1900Total Lost time (s) 4.0 4.0 4.0 4.0 4.0 4.0Lane Util. Factor 1.00 1.00 1.00 0.95 1.00 0.95Frt 0.89 0.97 1.00 1.00 1.00 1.00Flt Protected 0.99 0.96 0.95 1.00 0.95 1.00Satd. Flow (prot) 1527 1791 1304 3536 1825 3510Flt Permitted 0.95 0.80 0.15 1.00 0.04 1.00Satd. Flow (perm) 1467 1495 210 3536 71 3510Volume (vph) 6 0 28 55 0 17 6 2160 39 28 1509 0Peak-hour factor, PHF 0.96 0.96 0.96 0.96 0.96 0.96 0.96 0.96 0.96 0.96 0.96 0.96Adj. Flow (vph) 6 0 29 57 0 18 6 2250 41 29 1572 0RTOR Reduction (vph) 0 26 0 0 10 0 0 0 0 0 0 0Lane Group Flow (vph) 0 9 0 0 65 0 6 2291 0 29 1572 0Heavy Vehicles (%) 0% 0% 13% 0% 0% 0% 40% 3% 0% 0% 4% 0%Turn Type Perm Perm Perm pm+ptProtected Phases 4 8 2 1 6Permitted Phases 4 8 2 6Actuated Green, G (s) 9.9 9.9 107.7 107.7 116.1 116.1Effective Green, g (s) 12.9 12.9 110.7 110.7 119.1 119.1Actuated g/C Ratio 0.09 0.09 0.79 0.79 0.85 0.85Clearance Time (s) 7.0 7.0 7.0 7.0 4.0 7.0Vehicle Extension (s) 3.0 3.0 3.0 3.0 3.0 3.0Lane Grp Cap (vph) 135 138 166 2796 116 2986v/s Ratio Prot c0.65 0.01 c0.45v/s Ratio Perm 0.01 c0.04 0.03 0.21v/c Ratio 0.06 0.47 0.04 0.82 0.25 0.53Uniform Delay, d1 58.0 60.3 3.2 8.7 17.3 2.8Progression Factor 1.00 1.00 1.00 1.00 2.75 3.73Incremental Delay, d2 0.2 2.5 0.4 2.8 0.1 0.1Delay (s) 58.2 62.8 3.6 11.5 47.7 10.6Level of Service E E A B D BApproach Delay (s) 58.2 62.8 11.5 11.3Approach LOS E E B B
Intersection SummaryHCM Average Control Delay 12.8 HCM Level of Service BHCM Volume to Capacity ratio 0.78Actuated Cycle Length (s) 140.0 Sum of lost time (s) 12.0Intersection Capacity Utilization 78.4% ICU Level of Service DAnalysis Period (min) 15c Critical Lane Group
HCM Unsignalized Intersection Capacity Analysis PM Peak Hour19: 1215 Appleby & Appleby Total Future Volume - Diversion
Synchro 6 ReportDillon Consulting Limited
Movement WBL WBR NBT NBR SBL SBTLane ConfigurationsSign Control Yield Free FreeGrade 0% 0% 0%Volume (veh/h) 0 66 2105 88 45 1553Peak Hour Factor 0.96 0.96 0.96 0.96 0.96 0.96Hourly flow rate (vph) 0 69 2193 92 47 1618PedestriansLane Width (m)Walking Speed (m/s)Percent BlockageRight turn flare (veh)Median type TWLTLMedian storage veh) 0Upstream signal (m)pX, platoon unblockedvC, conflicting volume 3141 1142 2284vC1, stage 1 conf vol 2239vC2, stage 2 conf vol 903vCu, unblocked vol 3141 1142 2284tC, single (s) 6.8 6.9 4.2tC, 2 stage (s) 5.8tF (s) 3.5 3.3 2.2p0 queue free % 100 65 78cM capacity (veh/h) 38 194 212
Direction, Lane # WB 1 NB 1 NB 2 SB 1 SB 2 SB 3Volume Total 69 1462 823 47 809 809Volume Left 0 0 0 47 0 0Volume Right 69 0 92 0 0 0cSH 194 1700 1700 212 1700 1700Volume to Capacity 0.35 0.86 0.48 0.22 0.48 0.48Queue Length 95th (m) 11.4 0.0 0.0 6.2 0.0 0.0Control Delay (s) 33.4 0.0 0.0 26.7 0.0 0.0Lane LOS D DApproach Delay (s) 33.4 0.0 0.8Approach LOS D
Intersection SummaryAverage Delay 0.9Intersection Capacity Utilization 71.7% ICU Level of Service CAnalysis Period (min) 15
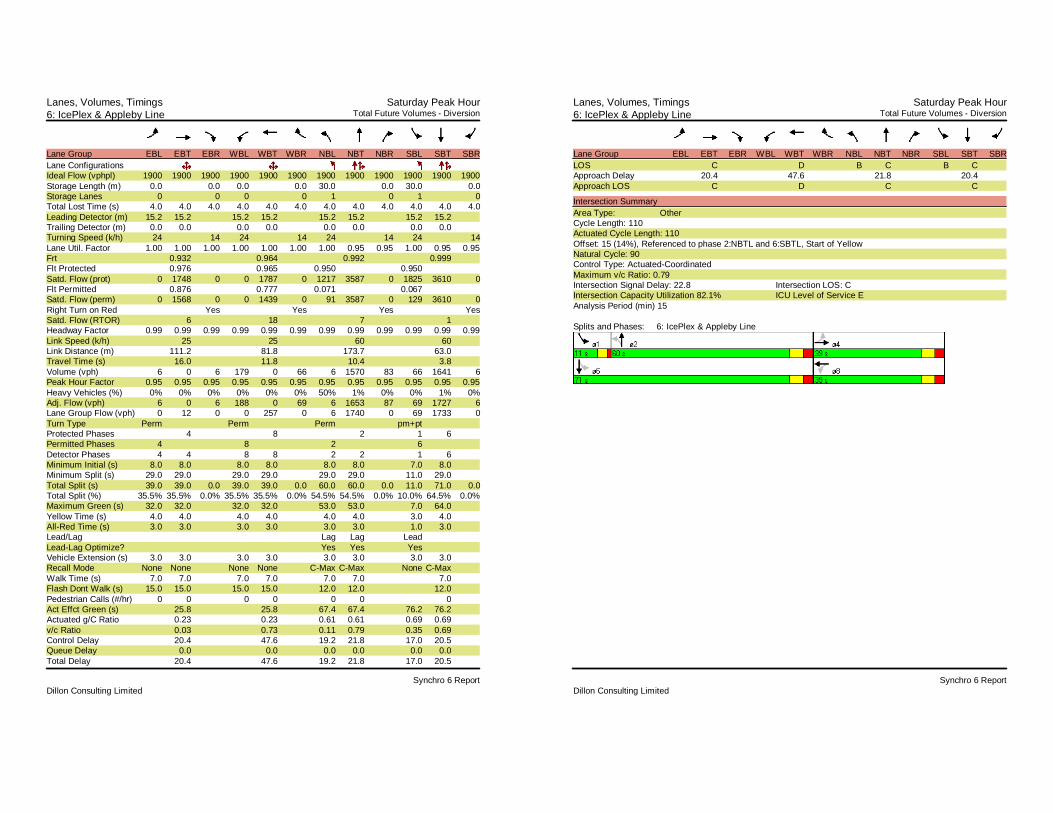
Lanes, Volumes, Timings Saturday Peak Hour6: IcePlex & Appleby Line Total Future Volumes - Diversion
Synchro 6 ReportDillon Consulting Limited
Lane Group EBL EBT EBR WBL WBT WBR NBL NBT NBR SBL SBT SBRLane ConfigurationsIdeal Flow (vphpl) 1900 1900 1900 1900 1900 1900 1900 1900 1900 1900 1900 1900Storage Length (m) 0.0 0.0 0.0 0.0 30.0 0.0 30.0 0.0Storage Lanes 0 0 0 0 1 0 1 0Total Lost Time (s) 4.0 4.0 4.0 4.0 4.0 4.0 4.0 4.0 4.0 4.0 4.0 4.0Leading Detector (m) 15.2 15.2 15.2 15.2 15.2 15.2 15.2 15.2Trailing Detector (m) 0.0 0.0 0.0 0.0 0.0 0.0 0.0 0.0Turning Speed (k/h) 24 14 24 14 24 14 24 14Lane Util. Factor 1.00 1.00 1.00 1.00 1.00 1.00 1.00 0.95 0.95 1.00 0.95 0.95Frt 0.932 0.964 0.992 0.999Flt Protected 0.976 0.965 0.950 0.950Satd. Flow (prot) 0 1748 0 0 1787 0 1217 3587 0 1825 3610 0Flt Permitted 0.876 0.777 0.071 0.067Satd. Flow (perm) 0 1568 0 0 1439 0 91 3587 0 129 3610 0Right Turn on Red Yes Yes Yes YesSatd. Flow (RTOR) 6 18 7 1Headway Factor 0.99 0.99 0.99 0.99 0.99 0.99 0.99 0.99 0.99 0.99 0.99 0.99Link Speed (k/h) 25 25 60 60Link Distance (m) 111.2 81.8 173.7 63.0Travel Time (s) 16.0 11.8 10.4 3.8Volume (vph) 6 0 6 179 0 66 6 1570 83 66 1641 6Peak Hour Factor 0.95 0.95 0.95 0.95 0.95 0.95 0.95 0.95 0.95 0.95 0.95 0.95Heavy Vehicles (%) 0% 0% 0% 0% 0% 0% 50% 1% 0% 0% 1% 0%Adj. Flow (vph) 6 0 6 188 0 69 6 1653 87 69 1727 6Lane Group Flow (vph) 0 12 0 0 257 0 6 1740 0 69 1733 0Turn Type Perm Perm Perm pm+ptProtected Phases 4 8 2 1 6Permitted Phases 4 8 2 6Detector Phases 4 4 8 8 2 2 1 6Minimum Initial (s) 8.0 8.0 8.0 8.0 8.0 8.0 7.0 8.0Minimum Split (s) 29.0 29.0 29.0 29.0 29.0 29.0 11.0 29.0Total Split (s) 39.0 39.0 0.0 39.0 39.0 0.0 60.0 60.0 0.0 11.0 71.0 0.0Total Split (%) 35.5% 35.5% 0.0% 35.5% 35.5% 0.0% 54.5% 54.5% 0.0% 10.0% 64.5% 0.0%Maximum Green (s) 32.0 32.0 32.0 32.0 53.0 53.0 7.0 64.0Yellow Time (s) 4.0 4.0 4.0 4.0 4.0 4.0 3.0 4.0All-Red Time (s) 3.0 3.0 3.0 3.0 3.0 3.0 1.0 3.0Lead/Lag Lag Lag LeadLead-Lag Optimize? Yes Yes YesVehicle Extension (s) 3.0 3.0 3.0 3.0 3.0 3.0 3.0 3.0Recall Mode None None None None C-Max C-Max None C-MaxWalk Time (s) 7.0 7.0 7.0 7.0 7.0 7.0 7.0Flash Dont Walk (s) 15.0 15.0 15.0 15.0 12.0 12.0 12.0Pedestrian Calls (#/hr) 0 0 0 0 0 0 0Act Effct Green (s) 25.8 25.8 67.4 67.4 76.2 76.2Actuated g/C Ratio 0.23 0.23 0.61 0.61 0.69 0.69v/c Ratio 0.03 0.73 0.11 0.79 0.35 0.69Control Delay 20.4 47.6 19.2 21.8 17.0 20.5Queue Delay 0.0 0.0 0.0 0.0 0.0 0.0Total Delay 20.4 47.6 19.2 21.8 17.0 20.5
Lanes, Volumes, Timings Saturday Peak Hour6: IcePlex & Appleby Line Total Future Volumes - Diversion
Synchro 6 ReportDillon Consulting Limited
Lane Group EBL EBT EBR WBL WBT WBR NBL NBT NBR SBL SBT SBRLOS C D B C B CApproach Delay 20.4 47.6 21.8 20.4Approach LOS C D C C
Intersection SummaryArea Type: OtherCycle Length: 110Actuated Cycle Length: 110Offset: 15 (14%), Referenced to phase 2:NBTL and 6:SBTL, Start of YellowNatural Cycle: 90Control Type: Actuated-CoordinatedMaximum v/c Ratio: 0.79Intersection Signal Delay: 22.8 Intersection LOS: CIntersection Capacity Utilization 82.1% ICU Level of Service EAnalysis Period (min) 15
Splits and Phases: 6: IcePlex & Appleby Line

HCM Signalized Intersection Capacity Analysis Saturday Peak Hour6: IcePlex & Appleby Line Total Future Volumes - Diversion
Synchro 6 ReportDillon Consulting Limited
Movement EBL EBT EBR WBL WBT WBR NBL NBT NBR SBL SBT SBRLane ConfigurationsIdeal Flow (vphpl) 1900 1900 1900 1900 1900 1900 1900 1900 1900 1900 1900 1900Total Lost time (s) 4.0 4.0 4.0 4.0 4.0 4.0Lane Util. Factor 1.00 1.00 1.00 0.95 1.00 0.95Frt 0.93 0.96 1.00 0.99 1.00 1.00Flt Protected 0.98 0.96 0.95 1.00 0.95 1.00Satd. Flow (prot) 1748 1786 1217 3589 1825 3612Flt Permitted 0.88 0.78 0.09 1.00 0.06 1.00Satd. Flow (perm) 1570 1438 120 3589 109 3612Volume (vph) 6 0 6 179 0 66 6 1570 83 66 1641 6Peak-hour factor, PHF 0.95 0.95 0.95 0.95 0.95 0.95 0.95 0.95 0.95 0.95 0.95 0.95Adj. Flow (vph) 6 0 6 188 0 69 6 1653 87 69 1727 6RTOR Reduction (vph) 0 5 0 0 14 0 0 3 0 0 0 0Lane Group Flow (vph) 0 7 0 0 243 0 6 1737 0 69 1733 0Heavy Vehicles (%) 0% 0% 0% 0% 0% 0% 50% 1% 0% 0% 1% 0%Turn Type Perm Perm Perm pm+ptProtected Phases 4 8 2 1 6Permitted Phases 4 8 2 6Actuated Green, G (s) 22.8 22.8 63.6 63.6 73.2 73.2Effective Green, g (s) 25.8 25.8 66.6 66.6 76.2 76.2Actuated g/C Ratio 0.23 0.23 0.61 0.61 0.69 0.69Clearance Time (s) 7.0 7.0 7.0 7.0 4.0 7.0Vehicle Extension (s) 3.0 3.0 3.0 3.0 3.0 3.0Lane Grp Cap (vph) 368 337 73 2173 163 2502v/s Ratio Prot c0.48 0.02 c0.48v/s Ratio Perm 0.00 c0.17 0.05 0.27v/c Ratio 0.02 0.72 0.08 0.80 0.42 0.69Uniform Delay, d1 32.4 38.8 9.0 16.6 17.3 10.0Progression Factor 1.00 1.00 1.00 1.00 1.92 1.68Incremental Delay, d2 0.0 7.4 2.2 3.2 1.3 1.2Delay (s) 32.4 46.2 11.2 19.8 34.5 18.0Level of Service C D B B C BApproach Delay (s) 32.4 46.2 19.8 18.6Approach LOS C D B B
Intersection SummaryHCM Average Control Delay 21.0 HCM Level of Service CHCM Volume to Capacity ratio 0.78Actuated Cycle Length (s) 110.0 Sum of lost time (s) 12.0Intersection Capacity Utilization 82.1% ICU Level of Service EAnalysis Period (min) 15c Critical Lane Group
HCM Unsignalized Intersection Capacity Analysis Saturday Peak Hour11: New Development & Appleby Line Total Future Volumes - Diversion
Synchro 6 ReportDillon Consulting Limited
Movement WBL WBR NBT NBR SBL SBTLane ConfigurationsSign Control Yield Free FreeGrade 0% 0% 0%Volume (veh/h) 0 104 1536 122 86 1719Peak Hour Factor 0.95 0.95 0.95 0.95 0.95 0.95Hourly flow rate (vph) 0 109 1617 128 91 1809PedestriansLane Width (m)Walking Speed (m/s)Percent BlockageRight turn flare (veh)Median type TWLTLMedian storage veh) 1Upstream signal (m) 124 198pX, platoon unblocked 0.80 0.61 0.61vC, conflicting volume 2767 873 1745vC1, stage 1 conf vol 1681vC2, stage 2 conf vol 1086vCu, unblocked vol 1508 162 1585tC, single (s) 6.8 6.9 4.1tC, 2 stage (s) 5.8tF (s) 3.5 3.3 2.2p0 queue free % 100 79 64cM capacity (veh/h) 88 524 252
Direction, Lane # WB 1 NB 1 NB 2 SB 1 SB 2 SB 3Volume Total 109 1078 667 91 905 905Volume Left 0 0 0 91 0 0Volume Right 109 0 128 0 0 0cSH 524 1700 1700 252 1700 1700Volume to Capacity 0.21 0.63 0.39 0.36 0.53 0.53Queue Length 95th (m) 5.9 0.0 0.0 11.9 0.0 0.0Control Delay (s) 13.7 0.0 0.0 27.1 0.0 0.0Lane LOS B DApproach Delay (s) 13.7 0.0 1.3Approach LOS B
Intersection SummaryAverage Delay 1.1Intersection Capacity Utilization 59.4% ICU Level of Service BAnalysis Period (min) 15