traffic impact assessment · 1.1 project background 1 1.2 purpose 2 ... d r a f t p:\60028255 v07pu...
TRANSCRIPT

AECOMShepparton North East Growth AreaPrecinct Structure Plan
D R A F T
C:\Documents and Settings\jensenbr\Local Settings\Temporary Internet Files\Content.MSO\DF1103FA.tmpRevision 0 - 2 Feburary 2010 F
Appendix F
Traffic ImpactAssessment

AECOMShepparton North East Growth AreaPrecinct Structure Plan
D R A F T
C:\Documents and Settings\jensenbr\Local Settings\Temporary Internet Files\Content.MSO\DF1103FA.tmpRevision 0 - 2 Feburary 2010 F-1
Appendix F Traffic Impact Assessment

Shepparton North East Growth Corridor Development
Sam Mondus
17 December 2009
Document No. 1007tpe
Traffic Impact Assessment

AECOMShepparton North East Growth Corridor DevelopmentTraffic Impact Assessment
D R A F T
P:\60028255 V07PU Shepparton\6_Draft_docs\6.1_Reports\Traffic and Transportation\Draft Report Nov 09\1007tpe Traffic Assessment 17Dec09.docxRevision - 17 December 2009
Traffic Impact Assessment
Prepared for
Sam Mondus
Prepared byAECOM Australia Pty LtdLevel 9, 8 Exhibition Street, Melbourne VIC 3000, AustraliaT +61 3 9653 1234 F +61 3 9654 7117 www.aecom.comABN 20 093 846 925
17 December 2009
600 282 55
© AECOM Australia Pty Ltd 2009
The information contained in this document produced by AECOM Australia Pty Ltd is solely for the use of the Client identified on the cover sheet for the purpose for which it has been prepared and AECOM Australia Pty Ltd undertakes no duty to or accepts any responsibility to any third party who may rely upon this document.
All rights reserved. No section or element of this document may be removed from this document, reproduced, electronically stored or transmitted in any form without the written permission of AECOM Australia Pty Ltd.

AECOMShepparton North East Growth Corridor DevelopmentTraffic Impact Assessment
D R A F T
P:\60028255 V07PU Shepparton\6_Draft_docs\6.1_Reports\Traffic and Transportation\Draft Report Nov 09\1007tpe Traffic Assessment 17Dec09.docxRevision - 17 December 2009
Quality InformationDocument Traffic Impact Assessment
Ref 600 282 55
Date 17 December 2009
Prepared by Kate Butler
Reviewed by Stephen Pelosi
Revision History
Revision Revision Date Details
Authorised
Name/Position Signature
0 17/12/2009 Draft Traffic Impact Assessment
Stephen Pelosi
AECOMShepparton North East Growth Corridor DevelopmentTraffic Impact Assessment
D R A F T
P:\60028255 V07PU Shepparton\6_Draft_docs\6.1_Reports\Traffic and Transportation\Draft Report Nov 09\1007tpe Traffic Assessment 17Dec09.docxRevision - 17 December 2009
Table of ContentsExecutive Summary i
1.0 Introduction 1
1.1 Project Background 1
1.2 Purpose 2
1.3 Outline of Investigations 2
1.4 Report Structure 2
2.0 Shepparton in Profile 3
2.1 Demographic Profile 3
2.1.1 Age Structure 3
2.1.2 Household Size 4
2.1.3 Household Types 4
2.1.4 Car Ownership 5
2.1.5 Type of Employment 6
2.1.6 Place of Employment 6
2.1.7 Travel to Work Modal Share 8
2.2 Demographic Conclusions 8
3.0 Existing Conditions 9
3.1 Site Locality 9
3.2 Road Network 9
3.3 Turning Movement Volume Surveys 10
3.4 Crash History 15
3.5 Committed Traffic Improvements and Developments 15
3.5.1 Shepparton Valley Bypass 15
3.5.2 Northern Neighbourhood Centre Extension 16
3.6 Cycle Network 16
4.0 Existing Traffic Operation 18
4.1 Overview of Local Road Network 18
4.2 SIDRA INTERSECTION Analysis 18
4.2.1 Degree of Saturation 18
4.2.2 Level of Service 19
4.2.3 Average Delay 19
4.2.4 Verney Road and Grahamvale Road Intersections 19
4.2.5 Hawkins Street / Goulburn Valley Highway 21
5.0 Proposed Development 23
5.1 Land Use 23
5.2 Car Parking Rates 23

AECOMShepparton North East Growth Corridor DevelopmentTraffic Impact Assessment
D R A F T
P:\60028255 V07PU Shepparton\6_Draft_docs\6.1_Reports\Traffic and Transportation\Draft Report Nov 09\1007tpe Traffic Assessment 17Dec09.docxRevision - 17 December 2009
5.2.1 Residential Car Parking 23
5.2.2 Retail Car Parking 23
6.0 Vehicular Traffic Generation and Distribution 25
6.1 Traffic Generation 25
6.1.1 Background Traffic Growth 25
6.1.2 Residential 25
6.1.3 Retail 25
6.1.4 Grahamvale Primary School 26
6.1.5 Primary School Traffic Generation Methodology 27
6.1.6 Total Peak Hour Trips 28
6.2 Vehicular Traffic Distribution 29
6.3 Summary of Forecast Traffic 30
7.0 Traffic Impact 31
7.1 Verney Road and Grahamvale Road Intersections 31
7.1.1 Verney Road Intersections 31
7.1.2 Grahamvale Road Intersections 32
7.2 Goulburn Valley Highway Intersections 33
7.2.1 Hawkins Street/ Goulburn Valley Highway Priority Intersection 33
7.3 Development Entrance Treatments 36
7.3.1 Verney Road Main Entrance 36
7.3.2 Verney Road /Pine Road Site Entrance 37
7.3.3 Grahamvale Road Site Entrance 39
7.3.4 Ford Road Site Entrance 40
7.4 Conclusions 40
7.4.1 Verney Road and Grahamvale Road Intersections 40
7.4.2 Hawkins Street / Goulburn Valley Highway Intersection 41
7.4.3 Development Entrance Treatments 41
8.0 Further Issues 42
8.1 Sustainable Transport Design 42
8.2 Encouraging Shepparton Bypass Development 42
Appendix AExisting Traffic Flows A
Appendix BSIDRA Analysis B
Appendix CAdditional Traffic Movement Distribution C
Appendix DCrash History Data D

AECOMShepparton North East Growth Corridor DevelopmentTraffic Impact Assessment
D R A F T
P:\60028255 V07PU Shepparton\6_Draft_docs\6.1_Reports\Traffic and Transportation\Draft Report Nov 09\1007tpe Traffic Assessment 17Dec09.docxRevision - 17 December 2009
List of Tables
Table 2.1: Projected Population for City of Greater Shepparton 3
Table 2.2: Household Size, City of Greater Shepparton 2006 4
Table 2.3: Family Composition, City of Greater Shepparton 2006 5
Table 2.4: Employment Industries for Residents, City of Shepparton 2006 6
Table 2.5: Employment Location, City of Greater Shepparton 2006 6
Table 2.6: Top 5 Local Government Areas of Employment for Residents, City of Greater Shepparton, 2006 7
Table 4.1: SIDRA Definition of Levels of Service and Delay 19
Table 4.2: Verney Road / Balaclava Road Existing Peak Hour Intersection Operation (Roundabout) 20
Table 4.3: Verney Road / Hawkins Street Existing AM Peak Intersection Operation (T-intersection) 20
Table 4.4: Verney Road / Pine Road Existing AM Peak Intersection Operation (T-intersection) 20
Table 4.5: Verney Road / Ford Road Existing Peak Hour Intersection Operation (Roundabout) 20
Table 4.6: Grahamvale Road / Dookie Shepparton Road Existing Peak Hour Intersection Operation (Roundabout) 21
Table 4.7: Grahamvale Road / Ford Road Existing Peak Hour Intersection Operation (Priority Junction) 21
Table 4.8: Hawkins Street / Goulburn Valley Highway SIDRA Analysis for 2008 Scenario 21
Table 4.9: Hawkins Street / Goulburn Valley Highway Signalised Intersection SIDRA Analysis for 2008 Scenario 22
Table 6.1: RTA Guide Generation Rates (October 2002) 26
Table 6.2: Total Trips Generated by Students on the External Road Network during the peak hour 27
Table 6.3: Total Trips Generated on the External Road Network during the peak hour 28
Table 6.4: Summary of Peak Hour Forecast Traffic Generated by the Development 30
Table 6.5: Summary of AM Peak Hour Forecast Traffic 30
Table 6.6: Summary of PM Peak hour Forecast Traffic 30
Table 7.1: Verney Road / Balaclava Road 2020 Peak Hour Roundabout Operation with Development Traffic 31
Table 7.2: Verney Road / Hawkins Street 2020 AM Peak Hour T-intersection Operation with Development Traffic 32
Table 7.3: Verney Road / Ford Road 2020 Peak Hour Roundabout Operation with Development Traffic 32
Table 7.4: Grahamvale Road / Dookie Shepparton Road 2020 Peak Hour Roundabout Operation with Development Traffic 33
Table 7.5: Grahamvale Road / Ford Road 2020 Peak Hour Priority Junction Operation with Development Traffic 33
Table 7.6: Estimated 2020 Traffic Flows 34
Table 7.7: Hawkins Street / Goulburn Valley Highway SIDRA Analysis for 2020 Scenario without Development Traffic 34
Table 7.8: Estimated 2020 Traffic Flows with Development Traffic 34
Table 7.9: Hawkins Street / Goulburn Valley Highway SIDRA Analysis for 2020 Scenario with Forecast Development Traffic 35
Table 7.10: Hawkins Street / Goulburn Valley Highway Signalised Intersection SIDRA Analysis for 2020 Scenario with Proposed Development 36

AECOMShepparton North East Growth Corridor DevelopmentTraffic Impact Assessment
D R A F T
P:\60028255 V07PU Shepparton\6_Draft_docs\6.1_Reports\Traffic and Transportation\Draft Report Nov 09\1007tpe Traffic Assessment 17Dec09.docxRevision - 17 December 2009
Table 7.11: Verney Road / Main Site Entrance 2020 Peak Hour Priority T-Intersection, with Development Traffic 37
Table 7.12: Verney Road / Pine Road Site Entrance 2020 Peak Hour Signalised Intersection, with Development Traffic 38
Table 7.13: Grahamvale Road Site Entrance 2020 Peak Hour Signalised Intersection, with Development Traffic 39
Table 7.14: Verney Road / Main Site Entrance 2020 Peak Hour Priority T-Intersection, with Development Traffic 40
List of Figures
Figure 1.1: Location of the Shepparton North-East Growth Area 1
Figure 2.1: Age Structure, City of Greater Shepparton 2006 4
Figure 2.2: Car Ownership Vehicles per Household, City of Greater Shepparton 2006 5
Figure 2.3: Map of Top Employment Locations, City of Greater Shepparton 2006 7
Figure 2.4: Residents Travel to Work Modal Share, City of Greater Shepparton 2006 8
Figure 3.1: Site Location 9
Figure 3.2: Survey Location 11
Figure 3.3: Verney Road / Balaclava Road AM Peak Hour Figure 3.4: Verney Road / Balaclava Road PM Peak Hour 12
Figure 3.5: Verney Road / Ford Road AM Peak Hour Figure 3.6: Verney Road / Ford Road PM Peak Hour 12
Figure 3.7: Grahamvale Rd/Dookie Shepprtn Rd AM Pk Hr Figure 3.8: Grahamvale Rd/Dookie Shepprtn Rd AM Pk Hr 13
Figure 3.9: Grahamvale Road / Ford Road AM Pk Hr Figure 3.10: Grahamvale Road / Ford Road PM Pk Hr 13
Figure 3.11: Hawkins Road / GV Hwy AM Pk Hr Figure 3.12: Hawkins Road / GV Hwy PM Pk Hr 14
Figure 3.13: Verney Road / Hawkins Street AM Pk Hr Figure 3.14: Verney Road / Pine Road AM Pk Hr 14
Figure 3.15: Verney Road / Hawkins Street 8:00am to 9:00am 14
Figure 3.16 Valley Bypass Route 16
Figure 3.17: Shepparton Cycle Network 17
Figure 6.1: Traffic Movement Distribution 29
Figure 7.1: Proposed Priority T-Intersection at Verney Road Main Site Intersection 37
Figure 7.2: Proposed Signalised Intersection at Verney Road / Pine Road Intersection 38
Figure 7.3: Proposed Signalised Intersection at Grahamvale Road Site Entrance Signalised Intersection 39
Figure 7.4: Proposed Priority T-Intersection at Ford Road Site Entrance Intersection 40

AECOMShepparton North East Growth Corridor DevelopmentTraffic Impact Assessment
D R A F T
P:\60028255 V07PU Shepparton\6_Draft_docs\6.1_Reports\Traffic and Transportation\Draft Report Nov 09\1007tpe Traffic Assessment 17Dec09.docxRevision - 17 December 2009
Executive SummaryAECOM has been requested by Sam Mondous to prepare a Traffic Impact Assessment to support the preparation of the Shepparton North East Growth Area Outline Development Plan.
The site is located approximately four kilometres north east of Shepparton town centre and is bordered to the east and west by Verney Road and Grahamvale Road respectively. These roads are proposed to provide access to the development.
The proposed development of the site comprises a residential with a complimentary retail and community component located at the heart of the development. As part of the development, it is also proposed to extend the Grahamvale Primary School (PS).
This assessment provides the findings from a traffic investigation undertaken to determine whether the existing road network can support the proposed development. It also details the improvements that will be necessary in order to minimise the impact of the development on the surrounding road network based upon the likely future development traffic.
The investigation has included:Data collection to establish existing AM and PM traffic volumes;A review of existing information pertinent to the investigation, including the current road network and capacity, the expected background traffic growth, committed developments in the area, committed road network improvements, the accident history and traffic patterns;The future development traffic generation and assignment has been assessed;The operation of the forecast road network with and without the proposed development has been analysed;andRecommendations have been made based on the current network and improvements necessary to the local road network based on forecast traffic generations.
Turning movement volume surveys were undertaken by Global Workforce on behalf of AECOM on Tuesday 5 August 2008 in the AM peak between 7:30am and 10:30am and in the PM peak between 3:00pm and 6:00pm.
During initial discussions with CGS Engineering Projects department it was agreed that the following four intersections would be most adversely affected by the proposed development (and would require analysis):
Verney Road and Balaclava RoadVerney Road and Ford RoadGrahamvale Road and New Dookie RoadGrahamvale Road and Ford Road
At the time discussions were carried out it was not apparent that there may be any significant impact on traffic along Hawkins Street and therefore the operation of the intersections of Hawkins Street / Verney Street and Hawkins Street / Goulbourn Valley Highway were not investigated.
However, CGS previously conducted surveys of the Hawkins Street / Goulbourn Valley Highway intersection in 2005 and these surveys have been utilised to analyse an estimation of current (2008) operation and future (2020) operation.
Additional surveys were also carried out by Global Workforce on behalf of AECOM on Thursday 19 November 2009 in the AM peak between 7:30am and 10:30am. The intersections surveyed at this time included:
Verney Road and Pine RoadVerney Road and Hawkins Street
Within the local road network the roads that are expected to be most significantly impacted by the development include Verney Road, Grahamvale Road, Hawkins Street, Pine Road and Balaclava Road. Hawkins Street, Pine Road and Balaclava Road form connections to Goulburn Valley Highway.

AECOMShepparton North East Growth Corridor DevelopmentTraffic Impact Assessment
D R A F T
P:\60028255 V07PU Shepparton\6_Draft_docs\6.1_Reports\Traffic and Transportation\Draft Report Nov 09\1007tpe Traffic Assessment 17Dec09.docxRevision - 17 December 2009
Analysis using SIDRA INTERSEECTION 3.2 indicated that currently all the other intersections analysed appear to operate well in the AM and PM peak hours.
The forecast traffic generation rates and distribution for the proposed development has been agreed with the City of Greater Shepparton (CGS) Engineering Projects team and the intersections have been analysed based on these traffic generations.
Analysis of the forecast additional development traffic flows on the network generally indicates that most of the intersections are adequate to accommodate the additional forecast traffic.
Grahamvale Road will operate satisfactorily when Heavy Goods Vehicle (HGV) movements are assessed with 7% HGV. However if the HGV usage was expected to remain as high as 20% in the 2020 design forecast, the Grahamvale Road / Dookie Shepparton Road roundabout would experience operational problems in the peak hours. Due to this, CGS should continue to pursue the construction of the Shepparton Bypass as a matter of priority to ensure that no local problems develop.
Whilst the Hawkins Street / Goulburn Valley Highway intersection is estimated to currently operate satisfactorilyas a priority intersection, already movements from Hawkins Street are experiencing significant delays in the AM and PM peaks. Further to this, crash history of four collisions has been recorded in the last five years indicatingthat there are some safety issues with the current operation. Accordingly analysis with of the forecast traffic for the design year 2020 (with and without the proposed development) indicates that without improvement, Hawkins Street will experience unacceptable delays and inevitably an increased safety risk.
Based on these factors the operation of the Hawkins Street / Goulburn Valley Highway intersection was analysed to understand how it could operate as a signalised intersection in 2020 (with and without the forecast development traffic). It was found that the priority was more evenly distributed resulting in acceptable average delays for all arms of the intersection.
Analysis also indicates that the proposed additional forecast traffic flows at the Hawkins Street / Verney Road intersection are likely to result in the requirement of intersection improvements such as signalisation.
As the base traffic flows for this analysis were collected in 2005 it is recommended that further traffic analysis should be carried out (with recent survey data) to ensure the intersection can cater for the future demands. Notwithstanding this, it is highly probable that the flows along Hawkins Street and Goulburn Valley Highway will necessitate improvements (such as signalisation) to this intersection. Discussions with CGS indicate that this intersection will be upgraded as part of the improvements to the adjacent Northern Neighbourhood Centre.
Based on the forecast traffic flows for the proposed development and the expected background flows along Verney Road and Grahamvale Road, it is recommended that the most suitable entrance treatments will include:
Signalised Intersections
Verney Road / Pine Road / Site EntranceGrahamvale Road Site Entrance
Priority T-Intersections
Verney Road Site Entrance between Ryeland Drive and Hawkins StreetFord Road Site Entrance
This should be taken into consideration during the detail design of the development.
Based on the findings of the investigation the following table summarises the likely nexus for the infrastructure development contributions as a result of developing the NE Growth Corridor area.
Infrastructure Item Likely NexusVerney Road Main Entrance (priority T-intersection) HighGrahamvale Road Entrance (signalised intersection) HighVerney Road / Pine Road (signalisation of intersection) HighFord Road Entrance (priority T-intersection) HighGoulburn Valley Highway / Hawkins Street (signalisation of intersection) LowGeneral improvements to the surrounding pedestrian and cycle networks Low

AECOMShepparton North East Growth Corridor DevelopmentTraffic Impact Assessment
D R A F T
P:\60028255 V07PU Shepparton\6_Draft_docs\6.1_Reports\Traffic and Transportation\Draft Report Nov 09\1007tpe Traffic Assessment 17Dec09.docxRevision - 17 December 2009
Further to the findings of this investigation there are issues that may impact the traffic operation of the local road network. These issues include:
Sustainable Transport Design: Measures to reduce the reliance on the private car should be investigated to encourage a reduction in trips made by private cars which ultimately will reduce the pressure on the local road network and enable more sustainable transport choices.Goulburn Valley Highway Intersections: No analysis has been carried out for the intersections of Goulburn Valley Highway with Balaclava Road, Ford Road or Verney Road. Analysis of these intersections may provide a greater understanding of how they will be affected by the proposed development.
These further investigations should be carried out following the completion of a draft ODP. This investigation would include analysis of the existing road network together with the operation of proposed roads within the ODP area.

AECOMShepparton North East Growth Corridor DevelopmentTraffic Impact Assessment
D R A F T
1
1.0 Introduction
1.1 Project BackgroundAECOM is undertaking numerous specialist studies required to support the preparation of an Outline Development Plan (ODP) and Development Contributions Plan (DCP) reports for Shepparton North-East Growth Corridor, also to be prepared by AECOM.
The Shepparton North-East Growth Corridor has been earmarked by City of Greater Shepparton to be developed as a residential estate to support the growing town. The North-East Growth Corridor has a site area of 168.5 hectares which will be developed by a private developer. Figure 1.1 identifies the subject site which compromises the entire Shepparton North-East Growth Area.
In order to support the preparation of the ODP and DCP, a technical study assessing the demands for community infrastructure is required.Figure 1.1: Location of the Shepparton North-East Growth Area
-
Shepparton North-East Growth Area

AECOMShepparton North East Growth Corridor DevelopmentTraffic Impact Assessment
D R A F T
2
1.2 PurposeThis report provides the findings from a traffic investigation undertaken to determine whether the existing road network can support the proposed development. It also details the improvements that will be necessary in order to minimise the impact of the development on the surrounding road network based upon the likely future development traffic.
1.3 Outline of InvestigationsAECOM’s Traffic Engineers have investigated the overall implications of residential expansion on the existing transport network to the north east of Shepparton including the broader sub-region. The following summarises the key components for this investigation:
Reviewing existing information pertinent to the investigation, including the current road network and capacity, the expected background traffic growth, committed developments in the area, committed road network improvements, the accident history and traffic patterns;Assessment of the existing traffic movements in the area and anticipated traffic generated by the development in the growth area;
Potential capacity constraints on the existing road network;
Assessment of access requirements to support future residential development in the growth area;
Recommendations on necessary improvements to the local road network in order to support the proposed development;
Opportunities to maximise benefits of existing public transport services and infrastructure requirements.
1.4 Report StructureThe remainder of this report is set out as follows:
Chapter 2: Describes the demographic characteristics of Greater Shepparton that influence the development of this site.
Chapter 3: Describes the existing conditions including; site locality, local road network, traffic volume and intersection turning movement volume surveys, local accident history and other committed traffic improvements and developments, cycle network and road network improvements located in the vicinity of the site.
Chapter 4: Assessment of existing intersection operation using SIDRA INTERSECTION software
Chapter 5: Details of the proposed development and car parking rates.
Chapter 6: Details the vehicular traffic generation associated with the site and the expected traffic distribution.
Chapter 7: Includes a description of the expected traffic impact of the development based on the forecasttraffic flows on the local road network and the traffic impact conclusions.
Chapter 8: Discusses further traffic issues that should be considered as a part of the development process.
Appendix A details the existing traffic flows, Appendix B includes the summaries for the SIDRA analysis, Appendix C includes the details of the traffic distribution and Appendix D includes the VicRoads Crash History Data.

AECOMShepparton North East Growth Corridor DevelopmentTraffic Impact Assessment
D R A F T
3
2.0 Shepparton in ProfileIt is located approximately 200 kilometres north-east of Melbourne and is the fifth largest city in Victoria. In 2008 it was estimated that the City of Greater Shepparton had a usual residential population of 60,528 residents.
Shepparton largest industries include manufacturing, retail and health and social services. Manufacturing industry has evolved to cater for the needs of local primary producers. Australia's largest processor of canned fruits, SPC Ardmona has production facilities in Shepparton, Mooroopna and nearby Kyabram. Shepparton is a major centre for road transport and also has a variety of educational facilities.
As indicated in the Greater Shepparton Housing Strategy (Final Draft Version 2, 2008) Greater Shepparton is experiencing strong population growth (approximately 800 persons per year) 1
Table 2.1
, which is particularly being driven by internal and overseas migration and growth in the agricultural sector. The Shepparton North-East Growth Area is therefore well placed to help cater for Greater Shepparton’s population growth. presents the projected population for City of Greater Shepparton up to 2030.Table 2.1: Projected Population for City of Greater Shepparton
Year PopulationUsual Resident population 2008 60,528
Projected population 2010 61,905Projected population 2020 69,480Projected population 2030 78,214
(Source: forecast.id, City of Greater Shepparton)
As shown in Table 2.1, in 2008 there were 60,528 persons in the City of Greater Shepparton. By 2030, the City of Greater Shepparton’s projected population is 78,214 persons.
2.1 Demographic ProfileIn order to gain a greater understanding of the travel needs of the future residents of the Shepparton North East Growth Area, the following demographic categories will be analysed: age structure, household size, household types, car ownership type and type and place of employment and travel to work modal share. The demographic information is based on Australia of Bureau Statistic (ABS) Census data from Greater Shepparton’s Community ID Profile2
2.1.1 Age Structure
.
Figure 2.1 outlines the age structure in the City of Greater Shepparton in 2001 and 2006. In 2001 15.9% of Greater Shepparton’s population was over the age of 60, however in 2006 this had increased to 17.6%. The aging population in Greater Shepparton is a continued trend in Australia, often a result of low fertility and increased life expectancy.3
Figure 2.1 presents the age structure of the residents of Greater Shepparton in 2006.
1 David Lock Associates (2008) Greater Shepparton Housing Strategy: Final Draft Version 2. City of Greater Shepparton, Shepparton.2( http://profile.id.com.au/Default.aspx?id=272&pg=210&gid=10&type=enum, accessed 25 November 2009)3 Australian Bureau of Statistics, 2006 Census QuickStats, Australia, viewed 22 September 2008, <http://www.censusdata.abs.gov.au>.

AECOMShepparton North East Growth Corridor DevelopmentTraffic Impact Assessment
D R A F T
4
Figure 2.1: Age Structure, City of Greater Shepparton 2006
Figure 2.1 illustrates that the age structure of residents within the City of Greater Shepparton in 2006 was rather evenly spread, with the most populace group being the 35 – 49 category, representing 22% of the population.
Children of primary school age constituted 11.0% of the population and children and teenagers of secondary school age constituted 9% of the population.
2.1.2 Household Size
The average household size in the City of Greater Shepparton in 2006 was 2.6 persons. This is reflected below in Table 2.2 which shows 34.2% of household in Greater Shepparton had 2 persons. Table 2.2: Household Size, City of Greater Shepparton 2006
Household Size %1 Person 24.22 Persons 34.23 Persons 15.24 Persons 15.35 Persons 7.7
6 or more Persons 3.4Total 100.0
2.1.3 Household Types
Table 2.3 outlines the household composition types in the City of Greater Shepparton. In 2006 the most common family composition in Greater Shepparton was two parent households with children (45.2%). There were 16.5% one parent families and 37.0% couples without children.

AECOMShepparton North East Growth Corridor DevelopmentTraffic Impact Assessment
D R A F T
5
Table 2.3: Family Composition, City of Greater Shepparton 2006
Household Types %Couples with child(ren) 15 years and under 32.1Couples with child(ren) over 15 years 13.1Total couples with child(ren) 45.2One parent families with child(ren) 15 years and under 10.6One parent families with child(ren) over 15 years 5.9Total one parent families 16.5Couples without child(ren) 37.0Other families 1.2Total families 100.0
2.1.4 Car Ownership
Car ownership at the time of the 2006 census is presented in Figure 2.2.Figure 2.2: Car Ownership Vehicles per Household, City of Greater Shepparton 2006
(Source: Australian Bureau of Statistics, Census of Population and Housing, 2006)
Figure 2.2 shows that seven percent of households do not have vehicles and that over half of all households have two or more vehicles per household. This indicates that residents of City of Greater Shepparton are highly reliant on private vehicles as a primary mode of transport.

AECOMShepparton North East Growth Corridor DevelopmentTraffic Impact Assessment
D R A F T
6
2.1.5 Type of Employment
Table 2.4 describes the employment industries for residents of Shepparton.Table 2.4: Employment Industries for Residents, City of Shepparton 2006
Industry %Agriculture, Forestry & Fishing 10Manufacturing 13.4Construction 7.4Retail Trade 13.2Wholesale Trade 4.1Hospitality 4.9Transport and Warehousing 4.1Professional and Technical Services 3.7Administrative and Support Services 2.7Public Administration and Safety 4Education and Training 7.3Health and Social Care 12Other 13.2Total 100.0
(Source: Australian Bureau of Statistics, Census of Population and Housing 2006)
Table 2.4 shows that the three most popular industry sectors of the jobs held by the resident population in the City of Greater Shepparton in 2006 were:
Manufacturing (3,400 persons or 13.5%) Retail Trade (3,326 persons or 13.2%) Health Care and Social Assistance (3,033 persons or 12.0%)
In combination, these three industries employed 9,759 people in total or 38.7% of the employed resident population. The majority of industries of employment have the opportunity to provide residents with jobs locally, indicating that there is not a great need to travel outside Greater Shepparton for employment. This is discussed further in the following paragraph.
2.1.6 Place of Employment
Table 2.5 describes the geographic location of work places for residents of Greater Shepparton in 2006.Table 2.5: Employment Location, City of Greater Shepparton 2006
Employment location of City of Greater Shepparton's residents, 2006
Residents Percent (%)
Within the City of Greater Shepparton 21,980 86.1
Outside the City of Greater Shepparton 1,596 6.3
Live within the City of Greater Shepparton, work location unknown 1,938 7.6
Employed residents of the City of Greater Shepparton 25,514 100.0(Source: Australian Bureau of Statistics, Journey to work, unpublished data, 2006)
As shown in Table 2.5, the majority of residents (86.1%) work within the City of Greater Shepparton. Table 2.5further describes where the 1,596 (6.3%) of residents that do not work in Shepparton are travelling to work.

AECOMShepparton North East Growth Corridor DevelopmentTraffic Impact Assessment
D R A F T
7
Table 2.6: Top 5 Local Government Areas of Employment for Residents, City of Greater Shepparton, 2006
RankLocal Government
AreaDirection relative to Greater Shepparton Number of Residents Percent (%)
1 Greater Shepparton - 21,980 86.1
2 Campaspe West 478 1.9
3 Moira North 339 1.3
4 Strathbogie South 100 0.4
5 Benalla East 70 0.3
Other areas - 2,547 10.0
Total employed residents in the City of Greater Shepparton 25,514 100.0
(Source: Australian Bureau of Statistics, Journey to work, unpublished data, 2006.)
Figure 2.3 illustrates the geographic locations of the top employment locations for the City of Greater Shepparton, as detailed in Table 2.6.Figure 2.3: Map of Top Employment Locations, City of Greater Shepparton 2006
(Map source: http://profile.id.com.au/Default.aspx?id=272&pg=310&gid=10&type=enum, accessed 25 November 2009)
As shown in Table 2.6 and Figure 2.3, the census information concluded that in 2006 there were only a small amount of Greater Shepparton residents that travelled beyond Shepparton to work. This indicates that there are no obvious employers or industries attracting significant volumes of Greater Shepparton residents out of the area for work and the majority (86%) of trips to work are likely to be within the City of Greater Shepparton.
AECOMShepparton North East Growth Corridor DevelopmentTraffic Impact Assessment
D R A F T
8
2.1.7 Travel to Work Modal Share
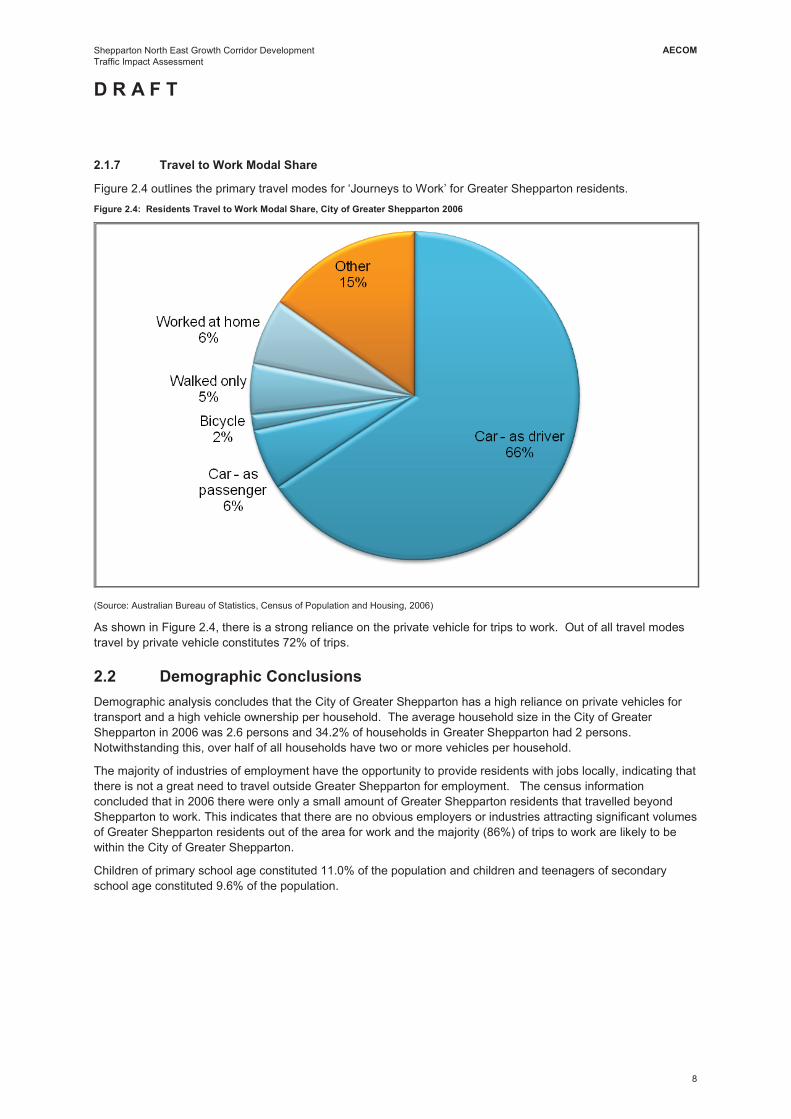
Figure 2.4 outlines the primary travel modes for ‘Journeys to Work’ for Greater Shepparton residents.Figure 2.4: Residents Travel to Work Modal Share, City of Greater Shepparton 2006
(Source: Australian Bureau of Statistics, Census of Population and Housing, 2006)
As shown in Figure 2.4, there is a strong reliance on the private vehicle for trips to work. Out of all travel modes travel by private vehicle constitutes 72% of trips.
2.2 Demographic ConclusionsDemographic analysis concludes that the City of Greater Shepparton has a high reliance on private vehicles for transport and a high vehicle ownership per household. The average household size in the City of Greater Shepparton in 2006 was 2.6 persons and 34.2% of households in Greater Shepparton had 2 persons. Notwithstanding this, over half of all households have two or more vehicles per household.
The majority of industries of employment have the opportunity to provide residents with jobs locally, indicating that there is not a great need to travel outside Greater Shepparton for employment. The census information concluded that in 2006 there were only a small amount of Greater Shepparton residents that travelled beyond Shepparton to work. This indicates that there are no obvious employers or industries attracting significant volumes of Greater Shepparton residents out of the area for work and the majority (86%) of trips to work are likely to be within the City of Greater Shepparton.
Children of primary school age constituted 11.0% of the population and children and teenagers of secondary school age constituted 9.6% of the population.

AECOMShepparton North East Growth Corridor DevelopmentTraffic Impact Assessment
D R A F T
9
3.0 Existing Conditions
3.1 Site LocalityThe site is located approximately four kilometres north east of Shepparton town centre.
As shown in Figure 3.1, the development site is bordered by Ford Road in the north, Grahamvale Road to the east, private agricultural land to the south and Verney Road to the west.Figure 3.1: Site Location
(source: maps.google.com)
3.2 Road NetworkVerney Road is a local road aligned north south between Goulburn Valley Highway and Balaclava/New DookieRoad. In the vicinity of the site there is one lane in each direction and cycle lanes on both sides. Mainly the shoulders are unsealed, however near some intersections the shoulders are sealed and formal footpaths exist.There is a short length of shared path on the western side of Verney Road in the vicinity of the site.
Balaclava Road is a VicRoads declared road aligned east west between Goulburn Valley Highway (Numurkah Road) and New Dookie Road. There is one lane in each direction, cycle lanes on both sides and parallel car parking on the northern side. There are formal footpaths on both sides.
New Dookie Road is a VicRoads declared road which extends east approximately 400 m where it becomes Dookie Shepparton Road and continues to Dookie. In the vicinity of the site (between Verney Road and Grahamvale Road) this road has one lane in each direction with unsealed shoulders.
Site Location

AECOMShepparton North East Growth Corridor DevelopmentTraffic Impact Assessment
D R A F T
10
Forming the eastern border of the site, Grahamvale Road is a local road aligned north south from Katamatite Shepparton Road to the roundabout at Dookie Shepparton Road. In the vicinity of the site Grahamvale Road has one lane in each direction and a narrow sealed shoulder. Grahamvale Road is the current formal town bypass for Heavy Goods Vehicles (HGVs) and accordingly HGVs comprise approximately 20% of all movements along this route.
Forming the northern border of the site, Ford Road is a local road aligned east west between Lemnos North Road, Lemnos and Goulburn Valley Highway. In the vicinity of the site there is one lane in each direction (unmarked) and unsealed shoulders.
Hawkins Street is aligned east west between Verney Road and Goulburn Valley Highway and provides the most direct access to Goulburn Valley Highway from the site. Hawkins Street has been designed to act as a an informal collector road with the Northern Neighbourhood (Retail) Centre located on the corner of Hawkins Street and Goulburn Valley Highway and reduced number of houses with frontages (including 18 crossovers on the North side and 12 crossovers on the South side). It is planned that the intersection with Goulburn Valley Highwaywill be signalised to improve access and safety.
Pine Road comprises one lane in each direction and is primarily aligned east west between Verney Road and Goulburn Valley Highway apart from a short section which is aligned north south (approximately 400 m west of Verney Road). There are formal footpaths on both sides, and parallel car parking on the northern side, of the eastern section of the street. There is a formal footpath on the north side of the western section of the street. The intersection with Goulburn Valley Highway is signalised.
Goulburn Valley Highway (Numurkah Road) is a VicRoads declared road and is defined as a road of national importance. In the area near the site the Goulburn Valley Highway (Numurkah Road) has two lanes in each direction, sealed shoulders and a series of service roads to cater for active frontages.
3.3 Turning Movement Volume SurveysTurning movement volume surveys were undertaken by Global Workforce on behalf of AECOM on Tuesday 5 August 2008 in the AM peak between 7:30am and 10:30am and in the PM peak between 3:00pm and 6:00pm.
As shown in Figure 3.2, the intersections assessed include:
Verney Road / Balaclava Road / New Dookie RoadVerney Road / Ford RoadGrahamvale Road / Dookie Shepparton RoadGrahamvale Road / Ford Road
Additional turning movement volume surveys were undertaken by Global Workforce on behalf of AECOM onThursday 19 November 2009 in the AM peak between 7:30am and 10:30am.
As shown in Figure 3.2, the intersections assessed include:Verney Road / Pine RoadVerney Road / Hawkins Street
For the Hawkins Road / Goulburn Valley Highway priority intersection turning movement surveys were sourced from City of Greater Shepparton (CGS) surveys. These surveys were conducted in 2005. In order to provide a realistic comparison it was agreed with CGS to apply a compound growth factor of 1% per annum (typical for Goulburn Valley Highway) to create a flow scenario for this intersection.

AECOMShepparton North East Growth Corridor DevelopmentTraffic Impact Assessment
D R A F T
11
Figure 3.2: Survey Location
(source: maps.google.com)
Figure 3.3 to Figure 3.15 illustrate the AM and PM peak hour traffic volumes for the intersections analysed. Fullsurvey results are contained within Appendix A.
As different roads within the network experience differing AM and PM peak periods each intersection has been analysed based on the intersection specific peak hour as recorded during recent surveys.
Key
IntersectionSurvey Location

AECOMShepparton North East Growth Corridor DevelopmentTraffic Impact Assessment
D R A F T
12
Figure 3.3: Verney Road / Balaclava Road AM Peak Hour Figure 3.4: Verney Road / Balaclava Road PM Peak Hour
55 292 131
60 104
204 180
66 96
84 137 77
Balaclava R
oad
New
Dookie R
oad
Verney Road
Verney Road
Verney Road
20 198 85
43 171
141 217
80 84
67 289 35
Verney Road
New Dookie Road
Balaclava Road
Figure 3.5: Verney Road / Ford Road AM Peak Hour Figure 3.6: Verney Road / Ford Road PM Peak Hour
Verney Road
47 80 32
67 39
65 65
34 77
49 96 30
Verney Road
Ford Road
Ford Road
Verney Road
62 133 42
53 34
77 74
14 37
32 106 30
Verney Road
Ford Road
Ford Road
3:00pm to
4:00pm
4:30pm to
5:30pm
8:00am to
9:00am
8:15am to
9:15am

AECOMShepparton North East Growth Corridor DevelopmentTraffic Impact Assessment
D R A F T
13
Figure 3.7: Grahamvale Rd/Dookie Shepprtn Rd AM Pk Hr Figure 3.8: Grahamvale Rd/Dookie Shepprtn Rd AM Pk Hr
Grahamvale Road
105 194 10
103 9
114 158
88 34
119 145 29
Grahamvale Road Dookie Shepparton Road
New Dookie Road
Grahamvale Road
80 142 15
81 16
89 123
99 45
77 197 38
Grahamvale Road
Dookie Shepparton R
oad
New
Dookie R
oad
Figure 3.9: Grahamvale Road / Ford Road AM Pk Hr Figure 3.10: Grahamvale Road / Ford Road PM Pk Hr
Grahamvale Road
45 69 31
7 40
31 18
12 7
2 128 6
Grahamvale Road
Ford Road
Ford Road
Grahamvale Road
10 171 53
9 57
25 28
8 14
5 89 12
Grahamvale Road
Ford Road
Ford Road
3:15pm to
4:15pm
3:15pm to
4:15pm
8:00am to
9:00am
8:15am to
9:15am

AECOMShepparton North East Growth Corridor DevelopmentTraffic Impact Assessment
D R A F T
14
Figure 3.11: Hawkins Road / GV Hwy AM Pk Hr Figure 3.12: Hawkins Road / GV Hwy PM Pk Hr
GV Highway
40 640 51
0 25
0 0
0 97
58 405 109
GV HighwayHaw
kins Street
Service Road
80 531 110
17
122
73 372 246
GV Highway
Hawkins Street
Service Road
GV Highway
Figure 3.13: Verney Road / Hawkins Street AM Pk Hr Figure 3.14: Verney Road / Pine Road AM Pk Hr
41 308
40
57
48 181H
awkins S
treet
Verney Road
Verney Road
11 361
12
129
98 213
Verney Road
Verney Road
Pine R
oad
Figure 3.15: Verney Road / Hawkins Street 8:00am to 9:00am
34 302
41
59
49 182
Verney Road
Hawkins Street
Verney Road
8:00am to
9:00am
8:00am to
9:00am
8:15am to
9:15am
4:45pm to
5:45pm
8:00am to
9:00am

AECOMShepparton North East Growth Corridor DevelopmentTraffic Impact Assessment
D R A F T
15
Figure 3.15 illustrates the 8:00am to 9:00am hourly traffic flows recorded at the Verney Road / Hawkins Street intersection. Comparison of the 8:00am to 9:00am hourly traffic flows at the Verney Road / Pine Road intersection and the Verney Road / Hawkins Street intersection shows that the two-way traffic flow on Pine Road (250 vehicles per hour) is 37% higher than on Hawkins Street (183 vehicles per hour). The higher flows on Pine Road may be attributed to the traffic signals at the Pine Road / Goulburn Valley Highway intersection or to the secondary college located east of Goulburn Valley Highway on Parkside Drive.
It is also observed that these high flows along Pine Road are generally due to the dominant right turns of vehicles turning onto Verney Road (south) and the left turns from Verney Road (south) turning into Pine Road. This indicates a preference for vehicles travelling to/from the south to use Pine Road opposed to using Hawkins Street.
3.4 Crash HistoryAn accident review for the area has been performed using the VicRoads CrashStats database.
The roads reviewed included:
Verney Road between Balaclava Road and Ford RoadGrahamvale Road between Dookie Shepparton Road and Ford RoadFord Road between Verney Road and Goulburn Valley HighwayBalaclava Road, New Dookie Road and Dookie Shepparton Road to Grahamvale RoadHawkins StreetPine RoadGoulburn Valley Highway at the intersections of Balaclava Road, Hawkins Street, Ford Road, Verney Roadand Pine Road.Hawdon Street (just south of Verney Road)
In the five year period between January 2004 and December 2008 there were 46 accidents along these roads. This resulted in 16 serious injuries and 30 other injuries. No fatalities were recorded at these locations. Full results can be found in Appendix D.
Between 2004 and 2008 the signalised intersection of Brauman Street (the western extension of Pine Road) andGoulburn Valley Highway experienced seven accidents, which resulted in five serious and two non-serious injuries. Four of these accidents occurred in the twelve month period between January and December 2008. Six of the accidents were collisions between right turning vehicles and vehicles travelling in the lane into which the vehicle was turning. These accidents indicate that there are existing safety issues at this intersection.
Between 2004 and 2008 five accidents were observed at the Goulburn Valley Highway / Goulburn Valley Highway Service Road intersection. The majority of these accidents occurred during light, day and clear conditions andthere was no pattern to the classification of these accidents. No serious injuries were sustained.
Between 2004 and 2008 five accidents were observed at the Balaclava Road/ Verney Road roundabout. These accidents comprised cross traffic collisions and incidences where the driver lost control of the vehicle. A serious injury was sustained in one of the accidents. There was no pattern to the time of day or road conditions of these accidents.
3.5 Committed Traffic Improvements and Developments3.5.1 Shepparton Valley Bypass
The boundaries for the Shepparton Bypass have been finalised and were incorporated into the Greater Shepparton Planning Scheme in late 2006. A program for the construction of the Shepparton Bypass is yet to be agreed with the Australian Federal Government. Figure 3.16 shows the confirmed bypass route which will reduce through traffic on Goulburn Valley Highway and replace the HGV bypass route along Grahamvale Road.
As the timeframe for the Shepparton Bypass has not yet been confirmed it is important to consider that it may not actually be opened prior to completion of the development.

AECOMShepparton North East Growth Corridor DevelopmentTraffic Impact Assessment
D R A F T
16
Figure 3.16 Valley Bypass Route
3.5.2 Northern Neighbourhood Centre Extension
The Northern Neighbourhood Centre is a retail development located on the corner of Goulburn Valley Highway and Hawkins Street. It has a committed expansion planned to increase the retail floor space from 3800 sqm to 7300 sqm, resulting in an additional 3500 sqm of retail space.
This is anticipated to place further pressure on the Hawkins Street / Goulburn Valley Highway intersection.Accordingly the intersection will need to be upgraded in the near future as a part of the Northern Neighbourhood extension.
At the time of preparing this report, there were no other known committed developments expected to impact the local traffic network.
3.6 Cycle NetworkShepparton has a well established cycle network that is continuously improving. The Shepparton Cycle network map provided by CGS is included in Figure 3.17: .
As shown in Figure 3.17: , there are currently on-road cycle lanes on Verney Road, Balaclava Road and Goulburn Valley Highway. An on-road cycle lane is proposed to extend from Balaclava Road along Dookie Shepparton Road and past Grahamvale Road.
There is also a shared path along a section of the west side of Verney Road and this is proposed to be extended.

AECOMShepparton North East Growth Corridor DevelopmentTraffic Impact Assessment
D R A F T
17
The proposed development is well placed to integrate a safe, convenient cycle network, maximise permeable route and connections to the external road network.Figure 3.17: Shepparton Cycle Network

AECOMShepparton North East Growth Corridor DevelopmentTraffic Impact Assessment
D R A F T
18
4.0 Existing Traffic Operation
4.1 Overview of Local Road NetworkDuring initial discussions with CGS Engineering Projects department4
Verney Road and Balaclava Road
it was agreed that the following fourintersections would be most adversely affected by the proposed development and would be sufficient for analysis of impacts on external local road network:
Verney Road and Ford RoadGrahamvale Road and Dookie Shepparton RoadGrahamvale Road and Ford Road
Further to these discussions, in October 2008 further discussions were conducted with CGS Council Officers regarding the likelihood of impacts to Hawkins Street and potentially Pine Road. Additional analysis has been investigated for:
Goulbourn Valley Highway and Hawkins StreetVerney Road and Hawkins StreetVerney Road and Pine Road
The impact of the proposed development on the operation of the Hawkins Street / Goulbourn Valley Highway intersection has been investigated. In 2005 CGS conducted surveys of the intersection to determine whether signalisation was warranted in line with VicRoads requirements. The investigation concluded that signalisation was not warranted, but the intersection was flagged as a potential future location suitable for signalisation.Discussions with CGS suggested that the implementation of signals at this location will be required in the near future to improve existing operational and safety conditions.
Historical traffic growth along Goulburn Valley Highway in this area has averaged 1.0% per annum5
4.2 SIDRA INTERSECTION Analysis
. Therefore, agrowth factor of 1.0% per annum has been applied to the traffic movement flows recorded in 2005 and the Hawkins Street / Goulbourn Valley Highway intersection has been modelled using SIDRA to provide an estimation of current (2008) operation.
The operation of the local intersections described in 4.1 have been analysed using SIDRA INTERSECTION 3.1 (SIDRA).
The SIDRA software package is a computer program that estimates intersection capacity and performance statistics using iterative approximation.
The following three main operational parameters have been detailed to provide a broad understanding of the intersection performance. These are Degree of Saturation, Level of Service and Average Delay. Each is described below.
4.2.1 Degree of Saturation
The level of congestion at an intersection is most commonly measured by the Degree of Saturation (DOS). This is defined as the ratio of arrival flow to capacity and is otherwise known as the volume capacity ratio, and has a theoretical maximum value of one. In practice, a DOS of greater than 0.95 would indicate that the intersection is operating under congested conditions, with lengthening queues and delays. As a guide the operating conditions under various degrees of saturation can be defined as:
4 Brendan Walsh, Senior Engineer - Engineering Projects Greater Shepparton City Council, 22 August 20085 Source: CGS

AECOMShepparton North East Growth Corridor DevelopmentTraffic Impact Assessment
D R A F T
19
DOS < 0.75 Very good operating conditions;0.75 < DOS < 0.90 Good operating conditions;0.90 < DOS < 0.95 Acceptable operating conditions; andDOS < 0.95 Congested operating conditions.
When utilising SIDRA to analyse intersections, it is prudent to compare not only the DOS, but also factors such as queues and delays, which are qualitatively captured through assessment of the level of service.
4.2.2 Level of Service
Austroads have developed standards for level of service for urban streets within Australia. Level of Service (LOS) is based on average through-vehicle travel speed for the segment, section, or entire urban street under consideration.
SIDRA uses average control delay, which is the average delay that the driver will experience when waiting at the intersection as a measure of the “level of service” that the intersection is operating as a whole and/or for each movement. The delay levels that apply to different levels of service under SIDRA are summarised in Table 4.1.Table 4.1: SIDRA Definition of Levels of Service and Delay
Level of Service Characteristic Flows Control delay per
vehicle in seconds (d)A Primarily free-flow operations at average travel speeds d<=10B Reasonable unimpeded operations at average travel speeds 10<d<=20
C Stable operations; however, ability to manoeuvre and change lanes in mid block locations may be more restricted 20<d<=35
D Small increases in flow may cause substantial increases in delay and decreases in travel speed 35<d<=55
E Significant delays and average travel speeds of 33 percent or less of the free flow speed 55<d<=80
F Urban street flow at extremely low speeds, typically one-third to one-fourth of the free flow speed 80<d
4.2.3 Average Delay
The delay to a vehicle is the difference between the interrupted and uninterrupted travel time through the intersection. The reported delay includes the deceleration and acceleration delays for the major stop experienced by queued vehicles as well as the geometric delays experienced by all vehicles negotiating the intersection.
4.2.4 Verney Road and Grahamvale Road Intersections
Table 4.2 to Table 4.7 summarise the existing operational characteristics of the following intersections during the AM and PM weekday peak hours:
Verney Road and Balaclava RoadVerney Road and Hawkins StreetVerney Road and Pine RoadVerney Road and Ford RoadGrahamvale Road and New Dookie RoadGrahamvale Road and Ford Road.
Full SIDRA analysis results are included in Appendix B.

AECOMShepparton North East Growth Corridor DevelopmentTraffic Impact Assessment
D R A F T
20
Table 4.2: Verney Road / Balaclava Road Existing Peak Hour Intersection Operation (Roundabout)
Intersection ArmDegree of Saturation Average Delay (sec) Level of Service
AM Peak PM Peak AM Peak PM Peak AM Peak PM PeakVerney Road(South) 0.289 0.4.4 6.3 5.8 LOS A LOS ANew Dookie Road (East) 0.444 0.484 7.1 6.9 LOS A LOS AVerney Road (North) 0.519 0.310 6.4 4.8 LOS A LOS ABalaclava Road (West) 0.352 0.326 5.9 7.6 LOS A LOS AAll Approaches 0.519 0.484 6.4 6.3 LOS A LOS A
Table 4.3: Verney Road / Hawkins Street Existing AM Peak Intersection Operation (T-intersection)
Intersection Arm Degree of Saturation Average Delay (sec) Level of ServiceVerney Road (South) 0.102 1.8 LOS AHawkins Street (West) 0.222 14.6 LOS BVerney Road (North) 0.174 1.1 LOS AAll Approaches 0.221 3.3 -
Table 4.4: Verney Road / Pine Road Existing AM Peak Intersection Operation (T-intersection)
Intersection Arm Degree of Saturation Average Delay (sec) Level of ServiceVerney Road (South) 0.121 2.7 LOS APine Road (West) 0.491 24.7 LOS CVerney Road (North) 0.204 0.3 LOS AAll Approaches 0.500 5.4 -
Table 4.5: Verney Road / Ford Road Existing Peak Hour Intersection Operation (Roundabout)
Intersection ArmDegree of Saturation Average Delay (sec) Level of Service
AM Peak PM Peak AM Peak PM Peak AM Peak PM PeakVerney Road (North) 0.157 0.228 6.9 6.7 LOS A LOS AFord Road (East) 0.187 0.155 6.7 6.9 LOS A LOS AVerney Road (South) 0.159 0.155 6.4 6.4 LOS A LOS AFord Road (West) 0.174 0.151 7.0 6.5 LOS A LOS AAll Approaches 0.187 0.228 6.7 6.6 LOS A LOS A

AECOMShepparton North East Growth Corridor DevelopmentTraffic Impact Assessment
D R A F T
21
Table 4.6: Grahamvale Road / Dookie Shepparton Road Existing Peak Hour Intersection Operation (Roundabout)
Intersection ArmDegree of Saturation Average Delay (sec) Level of Service
AM Peak PM Peak AM Peak PM Peak AM Peak PM PeakGrahamvale Road (South) 0.264 0.269 4.9 4.6 LOS A LOS ADookie Shepparton Road (East) 0.228 0.193 4.9 4.8 LOS A LOS AGrahamvale Road (North) 0.305 0.234 5.9 5.8 LOS A LOS ANew Dookie Road (West) 0.287 0.272 5.9 6.7 LOS A LOS AAll Approaches 0.306 0.272 5.5 5.5 LOS A LOS A
Table 4.7: Grahamvale Road / Ford Road Existing Peak Hour Intersection Operation (Priority Junction)
Intersection ArmDegree of Saturation Average Delay (sec) Level of Service
AM Peak PM Peak AM Peak PM Peak AM Peak PM PeakGrahamvale Road (South) 0.080 0.072 1.0 2.6 LOS A LOS AFord Road (East) 0.111 0.179 9.3 10.1 LOS A LOS BGrahamvale Road(North) 0.095 0.137 4.1 2.3 LOS A LOS AFord Road (West) 0.078 0.071 8.3 8.8 LOS A LOS AAll Approaches 0.111 0.179 4.4 4.6 - -
As shown in Table 4.2, Table 4.5 and Table 4.6 all intersections controlled with roundabouts currently operate with an excellent LOS of ‘A’ in both peak periods and have very low average delays, of less than 8 seconds. This indicates that there is plenty of additional capacity at these intersections.
Table 4.3 reveals that the Verney Road / Hawkins Street T-intersection currently operates with a good level of service and with short delays. Table 4.4 reveals that the Verney Road / Pine Road intersection is mainly operating satisfactorily however there are medium delays for vehicles turning left and right from Pine Road.These vehicles experienced an average delay of 25 seconds in the AM peak. As shown in Figure 2.14 there was a high volume of vehicles (129 vehicles) turning right from Pine Road into Verney Road in the AM peak.
As shown in Table 4.7 the Grahamvale Road / Ford Road priority junction currently operates with a good level of service and with short delays.
4.2.5 Hawkins Street / Goulburn Valley Highway
Table 4.8 displays the results of the Hawkins Street / Goulburn Valley Highway intersection analysis for 2008 scenario based on the CGS 2005 traffic survey.Table 4.8: Hawkins Street / Goulburn Valley Highway SIDRA Analysis for 2008 Scenario
Intersection ArmDegree of Saturation Average Delay (sec) Level of Service
AM Peak PM Peak AM Peak PM Peak AM Peak PM PeakGoulburn Valley Highway (South) 0.180 0.372 3.3 5.6 LOS A LOS AHawkins Street (East) 0.460 0.308 30.0 21.2 LOS D LOS CGoulburn Valley Highway (North) 0.195 0.179 1.2 2.4 LOS A LOS AAll Approaches 0.500 0.372 4.5 5.5 - -

AECOMShepparton North East Growth Corridor DevelopmentTraffic Impact Assessment
D R A F T
22
Table 4.8 reveals that the intersection is mainly operating satisfactorily however there are significant delays for vehicles turning right from Hawkins Street. These vehicles experienced an average delay of 92 seconds in the AM peak. The delay is considered excessive and potentially increases the risk of collision.
As detailed the Traffic Engineering Manual Volume 1, Chapter 3 – Edition 3, Revision A, (2001) VicRoads recommend that signalisation may be required under the following circumstances:
Traffic signals may be considered subject to detailed analysis; when the major road carries at least 600 vehicles/hour (two way) and the minor road concurrently carries at least 200 vehicles (one way) on one approach over any 4 hours of an average day.
In the AM and PM peak hours the two way traffic on Goulburn Valley Highway is 1303 vehicles and 1412 vehicles respectively. Hawkins Street (westbound) carries 97 vehicles in the AM peak and 122 vehicles in the PM peak.
The SIDRA analysis for the 2008 scenario indicate that signalisation of the intersection may be necessary to provide safe and efficient operation. Accordingly, the intersection has been analysed to provide an understanding of operation with signalisation for the 2008 scenario based on the CGS 2005 traffic survey.
The following phasing sequence was used to construct the phasing operation for the SIDRA model. In both the AM and PM peaks the phasing sequence used for the SIDRA model included:
Phase A Phase B
Table 4.9 displays the results of the signalised intersection analysis for the 2008 scenario based on the CGS 2005 traffic survey.Table 4.9: Hawkins Street / Goulburn Valley Highway Signalised Intersection SIDRA Analysis for 2008 Scenario
Intersection ArmDegree of Saturation Average Delay (sec) Level of Service AM Peak PM Peak AM Peak PM Peak AM Peak PM Peak
Goulburn Valley Highway (South) 0.324 0.693 10.0 12.8 LOS A LOS BHawkins Street (East) 0.441 0.545 20.1 20.5 LOS C LOS CGoulburn Valley Highway (North) 0.510 0.466 8.8 9.8 LOS A LOS AAll Approaches 0.510 0.693 10.2 12.1 LOS B LOS B
As shown in Table 4.9, the results of the signalised intersection analysis indicate a more even distribution of traffic flows. The results indicate higher levels of saturation for Goulburn Valley Highway, however the operation of Hawkins Street indicates significant improvement and acceptable operation in both peak periods with average delays ranging from 11 to 21 seconds.

AECOMShepparton North East Growth Corridor DevelopmentTraffic Impact Assessment
D R A F T
23
5.0 Proposed DevelopmentThe proposed mixed use development is primarily residential with a complimentary retail and community component located adjacent to Verney Road. As part of the development, it is also proposed to extend the Grahamvale Primary School (PS).
Four access points are proposed for the development including:
Verney Road between Ryeland Drive and Hawkins Street Verney Road extension of Pine Road Grahamvale Road and Ford Road
5.1 Land UseThe proposed development is primarily residential, with retail and ancillary community facilities. A total of 1677residential dwellings are proposed.
It is proposed to develop a retail and community hub including 1350sqm gross floor area (GFA), comprising aconvenience supermarket with GFA 900sqm and 450sqm of small tenancies. It is recommended that a preschool, childcare, maternal and child health services are included within the community hub.
The retail and community facilities are proposed to be located north east of the primary Verney Road entrance.
It is proposed to extend the existing Grahamvale Primary School located on the western boundary of the site. The extent of the extension is not yet finalised however, for the purpose of this investigation it has been estimated that the enrolments will double, as explained in Section 6.1.4.
5.2 Car Parking Rates5.2.1 Residential Car Parking
Residential car parking shall be designed in accordance with the Greater Shepparton Planning Scheme and provision for car parking will include parking within property curtilage. This is not examined as a part of this assessment.
5.2.2 Retail Car Parking
Car parking for the development should be designed in accordance with the most current car parking rates applicable. According to the current Clause 52.06 of the Greater Shepparton Planning Scheme, a provision of 8 car spaces to each 100sqm of leasable floor area is required for the majority of retail developments anticipated tooccupy this retail component.
However, recently the Department of Planning and Community Development (DPCD) facilitated a state wide review of planning scheme parking rates. This process culminated in the release of a report by an Advisory Committee (appointed by the Minister for Planning) titled Review of Parking Provisions in the Victoria Planning Provisions, August 2007. This report aims to provide advice on car parking issues and to prepare a new Clause 52.06 suitable for inclusion in the Victoria Planning Provisions (VPP) and planning schemes.
The Advisory Committee report has been prepared following extensive research across Victoria and contribution from numerous stakeholders and experts. If adopted, the report’s recommendations will alter the existing parking rates provided in Clause 52.06 of the VPP.
In general the parking rates proposed in the Advisory Committee report are lower or equal to the existing parking rates in Clause 52.06.
However, it is relevant to note that the adoption of this report is, in all likelihood, some months away and there is not necessarily a guarantee that the report’s recommendations will be adopted in any form. Comments are currently being sought on the Advisory Committee report and the Advisory Committee is currently analysing the submissions on all the draft documents.
Notwithstanding the uncertainty in respect of the possible adoption of the revised parking rates proposed in the Advisory Committee report, it is still important for the parking rates to be considered for future developments.

AECOMShepparton North East Growth Corridor DevelopmentTraffic Impact Assessment
D R A F T
24
The Advisory Committee Report specifies a proposed parking rate of 4.0 car spaces per 100sqm of leasable floor area for retail developments (for standard retail developments, as in this case).
Therefore, even though the current planning scheme rate is 8 spaces per 100sqm of leasable floor area, it is expected that a lower rate of 4.0 spaces per 100sqm of leasable floor area is in line with the recommendations of the recent Advisory Committee Report and will be considered suitable for this future development.

AECOMShepparton North East Growth Corridor DevelopmentTraffic Impact Assessment
D R A F T
25
6.0 Vehicular Traffic Generation and DistributionThe following traffic investigation has been undertaken to ascertain the levels of traffic that will be generated and assigned to the existing road network as a result of new residential development in the Shepparton North East Growth Area.
6.1 Traffic GenerationTraffic generation rates have been discussed and agreed with the CGS Engineering Projects department and are presented as follows.
6.1.1 Background Traffic Growth
An annual background traffic growth rate of 1.5% per annum has been applied to surveyed traffic movements. This is based on the historical growth rate of the Verney Road area as monitored by CGS. The growth rate takes into account growth in traffic caused by developments in the greater area, such as other residential and retail developments.
6.1.2 Residential
The Greater Shepparton Infrastructure Design Manual requires a traffic generation of 10 vehicle trips per lot per day6
Greater Shepparton Infrastructure Design Manual a weekday peak hour vehicle trip rate of 0.9 movements per dwelling. This factor has been developed to take into account all trips typical of peak hour activity and primarily includes trips to work and trips to schools. For parents, one of the attractions of this residential development is the proximity to educational facilities, including the Grahamvale Primary School located on the eastern boundary of the site, the Christian School located on the western boundary the site and a collection of other schools located in close proximity.
. This results in a total of 16,770 vehicle trips per day.
To provide an accurate analysis of external trips generated to and from the site it is important to take into consideration that no external trips will be generated for residents aged between four and 11 travelling to and fromthe Grahamvale Primary School located within the site. As discussed in section 2.1.1, this age group constitutes 11% of the population. Accordingly the peak hour vehicle trip rate has been reduced by approximately 11% to 0.8 movements per dwelling to take into account the reduced demand for trips external to the site.
This results in a total traffic generation of 1342 movements generated by residential traffic in the AM and PM peak hours.
Vehicle trips are defined as a one-way vehicular movement from one point to another excluding the return journey. Therefore a vehicle entering and leaving a land use is counted as two trips. For residential trips the following profile has been assumed:
AM Peak: 10% of trips in and 90% of trips outPM Peak: 70% of trips in and 30% of trips out
6.1.3 Retail
The RTA “Guide to Traffic Generating Developments” (October 2002) is a widely used, comprehensive guide to covering all aspects of traffic generation relating to developments. It was developed in New South Wales and provides good guidance for Australian conditions generally. The Guide commonly provides generation rates for daily (24 hour) and evening peak hour periods for a wide range of land uses.
The rates detailed in Table 6.1 have been discussed with CGS Engineering Projects department and agreed to be suitable for the land uses envisaged within the NE Growth Corridor Residential/Mixed Use Development:
6 City of Greater Shepparton Infrastructure Design Manual V2.5, 2 Nov 2009
AECOMShepparton North East Growth Corridor DevelopmentTraffic Impact Assessment
D R A F T
26
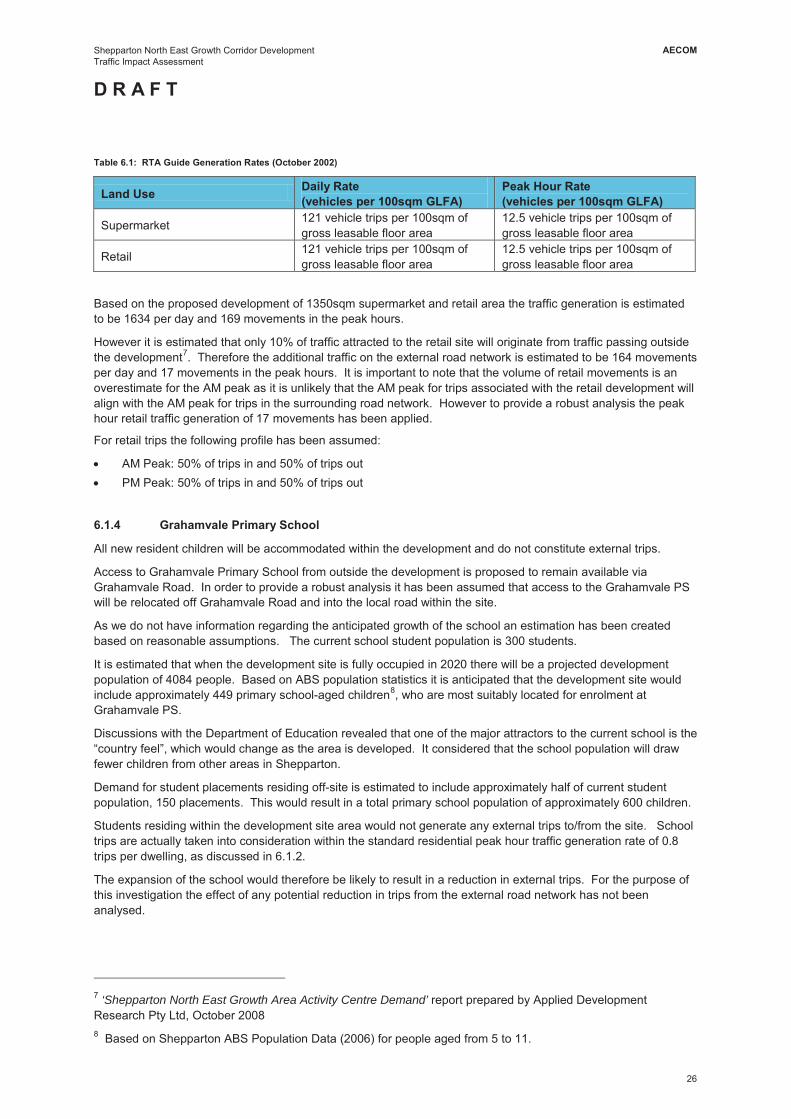
Table 6.1: RTA Guide Generation Rates (October 2002)
Land Use Daily Rate(vehicles per 100sqm GLFA)
Peak Hour Rate(vehicles per 100sqm GLFA)
Supermarket 121 vehicle trips per 100sqm of gross leasable floor area
12.5 vehicle trips per 100sqm of gross leasable floor area
Retail 121 vehicle trips per 100sqm of gross leasable floor area
12.5 vehicle trips per 100sqm of gross leasable floor area
Based on the proposed development of 1350sqm supermarket and retail area the traffic generation is estimated to be 1634 per day and 169 movements in the peak hours.
However it is estimated that only 10% of traffic attracted to the retail site will originate from traffic passing outside the development7
For retail trips the following profile has been assumed:
. Therefore the additional traffic on the external road network is estimated to be 164 movements per day and 17 movements in the peak hours. It is important to note that the volume of retail movements is an overestimate for the AM peak as it is unlikely that the AM peak for trips associated with the retail development will align with the AM peak for trips in the surrounding road network. However to provide a robust analysis the peak hour retail traffic generation of 17 movements has been applied.
AM Peak: 50% of trips in and 50% of trips outPM Peak: 50% of trips in and 50% of trips out
6.1.4 Grahamvale Primary School
All new resident children will be accommodated within the development and do not constitute external trips.
Access to Grahamvale Primary School from outside the development is proposed to remain available via Grahamvale Road. In order to provide a robust analysis it has been assumed that access to the Grahamvale PS will be relocated off Grahamvale Road and into the local road within the site.
As we do not have information regarding the anticipated growth of the school an estimation has been created based on reasonable assumptions. The current school student population is 300 students.
It is estimated that when the development site is fully occupied in 2020 there will be a projected development population of 4084 people. Based on ABS population statistics it is anticipated that the development site would include approximately 449 primary school-aged children8
Discussions with the Department of Education revealed that one of the major attractors to the current school is the “country feel”, which would change as the area is developed. It considered that the school population will draw fewer children from other areas in Shepparton.
, who are most suitably located for enrolment at Grahamvale PS.
Demand for student placements residing off-site is estimated to include approximately half of current student population, 150 placements. This would result in a total primary school population of approximately 600 children.
Students residing within the development site area would not generate any external trips to/from the site. School trips are actually taken into consideration within the standard residential peak hour traffic generation rate of 0.8trips per dwelling, as discussed in 6.1.2.
The expansion of the school would therefore be likely to result in a reduction in external trips. For the purpose of this investigation the effect of any potential reduction in trips from the external road network has not been analysed.
7 ‘Shepparton North East Growth Area Activity Centre Demand’ report prepared by Applied Development Research Pty Ltd, October 20088 Based on Shepparton ABS Population Data (2006) for people aged from 5 to 11.

AECOMShepparton North East Growth Corridor DevelopmentTraffic Impact Assessment
D R A F T
27
6.1.5 Primary School Traffic Generation Methodology
As there are no formal guidelines recommended for calculating traffic generation for primary schools a methodology has been formulated and agreed with the CGS Engineering Projects department. The methodology is described in the following paragraphs.
The traffic generation for Grahamvale PS is based on number of students in each vehicle. The 2006 ABS census data for the Shepparton North ABS catchment area demonstrates the family composition includes a total of:
35% family households have one child and 65% of family households have two or more children.
AECOM estimate that trips to the school made by the students residing externally to the development site include one trip for families with one child and one trip for families with two or more children each way.
Trips generated by staff are estimated based on the following assumptions:
600 students35 staff members including: 30 teachers (1 teacher per 20 students) and 5 support staff
Table 6.2 displays the trip generation estimation of the existing Grahamvale PS and the proposed expansion.Table 6.2: Total Trips Generated by Students on the External Road Network during the peak hour
Children in Family
Percentage of Total
ExistingChildren
ExistingTrip Generation
Proposed Children
Proposed Trip Generation
1 child 35% 105 210 53 1062 + children 65% 195 195 97 97Staff - - - - 35Total - 300 405 150 238
* include 2 or more children in each car trip
Therefore a reduction in 167 trips on the external road network is expected9
6.2. The proposed 238 trips are
expected to be distributed as described in section .
Due to the set down/pick up nature of primary school trips, for trips from external locations the following profile has been assumed:
Students
AM Peak: 50% of trips in and 50% of trips outPM Peak: 50% of trips in and 50% of trips out
Staff
AM Peak: 100% of trips in PM Peak: 100% of trips out
9 For the purposes of this assessment the reduced trips will not be reduced from the road network.

AECOMShepparton North East Growth Corridor DevelopmentTraffic Impact Assessment
D R A F T
28
6.1.6 Total Peak Hour Trips
Table 6.3 displays the total trip generation estimation on the external road network during the AM and PM peak hours.Table 6.3: Total Trips Generated on the External Road Network during the peak hour
Land Use Trips per Peak Hour
AM Peak PM PeakTrips In Trips Out Trips In Trips Out
Residential 1342 134 1208 939 403Retail 17 9 8 8 9Primary School 238 137 101 101 137Total 1597 280 1317 1048 549

AECOMShepparton North East Growth Corridor DevelopmentTraffic Impact Assessment
D R A F T
29
6.2 Vehicular Traffic DistributionA traffic distribution assignment estimate is based on an assessment of the local attractions including locations of neighbouring towns, proximity to locations of employment and schools and ‘travel to work’ characteristics of the residents of Greater Shepparton. The estimated traffic distribution has been agreed with the CGS Engineering Projects department. The agreed traffic distribution assignment for the North East Growth Area proposed development is estimated to be:
10% north10% east60% south and 20% west.
This distribution includes a bias toward Shepparton town centre located approximately four kilometres from the site and slightly increased traffic flows to Mooroopna and other local attractors west of the site.
Traffic distribution out of the development site area is divided with 35% of traffic using the main Verney Street access point north of Hawkins Street, 32% utilising the Grahamvale Road access point, 25% utilising the secondary Verney Street access point at the intersection with Pine Road and 8% utilising the Ford Road access point.
The distribution has been further broken down and assigned to the routes as detailed in Figure 6.1.Figure 6.1
A full summary of the volumes added to each intersection analysed in included in Appendix C.Figure 6.1: Traffic Movement Distribution
(source: maps.google.com)
Shepparton Town Centre
(4 km)
Mooroopna(9 km)
3%
KeyNorthSouthEastWest
5%
5%
5%
5% 3%15% 2%
15% 10%
15%
10%
15%
20%
2%
8%
10%
3%2% 5%
2%
Dookie(26 km)
Numurkah(30 km)
5%3%

AECOMShepparton North East Growth Corridor DevelopmentTraffic Impact Assessment
D R A F T
30
6.3 Summary of Forecast TrafficTable 6.4 summarises the peak hour forecast traffic generated by the development.Table 6.4: Summary of Peak Hour Forecast Traffic Generated by the Development
Site Entrance Percentage Peak Hour TripsVerney Road between Ryeland Drive and Hawkins Street (main) 35% 559Verney Road extension of Pine Road (minor) 25% 399Grahamvale Road 32% 511Ford Road 8% 128Total Trips 1597
Table 6.4 details that there is a total forecast of 1597 trips generated by the development in the peak hours. The main Verney Road entrance is forecast to accommodate approximately 559 trips in the AM and PM peaks, while the secondary Verney Road entrance is forecast to accommodate approximately 399 trips in the AM and PM peaks. The Grahamvale Road entrance is forecast to accommodate approximately 511 trips in the AM and PM peaks. The Ford Road entrance is forecast to accommodate approximately 128 trips in the AM and PM peaks.The anticipated trip distribution forecast for the external road network is as illustrated in Figure 6.1.
The forecast traffic generated by the development in the AM and PM peak hour is summarised in Table 6.5 andTable 6.6 respectively. Appendix C details the additional forecast traffic for each intersection analysed. Table 6.5: Summary of AM Peak Hour Forecast Traffic
DirectionDist. Share
Access PointsVerney Road (main) Verney Road (minor) Grahamvale Road Ford Road
Trips In Trips Out Trips In Trips Out Trips In Trips Out Trips In Trips OutSouth 60% 56 263 56 263 56 263 0 0West 20% 28 132 14 66 14 66 0 0East 10% 0 0 0 0 14 66 14 66North 10% 14 66 0 0 6 26 8 40Total 98 461 70 329 90 421 22 105
Table 6.6: Summary of PM Peak hour Forecast Traffic
DirectionDist. Share
Access PointsVerney Road (main) Verney Road (minor) Grahamvale Road Ford RoadTrips In Trips Out Trips In Trips Out Trips In Trips Out Trips In Trips Out
South 60% 210 110 210 110 210 110 0 0West 20% 105 55 52 27 52 27 0 0East 10% 0 0 0 0 52 27 52 27North 10% 52 27 0 0 21 11 31 16Total 367 192 262 137 335 176 84 44

AECOMShepparton North East Growth Corridor DevelopmentTraffic Impact Assessment
D R A F T
31
7.0 Traffic ImpactThe following paragraphs outline the impact of the proposed development on the surrounding road network. The analysis has been estimated for the year the development is expected to be completed (2020) and assumes full occupancy of residential, retail and educational facilities.
As detailed in Chapter 5, four access points are proposed for the development including:
Verney Road between Ryeland Drive and Hawkins Street (primary) – anticipated approximately 560 peak hour tripsVerney Road extension of Pine Road (secondary) – anticipated approximately 400 peak hour tripsGrahamvale Road and Ford Road (local) – anticipated approximately 510 and 130 peak hour trips respectively
It is anticipated that these access points will affect the following external intersections along Verney Road:
Ford RoadHawkins StreetPine Road (site entrance) and Balaclava Road.
It is anticipated that along Grahamvale Road the following external intersections will be affected:
Ford Road and New Dookie Road.
The impact on the intersection of Grahamvale Road and Hawkins Street has also been analysed.
These ten intersections have been analysed to provide an understanding of the impact on the surrounding road network and to establish any necessary improvements to the local road network for vehicles.
Full SIDRA analysis results are contained within Appendix B.Recommendations are also provided in Section 7.3 on appropriate treatments at the entrances to the development site on Verney Road and Grahamvale Road.
7.1 Verney Road and Grahamvale Road IntersectionsTable 7.1 to Table 7.5 summarise the likely operational characteristics of the six intersections along Verney Road and Grahamvale Road during the AM and PM weekday peak hours in the design year 2020 based on the traffic generation estimated in the previous chapters.
7.1.1 Verney Road Intersections
Table 7.1 summarises the operation of the Verney Road / Balaclava Road roundabout with the forecast traffic.Table 7.1: Verney Road / Balaclava Road 2020 Peak Hour Roundabout Operation with Development Traffic
Intersection ArmDegree of Saturation Average Delay (sec) Level of Service AM Peak PM Peak AM Peak PM Peak AM Peak PM Peak
Hawdon Street(South) 0.453 0.688 7.7 10.7 LOS A LOS BNew Dookie Road (East) 0.857 0.692 23.0 10.7 LOS C LOS BVerney Road (North) 0.863 0.499 15.5 6.0 LOS B LOS ABalaclava Road (West) 0.487 0.642 7.0 13.6 LOS A LOS BAll Approaches 0.865 0.692 14.3 10.3 LOS B LOS B
Table 7.1 indicates that with the inclusion of the development traffic, the roundabout intersection will operate with a satisfactory level of service, but will be highly saturated particularly in the AM peak hour.

AECOMShepparton North East Growth Corridor DevelopmentTraffic Impact Assessment
D R A F T
32
Table 7.2 summarises the operation of the Verney Road / Hawkins Street T-intersection with the forecast traffic.The intersection has been analysed assuming the installation of a 30 m slip lane to accommodate the high number of vehicles turning right out of Hawkins Street. There is a large utility pole approximately 35 m from the intersection which will limit the length of the left hand turn slot.Table 7.2: Verney Road / Hawkins Street 2020 AM Peak Hour T-intersection Operation with Development Traffic
Intersection Arm Degree of Saturation Average Delay (sec) Level of ServiceVerney Road(South) 0.128 1.7 LOS AHawkins Street(West) 0.627 28.8 LOS DVerney Road(North) 0.383 5.0 LOS AAll Approaches 0.628 7.7 -
Table 7.2 reveals that there are significant delays for vehicles turning right from Hawkins Street. The SIDRA analysis shows that these vehicles will experience an average delay of approximately one minute in the AM peak. However, the analysis does not account for the beneficial effects of the platooned arrivals generated by the proposed traffic signals at the Verney Road / Pine Road intersection. It is likely that the platooning of northbound traffic on Verney Road will create gaps for right turning vehicles to exit Hawkins Street and assist vehicles to turn out of Hawkins Street. Furthermore if right turning vehicles do experience significant delays these vehicles are likely to reroute and access Verney Road via the proposed signalised intersection at Pine Road. The assumed 2020 traffic distribution forecasts only 67 right turning vehicles at the Verney Road / Hawkins Street intersection. The Verney Road / Pine Road signalised intersection has adequate capacity to accommodate these additional right turn movements.
Table 7.3 summarises the operation of the Verney Road / Ford Road roundabout with the forecast traffic.Table 7.3: Verney Road / Ford Road 2020 Peak Hour Roundabout Operation with Development Traffic
Intersection ArmDegree of Saturation Average Delay (sec) Level of Service AM Peak PM Peak AM Peak PM Peak AM Peak PM Peak
Verney Road (North) 0.229 0.286 7.0 6.8 LOS A LOS AFord Road(East) 0.240 0.193 7.3 7.3 LOS A LOS AVerney Road (South) 0.222 0.254 6.6 6.6 LOS A LOS AFord Road(West) 0.239 0.201 7.7 7.1 LOS A LOS AAll Approaches 0.240 0.286 7.1 6.9 LOS A LOS A
Table 7.3 indicates that the Verney Road / Ford Road intersection has plenty of capacity, even with the additional movements forecast by the development.
7.1.2 Grahamvale Road Intersections
The Grahamvale Road intersections have been assessed with a theoretical HGV profile of 7%. This is based on the assumption that the proportion of HGV movements will decrease due to the increased number of cars movements as a result of the development site and also a reduction in HGV movements as a result of the opening of the Shepparton Bypass.
Table 7.4 summarises the operation of the Grahamvale Road / Dookie Shepparton Road roundabout with the forecast traffic.

AECOMShepparton North East Growth Corridor DevelopmentTraffic Impact Assessment
D R A F T
33
Table 7.4: Grahamvale Road / Dookie Shepparton Road 2020 Peak Hour Roundabout Operation with Development Traffic
Intersection ArmDegree of Saturation Average Delay (sec) Level of Service AM Peak PM Peak AM Peak PM Peak AM Peak PM Peak
Doyles Road (South) 0.414 0.553 5.9 5.8 LOS A LOS ADookie Shepparton Road (East) 0.470 0.346 10.7 7.5 LOS B LOS AGrahamvale Road (North) 0.755 0.458 8.7 6.1 LOS A LOS ADookie Shepparton Road (West) 0.398 0.512 6.7 10.1 LOS A LOS BAll Approaches 0.755 0.554 7.9 7.1 LOS A LOS A
Table 7.4 indicates that the additional westbound and southbound movements in the AM peak hour (and northbound movements in the PM peak hour) at the Grahamvale Road / Dookie Shepparton Road roundabout result in a high degree of saturation on most arms, however the roundabout is still operating well.
Table 7.5 summarises the operation of the Grahamvale Road / Ford Road priority junction with the forecast traffic.Table 7.5: Grahamvale Road / Ford Road 2020 Peak Hour Priority Junction Operation with Development Traffic
Intersection ArmDegree of Saturation Average Delay (sec) Level of Service AM Peak PM Peak AM Peak PM Peak AM Peak PM Peak
Grahamvale Road (South) 0.110 0.093 1.0 3.0 LOS A LOS AFord Road(East) 0.210 0.387 12.1 14.3 LOS B LOS BGrahamvale Road (North) 0.129 0.202 4.5 2.9 LOS A LOS AFord Road(West) 0.272 0.177 9.5 10.3 LOS A LOS BAll Approaches 0.273 0.387 5.9 6.5 - -
Table 7.5 indicates that the Grahamvale Road / Ford Road intersection has plenty of capacity, even with the additional movements forecast by the development.
7.2 Goulburn Valley Highway Intersections7.2.1 Hawkins Street/ Goulburn Valley Highway Priority Intersection
For the Hawkins Street / Goulburn Valley Highway intersection two scenarios for 2020 have been analysed these include:
2020 Scenario without forecast development traffic2020 Scenario with forecast development traffic
2020 Scenario Without Forecast Development Traffic
The estimated 2020 scenario peak hour traffic flows (without forecast development traffic) set out in Table 7.6.

AECOMShepparton North East Growth Corridor DevelopmentTraffic Impact Assessment
D R A F T
34
Table 7.6: Estimated 2020 Traffic Flows10
Intersection ArmLeft Through RightAM Peak PM Peak AM Peak PM Peak AM Peak PM Peak
Goulburn Valley Highway (Southbound) 58 124 721 598 45 90Goulburn Valley Highway (Northbound) 65 82 456 519 123 277Hawkins Street 109 137 0 0 28 19
As shown in Table 7.6 in the AM Peak Goulburn Valley Highway is projected to experience 721 southbound and 456 northbound movements in the peak hour. Hawkins Street is expected to experience approximately 181 eastbound and 137 westbound movements in the AM Peak hour.
In the PM Peak Goulburn Valley Highway is projected to experience 598 southbound and 404 northbound movements in the peak hour. Hawkins Street is expected to experience approximately 402 eastbound and 157westbound movements in the PM Peak hour.
Table 7.7 displays the results of the intersection analysis for a 2020 scenario without forecast traffic for the proposed development. Full SIDRA results are included in Appendix B.Table 7.7: Hawkins Street / Goulburn Valley Highway SIDRA Analysis for 2020 Scenario without Development Traffic
Intersection ArmDegree of Saturation Average Delay (sec) Level of Service AM Peak PM Peak AM Peak PM Peak AM Peak PM Peak
Goulburn Valley Highway (South) 0.229 0.466 3.5 6.3 LOS A LOS AHawkins Street (East) 0.843 0.501 61.0 28.9 LOS F LOS FGoulburn Valley Highway (North) 0.220 0.201 1.2 2.4 LOS A LOS AAll Approaches 1.000 0.500 7.3 6.5 - -
The results of the 2020 intersection analysis suggest that the intersection would require improvements, especially due to the significant delays for vehicles turning right from Hawkins Street. These vehicles experienced an average delay of almost 4 minutes in the AM peak and over 2 minutes in the PM peak. The delay is considered excessive and warrants signalisation.
As detailed the Traffic Engineering Manual Volume 1, Chapter 3 – Edition 3, Revision A, (2001) VicRoads recommend that signalisation may be required under the following circumstances:
Traffic signals may be considered subject to detailed analysis; when the major road carries at least 600 vehicles/hour (two way) and the minor road concurrently carries at least 200 vehicles (one way) on one approach over any 4 hours of an average day.
Based on the 2020 forecast SIDRA analysis, previous consideration of signalisation and accident history, it is considered that this intersection would operate more efficiently and safely with signalisation even without the proposed development.
2020 Scenario with development traffic
The estimated 2020 scenario peak hour traffic flows with forecast development traffic are set out in Table 7.8.Table 7.8: Estimated 2020 Traffic Flows11
10 CGS 2005 survey information plus 1.0% growth per annum (except for movements to the service road which are not expected to attract additional growth
with Development Traffic

AECOMShepparton North East Growth Corridor DevelopmentTraffic Impact Assessment
D R A F T
35
Intersection Arm
Left Through RightAM Peak PM Peak AM Peak PM Peak
AM Peak PM Peak
Goulburn Valley Highway (Southbound) 58 124 721 598 45 90Goulburn Valley Highway(Northbound) 65 82 456 519 193 489Hawkins Street 439 274 0 0 28 19
As shown in Table 7.8 the through movements along Goulburn Valley Highway are expected to remain the same with the addition of the development traffic.
The inclusion of the development traffic is expected to further increase the number of eastbound and westbound movements along Hawkins Street to approximately 251 eastbound and 467 westbound movements in the AM peak and approximately 614 eastbound and 294 westbound movements in the PM peak.
Table 7.9 displays the results of the intersection analysis for a 2020 scenario with forecast flows for the proposed development. Full SIDRA results are included in Appendix B.Table 7.9: Hawkins Street / Goulburn Valley Highway SIDRA Analysis for 2020 Scenario with Forecast Development Traffic
Intersection ArmDegree of Saturation Average Delay (sec) Level of Service AM Peak PM Peak AM Peak PM Peak AM Peak PM Peak
Goulburn Valley Highway (South) 0.360 0.825 4.9 12.3 LOS A LOS BHawkins Street (East) 1.345 0.912 52.8 40.9 LOS F LOS EGoulburn Valley Highway (North) 0.220 0.201 1.2 2.4 LOS A LOS AAll Approaches 1.418 1.000 14.6 12.5 - -
The results of the 2020 intersection analysis suggest that in the 2020 scenario with development traffic the intersection would require improvements to enable safe and efficient operation, especially due to the significant delays for vehicles turning right from Hawkins Street. These vehicles experienced an average delay of over 9.5minutes in the AM peak and over 6.0 minutes in the PM peak.
The results of the estimated traffic generation indicate that signalisation of the intersection may be necessary to provide safe and efficient operation. Accordingly, the intersection has been analysed to provide an understanding of operation with signalisation based on the estimated flows.
The following phasing sequence was used to construct the phasing operation for the SIDRA model.
11 As described for Table 7.6.

AECOMShepparton North East Growth Corridor DevelopmentTraffic Impact Assessment
D R A F T
36
In both the AM and PM peaks the phasing sequence used for the SIDRA model included:
Phase A Phase B
The SIDRA models were set to optimised phase times and the results reflected a reasonable distribution of time for the particular volume of movements.
Table 7.10 displays the results of the intersection analysis for a 2020 scenario with the proposed developmentestimated traffic flows.Table 7.10: Hawkins Street / Goulburn Valley Highway Signalised Intersection SIDRA Analysis for 2020 Scenario with Proposed
Development
Intersection ArmDegree of Saturation Average Delay (sec) Level of Service AM Peak PM Peak AM Peak PM Peak AM Peak PM Peak
Goulburn Valley Highway (South) 0.904 1.000 19.3 24.9 LOS B LOS CHawkins Street (East) 1.000 1.000 11.1 16.3 LOS B LOS BGoulburn Valley Highway (North) 0.707 0.358 15.9 17.6 LOS B LOS BAll Approaches 0.999 1.000 16.0 20.9 LOS B LOS C
As shown in Table 7.10, the results of the signalised intersection analysis indicate a more even distribution of traffic flows. The results indicate higher levels of saturation for Goulburn Valley Highway, however the operation of Hawkins Street indicates significant improvement and acceptable operation in both peak periods with average delays ranging from 19 to 52 seconds.
7.3 Development Entrance Treatments 7.3.1 Verney Road Main Entrance
It is anticipated that the main ‘gateway’ entrance to the development will be located on Verney Road, north of the Christian School, between Ryeland Drive and Hawkins Street. This will be located adjacent to the local retail and community hub.
Based on the anticipated traffic distribution and flows as estimated in sections 6.2 and 6.3, the main entrance would operate well with a priority T-Intersection as shown in Figure 7.1.

AECOMShepparton North East Growth Corridor DevelopmentTraffic Impact Assessment
D R A F T
37
Figure 7.1: Proposed Priority T-Intersection at Verney Road Main Site Intersection
As shown in Figure 7.1, the intersection will require dedicated left turn lanes to promote continuous flow of trafficon Verney Road.
Table 7.11 details the SIDRA analysis for the main Verney Road site entrance located between Ryeland Driveand Hawkins Street.Table 7.11: Verney Road / Main Site Entrance 2020 Peak Hour Priority T-Intersection, with Development Traffic
Intersection Arm Degree of Saturation Average Delay (sec) Level of ServiceAM Peak PM Peak AM Peak PM Peak AM Peak PM Peak
Verney RoadSouth 0.147 0.409 2.6 7.0 A AMain Site Entrance 0.586 0.261 15.9 15.8 C CVerney Road North 0.232 0.247 0.3 0.9 A ATotal Intersection 0.586 0.409 6.8 6.0 - -
As shown in Table 7.11, the intersection will operate well in the peak hours with average delays of less thanseven seconds and low degrees of saturation.
7.3.2 Verney Road /Pine Road Site Entrance
The Verney Road / Pine Road / site entrance will create a cross intersection with the existing eastern end of PineRoad and provide access to the southern part of the site.
The results of the 2020 intersection analysis of the Verney Road / Pine Road priority intersection (contained withinAppendix B) suggest that in the 2020 scenario with development traffic the intersection would requireimprovements to enable safe and efficient operation, especially due to the significant delays for through and rightturning vehicles exiting Pine Road and the development entry. These vehicles experienced an average delay ofover 2.5 minutes in the AM peak.
As detailed the Traffic Engineering Manual Volume 1, Chapter 3 – Edition 3, Revision A, (2001) VicRoadsrecommend that signalisation may be required under the following circumstances:
Traffic signals may be considered subject to detailed analysis; when the major road carries at least 600vehicles/hour (two way) and the minor road concurrently carries at least 200 vehicles (one way) on one approachover any 4 hours of an average day.

AECOMShepparton North East Growth Corridor DevelopmentTraffic Impact Assessment
D R A F T
38
As detailed in Appendix B, Verney Road is projected to experience 491 southbound and 265 northboundmovements in the AM peak hour. Pine Road is expected to experience approximately 214 eastbound movementsin the AM Peak hour and the road leading to the development entry is expected to experience approximately 330westbound movements in the AM Peak hour.
The results of the estimated traffic generation indicate that signalisation of the intersection may be necessary toprovide safe and efficient operation. Accordingly, the intersection has been analysed to provide an understandingof operation with signalisation based on the estimated flows. The layout of the proposed signalised intersectionanalysed is shown in Figure 7.2.Figure 7.2: Proposed Signalised Intersection at Verney Road / Pine Road Intersection
Table 7.12 summarises the SIDRA analysis of the operation of the Verney Road / Pine Road signalisedintersection with the forecast traffic.Table 7.12: Verney Road / Pine Road Site Entrance 2020 Peak Hour Signalised Intersection, with Development Traffic
Intersection Arm Degree of Saturation Average Delay (sec) Level of ServiceVerney Road(South) 0.504 11.5 LOS BDevelopment Entry(East) 0.522 11.8 LOS BVerney Road(North) 0.757 12.1 LOS BPine Road(West) 0.755 21.4 LOS CAll Approaches 0.757 13.2 LOS B
As shown in Table 7.12, the results of the signalised intersection analysis indicate that the signalised intersectionwill operate with a ‘Very Good’ to ‘Good’ Level of Service. The results indicate higher levels of saturation forVerney Road, however the operation of both Pine Road and the development entry indicates significantimprovement and acceptable operation in the AM peak period (which is anticipated to be the critical peak period)with average delays ranging from 12 to 24 seconds.

AECOMShepparton North East Growth Corridor DevelopmentTraffic Impact Assessment
D R A F T
39
7.3.3 Grahamvale Road Site Entrance
The Grahamvale Road site entrance is anticipated to be located near Grahamvale Primary School. For thepurpose of this investigation, it has been estimated that the Grahamvale Primary School will relocate theirentrance to within the site, which would provide a safer access point for the high frequency of children.
Based on the anticipated traffic distribution and flows as estimated in sections 6.2 and 6.3, the results of the 2020intersection analysis of the Grahamvale Road site entrance priority intersection (contained within Appendix B)suggest that in the 2020 scenario with development traffic the intersection would require an intersection treatmentgreater than a priority intersection to enable safe and efficient operation, especially due to the significant delaysfor vehicles travelling south from the site. These vehicles experienced an average delay of seven minutes in theAM peak.
This intersection could potentially operate sufficiently as a roundabout; however the flows are not closelybalanced enough to support good operation using a roundabout. Furthermore, as Grahamvale Road is aVicRoads designated road it is not expected that a roundabout would be preferred by VicRoads at this location.In addition to these two factors, there may be space constraints due to the drain on the west side that wouldprohibit the inclusion of a roundabout at this location.
Accordingly the Grahamvale Road site entrance has been analysed to be controlled by a signalised intersectionwith a layout as shown in Figure 7.3.Figure 7.3: Proposed Signalised Intersection at Grahamvale Road Site Entrance Signalised Intersection
Table 7.13 details the SIDRA analysis for the Grahamvale Road site entrance intersection.Table 7.13: Grahamvale Road Site Entrance 2020 Peak Hour Signalised Intersection, with Development Traffic
Intersection Arm Degree of Saturation Average Delay (sec) Level of ServiceAM Peak PM Peak AM Peak PM Peak AM Peak PM Peak
Grahamvale RoadSouth 0.745 0.734 15.5 13.8 B BGrahamvale RoadNorth 0.604 0.392 12.7 8.2 B ASite Entrance 0.683 0.637 18.6 27.3 B CTotal Intersection 0.745 0.735 16.1 14.5 B B

AECOMShepparton North East Growth Corridor DevelopmentTraffic Impact Assessment
D R A F T
40
As shown in Table 7.13: , the intersection will operate with a ‘Very Good’ Level of Service in the peak hours withaverage delays of less than seventeen seconds.
7.3.4 Ford Road Site Entrance
The Ford Road site entrance is anticipated to be located west of Grahamvale Road. Based on the anticipatedtraffic distribution and flows as estimated in sections sections 6.2 and 6.3, the Ford Road site entrance wouldoperate well with a priority T-Intersection as shown in Figure 7.4.Figure 7.4: Proposed Priority T-Intersection at Ford Road Site Entrance Intersection
Table 7.14 details the SIDRA analysis for the Ford Road site entrance.Table 7.14: Verney Road / Main Site Entrance 2020 Peak Hour Priority T-Intersection, with Development Traffic
Intersection Arm Degree of Saturation Average Delay (sec) Level of ServiceAM Peak PM Peak AM Peak PM Peak AM Peak PM Peak
Site Entrance 0.163 0.068 10.4 10.1 B BFord Road East 0.044 0.050 1.9 5.2 A AFord Road West 0.034 0.028 0.3 0.4 A ATotal Intersection 0.167 0.069 4.9 5.1 -
As shown in Table 7.14, the intersection will operate very well in the peak hours with average delays of fiveseconds and a very good Level of Service.
7.4 ConclusionsThe following paragraphs discuss the conclusions of the traffic impact on the local road network as a result of theproposed development of the North East Growth Area in Shepparton.
7.4.1 Verney Road and Grahamvale Road Intersections
Generally the intersections are adequate to accommodate the additional forecast traffic as proposed in Chapter 5.
However, the analysis indicates that the proposed additional forecast traffic flows at the Hawkins Street / VerneyRoad intersection are likely to result in the requirement of intersection improvements such as signalisation.
Grahamvale Road will operate satisfactorily when HGV movements are assessed with 7% HGV. However if theHGV usage was expected to remain as high as 20% in the 2020 design forecast the Grahamvale Road / DookieShepparton Road roundabout would experience operational problems. Due to this CGS should continue topursue the construction of the Shepparton Bypass as a matter of priority to ensure that no local problems develop.

AECOMShepparton North East Growth Corridor DevelopmentTraffic Impact Assessment
D R A F T
41
7.4.2 Hawkins Street / Goulburn Valley Highway Intersection
Whilst the Hawkins Street / Goulburn Valley Highway is currently operating generally well as a priority intersection, already movements from Hawkins Street are experiencing significant delays which are potentially dangerous.. CGS are aware of this safety issue and are monitoring the intersection.
Accordingly analysis of the forecast traffic for the design year 2020 (with and without the proposed development) indicate that without improvement, Hawkins Street will experience excessive delays and inevitably an increased safety risk.
Based on these factors the operation of the Hawkins Street / Goulburn Valley Highway intersection was analysed to understand how it could operate as a signalised intersection in 2020 (with the forecast development traffic). It was found that the priority was more evenly distributed resulting in acceptable average delays for all arms of the intersection.
As the base traffic flows for this analysis were collected in 2005 it is recommended that further traffic analysis should be carried out (with recent survey data) to ensure the intersection can cater for the future demands. Notwithstanding this, it is highly probable that the flows along Hawkins Street and Goulburn Valley Highway will necessitate improvements (such as signalisation) to this intersection.
7.4.3 Development Entrance Treatments
Based on the forecast traffic flows for the proposed development and the expected background flows along Verney Road and Grahamvale Road, it is recommended that the most suitable entrance treatments will include:
Signalised Intersections
Verney Road / Pine Road / Site EntranceGrahamvale Road Site Entrance
Priority T-Intersections
Verney Road Site Entrance between Ryeland Drive and Hawkins StreetFord Road Site Entrance
This should be taken into consideration during the detail design of the development.

AECOMShepparton North East Growth Corridor DevelopmentTraffic Impact Assessment
D R A F T
42
8.0 Further IssuesFurther to the findings of this investigation there are issues that may impact the traffic operation of the local road network. These issues have been summarised in the following paragraphs.
8.1 Sustainable Transport DesignMeasures to reduce the reliance on the private car should be investigated for this development. This will enable a reduction in trips made by private cars reducing the pressure on the local road network. This will also enableresidents and employers travel options other than the private car.
Well planned and strategically placed bus routes and links to existing services should be explored for trips to Shepparton, Mooroopna, other civic attractions, employment areas and secondary colleges. This will enable sustainable transport choice, reduction in vehicle trips on the local road network and increase the accessibility of residents that do not drive (including senior citizens and teenagers).
A well planned, permeable cycle network with strategic links should also be designed to assist the reduction in vehicle trips on the local road network. There is already a good cyclist network infrastructure established in the local area and there is opportunity to strengthen this as a part of the proposed development.
In addition safe, well planned permeable pedestrian network should be established to encourage local trips by foot and reduce vehicle trips on the local road network.
Other sustainable travel planning initiatives such as local travel plans and car sharing clubs should also be considered to reduce the reliance of the private car, reduce vehicle trips on the local road network and increase accessibility of the future residents and employees of the North East Growth Area development.
The development should be designed in accordance with the Public Transport: Guidelines for Land Use and Development.
8.2 Encouraging Shepparton Bypass DevelopmentThe development and opening of the Shepparton Bypass will directly impact the local road network of the North East Growth Area development.
As discussed previously, Grahamvale Road is currently the bypass route for HGVs and accordingly experiences ahigh proportion of HGV traffic. It is estimated that the traffic operation with forecast development flows is likely fit comfortably within the existing intersections with Ford Road and New Dookie Road however, if Grahamvale Road was to experience 20% HGV traffic these two intersections may experience operational difficulties and increase the risk of accidents.
In addition, there are considerable safety issues as Grahamvale Road will also accommodate the secondary access point for the development likely to carry approximately 32% of all trips to/from the site.
It is recommended that CGS continue to pursue the timely development of the Shepparton Bypass in order to reduce the risk and enable satisfactory traffic operation along Grahamvale Road.

AECOMShepparton North East Growth Corridor DevelopmentTraffic Impact Assessment
D R A F T
A
Appendix A
Existing Traffic Flows
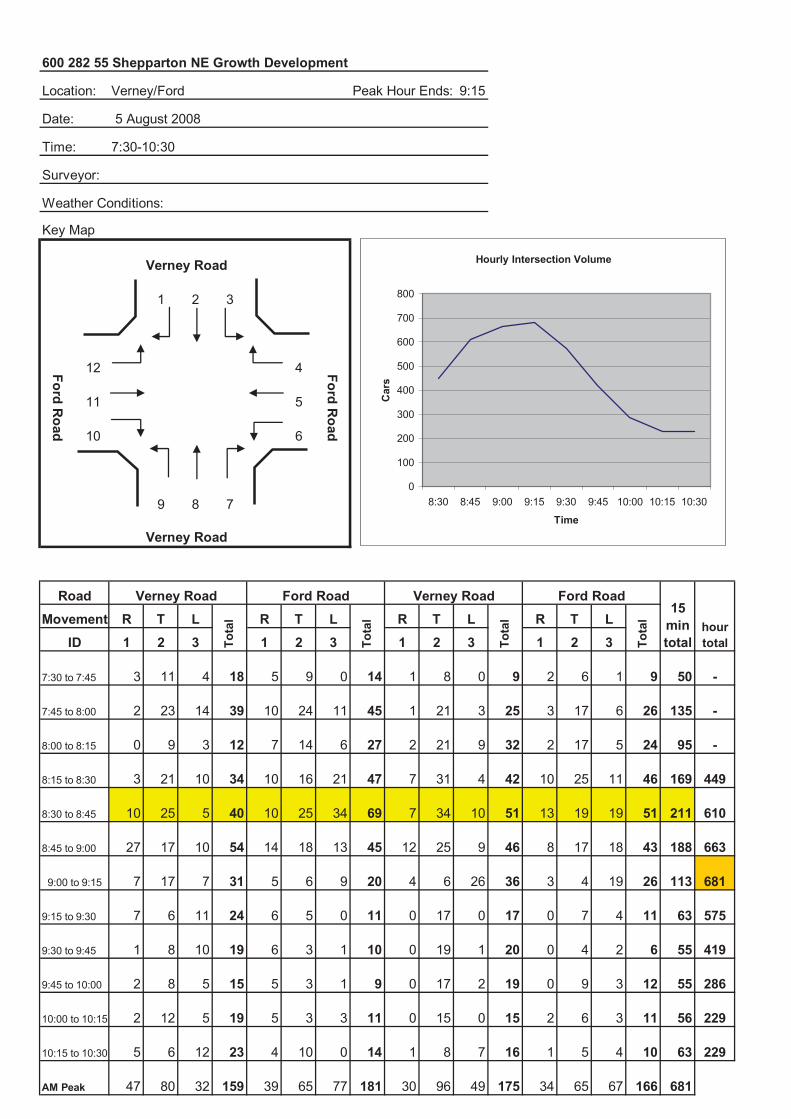
600 282 55 Shepparton NE Growth Development
Location: Verney/Ford Peak Hour Ends: 9:15
Date: 5 August 2008
Time: 7:30-10:30
Surveyor:
Weather Conditions:
Key Map
Verney Road
1 2 3
12 4
11 5
10 6
9 8 7
Verney Road
R T L R T L R T L R T L1 2 3 1 2 3 1 2 3 1 2 3
7:30 to 7:45 3 11 4 18 5 9 0 14 1 8 0 9 2 6 1 9 50 -
7:45 to 8:00 2 23 14 39 10 24 11 45 1 21 3 25 3 17 6 26 135 -
8:00 to 8:15 0 9 3 12 7 14 6 27 2 21 9 32 2 17 5 24 95 -
8:15 to 8:30 3 21 10 34 10 16 21 47 7 31 4 42 10 25 11 46 169 449
8:30 to 8:45 10 25 5 40 10 25 34 69 7 34 10 51 13 19 19 51 211 610
8:45 to 9:00 27 17 10 54 14 18 13 45 12 25 9 46 8 17 18 43 188 663
7 17 7 31 5 6 9 20 4 6 26 36 3 4 19 26 113 681
9:15 to 9:30 7 6 11 24 6 5 0 11 0 17 0 17 0 7 4 11 63 575
9:30 to 9:45 1 8 10 19 6 3 1 10 0 19 1 20 0 4 2 6 55 419
9:45 to 10:00 2 8 5 15 5 3 1 9 0 17 2 19 0 9 3 12 55 286
10:00 to 10:15 2 12 5 19 5 3 3 11 0 15 0 15 2 6 3 11 56 229
10:15 to 10:30 5 6 12 23 4 10 0 14 1 8 7 16 1 5 4 10 63 229
AM Peak 47 80 32 159 39 65 77 181 30 96 49 175 34 65 67 166 681
15mintotal
hourtotalTo
tal
Tota
l
Tota
l
Tota
l
Verney Road Ford Road
Ford Road
Ford Road
ID
9:00 to 9:15
MovementVerney Road Ford RoadRoad
Hourly Intersection Volume
0
100
200
300
400
500
600
700
800
8:30 8:45 9:00 9:15 9:30 9:45 10:00 10:15 10:30
Time
Car
s

600 282 55 Shepparton NE Growth Development
Location: Verney/Ford Peak Hour Ends: 16:00
Date: 5 August 2008
Time: 15:00-18:00
Surveyor:
Weather Conditions:
Key Map
Verney Road
1 2 3
12 4
11 5
10 6
9 8 7
Verney Road
R T L R T L R T L R T L
1 2 3 1 2 3 1 2 3 1 2 3
15:00 to 15:15 16 30 6 52 15 11 6 32 2 13 4 19 1 17 9 27 130 -
15:15 to 15:30 13 40 11 64 7 28 16 51 8 28 10 46 4 9 5 18 179 -
15:30 to 15:45 18 32 6 56 6 18 8 32 14 38 13 65 3 26 23 52 205 -
15:45 to 16:00 15 31 19 65 6 17 7 30 6 27 5 38 6 25 16 47 180 694
16:00 to 16:15 4 16 8 28 6 8 7 21 10 25 3 38 1 14 11 26 113 677
16:15 to 16:30 5 6 10 21 11 8 7 26 10 13 7 30 10 6 8 24 101 599
16:30 to 16:45 7 17 10 34 18 20 16 54 11 10 12 33 14 5 14 33 154 548
16:45 to 17:00 7 11 10 28 5 11 8 24 9 10 6 25 8 9 7 24 101 469
17:00 to 17:15 9 18 9 36 6 10 3 19 3 13 3 19 0 11 15 26 100 456
17:15 to 17:30 3 30 6 39 9 9 8 26 3 13 10 26 2 19 6 27 118 473
17:30 to 17:45 6 13 6 25 10 7 5 22 4 15 4 23 18 13 8 39 109 428
17:45 to 18:00 7 22 10 39 2 4 6 12 3 18 5 26 4 12 7 23 100 427
PM Peak 62 133 42 237 34 74 37 145 30 106 32 168 14 77 53 144 694
15mintotal
hourtotalTo
tal
Tota
l
Tota
l
Tota
l
Verney Road Ford Road
Ford Road
Ford Road
ID
Movement
Verney Road Ford RoadRoad
Hourly Intersection Volume
0
100
200
300
400
500
600
700
800
16:00 16:15 16:30 16:45 17:00 17:15 17:30 17:45 18:00
Time
Car
s

600 282 55 Shepparton NE Growth Development
Location: Verney/Hawkins Peak Hour Ends: 9:15
Date: Thursday 19 November 2009
Time: 7:30 - 10:30am
Surveyor: Shirlene Clarke
Weather Conditions: 34deg
Verney Road Nth
1 2
6
5
4 3
Verney Road Sth
15 mintotal
hourtotal
R T T L R L
1 2 3 4 5 6
7:30 to 7:45 3 39 42 23 8 31 4 6 10 83 -
7:45 to 8:00 4 64 68 38 15 53 7 6 13 134 -
8:00 to 8:15 3 46 49 38 13 51 10 6 16 116 -
8:15 to 8:30 7 65 72 39 8 47 11 9 20 139 472
8:30 to 8:45 8 103 111 56 19 75 22 14 36 222 611
8:45 to 9:00 16 88 104 49 9 58 16 12 28 190 667
9:00 to 9:15 10 52 62 37 12 49 8 5 13 124 675
9:15 to 9:30 4 44 48 31 18 49 10 7 17 114 650
9:30 to 9:45 4 44 48 33 18 51 13 4 17 116 544
9:45 to 10:00 4 43 47 22 18 40 15 7 22 109 463
10:00 to 10:15 4 30 34 25 13 38 9 2 11 83 422
10:15 to 10:30 3 29 32 35 19 54 13 6 19 105 413
41 308 349 181 48 229 57 40 97 675
8:00 to 9:00 34 302 336 182 49 231 59 41 100 667
AM Peak
Movement
Tota
l
Tota
l
Tota
l
ID
Verney Road Nth Verney Road Sth Hawkins Street
Haw
kins Street
Road
0
100
200
300
400
500
600
700
800
Car
s
Time
Hourly Intersection Volume

600 282 55 Shepparton NE Growth Development
Location: Verney/Pine Peak Hour Ends: 9:00
Date: Thursday 19 November 2009
Time: 7:30 - 10:30am
Surveyor: Dinny Adem
Weather Conditions: 34deg
Verney Road Nth
1 2
6
5
4 3
Verney Road Sth
15 mintotal
hourtotal
R T T L R L
1 2 3 4 5 6
7:30 to 7:45 0 41 41 31 2 33 4 1 5 79 -
7:45 to 8:00 0 70 70 50 7 57 16 1 17 144 -
8:00 to 8:15 0 58 58 53 11 64 21 1 22 144 -
8:15 to 8:30 2 79 81 45 20 65 31 3 34 180 547
8:30 to 8:45 7 120 127 60 35 95 42 3 45 267 735
8:45 to 9:00 2 104 106 55 32 87 35 5 40 233 824
9:00 to 9:15 3 54 57 47 18 65 14 3 17 139 819
9:15 to 9:30 0 63 63 49 11 60 25 4 29 152 791
9:30 to 9:45 0 47 47 44 9 53 7 0 7 107 631
9:45 to 10:00 0 57 57 38 10 48 5 1 6 111 509
10:00 to 10:15 0 45 45 38 15 53 10 1 11 109 479
10:15 to 10:30 0 41 41 53 9 62 13 1 14 117 444
11 361 372 213 98 311 129 12 141 824
Movement
Tota
l
Tota
l
Tota
l
ID
AM Peak
Pine Road
Road Verney Road Nth Verney Road Sth Pine Road
0
100
200
300
400
500
600
700
800
900
Car
s
Time
Hourly Intersection Volume

600 282 55 Shepparton NE Growth Development
Location: Balaclava/Verney Peak Hour Ends 9:00
Date: 5 August 2008
Time: 7:30-10:30
Surveyor:
Weather Conditions:
Key Map
Verney Road
1 2 3
12 4
11 5
10 6
9 8 7
Verney Road
R T L R T L R T L R T L1 2 3 1 2 3 1 2 3 1 2 3
7:30 to 7:45 6 46 28 80 19 18 10 47 18 23 2 43 7 50 3 60 230 -
7:45 to 8:00 9 70 47 126 17 31 14 62 22 24 10 56 17 70 1 88 332 -
8:00 to 8:15 9 46 34 89 23 44 19 86 13 23 24 60 13 51 8 72 307 -
8:15 to 8:30 14 78 28 120 21 55 21 97 20 38 25 83 24 48 14 86 386 1255
8:30 to 8:45 18 91 32 141 28 35 36 99 29 35 20 84 18 60 16 94 418 1443
8:45 to 9:00 14 77 37 128 32 46 20 98 15 41 15 71 11 45 22 78 375 1486
12 47 26 85 27 50 18 95 7 25 18 50 12 24 7 43 273 1452
9:15 to 9:30 10 37 20 67 15 31 12 58 11 36 4 51 13 38 6 57 233 1299
9:30 to 9:45 6 41 10 57 20 44 8 72 6 39 12 57 12 29 9 50 236 1117
9:45 to 10:00 8 41 24 73 8 19 11 38 3 19 7 29 8 23 4 35 175 917
10:00 to 10:15 4 26 14 44 13 23 7 43 11 28 7 46 11 23 7 41 174 818
10:15 to 10:30 2 37 16 55 16 17 10 43 7 24 9 40 5 30 7 42 180 765
AM Peak 55 292 131 478 104 180 96 380 77 137 84 298 66 204 60 330 1486
15mintotal
hourtotalTo
tal
Tota
l
Tota
l
Tota
l
Balaclava RoadRoad
Balaclava Road
New
Dookie R
oad
Verney Road New Dookie Road
9:00 to 9:15
IDMovement
Verney Road
Hourly Intersection Volume
0
200
400
600
800
1000
1200
1400
1600
8:30 8:45 9:00 9:15 9:30 9:45 10:00 10:15 10:30
Time
Car
s

600 282 55 Shepparton NE Growth Development
Location: Balaclava/Verney Peak Hour Ends 17:30
Date: 5 August 2008
Time: 15:00-18:00
Surveyor:
Weather Conditions:
Key Map
Verney Road
1 2 3
12 4
11 5
10 6
9 8 7
Verney Road
R T L R T L R T L R T L
1 2 3 1 2 3 1 2 3 1 2 3
15:00 to 15:15 9 55 30 94 23 50 14 87 19 41 17 77 21 38 15 74 332 -
15:15 to 15:30 14 66 35 115 40 56 21 117 18 49 18 85 13 36 13 62 379 -
15:30 to 15:45 12 68 24 104 30 60 29 119 15 60 16 91 30 42 14 86 400 -
15:45 to 16:00 9 60 32 101 46 48 29 123 15 73 15 103 26 50 11 87 414 1525
16:00 to 16:15 10 66 19 95 32 53 21 106 13 48 22 83 24 29 6 59 343 1536
16:15 to 16:30 12 41 20 73 20 30 13 63 14 41 16 71 12 23 7 42 249 1406
16:30 to 16:45 7 53 22 82 35 56 17 108 6 68 18 92 21 43 10 74 356 1362
16:45 to 17:00 5 43 28 76 41 49 16 106 8 69 13 90 21 39 12 72 344 1292
17:00 to 17:15 3 39 15 57 40 47 27 114 8 52 17 77 14 26 6 46 294 1243
17:15 to 17:30 5 63 20 88 55 65 24 144 13 100 19 132 24 33 15 72 436 1430
17:30 to 17:45 9 49 13 71 27 40 13 80 20 76 6 102 10 24 11 45 298 1372
17:45 to 18:00 8 57 21 86 22 39 10 71 14 89 22 125 5 28 14 47 329 1357
PM Peak 20 198 85 303 171 217 84 472 35 289 67 391 80 141 43 264 1430
Verney RoadRoad
15mintotal
hourtotalTo
tal
Tota
l
Tota
l
Tota
l
Balaclava Road
New
Dookie R
oad
Balaclava Road
ID
Movement
Verney Road New Dookie Road
Hourly Intersection Volume
0
200
400
600
800
1000
1200
1400
1600
1800
16:00 16:15 16:30 16:45 17:00 17:15 17:30 17:45 18:00
Time
Car
s

600 282 55 Shepparton NE Growth Development
Location: Grahamvale/Ford Peak Hour Ends: 9:15
Date: 5 August 2008
Time: 7:30-10:30
Surveyor:
Weather Conditions:
Key Map
Grahamvale Road
1 2 3
12 4
11 5
10 6
9 8 7
Grahamvale Road
R T L R T L R T L R T L1 2 3 1 2 3 1 2 3 1 2 3
7:30 to 7:45 5 21 3 29 9 7 2 18 4 43 1 48 0 4 2 6 101 -
7:45 to 8:00 2 10 8 20 8 11 4 23 1 50 0 51 2 10 2 14 108 -
8:00 to 8:15 2 23 4 29 5 5 1 11 2 30 0 32 2 7 0 9 81 -
8:15 to 8:30 14 24 3 41 13 2 1 16 3 38 2 43 6 11 3 20 120 410
8:30 to 8:45 12 11 10 33 17 4 2 23 1 32 0 33 4 8 2 14 103 412
8:45 to 9:00 12 17 9 38 5 6 2 13 1 29 0 30 1 6 1 8 89 393
7 17 9 33 5 6 2 13 1 29 0 30 1 6 1 8 84 396
9:15 to 9:30 2 15 4 21 2 2 3 7 2 20 1 23 3 6 2 11 62 338
9:30 to 9:45 2 16 4 22 2 4 1 7 1 22 1 24 1 3 2 6 59 294
9:45 to 10:00 3 13 6 22 2 2 2 6 1 30 1 32 1 4 1 6 66 271
10:00 to 10:15 3 15 1 19 3 2 1 6 2 16 1 19 1 4 1 6 50 237
10:15 to 10:30 1 15 1 17 3 3 1 7 3 20 1 24 1 3 1 5 53 228
AM Peak 45 69 31 145 40 18 7 65 6 128 2 136 12 31 7 50 396
9:00 to 9:15
Ford Road
Ford Road
ID Tota
lMovementGrahamvale Road Ford RoadRoad
Tota
l
Tota
l
15mintotal
hourtotalTo
tal
Grahamvale Road Ford Road
0
50
100
150
200
250
300
350
400
450
Car
s
Time
Hourly Intersection Volume

600 282 55 Shepparton NE Growth Development
Location: Grahamvale/Ford Peak Hour Ends: 16:15
Date: 5 August 2008
Time: 15:00-18:00
Surveyor:
Weather Conditions:
Key Map
Grahamvale Road
1 2 3
12 4
11 5
10 6
9 8 7
Grahamvale Road
R T L R T L R T L R T L
1 2 3 1 2 3 1 2 3 1 2 3
15:00 to 15:15 2 29 7 38 15 4 1 20 1 26 1 28 3 13 5 21 107 -
15:15 to 15:30 2 30 6 38 18 6 3 27 1 23 1 25 3 7 4 14 104 -
15:30 to 15:45 6 61 20 87 23 9 6 38 4 20 1 25 2 6 2 10 160 -
15:45 to 16:00 1 36 21 58 6 6 2 14 1 24 2 27 1 2 2 5 104 475
16:00 to 16:15 1 44 6 51 10 7 3 20 6 22 1 29 2 10 1 13 113 481
16:15 to 16:30 1 36 6 43 8 8 5 21 2 22 0 24 0 5 1 6 94 471
16:30 to 16:45 3 50 5 58 10 6 4 20 4 22 2 28 1 9 3 13 119 430
16:45 to 17:00 1 44 12 57 5 11 2 18 1 20 0 21 0 1 1 2 98 424
17:00 to 17:15 3 51 10 64 6 9 3 18 1 15 0 16 0 2 0 2 100 411
17:15 to 17:30 2 45 8 55 7 8 0 15 3 17 0 20 1 6 1 8 98 415
17:30 to 17:45 4 50 10 64 3 6 1 10 3 20 0 23 0 5 0 5 102 398
17:45 to 18:00 1 30 6 37 4 9 1 14 0 16 1 17 1 6 2 9 77 377
PM Peak 10 171 53 234 57 28 14 99 12 89 5 106 8 25 9 42 481
Grahamvale RoadRoad
15mintotal
hourtotalTo
tal
Tota
l
Tota
l
Tota
l
Ford Road
Ford Road
Ford Road
ID
Movement
Grahamvale Road Ford Road
Hourly Intersection Volume
0
100
200
300
400
500
600
16:00 16:15 16:30 16:45 17:00 17:15 17:30 17:45 18:00
Time
Car
s
Cars

600 282 55 Shepparton NE Growth Development
Location: Grahamvale/New Dookie Peak Hour Ends: 9:00
Date: 5 August 2008
Time: 7:30-10:30
Surveyor:
Weather Conditions:
Key Map
Grahamvale Road
1 2 3
12 4
11 5
10 6
9 8 7
Grahamvale Road
R T L R T L R T L R T L1 2 3 1 2 3 1 2 3 1 2 3
7:30 to 7:45 15 39 4 58 0 28 3 31 6 22 25 53 15 26 9 50 192 -
7:45 to 8:00 26 37 4 67 2 30 6 38 30 37 37 104 25 33 14 72 281 -
8:00 to 8:15 18 32 0 50 1 44 7 52 11 25 32 68 17 28 17 62 232 -
8:15 to 8:30 19 50 3 72 0 43 9 52 4 47 27 78 20 37 20 77 279 984
8:30 to 8:45 28 54 1 83 4 32 11 47 5 41 36 82 29 24 36 89 301 1093
8:45 to 9:00 40 58 6 104 4 39 7 50 9 32 24 65 22 25 30 77 296 1108
22 30 2 54 0 22 3 25 7 21 16 44 13 10 6 29 152 1028
9:15 to 9:30 8 26 3 37 2 18 8 28 2 17 23 42 16 14 8 38 145 894
9:30 to 9:45 5 26 6 37 1 17 6 24 8 19 20 47 9 15 7 31 139 732
9:45 to 10:00 8 24 2 34 1 20 4 25 7 18 14 39 10 11 5 26 124 560
10:00 to 10:15 7 13 0 20 2 17 3 22 4 14 10 28 12 12 6 30 100 508
10:15 to 10:30 6 18 1 25 1 14 5 20 8 18 14 40 11 18 4 33 118 481
AM Peak 105 194 10 309 9 158 34 201 29 145 119 293 88 114 103 305 1108
hourtotalTo
tal
Tota
l
Tota
l
Tota
l
Grahamvale Road New Dookie Road
9:00 to 9:15
Movement
New
Dookie R
oad
15mintotal
Dookie Shepparton R
oad
Grahamvale Road ookie Shepparton Roa
ID
Road
Hourly Intersection Volume
0
200
400
600
800
1000
1200
8:30 8:45 9:00 9:15 9:30 9:45 10:00 10:15 10:30
Time
Car
s

600 282 55 Shepparton NE Growth Development
Location: Grahamvale/New Dookie Peak Hour Ends: 16:15
Date: 5 August 2008
Time: 15:00-18:00
Surveyor:
Weather Conditions:
Key Map
Grahamvale Road
1 2 3
12 4
11 5
10 6
9 8 7
Grahamvale Road
R T L R T L R T L R T L
1 2 3 1 2 3 1 2 3 1 2 3
15:00 to 15:15 10 27 1 38 2 37 4 43 10 32 17 59 15 23 17 55 195 -
15:15 to 15:30 11 30 2 43 5 29 8 42 13 55 18 86 28 13 24 65 236 -
15:30 to 15:45 32 46 7 85 7 36 9 52 7 45 18 70 29 32 27 88 295 -
15:45 to 16:00 28 37 3 68 3 25 8 36 6 50 25 81 21 21 16 58 243 969
16:00 to 16:15 9 29 3 41 1 33 20 54 12 47 16 75 21 23 14 58 228 1002
16:15 to 16:30 9 20 1 30 2 22 6 30 5 35 14 54 16 16 6 38 152 918
16:30 to 16:45 11 14 0 25 1 25 9 35 17 44 38 99 26 30 16 72 231 854
16:45 to 17:00 13 18 1 32 3 25 8 36 13 36 19 68 22 29 12 63 199 810
17:00 to 17:15 12 29 1 42 3 31 15 49 11 54 22 87 34 44 27 105 283 865
17:15 to 17:30 8 20 0 28 0 23 18 41 9 51 16 76 23 33 10 66 211 924
17:30 to 17:45 7 22 4 33 0 17 8 25 16 61 21 98 19 36 10 65 221 914
17:45 to 18:00 4 26 1 31 0 27 10 37 10 21 27 58 16 26 7 49 175 890
PM Peak 80 142 15 237 16 123 45 184 38 197 77 312 99 89 81 269 1002
15mintotal
hourtotalTo
tal
Tota
l
Grahamvale Road New Dookie Road
Dookie Shepparton R
oad
New
Dookie R
oad
Tota
l
ID
Movement
Grahamvale Road ookie Shepparton RoaRoad
Tota
l
Hourly Intersection Volume
0
200
400
600
800
1000
1200
16:00 16:15 16:30 16:45 17:00 17:15 17:30 17:45 18:00
Time
Car
s

2005 CGS SurveyGOULBURN VALLEY HWY
417 710 (NUMURKAH RD)
382 65835 52
8.4% 7.3%
33 581 446 40 6
15.4% 6.4% 12.0%HAWKINS ST
G.V.HWY SERVICE ROAD 14610 156
6.4%
204
16.7%
83 0 11195 12 0 7 118
12.6% 0.0% 5.9%
913
3.2%
50 362 102 1283 Cars6 31 4 100 Com'l Veh
10.7% 7.9% 3.8% 7.2% Com'l %
514 672 Wednesday Date of Count41 43 14 Sep 2005
7.4% 6.0%1 hour Count Duration
GOULBURN VALLEY HWY 555 715 8.00 - 9.00am Time of Count
For further information,
(NUMURKAH RD)North-South Priority Traffic Control
please contact:Design Services, 1383 Total Vehicles in Count
Locked Bag 1000, Total Com'l %
Shepparton 3632.
SHEPPARTONAM PEAK HOUR
7.2%
N
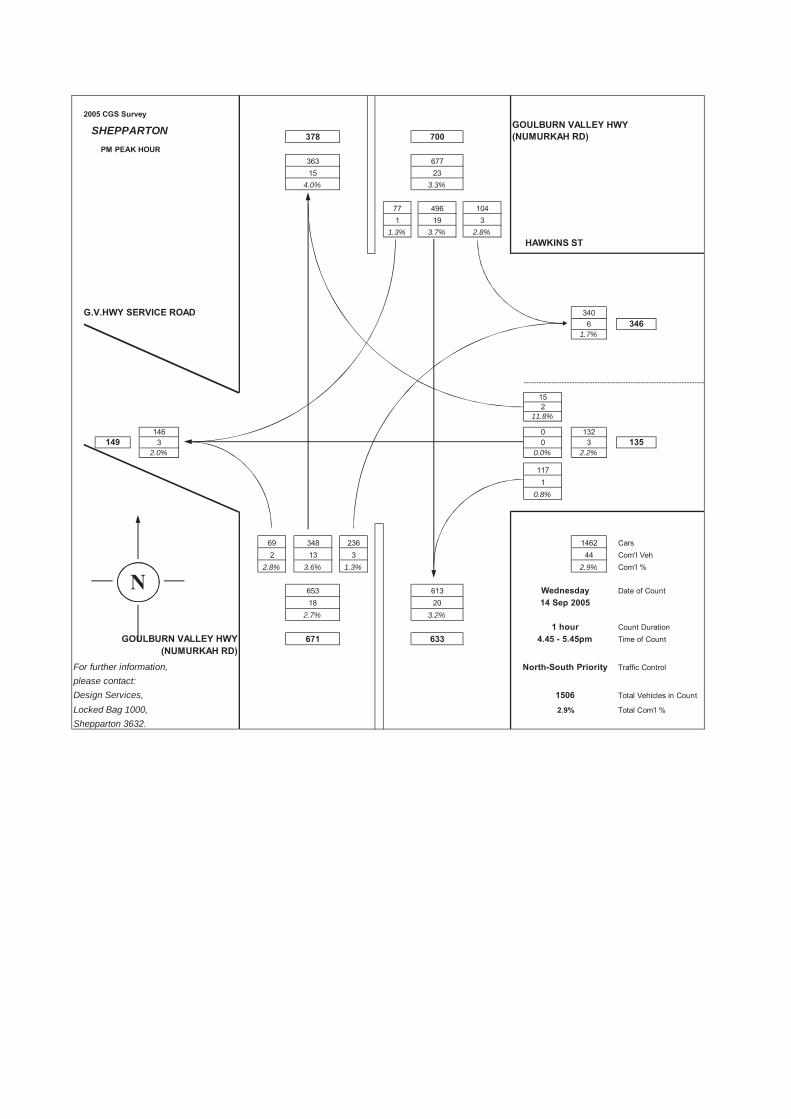
2005 CGS SurveyGOULBURN VALLEY HWY
378 700 (NUMURKAH RD)
363 67715 23
4.0% 3.3%
77 496 1041 19 3
1.3% 3.7% 2.8%HAWKINS ST
G.V.HWY SERVICE ROAD 3406 346
1.7%
152
11.8%
146 0 132149 3 0 3 135
2.0% 0.0% 2.2%
1171
0.8%
69 348 236 1462 Cars2 13 3 44 Com'l Veh
2.8% 3.6% 1.3% 2.9% Com'l %
653 613 Wednesday Date of Count18 20 14 Sep 2005
2.7% 3.2%1 hour Count Duration
GOULBURN VALLEY HWY 671 633 4.45 - 5.45pm Time of Count
For further information,
(NUMURKAH RD)North-South Priority Traffic Control
please contact:Design Services, 1506 Total Vehicles in Count
Locked Bag 1000, Total Com'l %
Shepparton 3632.
SHEPPARTONPM PEAK HOUR
2.9%
N
AECOMShepparton North East Growth Corridor DevelopmentTraffic Impact Assessment
D R A F T
P:\60028255 V07PU Shepparton\6_Draft_docs\6.1_Reports\Traffic and Transportation\Draft Report Nov 09\1007tpe Traffic Assessment 17Dec09.docxRevision - 17 December 2009
Appendix B
SIDRA Analysis

600 282 55 Shepparton NE Growth Development 2008 Verney Ford 2020 Verney Ford with Devt Traffic AMLocation: Verney/Ford Existing Peak Hour 8:15-9:15am 8:15 - 9:15 8:15 - 9:15
Verney Road N
56 127 38 Growth Rate 1.015
per annumMov ID Turn Dem
Flow %HV Deg ofSatn
AverDelay Level of 95% Prop.
QueuedEff. StopRate
AverSpeed Mov ID Turn Dem
Flow %HV Deg ofSatn
AverDelay Level of 95% Prop.
QueuedEff. StopRate
AverSpeed
80 47 No Years 12(veh/h) (v/c) (sec) Service Back of (km/h) (veh/h) (v/c) (sec) Service Back of (km/h)
78 78
62 92 9 L 52 7.7 0.159 6.2 LOS A 8 0.35 0.54 42.9 9 L 74 6.8 0.222 6.4 LOS A 12 0.41 0.56 42.7
8 T 101 6.9 0.159 5.4 LOS A 8 0.35 0.49 43.5 8 T 138 7.2 0.222 5.6 LOS A 12 0.41 0.52 43.2
70 131 36 7 R 32 6.5 0.159 10.0 LOS A 8 0.35 0.63 40.3 7 R 38 7.9 0.222 10.2 LOS B 12 0.41 0.65 40.2
Verney Road S 184 7.1 0.159 6.4 LOS A 8 0.35 0.53 42.7 250 7.2 0.222 6.6 LOS A 12 0.41 0.55 42.5
6 L 81 7.4 0.187 6.2 LOS A 8 0.33 0.55 43.0 6 L 97 7.2 0.240 6.8 LOS A 11 0.43 0.61 42.6
R T L R T L R T L R T L 5 T 68 7.2 0.187 5.4 LOS A 8 0.33 0.50 43.6 5 T 82 7.3 0.240 6.0 LOS A 11 0.43 0.57 43.1
1 2 3 4 5 6 7 8 9 10 11 12 4 R 41 7.3 0.187 10.0 LOS A 8 0.33 0.65 40.4 4 R 49 6.1 0.240 10.6 LOS B 11 0.43 0.68 40.1
47 80 32 159 39 65 77 181 30 96 49 175 34 65 67 166 191 7.3 0.187 6.7 LOS A 8 0.33 0.56 42.6 228 7.0 0.240 7.3 LOS A 11 0.43 0.61 42.2
2020 Growth 56 96 38 190 47 78 92 216 36 115 59 209 41 78 80 198
Devt Traffic - 31 - 31 - - - 0 - 16 11 27 21 - - 21 3 L 34 6.1 0.156 6.8 LOS A 7 0.29 0.56 43.7 3 L 40 7.5 0.229 7.2 LOS A 10 0.36 0.59 43.4
2020 + Devt 56 127 38 221 47 78 92 216 36 131 70 236 62 78 80 219 2 T 84 7.1 0.157 5.2 LOS A 7 0.29 0.48 43.8 2 T 134 6.8 0.229 5.5 LOS A 10 0.36 0.52 43.4
1 R 49 6.1 0.157 9.8 LOS A 7 0.29 0.64 40.5 1 R 59 6.8 0.229 10.1 LOS B 10 0.36 0.66 40.3
Out 166 6.6 0.157 6.9 LOS A 7 0.29 0.54 42.7 232 6.9 0.229 7.0 LOS A 10 0.36 0.57 42.5
In
12 L 71 7.0 0.174 7.1 LOS A 7 0.33 0.58 43.5 12 L 84 7.1 0.239 7.4 LOS A 11 0.40 0.61 43.2
11 T 68 7.2 0.174 5.4 LOS A 7 0.33 0.50 43.6 11 T 82 7.3 0.239 5.8 LOS A 11 0.40 0.55 43.2
10 R 36 8.3 0.174 10.0 LOS B 7 0.33 0.65 40.4 10 R 65 7.6 0.239 10.4 LOS B 11 0.40 0.67 40.2
176 7.4 0.174 7.0 LOS A 7 0.33 0.56 42.8 232 7.3 0.239 7.7 LOS A 11 0.40 0.61 42.3
717 7.1 0.187 6.7 LOS A 8 0.33 0.55 42.7 942 7.1 0.240 7.1 LOS A 12 0.40 0.58 42.4
Approach
Approach
Approach
All Vehicles
Ford Road (East)
Verney Road (North)
Verney Road (South)
Approach
Ford Road (West)
Roundabout
Vehicle Movements
Ford Road E
MovementVerney Road N Ford Road ERoad
Tota
l
Tota
l
Roundabout
Verney Road (North)
ID Tota
l
Tota
l
Ford Road W
Verney Road S Ford Road W
8:15-9:15am
Vehicle Movements
Approach
Ford Road (West)
Approach
All Vehicles
Verney Road (South)
Approach
Ford Road (East)
Approach

600 282 55 Shepparton NE Growth Development 2008 Verney Ford 2020 Verney Ford with Devt Traffic PMLocation: Verney/Ford Existing Peak Hour 3:00-4:00pm 15:00 - 16:00 15:00 - 16:00
Verney Road
74 167 50 Growth Rate 1.015
per annumMov ID Turn Dem
Flow %HV Deg ofSatn
AverDelay Level of 95% Prop.
QueuedEff. StopRate
AverSpeed Mov ID Turn Dem
Flow %HV Deg ofSatn
AverDelay Level of 95% Prop.
QueuedEff. StopRate
AverSpeed
63 41 No Years 12(veh/h) (v/c) (sec) Service Back of (km/h) (veh/h) (v/c) (sec) Service Back of (km/h)
92 88
23 44 9 L 34 6.1 0.154 6.3 LOS A 8 0.37 0.55 42.8 9 L 67 7.4 0.254 6.6 LOS A 14 0.44 0.58 42.5
8 T 112 7.1 0.154 5.5 LOS A 8 0.37 0.50 43.4 8 T 176 6.9 0.254 5.8 LOS A 14 0.44 0.54 43.0
64 167 36 7 R 32 6.5 0.154 10.1 LOS B 8 0.37 0.64 40.3 7 R 38 7.9 0.253 10.4 LOS B 14 0.44 0.66 40.1
Verney Road 176 6.8 0.155 6.4 LOS A 8 0.37 0.53 42.7 281 7.1 0.254 6.6 LOS A 14 0.44 0.56 42.5
6 L 39 7.7 0.155 6.5 LOS A 7 0.37 0.57 42.8 6 L 46 6.5 0.193 6.8 LOS A 9 0.43 0.61 42.6
R T L R T L R T L R T L 5 T 78 6.5 0.156 5.6 LOS A 7 0.37 0.52 43.4 5 T 93 6.5 0.193 6.0 LOS A 9 0.43 0.57 43.1
1 2 3 4 5 6 7 8 9 10 11 12 4 R 36 8.3 0.155 10.2 LOS B 7 0.37 0.66 40.3 4 R 43 7.0 0.193 10.6 LOS B 9 0.43 0.68 40.1
62 133 42 237 34 74 37 145 30 106 32 168 14 77 53 144 152 7.2 0.155 6.9 LOS A 7 0.37 0.57 42.4 181 6.6 0.193 7.3 LOS A 9 0.43 0.60 42.2
2020 Growth 74 159 50 283 41 88 44 173 36 127 38 201 17 92 63 172
Devt Traffic - 8 - 8 - - - - - 40 26 66 6 - - 6 3 L 44 6.8 0.228 6.8 LOS A 10 0.29 0.56 43.7 3 L 53 7.5 0.286 7.1 LOS A 14 0.35 0.58 43.4
2020 + Devt 74 167 50 291 41 88 44 173 36 167 64 267 23 92 63 178 2 T 140 7.1 0.228 5.2 LOS A 10 0.29 0.48 43.8 2 T 176 6.9 0.286 5.4 LOS A 14 0.35 0.51 43.5
1 R 65 7.6 0.228 9.8 LOS A 10 0.29 0.64 40.5 1 R 78 6.5 0.286 10.0 LOS A 14 0.35 0.65 40.3
Out 250 7.2 0.228 6.7 LOS A 10 0.29 0.54 42.8 305 6.9 0.286 6.8 LOS A 14 0.35 0.56 42.6
In
12 L 56 7.1 0.151 7.1 LOS A 6 0.33 0.58 43.5 12 L 66 7.5 0.201 7.6 LOS A 9 0.42 0.62 43.1
11 T 81 7.4 0.151 5.4 LOS A 6 0.33 0.50 43.6 11 T 97 7.2 0.200 5.9 LOS A 9 0.42 0.56 43.1
10 R 15 6.7 0.150 10.0 LOS B 6 0.33 0.65 40.4 10 R 24 8.0 0.200 10.5 LOS B 9 0.42 0.68 40.1
152 7.2 0.151 6.5 LOS A 6 0.33 0.54 43.2 189 7.4 0.201 7.1 LOS A 9 0.42 0.60 42.7
730 7.1 0.228 6.6 LOS A 10 0.34 0.54 42.8 956 7.0 0.286 6.9 LOS A 14 0.41 0.58 42.5All Vehicles
Ford Road (East)
Verney Road (North)
Approach
Ford Road (West)
Approach
Vehicle Movements
Verney Road (South)
Approach
Approach3:00-4:00pm
Verney Road (South)
Approach
Movement
Tota
l
Tota
l
Tota
l
Tota
l
ID
Roundabout
Ford Road
Ford Road
Vehicle Movements
Road Verney Road Ford Road Verney Road Ford Road
Roundabout
Ford Road (West)
Approach
All Vehicles
Ford Road (East)
Approach
Verney Road (North)
Approach

600 282 55 Shepparton NE Growth Development 2009 Verney Hawkins 2020 Verney Hawkins with Devt Traffic AM
Location: Verney/Hawkins Existing Peak Hour: 8:15 - 9:15am 8:15 - 9:15am 8:15 - 9:15am
Verney Road (North)
378 429 Growth Rate 1.015
per annumMov ID Turn Dem
Flow %HV Deg ofSatn
AverDelay Level of 95% Prop.
QueuedEff. StopRate
AverSpeed Mov ID Turn Dem
Flow %HV Deg ofSatn
AverDelay Level of 95% Prop.
QueuedEff. StopRate
AverSpeed
117 No Years 11(veh/h) (v/c) (sec) Service Back of (km/h) (veh/h) (v/c) (sec) Service Back of (km/h)
-
67 1 L 51 7.8 0.029 8.4 LOS A 0 0.00 0.67 49.0 1 L 60 6.7 0.034 8.4 LOS A 0 0.00 0.67 49.0
2 T 191 6.8 0.102 0.0 LOS A 0 0.00 0.00 60.0 2 T 239 7.1 0.128 0.0 LOS A 0 0.00 0.00 60.0
57 227 241 7.1 0.102 1.8 LOS A 0.00 0.14 57.3 299 7.0 0.128 1.7 LOS A 0.00 0.13 57.4
Verney Road (Sth)
8 T 324 7.1 0.174 0.0 LOS A 0 0.00 0.00 60.0 8 T 452 7.1 0.242 0.0 LOS A 0 0.00 0.00 60.0
9 R 43 7.0 0.039 9.7 LOS A 1 0.34 0.66 47.3 9 R 398 7.0 0.383 10.7 LOS B 20 0.49 0.76 46.6
R T T L R T L 368 7.1 0.174 1.1 LOS A 1 0.04 0.08 58.2 850 7.1 0.383 5.0 LOS A 20 0.23 0.36 52.9
1 2 8 9 10 11 12
8:15 - 9:15am 41 308 349 181 48 229 57 0 40 97 10 L 42 7.1 0.221 14.6 LOS B 8 0.53 0.69 43.0 10 L 123 7.3 0.154 9.4 LOS A 5 0.39 0.66 47.7
2020 Growth 48 363 411 213 57 270 67 - 47 114 12 R 60 6.7 0.221 14.6 LOS B 8 0.53 0.84 43.0 12 R 71 7.0 0.628 62.7 LOS F 24 0.95 1.12 22.0
Devt Traffic 330 66 396 14 - 14 - - 70 70 102 6.9 0.222 14.6 LOS B 8 0.53 0.78 43.0 195 7.2 0.627 28.8 LOS D 24 0.59 0.82 33.6
2020 + Devt 378 429 - 807 - 227 57 284 67 - 117 184 711 7.0 0.221 3.3
NotApplicab
le 8 0.10 0.20 55.1 1344 7.1 0.628 7.7
NotApplicab
le 24 0.23 0.37 49.6
Out
In
Approach
All Vehicles
Verney Road North
Approach
Approach
Hawkins Street
Approach
All Vehicles
Verney Road South
Approach
Verney Road North
Approach
Hawkins Street
ID Tota
l
Movement
Verney Road (North)Road
Tota
l
Tota
l
Vehicle Movements
Verney Road (Sth) Hawkins Street
Give-way
Hawkins Street
Give-way
Vehicle Movements
Verney Road South

600 282 55 Shepparton NE Growth Development 2008 Verney Balaclava 2020 Verney Balaclava with Devt Traffic AMLocation: Balaclava/Verney AM Peak 8:00 - 9:00am 8:00 - 9:00 8:00 - 9:00
Verney Road N
106 481 157 Growth Rate 1.015
per annumMov ID Turn Dem
Flow %HV Deg ofSatn
AverDelay Level of 95% Aver
Speed Mov ID Turn DemFlow %HV Deg of
SatnAverDelay Level of 95% Aver
Speed
80 124 No Years 12(veh/h) (v/c) (sec) Service Back of (km/h) (veh/h) (v/c) (sec) Service Back of (km/h)
258 281
79 115 9 L 88 6.8 0.289 5.4 LOS A 18 0.58 0.56 42.9 9 L 105 6.7 0.453 7.0 LOS A 33 0.81 0.74 41.7
8 T 144 6.9 0.289 4.3 LOS A 18 0.58 0.47 43.6 8 T 202 6.9 0.453 5.9 LOS A 33 0.81 0.66 42.2
100 192 92 7 R 81 7.4 0.288 10.8 LOS B 18 0.58 0.68 39.8 7 R 97 7.2 0.453 12.3 LOS B 33 0.81 0.78 39.1
Verney Road S 313 7.0 0.289 6.3 LOS A 18 0.58 0.55 42.3 404 6.9 0.453 7.7 LOS A 33 0.81 0.71 41.3
6 L 101 6.9 0.445 6.2 LOS A 26 0.66 0.65 42.5 6 L 121 6.6 0.858 22.4 LOS C 114 1.00 1.40 32.6
R T L R T L R T L R T L 5 T 189 6.9 0.444 5.1 LOS A 26 0.66 0.56 43.1 5 T 296 7.1 0.855 21.3 LOS C 114 1.00 1.40 33.2
1 2 3 4 5 6 7 8 9 10 11 12 4 R 109 7.3 0.444 11.5 LOS B 26 0.66 0.75 39.6 4 R 131 6.9 0.855 27.7 LOS C 114 1.00 1.32 31.1
8:00 - 9:00am 55 292 131 478 104 180 96 380 77 137 84 298 66 204 60 330 400 7.0 0.444 7.1 LOS A 26 0.66 0.63 41.9 547 6.9 0.857 23.0 LOS C 114 1.00 1.38 32.5
2020 Growth 66 349 157 572 124 215 115 454 92 164 100 356 79 244 72 395
Devt Traffic 40 132 - 172 - 66 - 66 - 28 - 28 - 14 8 22 3 L 138 7.2 0.519 7.0 LOS A 33 0.64 0.69 43.2 3 L 165 7.2 0.865 16.2 LOS B 126 1.00 1.24 37.3
2020 + Devt 106 481 157 744 124 281 115 520 92 192 100 384 79 258 80 417 2 T 307 7.1 0.519 5.1 LOS A 33 0.64 0.58 43.2 2 T 506 6.9 0.863 14.2 LOS B 126 1.00 1.24 37.4
1 R 58 6.9 0.518 11.5 LOS B 33 0.64 0.75 39.6 1 R 112 7.1 0.862 20.7 LOS C 126 1.00 1.17 34.4
Out 504 7.1 0.519 6.4 LOS A 33 0.64 0.63 42.7 784 7.0 0.863 15.5 LOS B 126 1.00 1.23 36.9
In
12 L 63 6.3 0.352 6.2 LOS A 18 0.53 0.60 43.7 12 L 84 7.1 0.488 7.4 LOS A 31 0.68 0.73 43.0
11 T 215 7.0 0.352 4.2 LOS A 18 0.53 0.47 43.9 11 T 272 7.0 0.487 5.4 LOS A 31 0.68 0.61 43.0
10 R 69 7.1 0.352 10.7 LOS B 18 0.53 0.69 40.0 10 R 83 7.2 0.488 11.9 LOS B 31 0.68 0.77 39.5
348 6.9 0.352 5.9 LOS A 18 0.53 0.54 43.0 439 7.1 0.487 7.0 LOS A 31 0.68 0.66 42.2
1565 7.0 0.519 6.4 LOS A 33 0.61 0.59 42.5 2174 7.0 0.865 14.3 LOS B 126 0.90 1.06 37.3
Balaclava Road
Approach
All Vehicles
New Dookie Road
Verney Road (North)
Balaclava Road
Approach
All Vehicles
Vehicle Movements
Prop.Queued
Eff.StopRate
New Dookie Road
Approach
Verney Road (North)
Approach
Roundabout
Vehicle Movements
Prop.Queued
Eff.StopRate
Hawdon Street (South)
Approach
Hawdon Street (South)
Approach
Approach
Verney Road N
Tota
l
New Dookie Road
Roundabout
Approach
Tota
l
Balaclava R
oad
New
Dookie R
oad
ID Tota
l
Balaclava Road
Movement
Verney Road SRoad
Tota
l
9Dec09 Shepparton Sidra 2020 Verney and Grahamvale Intersections 15/12/20095:14 PM

600 282 55 Shepparton NE Growth Development 2008 Verney Balaclava 2020 Verney Balaclava with Devt Traffic PMLocation: Balaclava/Verney AM Peak 4:30 - 5:30pm 16:30 to 17:30 16:30 to 17:30
Verney Road N
40 292 102 Growth Rate 1.015
per annumMov ID Turn Dem
Flow %HV Deg ofSatn
AverDelay Level of 95% Aver
Speed Mov ID Turn DemFlow %HV Deg of
SatnAverDelay Level of 95% Aver
Speed
82 204 No Years 12(veh/h) (v/c) (sec) Service Back of (km/h) (veh/h) (v/c) (sec) Service Back of (km/h)
221 286
96 100 9 L 71 7.0 0.403 6.1 LOS A 27 0.69 0.64 42.4 9 L 84 7.1 0.689 11.1 LOS B 73 0.95 1.03 39.5
8 T 304 6.9 0.404 5.0 LOS A 27 0.69 0.55 43.0 8 T 475 6.9 0.687 10.0 LOS B 73 0.95 1.03 40.4
80 451 42 7 R 37 8.1 0.402 11.4 LOS B 27 0.69 0.73 39.5 7 R 44 6.8 0.688 16.5 LOS B 73 0.95 0.98 36.7
Verney Road S 412 7.0 0.404 5.8 LOS A 27 0.69 0.58 42.5 603 7.0 0.688 10.7 LOS B 73 0.95 1.02 39.9
6 L 88 6.8 0.484 5.5 LOS A 28 0.57 0.57 43.0 6 L 105 6.7 0.691 9.4 LOS A 64 0.83 0.93 40.9
R T L R T L R T L R T L 5 T 228 7.0 0.484 4.4 LOS A 28 0.57 0.48 43.6 5 T 301 7.0 0.692 8.3 LOS A 64 0.83 0.91 41.8
1 2 3 4 5 6 7 8 9 10 11 12 4 R 180 7.2 0.484 10.8 LOS B 28 0.57 0.70 39.9 4 R 215 7.0 0.691 14.7 LOS B 64 0.83 0.92 37.8
4:30 - 5:30pm 20 198 85 303 171 217 84 472 35 289 67 391 80 141 43 264 496 7.1 0.484 6.9 LOS A 28 0.57 0.58 42.0 621 6.9 0.692 10.7 LOS B 64 0.83 0.92 40.1
2020 Growth 24 237 102 362 204 259 100 564 42 346 80 467 96 169 51 316
Devt Traffic 16 55 - 71 - 27 - 27 - 105 - 105 - 52 31 83 3 L 89 6.7 0.310 5.8 LOS A 16 0.48 0.55 44.0 3 L 107 7.4 0.500 7.0 LOS A 33 0.68 0.68 42.9
2020 + Devt 40 292 102 433 204 286 100 591 42 451 80 572 96 221 82 399 2 T 208 7.2 0.310 3.8 LOS A 16 0.48 0.42 44.2 2 T 307 7.1 0.499 5.0 LOS A 33 0.68 0.56 43.0
1 R 21 4.8 0.309 10.3 LOS B 16 0.48 0.66 40.2 1 R 42 7.1 0.500 11.4 LOS B 33 0.68 0.75 39.5
Out 319 6.9 0.310 4.8 LOS A 16 0.48 0.47 43.9 458 7.2 0.499 6.0 LOS A 33 0.68 0.61 42.6
In
12 L 45 6.7 0.326 7.3 LOS A 17 0.64 0.70 43.2 12 L 86 7.0 0.642 13.6 LOS B 55 0.93 1.10 39.0
11 T 148 6.8 0.326 5.3 LOS A 17 0.64 0.59 43.2 11 T 233 6.9 0.643 11.7 LOS B 55 0.93 1.09 39.1
10 R 84 7.1 0.327 11.8 LOS B 17 0.64 0.75 39.6 10 R 101 6.9 0.643 18.1 LOS B 55 0.93 1.03 35.8
277 6.9 0.326 7.6 LOS A 17 0.64 0.66 42.0 419 6.9 0.642 13.6 LOS B 55 0.93 1.08 38.2
1504 7.0 0.484 6.3 LOS A 28 0.60 0.57 42.5 2101 7.0 0.692 10.3 LOS B 73 0.85 0.91 40.2All Vehicles
Vehicle Movements
Prop.Queued
Eff.StopRate
Roundabout
Vehicle Movements
Prop.Queued
Eff.StopRate
Hawdon Street (South)
Approach
Verney Road (North)
Approach
Balaclava Road (West)
Approach
Approach
Approach
Hawdon Street (South)
Approach
New Dookie Road (East)
Approach
Balaclava Road (West)
New Dookie Road (East)
Verney Road (North)
Roundabout
Approach
All Vehicles
Balaclava R
oad
New
Dookie R
oad
Road Verney Road N New Dookie Road Verney Road S Balaclava Road
Movement
Tota
l
Tota
l
Tota
l
Tota
l
ID
9Dec09 Shepparton Sidra 2020 Verney and Grahamvale Intersections 15/12/20095:18 PM

600 282 55 Shepparton NE Growth Development 2008 Graham/Ford AM 2020 Graham/Ford with Devt Traffic AMLocation: Grahamvale/Ford Existing Peak Hour: 8:15 - 9:15am 0815 - 0915 0815 - 0915
Grahamvale Road N
62 88 37 Growth Rate 1.015
per annum Mov ID Turn DemFlow %HV Deg of
SatnAverDelay Level of 95% Aver
Speed Mov ID Turn DemFlow %HV Deg of
SatnAverDelay Level of 95% Aver
Speed
48 48 No Years 12 (veh/h) (v/c) (sec) Service Back of (km/h) (veh/h) (v/c) (sec) Service Back of (km/h)
103 36
14 8 9 L 2 33.3 0.079 7.1 LOS A 5 0.26 0.45 42.4 9 L 2 33.3 0.111 7.2 LOS A 7 0.30 0.43 42.2
8 T 135 6.7 0.080 0.5 LOS A 5 0.26 0.00 47.7 8 T 188 6.9 0.110 0.6 LOS A 7 0.30 0.00 47.3
2 179 7 7 R 6 14.3 0.080 7.3 LOS A 5 0.26 0.59 42.2 7 R 7 12.5 0.110 7.5 LOS A 7 0.30 0.60 42.1
Grahamvale Road S 144 7.6 0.080 1.0 LOS A 5 0.26 0.04 47.3 199 7.5 0.110 1.0 LOS A 7 0.30 0.03 47.0
6 L 7 12.5 0.111 9.5 LOS A 4 0.41 0.56 40.8 6 L 8 11.1 0.209 12.5 LOS B 8 0.54 0.58 38.6
R T L R T L R T L R T L 5 T 19 5.3 0.111 8.2 LOS A 4 0.41 0.61 41.8 5 T 38 7.9 0.210 11.2 LOS B 8 0.54 0.72 39.5
1 2 3 4 5 6 7 8 9 10 11 12 4 R 42 7.1 0.111 9.7 LOS A 4 0.41 0.68 40.6 4 R 51 7.8 0.210 12.7 LOS B 8 0.54 0.79 38.4
8:15 - 9:15am 45 69 31 145 40 18 7 65 6 128 2 136 12 31 7 50 69 7.2 0.111 9.3 LOS A 4 0.41 0.65 41.0 98 8.2 0.210 12.1 LOS B 8 0.54 0.74 38.9
2020 Growth 54 82 37 173 48 22 8 78 7 153 2 163 14 37 8 60
Devt Traffic 8 6 - 14 - 14 - 14 - 26 - 26 - 66 40 106 3 L 33 6.2 0.095 7.2 LOS A 5 0.30 0.43 42.2 3 L 39 7.7 0.129 7.5 LOS A 7 0.37 0.39 42.0
2020 + Devt 62 88 37 187 48 36 8 92 7 179 2 189 14 103 48 166 2 T 73 6.8 0.095 0.6 LOS A 5 0.30 0.00 47.4 2 T 93 6.5 0.128 0.9 LOS A 7 0.37 0.00 46.8
1 R 47 6.4 0.095 7.4 LOS A 5 0.30 0.60 42.1 1 R 65 7.6 0.129 7.7 LOS A 7 0.37 0.62 41.9
Out 152 6.6 0.095 4.1 LOS A 5 0.30 0.28 44.5 197 7.1 0.129 4.5 LOS A 7 0.37 0.28 44.1
In
12 L 7 12.5 0.078 9.0 LOS A 3 0.41 0.59 41.2 12 L 51 7.8 0.273 10.3 LOS B 11 0.51 0.66 40.2
11 T 33 6.2 0.078 7.7 LOS A 3 0.41 0.60 42.3 11 T 108 7.3 0.273 9.0 LOS A 11 0.51 0.72 41.2
10 R 13 7.7 0.078 9.2 LOS A 3 0.41 0.66 41.0 10 R 15 6.7 0.273 10.5 LOS B 11 0.51 0.76 40.1
53 7.5 0.078 8.3 LOS A 3 0.41 0.62 41.8 175 7.4 0.272 9.5 LOS A 11 0.51 0.71 40.8
418 7.2 0.111 4.4
NotApplicab
le 5 0.32 0.30 44.4 669 7.5 0.273 5.9
NotApplicab
le 11 0.41 0.39 43.1
Approach
All Vehicles
Ford Road (East)
Grahamvale Road (North)
Approach
Approach
Ford Road (West)
Give-way
Vehicle Movements
Prop.Queued
Eff. StopRate
Prop.Queued
Eff. StopRate
Tota
lMovementGrahamvale Road N
Ford Road E
Grahamvale Road (South)
Approach
Grahamvale Road (South)
Approach
Give-way
Ford Road ERoad
Tota
l
Tota
l
Tota
l
Grahamvale Road S Ford Road W
Ford Road W
ID
Ford Road (West)
Approach
All Vehicles
Vehicle Movements
Ford Road (East)
Approach
Grahamvale Road (North)
Approach

600 282 55 Shepparton NE Growth Development 2008 Graham/Ford PM 2020 Graham/Ford with devt Traffic PMLocation: Grahamvale/Ford Existing Peak Hour: 3:15 - 4:15pm 15:15 - 16:15 15:15 - 16:15
Grahamvale Road N
43 225 63 Growth Rate 1.015
per annum Mov ID Turn DemFlow %HV Deg of
SatnAverDelay Level of 95% Aver
Speed Mov ID Turn DemFlow %HV Deg of
SatnAverDelay Level of 95% Aver
Speed
27 68 No Years 12 (veh/h) (v/c) (sec) Service Back of (km/h) (veh/h) (v/c) (sec) Service Back of (km/h)
57 85
10 17 9 L 5 20.0 0.071 8.4 LOS A 5 0.42 0.35 41.8 9 L 6 16.7 0.092 8.9 LOS A 7 0.48 0.32 41.6
8 T 94 20.2 0.072 1.5 LOS A 5 0.42 0.00 46.3 8 T 123 20.2 0.093 2.0 LOS A 7 0.48 0.00 45.9
6 117 14 7 R 13 23.1 0.072 8.7 LOS A 5 0.42 0.64 41.7 7 R 15 20.0 0.093 9.2 LOS A 7 0.48 0.68 41.4
Grahamvale Road S 112 20.5 0.072 2.6 LOS A 5 0.42 0.09 45.5 145 20.0 0.093 3.0 LOS A 7 0.48 0.08 45.2
6 L 15 6.7 0.179 10.4 LOS B 7 0.50 0.66 40.2 6 L 18 5.6 0.383 14.9 LOS B 19 0.65 0.86 36.9
R T L R T L R T L R T L 5 T 29 6.9 0.179 9.1 LOS A 7 0.50 0.68 41.2 5 T 89 6.7 0.387 13.6 LOS B 19 0.65 0.91 37.8
1 2 3 4 5 6 7 8 9 10 11 12 4 R 60 6.7 0.179 10.6 LOS B 7 0.50 0.72 40.0 4 R 72 6.9 0.387 15.1 LOS C 19 0.65 0.93 36.8
3:15 - 4:15pm 10 171 53 234 57 28 14 99 12 89 5 106 8 25 9 42 104 6.7 0.179 10.1 LOS B 7 0.50 0.70 40.3 179 6.7 0.387 14.3 LOS B 19 0.65 0.92 37.3
2020 Growth 12 204 63 280 68 33 17 118 14 106 6 127 10 30 11 50
Devt Traffic 31 21 - 52 - 52 - 52 - 11 - 11 - 27 16 43 3 L 56 7.1 0.137 7.1 LOS A 8 0.30 0.43 42.2 3 L 66 7.5 0.202 7.3 LOS A 12 0.35 0.40 42.0
2020 + Devt 43 225 63 332 68 85 17 170 14 117 6 138 10 57 27 93 2 T 180 7.2 0.137 0.5 LOS A 8 0.30 0.00 47.4 2 T 237 7.2 0.202 0.7 LOS A 12 0.35 0.00 46.9
1 R 11 9.1 0.138 7.3 LOS A 8 0.30 0.59 42.1 1 R 45 6.7 0.202 7.6 LOS A 12 0.35 0.61 41.9
Out 247 7.3 0.137 2.3 LOS A 8 0.30 0.12 45.8 349 7.2 0.202 2.9 LOS A 12 0.35 0.15 45.2
In
12 L 9 10.0 0.070 9.5 LOS A 3 0.40 0.57 40.8 12 L 28 7.1 0.177 11.1 LOS B 7 0.47 0.61 39.6
11 T 26 7.7 0.070 8.2 LOS A 3 0.40 0.62 41.9 11 T 60 6.7 0.177 9.8 LOS A 7 0.47 0.72 40.6
10 R 8 11.1 0.070 9.7 LOS A 3 0.40 0.68 40.6 10 R 11 9.1 0.177 11.3 LOS B 7 0.47 0.78 39.4
45 8.9 0.071 8.8 LOS A 3 0.40 0.62 41.4 99 7.1 0.177 10.3 LOS B 7 0.47 0.70 40.2
508 10.2 0.179 4.6
NotApplicab
le 8 0.38 0.28 44.1 772 9.5 0.387 6.5
NotApplicab
le 19 0.46 0.39 42.4
Ford Road (West)
Approach
All Vehicles
Ford Road (East)
Grahamvale Road (North)
Approach
Approach
Give-way
Vehicle Movements
Prop.Queued
Eff. StopRate
Grahamvale Road (South)
Approach
Ford Road W
Ford Road E
ID
Road Grahamvale Road N Ford Road EMovement
Tota
l
Tota
l
Grahamvale Road S Ford Road W
Give-way
Grahamvale Road (South)
Approach
Approach
Ford Road (East)
Tota
l
Tota
l
Prop.Queued
All Vehicles
Vehicle Movements
Grahamvale Road (North)
Approach
Ford Road (West)
Approach
Eff. StopRate

600 282 55 Shepparton NE Growth Development New Dookie / Grahamvale 2008 AM New Dookie / Grahamvale 2020 AM with Devt TrafficLocation: Grahamvale/Dookie Existing Peak Hour 8:00 to 9:00am 0800 - 0900 0800 - 0900
Grahamvale Road N
192 496 78 Growth Rate 1.015
per annumMov ID Turn Dem
Flow %HV Deg ofSatn
AverDelay Level of 95% Aver
Speed Mov ID Turn DemFlow %HV Deg of
SatnAverDelay Level of 95% Aver
Speed
137 25 No Years 12(veh/h) (v/c) (sec) Service Back of (km/h) (veh/h) (v/c) (sec) Service Back of (km/h)
136 189
105 41 9 L 125 7.2 0.264 5.0 LOS A 15 0.50 0.52 43.4 9 L 149 6.7 0.414 6.1 LOS A 27 0.68 0.64 42.4
8 T 153 7.2 0.264 3.9 LOS A 15 0.50 0.43 44.1 8 T 241 7.1 0.414 5.0 LOS A 27 0.68 0.55 43.0
142 229 35 7 R 31 6.7 0.263 10.3 LOS B 15 0.50 0.65 40.1 7 R 37 8.1 0.416 11.5 LOS B 27 0.68 0.73 39.5
Grahamvale Road S 308 7.1 0.264 4.9 LOS A 15 0.50 0.49 43.4 427 7.0 0.414 5.9 LOS A 27 0.68 0.60 42.4
6 L 36 8.3 0.228 5.5 LOS A 11 0.52 0.58 43.3 6 L 43 7.0 0.467 11.0 LOS B 33 0.90 0.99 39.6
R T L R T L R T L R T L 5 T 166 7.2 0.228 4.4 LOS A 11 0.52 0.49 44.0 5 T 199 7.0 0.469 9.9 LOS A 33 0.90 0.98 40.5
1 2 3 4 5 6 7 8 9 10 11 12 4 R 9 10.0 0.227 10.9 LOS B 11 0.52 0.69 40.0 4 R 26 7.7 0.473 16.4 LOS B 33 0.90 0.92 36.8
8:00 to 9:00am 105 194 10 309 9 158 34 201 29 145 119 174 88 114 103 305 213 7.5 0.228 4.9 LOS A 11 0.52 0.51 43.6 268 7.1 0.470 10.7 LOS B 33 0.90 0.98 39.9
2020 Growth 126 232 12 369 11 189 41 240 35 173 142 208 105 136 123 365
Devt Traffic 66 264 66 396 14 - - 14 - 56 - 56 - - 14 14 3 L 11 9.1 0.306 5.6 LOS A 15 0.43 0.54 44.2 3 L 82 7.3 0.752 8.9 LOS A 80 0.79 0.81 42.4
2020 + Devt 192 496 78 765 25 189 41 254 35 229 142 264 105 136 137 379 2 T 204 6.9 0.305 3.6 LOS A 15 0.43 0.40 44.5 2 T 522 7.1 0.755 6.9 LOS A 80 0.79 0.78 42.3
1 R 111 7.2 0.305 10.1 LOS B 15 0.43 0.65 40.4 1 R 202 6.9 0.754 13.4 LOS B 80 0.79 0.82 38.7
Out 326 7.1 0.305 5.9 LOS A 15 0.43 0.49 42.9 807 7.1 0.755 8.7 LOS A 80 0.79 0.79 41.3
In
12 L 108 7.3 0.287 5.3 LOS A 14 0.39 0.51 44.5 12 L 144 6.9 0.398 6.1 LOS A 23 0.55 0.58 43.6
11 T 120 6.7 0.286 3.3 LOS A 14 0.39 0.37 44.8 11 T 143 7.0 0.398 4.1 LOS A 23 0.55 0.46 43.8
10 R 93 6.5 0.287 9.8 LOS A 14 0.39 0.63 40.5 10 R 111 7.2 0.398 10.6 LOS B 23 0.55 0.69 39.9
321 6.9 0.287 5.9 LOS A 14 0.39 0.49 43.3 398 7.0 0.398 6.7 LOS A 23 0.55 0.57 42.5
1168 7.1 0.306 5.5 LOS A 15 0.45 0.49 43.3 1900 7.1 0.755 7.9 LOS A 80 0.73 0.73 41.6All Vehicles
Vehicle Movements
Prop.Queued
Eff. StopRate
Roundabout
Vehicle Movements
Doyles Rd (south)
Approach
GrahamVale Rd (north)
Approach
New Dookie Rd (west)
Approach
Prop.Queued
Eff. StopRate
Approach
Approach
Doyles Rd (south)
Approach
Dookie Shepparton Rd (east)
Approach
New Dookie Rd (west)
Dookie Shepparton Rd (east)
GrahamVale Rd (north)
Roundabout
Approach
All Vehicles
ID
RoadMovement
New
Dookie R
oad
Tota
l
Tota
l
Tota
l
Tota
l
Grahamvale Road S New Dookie Road
Dookie Shepparton R
oad
Grahamvale Road N Dookie Shepparton Road

600 282 55 Shepparton NE Growth Development New Dookie / Grahamvale 2008 PM New Dookie / Grahamvale 2020 PM with Devt TrafficLocation: Grahamvale/Dookie Existing Peak Hour 3:15 to 4:14pm 15:15 to 16:15 15:15 to 16:15
Grahamvale Road N
123 280 45 Growth Rate 1.015
per annumMov ID Turn Dem
Flow %HV Deg ofSatn
AverDelay Level of 95% Aver
Speed Mov ID Turn DemFlow %HV Deg of
SatnAverDelay Level of 95% Aver
Speed
149 71 No Years 12(veh/h) (v/c) (sec) Service Back of (km/h) (veh/h) (v/c) (sec) Service Back of (km/h)
106 147
118 54 9 L 81 7.4 0.269 4.7 LOS A 15 0.45 0.49 43.7 9 L 97 7.2 0.554 6.3 LOS A 42 0.71 0.67 42.3
8 T 207 7.2 0.269 3.6 LOS A 15 0.45 0.39 44.4 8 T 469 7.0 0.553 5.2 LOS A 42 0.71 0.58 42.8
92 446 45 7 R 40 7.5 0.268 10.0 LOS B 15 0.45 0.63 40.3 7 R 47 6.4 0.553 11.6 LOS B 42 0.71 0.73 39.4
Grahamvale Road S 329 7.3 0.269 4.6 LOS A 15 0.45 0.44 43.6 614 7.0 0.553 5.8 LOS A 42 0.71 0.61 42.4
6 L 47 6.4 0.193 5.1 LOS A 9 0.46 0.53 43.6 6 L 57 7.0 0.345 6.7 LOS A 19 0.66 0.70 42.5
R T L R T L R T L R T L 5 T 129 7.0 0.193 4.0 LOS A 9 0.46 0.44 44.4 5 T 155 7.1 0.346 5.6 LOS A 19 0.66 0.62 43.1
1 2 3 4 5 6 7 8 9 10 11 12 4 R 17 5.9 0.193 10.4 LOS B 9 0.46 0.66 40.3 4 R 75 6.7 0.346 12.0 LOS B 19 0.66 0.76 39.5
3:15 to 4:14pm 80 142 15 237 16 123 45 184 38 197 77 312 99 89 81 269 193 6.7 0.193 4.8 LOS A 9 0.46 0.48 43.7 287 7.0 0.346 7.5 LOS A 19 0.66 0.67 41.9
2020 Growth 96 170 18 283 19 147 54 220 45 236 92 373 118 106 97 322
Devt Traffic 27 110 27 164 52 - - 52 - 210 - 210 - - 52 52 3 L 16 6.3 0.235 5.5 LOS A 11 0.41 0.52 44.4 3 L 47 6.4 0.456 6.1 LOS A 28 0.57 0.58 43.5
2020 + Devt 123 280 45 447 71 147 54 272 45 446 92 583 118 106 149 374 2 T 149 6.7 0.234 3.5 LOS A 11 0.41 0.39 44.7 2 T 295 7.1 0.457 4.1 LOS A 28 0.57 0.45 43.7
1 R 84 7.1 0.234 10.0 LOS A 11 0.41 0.64 40.4 1 R 129 7.0 0.457 10.6 LOS B 28 0.57 0.68 39.9
Out 249 6.8 0.234 5.8 LOS A 11 0.41 0.48 43.1 471 7.0 0.458 6.1 LOS A 28 0.57 0.53 42.5
In
12 L 85 7.1 0.272 5.7 LOS A 13 0.45 0.54 44.2 12 L 157 7.0 0.511 9.3 LOS A 36 0.79 0.89 42.2
11 T 94 7.4 0.272 3.7 LOS A 13 0.45 0.41 44.4 11 T 112 7.1 0.511 7.3 LOS A 36 0.79 0.85 42.4
10 R 104 6.7 0.272 10.2 LOS B 13 0.45 0.65 40.3 10 R 124 7.2 0.512 13.8 LOS B 36 0.79 0.87 38.4
283 7.1 0.272 6.7 LOS A 13 0.45 0.54 42.7 394 7.1 0.512 10.1 LOS B 36 0.79 0.87 40.9
1054 7.0 0.272 5.5 LOS A 15 0.44 0.48 43.3 1766 7.0 0.554 7.1 LOS A 42 0.68 0.66 42All Vehicles
Vehicle Movements
Prop.Queued
Eff. StopRate
Roundabout
Vehicle Movements
Doyles Rd (south)
Approach
GrahamVale Rd (north)
Approach
New Dookie Rd (west)
Approach
Prop.Queued
Eff. StopRate
Approach
Doyles Rd (south)
Approach
Dookie Shepparton Rd (east)
Approach
Approach
New Dookie Rd (west)
Dookie Shepparton Rd (east)
GrahamVale Rd (north)
Roundabout
Approach
All Vehicles
New
Dookie R
oad
Dookie Shepparton R
oad
ID
Road Grahamvale Road N Dookie Shepparton Road Grahamvale Road S New Dookie RoadMovement
Tota
l
Tota
l
Tota
l
Tota
l

2008 Scenario Priority Intersection 2008 Scenario AM Peak Signalised 2008 Scenario AM Peak1.0% Growth Factor Hawkins Street / Goulburn Valley Highway / Numurkah Road Hawkins Street / Goulburn Valley Highway / Numurkah Road
GOULBURN VALLEY HWY430 732 (NUMURKAH RD)
Mov ID TurnDemFlow
%HVDeg ofSatn
AverDelay
Level of 95%Aver
SpeedMov ID Turn
DemFlow
%HVDeg ofSatn
AverDelay
Level of 95%Aver
Speed
394 678 (veh/h) (v/c) (sec) Service Back of (km/h) (veh/h) (v/c) (sec) Service Back of (km/h)
36 54# 8.4% 7.3% 1 L 61 9.8 0.035 8.6 LOS A 0 0.00 0.67 49.0 1 L 61 9.8 0.092 14.9 LOS B 7 0.65 0.73 42.9
2 T 426 8.0 0.115 0.0 LOS A 0 0.00 0.00 60.0 2 T 426 8.0 0.300 7.0 LOS A 24 0.72 0.59 50.4
34 599 45 3 R 115 3.5 0.180 12.6 LOS B 6 0.61 0.86 44.7 3 R 115 3.5 0.324 18.5 LOS B 16 0.84 0.77 39.9
6 41 6 603 7.3 0.180 3.3 LOS A 6 0.12 0.23 55.1 603 7.3 0.324 10.0 LOS A 24 0.74 0.64 47.2
15.4% 6.4% 12.0%HAWKINS ST 4 L 102 2.9 0.198 13.9 LOS B 7 0.62 0.87 43.5 4 L 102 2.9 0.441 20.3 LOS C 15 0.89 0.76 38.5
5 T 1 0.0 0.500 91.5 LOS F 15 0.96 1.04 17.2 5 T 1 0.0 0.083 11.3 LOS B 4 0.84 0.60 45.7
6 R 26 15.4 0.456 92.4 LOS F 15 0.96 1.04 17.1 6 R 26 15.4 0.084 19.8 LOS B 4 0.84 0.71 39.2
129 5.4 0.460 30.3 LOS D 15 0.69 0.91 32.8 129 5.4 0.441 20.1 LOS C 15 0.88 0.75 38.7
7 L 54 11.3 0.196 8.6 LOS A 0 0.00 0.67 49.0 7 L 54 11.3 0.510 16.4 LOS B 42 0.80 0.81 41.7
G.V.HWY SERVICE ROAD 150 8 T 674 6.4 0.195 0.0 LOS A 0 0.00 0.00 60.0 8 T 674 6.4 0.510 7.7 LOS A 42 0.80 0.68 49.5
10 161 9 R 42 14.3 0.055 11.3 LOS B 2 0.50 0.72 46.3 9 R 42 14.3 0.104 16.5 LOS B 6 0.72 0.72 41.7
6.4% 769 7.2 0.195 1.2 LOS A 2 0.03 0.09 58.2 769 7.2 0.510 8.8 LOS A 42 0.80 0.69 48.4
1501 7.1 0.500 4.5 NA 15 0.12 0.21 53.4 1501 7.1 0.510 10.2 LOS B 42 0.78 0.67 46.9
214
16.7%
86 0 11498 12 0 7 122
12.6% 0.0% 5.9%
943
3.2%
52 373 105 1322 Cars6 32 4 103 Com'l Veh
10.7% 7.9% 3.8% 7.2% Com'l %
530 692 1.0%42 44 2008
7.4% 6.0%1 hour Count Duration
GOULBURN VALLEY HWY 572 737 8.00 - 9.00am Time of Count(NUMURKAH RD)
North-South Priority Traffic Control
1425 Total Vehicles
Total Com'l %
Goulburn Valley HWY Southbound
Approach
All Vehicles
Vehicle Movements
Prop.Queued
Eff. StopRate
Approach
Give-way
Vehicle Movements
Goulburn Valley HWY Northbound
Approach
Hawkins St
Approach
Goulburn Valley HWY Southbound
All Vehicles
Signalised - Fixed time Cycle Time = 30 seconds
Prop.Queued
Eff. StopRate
SHEPPARTON
AM PEAK HOUR
7.2%
Compound Growth Factor (per annum)Flow Senario
Goulburn Valley HWY Northbound
Approach
Hawkins St
Approach
N
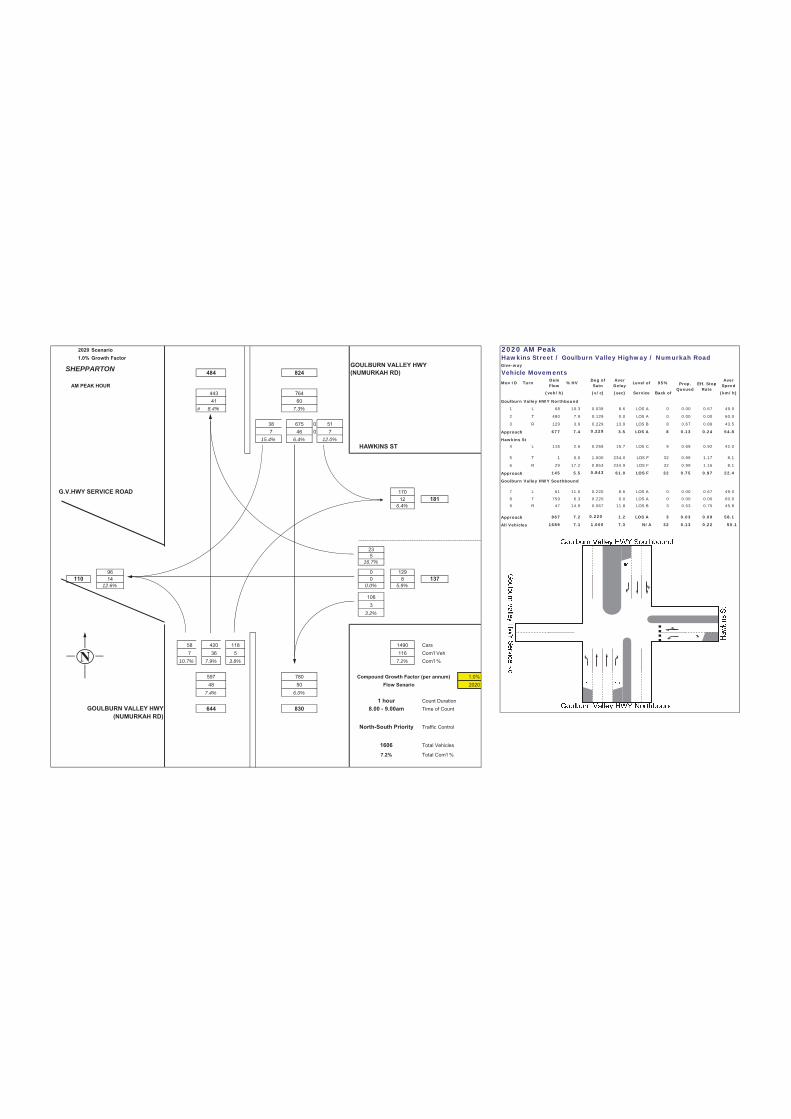
2020 Scenario 2020 AM Peak1.0% Growth Factor Hawkins Street / Goulburn Valley Highway / Numurkah Road
GOULBURN VALLEY HWY484 824 (NUMURKAH RD)
Mov ID Turn DemFlow
%HV Deg ofSatn
AverDelay
Level of 95% AverSpeed
443 764 (veh/h) (v/c) (sec) Service Back of (km/h)
41 60# 8.4% 7.3% 1 L 68 10.3 0.039 8.6 LOS A 0 0.00 0.67 49.0
2 T 480 7.9 0.129 0.0 LOS A 0 0.00 0.00 60.0
38 675 0 51 3 R 129 3.9 0.229 13.9 LOS B 8 0.67 0.89 43.5
7 46 0 7 677 7.4 0.229 3.5 LOS A 8 0.13 0.24 54.8
15.4% 6.4% 12.0%HAWKINS ST 4 L 115 2.6 0.255 15.7 LOS C 9 0.69 0.92 42.0
5 T 1 0.0 1.000 234.0 LOS F 32 0.99 1.17 8.1
6 R 29 17.2 0.853 234.9 LOS F 32 0.99 1.16 8.1
145 5.5 0.843 61.0 LOS F 32 0.75 0.97 22.4
G.V.HWY SERVICE ROAD 170 7 L 61 11.5 0.220 8.6 LOS A 0 0.00 0.67 49.0
12 181 8 T 759 6.3 0.220 0.0 LOS A 0 0.00 0.00 60.0
6.4% 9 R 47 14.9 0.067 11.8 LOS B 3 0.53 0.75 45.8
867 7.2 0.220 1.2 LOS A 3 0.03 0.09 58.1
1689 7.1 1.000 7.3 N/A 32 0.13 0.22 50.1
235
16.7%
96 0 129110 14 0 8 137
12.6% 0.0% 5.9%
1063
3.2%
58 420 118 1490 Cars7 36 5 116 Com'l Veh
10.7% 7.9% 3.8% 7.2% Com'l %
597 780 1.0%48 50 2020
7.4% 6.0%1 hour Count Duration
GOULBURN VALLEY HWY 644 830 8.00 - 9.00am Time of Count(NUMURKAH RD)
North-South Priority Traffic Control
1606 Total Vehicles
Total Com'l %
All Vehicles
Vehicle Movements
Prop.Queued
Eff. StopRate
Hawkins St
Approach
Goulburn Valley HWY Southbound
Approach
SHEPPARTON
AM PEAK HOUR
Compound Growth Factor (per annum)Flow Senario
7.2%
Give-way
Goulburn Valley HWY Northbound
Approach
N

2020 Scenario 2020 with Devt Traffic AM Peak Signalised 2020 with Devt Traffic AM Peakwith Development Traffic Hawkins Street / Goulburn Valley Highway / Numurkah Road Hawkins Street / Goulburn Valley Highway / Numurkah Road
1.0% Growth Factor GOULBURN VALLEY HWY484 824 (NUMURKAH RD)
Mov ID Turn Dem Flow %HVDeg ofSatn
AverDelay
Level of 95%Aver
SpeedMov ID Turn Dem Flow %HV
Deg ofSatn
AverDelay
Level of 95%Aver
Speed
443 764 (veh/h) (v/c) (sec) Service Back of (km/h) (veh/h) (v/c) (sec) Service Back of (km/h)
41 60# 8.4% 7.3% 1 L 68 10.3 0.039 8.6 LOS A 0 0.00 0.67 49.0 1 L 68 10.3 0.126 19.2 LOS B 11 0.73 0.74 39.5
2 T 480 7.9 0.129 0.0 LOS A 0 0.00 0.00 60.0 2 T 480 7.9 0.415 11.9 LOS B 39 0.82 0.68 45.2
38 675 51 3 R 203 2.5 0.360 15.1 LOS C 15 0.71 0.96 42.5 3 R 203 2.5 0.904 36.8 LOS D 49 1.00 1.13 29.9
7 46 7 751 6.7 0.360 4.9 LOS A 15 0.19 0.32 53.0 751 6.7 0.904 19.3 LOS B 49 0.86 0.81 39.3
15.4% 6.4% 12.0%HAWKINS ST 4 L 462 0.7 0.999# 19.5 LOS C 46 1.00 1.02 39.0 4 L 462 1.3 0.999# 20.7 LOS C 34 0.94 0.81 38.2
5 T 1 0.0 1.418 50.3 LOS F 100 0.09 0.14 3.6 5 T 1 0.0 0.388 0.0 LOS A 37 0.00 0.00 46.8
6 R 29 17.2 1.318 571.8 LOS F 100 1.00 1.57 3.6 6 R 29 17.2 0.389 18.8 LOS B 37 0.77 0.79 40.0
492 1.6 1.345 52.8 LOS F 100 0.98 1.04 24.1 492 1.6 1.000 11.1 LOS B 37 0.50 0.44 38.4
G.V.HWY SERVICE ROAD 240 7 L 61 11.5 0.220 8.6 LOS A 0 0.00 0.67 49.0 7 L 61 11.5 0.708 23.5 LOS C 71 0.93 0.91 36.7
12 251 8 T 759 6.3 0.220 0.0 LOS A 0 0.00 0.00 60.0 8 T 759 6.3 0.707 14.8 LOS B 71 0.93 0.86 42.6
4.6% 9 R 47 14.9 0.067 11.8 LOS B 3 0.53 0.75 45.8 9 R 47 14.9 0.169 23.1 LOS C 10 0.84 0.74 37.1
867 7.2 0.220 1.2 LOS A 3 0.03 0.09 58.1 867 7.2 0.707 15.9 LOS B 71 0.93 0.86 41.8
2110 5.7 1.418 14.6 N/A 100 0.31 0.39 42.8 2110 5.7 0.999 16.0 LOS B 71 0.81 0.74 40.3
235
16.7%
96 0 459110 14 0 8 467
12.6% 0.0% 1.7%
4363
0.8%
58 420 188 1890 Cars7 36 5 116 Com'l Veh
10.7% 7.9% 2.4% 5.8% Com'l %
667 1110 1.0%48 50 2020
6.7% 4.3%1 hour Count Duration
GOULBURN VALLEY HWY 714 1160 8.00 - 9.00am Time of Count(NUMURKAH RD)
North-South Priority Traffic Control
2006 Total Vehicles
Total Com'l %
Approach
All Vehicles
Vehicle MovementsProp.
QueuedEff. Stop
Rate
Approach
Hawkins St
Approach
Goulburn Valley HWY Southbound
Goulburn Valley HWY Northbound
All Vehicles
Vehicle MovementsProp.
QueuedEff. Stop
Rate
Signalised - Fixed time Cycle Time = 40 seconds
Hawkins St
Approach
Goulburn Valley HWY Southbound
Approach
Compound Growth Factor (per annum)Flow Senario
5.8%
AM PEAK HOUR
SHEPPARTON
Give-way
Goulburn Valley HWY Northbound
Approach
N
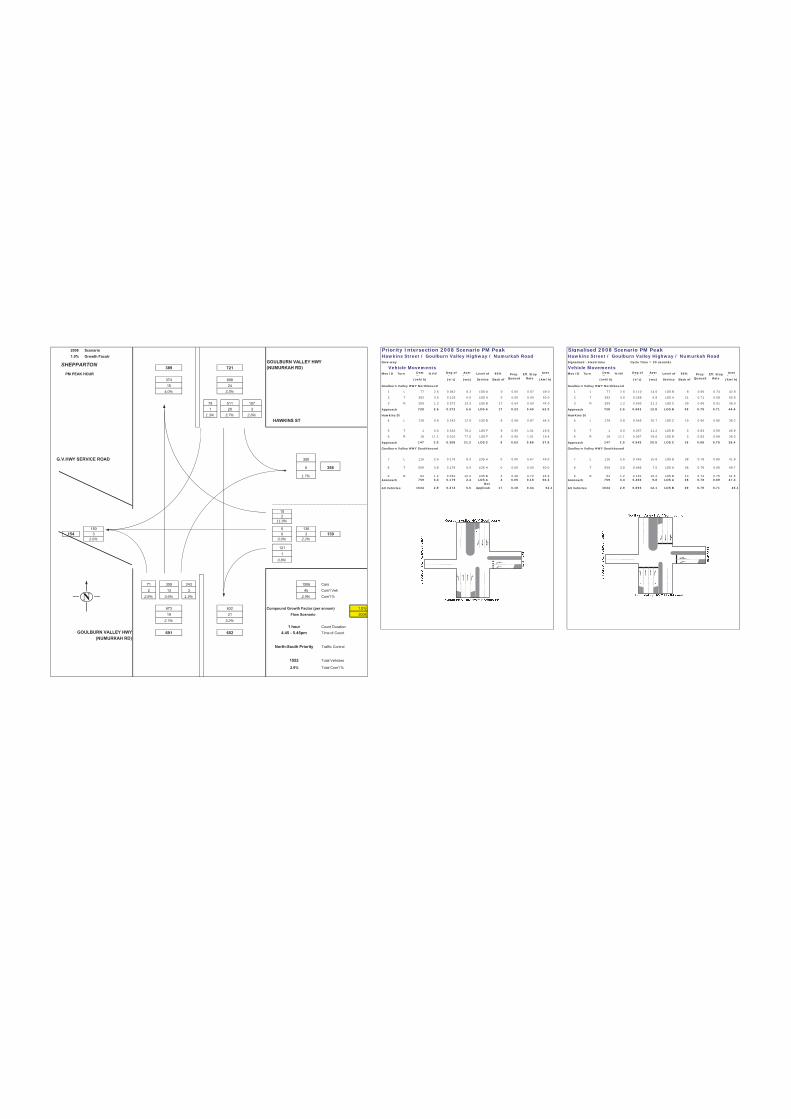
2008 Scenario Priority Intersection 2008 Scenario PM Peak Signalised 2008 Scenario PM Peak1.0% Growth Facotr Hawkins Street / Goulburn Valley Highway / Numurkah Road Hawkins Street / Goulburn Valley Highway / Numurkah Road
GOULBURN VALLEY HWY389 721 (NUMURKAH RD)
Mov ID Turn DemFlow
%HV Deg ofSatn
AverDelay
Level of 95% AverSpeed
Mov ID Turn DemFlow
%HV Deg ofSatn
AverDelay
Level of 95% AverSpeed
374 698 (veh/h) (v/c) (sec) Service Back of (km/h) (veh/h) (v/c) (sec) Service Back of (km/h)
15 244.0% 3.3% 1 L 77 2.6 0.042 8.3 LOS A 0 0.00 0.67 49.0 1 L 77 2.6 0.110 14.6 LOS B 8 0.66 0.74 42.8
2 T 392 3.6 0.103 0.0 LOS A 0 0.00 0.00 60.0 2 T 392 3.6 0.268 6.8 LOS A 21 0.71 0.58 50.5
79 511 107 3 R 259 1.2 0.372 13.3 LOS B 17 0.64 0.93 44.0 3 R 259 1.2 0.693 21.2 LOS C 39 0.95 0.91 38.0
1 20 3 728 2.6 0.372 5.6 LOS A 17 0.23 0.40 52.0 728 2.6 0.693 12.8 LOS B 39 0.79 0.71 44.4
1.3% 3.7% 2.8%HAWKINS ST 4 L 128 0.8 0.243 12.9 LOS B 8 0.58 0.87 44.3 4 L 128 0.8 0.545 20.7 LOS C 19 0.90 0.80 38.2
5 T 1 0.0 0.333 76.2 LOS F 9 0.95 1.01 19.5 5 T 1 0.0 0.057 11.2 LOS B 3 0.83 0.59 45.9
6 R 18 11.1 0.310 77.0 LOS F 9 0.95 1.01 19.4 6 R 18 11.1 0.057 19.6 LOS B 3 0.83 0.69 39.3
147 2.0 0.308 21.2 LOS C 9 0.63 0.89 37.9 147 2.0 0.545 20.5 LOS C 19 0.89 0.79 38.4
G.V.HWY SERVICE ROAD 350 7 L 116 2.6 0.179 8.3 LOS A 0 0.00 0.67 49.0 7 L 116 2.6 0.465 15.8 LOS B 38 0.78 0.80 41.8
6 356 8 T 559 3.8 0.179 0.0 LOS A 0 0.00 0.00 60.0 8 T 559 3.8 0.466 7.5 LOS A 38 0.78 0.66 49.7
1.7% 9 R 84 1.2 0.092 10.2 LOS B 3 0.48 0.72 46.9 9 R 84 1.2 0.181 16.2 LOS B 10 0.74 0.75 41.5759 3.3 0.179 2.4 LOS A 3 0.05 0.18 56.3 759 3.3 0.466 9.8 LOS A 38 0.78 0.69 47.3
1634 2.9 0.372 5.5Not
Applicab 17 0.18 0.34 52.1 1634 2.9 0.693 12.1 LOS B 39 0.79 0.71 45.1
152
11.8%
150 0 136154 3 0 3 139
2.0% 0.0% 2.2%
1211
0.8%
71 359 243 1506 Cars2 13 3 45 Com'l Veh
2.8% 3.6% 1.3% 2.9% Com'l %
673 632 Compound Growth Factor (per annum) 1.0%19 21 2008
2.7% 3.2%1 hour Count Duration
GOULBURN VALLEY HWY 691 652 4.45 - 5.45pm Time of Count(NUMURKAH RD)
North-South Priority Traffic Control
1552 Total Vehicles
Total Com'l %
Approach
All Vehicles
Hawkins St
Approach
Approach
Goulburn Valley HWY Southbound
Signalised - Fixed time Cycle Time = 30 seconds
Vehicle MovementsProp.
QueuedEff. Stop
Rate
Goulburn Valley HWY Northbound
Approach
All Vehicles
Vehicle MovementsProp.
QueuedEff. Stop
Rate
Approach
Hawkins St
Approach
Goulburn Valley HWY Southbound
Goulburn Valley HWY Northbound
SHEPPARTONPM PEAK HOUR
2.9%
Flow Scenario
Give-way
N

2020 Scenario 2020 PM Peak1.0% Growth Facotr Hawkins Street / Goulburn Valley Highway / Numurkah Road
GOULBURN VALLEY HWY439 813 (NUMURKAH RD)
Mov ID Turn DemFlow %HV Deg of
SatnAverDelay Level of 95% Aver
Speed
421 786 (veh/h) (v/c) (sec) Service Back of (km/h)
17 274.0% 3.3% 1 L 86 2.3 0.047 8.3 LOS A 0 0.00 0.67 49.0
2 T 441 3.6 0.116 0.0 LOS A 0 0.00 0.00 60.0
89 0 576 0 121 3 R 292 1.0 0.466 15.2 LOS C 23 0.71 1.00 42.4
1 0 22 0 3 818 2.6 0.466 6.3 LOS A 23 0.25 0.43 51.2
1.3% 3.7% 2.8%HAWKINS ST 4 L 144 0.7 0.272 14.2 LOS B 10 0.64 0.90 43.1
5 T 1 0.0 0.500 129.3 LOS F 15 0.98 1.04 13.3
6 R 20 10.0 0.500 130.0 LOS F 15 0.98 1.04 13.2
165 1.8 0.501 28.9 LOS D 15 0.68 0.92 33.4
G.V.HWY SERVICE ROAD 395 7 L 131 2.3 0.201 8.3 LOS A 0 0.00 0.67 49.0
7 402 8 T 629 3.7 0.201 0.0 LOS A 0 0.00 0.00 60.0
1.7% 9 R 95 1.1 0.111 10.6 LOS B 4 0.51 0.75 46.5
854 3.2 0.201 2.4 LOS A 4 0.06 0.18 56.3
1837 2.8 0.500 6.5Not
Applicab 23 0.20 0.36 50.9
172
11.8%
170 0 153173 3 0 3 157
2.0% 0.0% 2.2%
1361
0.8%
80 404 0 274 1697 Cars2 15 0 3 51 Com'l Veh
2.8% 3.6% 1.3% 2.9% Com'l %
758 712 Compound Growth Factor (per annum) 1.0%21 23 2020
2.7% 3.2%1 hour Count Duration
GOULBURN VALLEY HWY 779 735 4.45 - 5.45pm Time of Count(NUMURKAH RD)
North-South Priority Traffic Control
1748 Total Vehicles
Total Com'l %
All Vehicles
Prop.Queued
Eff. StopRate
Goulburn Valley HWY Northbound
Approach
Hawkins St
SHEPPARTON
PM PEAK HOUR
Flow Scenario
2.9%
Give-way
Vehicle Movements
Approach
Goulburn Valley HWY Southbound
Approach
N

2020 Scenario 2020 with Devt Traffic PM Peak Signalised 2020 with Devt Traffic PM Peakwith Development Traffic Hawkins Street / Goulburn Valley Highway / Numurkah Road Hawkins Street / Goulburn Valley Highway / Numurkah Road
1.0% Growth Facotr GOULBURN VALLEY HWY439 813 (NUMURKAH RD)
Mov ID Turn DemFlow
%HV Deg ofSatn
AverDelay
Level of 95% AverSpeed
Mov ID Turn DemFlow
%HV Deg ofSatn
AverDelay
Level of 95% AverSpeed
421 786 (veh/h) (v/c) (sec) Service Back of (km/h) (veh/h) (v/c) (sec) Service Back of (km/h)
17 274.0% 3.3% 1 L 86 2.3 0.047 8.3 LOS A 0 0.00 0.67 49.0 1 L 86 2.3 0.187 20.6 LOS C 24 0.46 0.73 38.3
2 T 441 3.6 0.116 0.0 LOS A 0 0.00 0.00 60.0 2 T 441 2.6 0.293 14.3 LOS B 82 0.54 0.47 43.1
89 576 121 3 R 515 0.6 0.824 23.4 LOS C 78 0.88 1.47 36.5 3 R 515 0.9 1.000# 45.6 LOS D 157 1.00 0.90 26.7
1 22 3 1042 2.0 0.825 12.3 LOS B 78 0.44 0.78 44.9 1042 2.0 1.000 24.9 LOS C 157 0.68 0.63 35.7
1.3% 3.7% 2.8%HAWKINS ST 4 L 288 0.3 0.544 17.2 LOS C 28 0.74 1.05 40.7 4 L 288 1.3 1.000# 52.2 LOS D 34 0.99 0.76 24.6
5 T 1 0.0 1.000 366.3 LOS F 31 1.00 1.15 5.5 5 T 1 0.0 0.404 0.2 LOS A 91 0.00 0.00 29.9
6 R 20 10.0 0.909 367.1 LOS F 31 1.00 1.15 5.4 6 R 20 10.0 0.405 45.0 LOS D 91 0.83 0.81 27.0
309 1.0 0.912 40.9 LOS E 31 0.75 1.06 28.2 309 1.0 1.000 16.3 LOS B 91 0.31 0.25 25.1
G.V.HWY SERVICE ROAD 607 7 L 131 2.3 0.201 8.3 LOS A 0 0.00 0.67 49.0 7 L 131 2.3 0.358 23.2 LOS C 99 0.56 0.79 36.6
7 614 8 T 629 3.7 0.201 0.0 LOS A 0 0.00 0.00 60.0 8 T 629 3.7 0.358 15.0 LOS B 100 0.56 0.50 42.5
1.1% 9 R 95 1.1 0.111 10.6 LOS B 4 0.51 0.75 46.5 9 R 95 1.1 0.268 27.6 LOS C 33 0.59 0.75 34.2
854 3.2 0.201 2.4 LOS A 4 0.06 0.18 56.3 854 3.2 0.358 17.6 LOS B 100 0.57 0.57 40.4
2205 2.3 1.000 12.5 N/A 78 0.33 0.59 44.7 2205 2.3 1.000 20.9 LOS C 157 0.58 0.55 36.7
172
11.8%
170 0 290173 3 0 3 294
2.0% 0.0% 1.2%
2731
0.4%
80 404 486 2046 Cars2 15 3 51 Com'l Veh
2.8% 3.6% 0.7% 2.4% Com'l %
970 849 Compound Growth Factor (per annum) 1.0%21 23 2020
2.1% 2.7%1 hour Count Duration
GOULBURN VALLEY HWY 991 872 4.45 - 5.45pm Time of Count(NUMURKAH RD)
North-South Priority Traffic Control
2097 Total Vehicles
Total Com'l %
All VehiclesAll Vehicles
Goulburn Valley HWY Northbound
Approach
Hawkins St
Approach
Goulburn Valley HWY Southbound
Approach
Eff.StopRate
Goulburn Valley HWY Northbound
Approach
Hawkins St
Approach
Cycle Time = 130 seconds
Vehicle Movements Vehicle Movements
Prop.Queued
Eff.StopRate
Prop.Queued
Flow Scenario
2.4%
PM PEAK HOUR
SHEPPARTON
Give-way Signalised - Fixed time
Goulburn Valley HWY Southbound
Approach
N
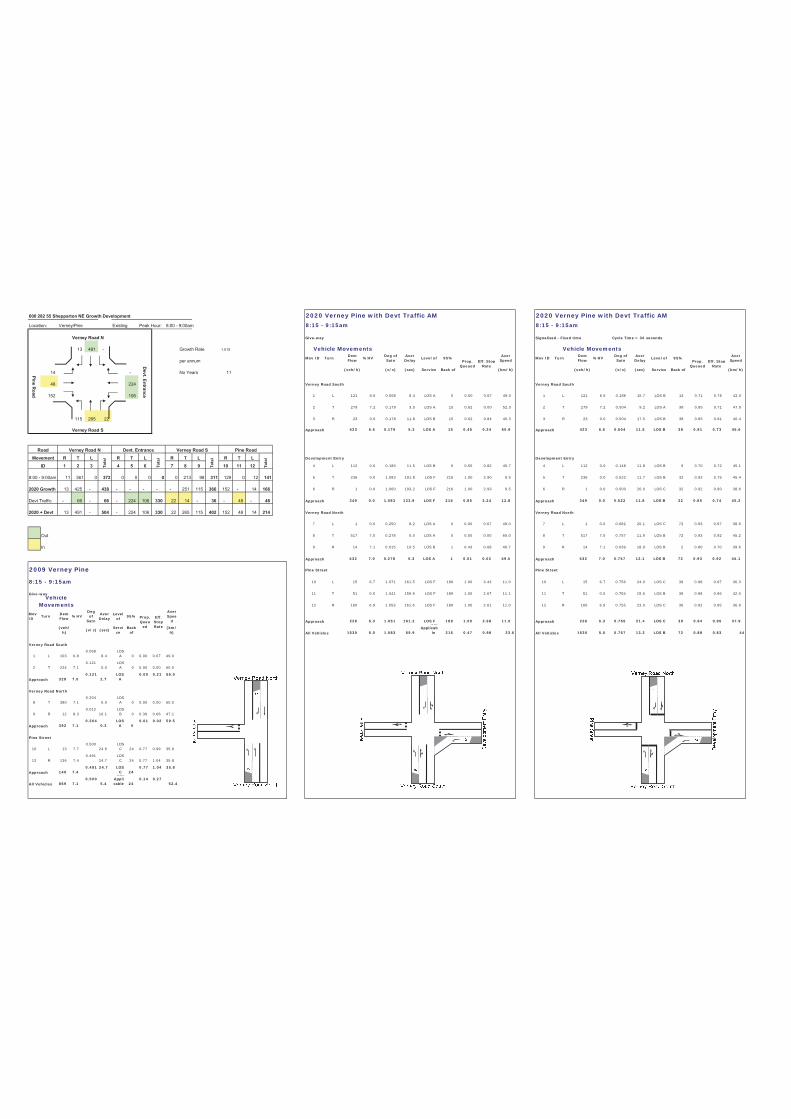
600 282 55 Shepparton NE Growth Development 2020 Verney Pine with Devt Traffic AM 2020 Verney Pine with Devt Traffic AMLocation: Verney/Pine Existing Peak Hour: 8:00 - 9:00am 8:15 - 9:15am 8:15 - 9:15am
Verney Road N
13 491 - Growth Rate 1.015
per annum Mov ID Turn DemFlow %HV Deg of
SatnAverDelay Level of 95% Aver
Speed Mov ID Turn DemFlow %HV Deg of
SatnAverDelay Level of 95% Aver
Speed
14 - No Years 11 (veh/h) (v/c) (sec) Service Back of (km/h) (veh/h) (v/c) (sec) Service Back of (km/h)
48 224
152 106 1 L 121 6.6 0.068 8.4 LOS A 0 0.00 0.67 49.0 1 L 121 6.6 0.186 15.7 LOS B 14 0.71 0.76 42.0
2 T 279 7.2 0.179 3.5 LOS A 15 0.62 0.00 52.3 2 T 279 7.2 0.504 9.2 LOS A 38 0.85 0.71 47.9
115 265 22 3 R 23 0.0 0.178 11.8 LOS B 15 0.62 0.84 45.3 3 R 23 0.0 0.504 17.5 LOS B 38 0.85 0.81 40.4
Verney Road S 423 6.6 0.179 5.3 LOS A 15 0.45 0.24 50.9 423 6.6 0.504 11.5 LOS B 38 0.81 0.73 45.6
R T L R T L R T L R T L1 2 3 4 5 6 7 8 9 10 11 12 4 L 112 0.0 0.180 11.5 LOS B 6 0.55 0.82 45.7 4 L 112 0.0 0.148 11.8 LOS B 9 0.70 0.72 45.1
8:00 - 9:00am 11 361 0 372 0 0 0 0 0 213 98 311 129 0 12 141 5 T 236 0.0 1.083 191.8 LOS F 216 1.00 2.90 9.5 5 T 236 0.0 0.522 11.7 LOS B 32 0.92 0.75 45.4
2020 Growth 13 425 - 438 - - - - - 251 115 366 152 - 14 166 6 R 1 0.0 1.000 193.2 LOS F 216 1.00 2.93 9.5 6 R 1 0.0 0.500 20.0 LOS C 32 0.92 0.80 38.6
Devt Traffic - 66 - 66 - 224 106 330 22 14 - 36 - 48 - 48 349 0.0 1.083 133.9 LOS F 216 0.85 2.24 12.8 349 0.0 0.522 11.8 LOS B 32 0.85 0.74 45.3
2020 + Devt 13 491 - 504 - 224 106 330 22 265 115 402 152 48 14 214
7 L 1 0.0 0.250 8.2 LOS A 0 0.00 0.67 49.0 7 L 1 0.0 0.682 20.1 LOS C 72 0.93 0.97 38.6
Out 8 T 517 7.0 0.278 0.0 LOS A 0 0.00 0.00 60.0 8 T 517 7.0 0.757 11.9 LOS B 72 0.93 0.92 45.2
In 9 R 14 7.1 0.015 10.5 LOS B 1 0.43 0.68 46.7 9 R 14 7.1 0.039 18.9 LOS B 2 0.80 0.70 39.6
532 7.0 0.278 0.3 LOS A 1 0.01 0.02 59.5 532 7.0 0.757 12.1 LOS B 72 0.93 0.92 45.1
2009 Verney Pine
8:15 - 9:15am 10 L 15 6.7 1.071 161.5 LOS F 189 1.00 3.43 11.0 10 L 15 6.7 0.756 24.0 LOS C 39 0.98 0.97 36.3
11 T 51 0.0 1.041 159.9 LOS F 189 1.00 2.67 11.1 11 T 51 0.0 0.754 15.6 LOS B 39 0.98 0.96 42.0
12 R 160 6.9 1.053 161.6 LOS F 189 1.00 2.61 11.0 12 R 160 6.9 0.755 23.0 LOS C 36 0.92 0.95 36.9
MovID Turn Dem
Flow %HVDegof
Satn
AverDelay
Levelof 95%
AverSpee
d 226 5.3 1.051 161.2 LOS F 189 1.00 2.68 11.0 226 5.3 0.755 21.4 LOS C 39 0.94 0.95 37.9
(veh/h) (v/c) (sec) Servi
ceBack
of(km/
h) 1530 5.0 1.083 55.9
NotApplicab
le 216 0.47 0.98 23.6 1530 5.0 0.757 13.2 LOS B 72 0.88 0.83 44
1 L 103 6.80.058
8.4LOSA 0 0.00 0.67 49.0
2 T 224 7.10.121
0.0LOSA 0 0.00 0.00 60.0
328 7.00.121
2.7LOS
A0.00 0.21 56.0
8 T 380 7.10.204
0.0LOSA 0 0.00 0.00 60.0
9 R 12 8.30.012
10.1LOSB 0 0.39 0.66 47.1
392 7.10.204
0.3LOS
A 00.01 0.02 59.5
10 L 13 7.70.500
24.6LOSC 24 0.77 0.99 35.9
12 R 136 7.40.491
24.7LOSC 24 0.77 1.04 35.8
149 7.40.491 24.7 LOS
C 240.77 1.04 35.8
869 7.10.500
5.4
NotApplicable 24
0.14 0.27 52.4
Verney Road North
Approach
Pine Street
Approach
All Vehicles
Prop.Queued
Eff. StopRate
Verney Road South
Approach
Give-wayVehicle
Movements
Prop.Queu
ed
Eff.StopRate
Prop.Queued
Eff. StopRate
Approach
All Vehicles
Vehicle Movements Vehicle Movements
Verney Road South
Verney Road North
Approach
Approach
Pine Street
Approach
Development Entry
All Vehicles
Signalised - Fixed time Cycle Time = 30 seconds
Verney Road North
Approach
Pine Street
Approach
Verney Road South
Approach
Development Entry
Approach
Give-way
Road Verney Road N Devt. Entrance Verney Road S Pine Road
Pine Road
Devt. Entrance
Movement
Tota
l
Tota
l
Tota
l
Tota
l
ID

600 282 55 Shepparton NE Growth Development Movement Summary
Location: Verney Main Site Existing Peak Hour: 8:00 - 9:00am Verney Main Entrance
Verney Road (North) AM Peak
411 14 Growth Rate 1.015
per annum Vehicle Movements
66 No Years 11DemFlow
Deg ofSatn
AverDelay Level of 95% Aver
Speed
395(veh/
h) (v/c) (sec) Service Backof
(km/h)
Queue
(m)
260 84
Verney Road (Sth) 2 T 274 6.9 0.147 0.0 LOS A 0 0.00 0.00 60.0
3 R 88 6.8 0.100 10.8 LOS B 4 0.48 0.74 46.4
Verney Road (NorthVerney Road (Sth) Site Entrance 362 6.9 0.147 2.6 LOS A 4 0.12 0.18 56.0
R T T L R L
1 2 8 9 10 12 4 L 416 7.0 0.586 14.0 LOS B 41 0.67 1.02 43.6
8:00 - 9:00am 0 349 349 221 0 221 0 0 0 6 R 69 7.1 0.315 27.1 LOS D 12 0.81 0.99 34.4
2020 Growth - 411 411 260 - 260 - - - 486 7.0 0.586 15.9 LOS C 41 0.69 1.02 42.0
Devt Traffic 14 - - 84 66 395 461
2020 + Devt 14 411 411 260 84 260 66 395 461 7 L 15 6.7 0.008 8.4 LOS A 0 0.00 0.67 49.0
8 T 433 6.9 0.232 0.0 LOS A 0 0.00 0.00 60.0
447 6.9 0.232 0.3 LOS A 0.00 0.02 59.61295
6.9 0.586 6.8Not
Applicable 41 0.29 0.44 50.7
Verney Road North
Approach
All Vehicles
%HVProp.Queue
d
Eff.StopRate
Give-Way
Verney Road South
Tota
l
Main Site Entrance
Approach
MovID Turn
ApproachSite Entrance
ID
Road
Movement
Tota
l
Tota
l
P:\60028255 V07PU Shepparton\6_Draft_docs\6.1_Reports\Traffic and Transportation\Draft Report Nov 09\Appendices\10Dec09 Shepparton Sidra 2020 Access Points.xls10Dec09 Shepparton Sidra 2020 AccessPoints.xls15/12/2009 1

600 282 55 Shepparton NE Growth Development Movement Summary
Location: Verney Main Site Existing Peak Hour: PM Verney Main Entrance
Verney Road (North) PM Peak
438 52 Growth Rate 1.015
per annum Vehicle Movements
27 No Years 11DemFlow
Deg ofSatn
AverDelay Level of 95% Aver
Speed
165(veh/
h) (v/c) (sec) Service Backof
(km/h)
Queue
(m)
265 315
Verney Road (Sth) 2 T 279 7.2 0.150 0.0 LOS A 0 0.00 0.00 60.0
3 R 332 6.9 0.409 12.9 LOS B 22 0.61 0.94 44.5
Verney Road (North) Verney Road (Sth) Site Entrance 610 7.0 0.409 7.0 LOS A 22 0.33 0.51 50.5
L T T R R L
1 2 8 9 10 12 4 L 174 6.9 0.261 11.6 LOS B 10 0.55 0.82 45.9
8:00 - 9:00am 0 372 372 225 0 225 0 0 0 6 R 28 7.1 0.237 41.9 LOS E 7 0.89 0.99 27.9
2020 Growth - 438 438 265 - 265 - - - 202 6.9 0.261 15.8 LOS C 10 0.60 0.84 42.2
Devt Traffic 52 - - 315 27 165 192
2020 + Devt 52 438 438 265 315 265 27 165 192 7 L 55 7.3 0.031 8.4 LOS A 0 0.00 0.67 49.0
8 T 461 6.9 0.247 0.0 LOS A 0 0.00 0.00 60.0
516 7.0 0.247 0.9 LOS A 0.00 0.07 58.61328
7.0 0.409 6.0Not
Applicabl 22 0.24 0.39 51.7All Vehicles
Approach
Main Site Entrance
Approach
Verney Road North
Turn %HVProp.Queue
d
Eff.StopRate
Verney Road South
Approach
Site Entrance
Give-Way
ID
Road
Movement
Tota
l
Tota
l
Tota
l
MovID
P:\60028255 V07PU Shepparton\6_Draft_docs\6.1_Reports\Traffic and Transportation\Draft Report Nov 09\Appendices\10Dec09 Shepparton Sidra 2020 Access Points.xls10Dec09 Shepparton Sidra 2020Access Points.xls15/12/2009 2
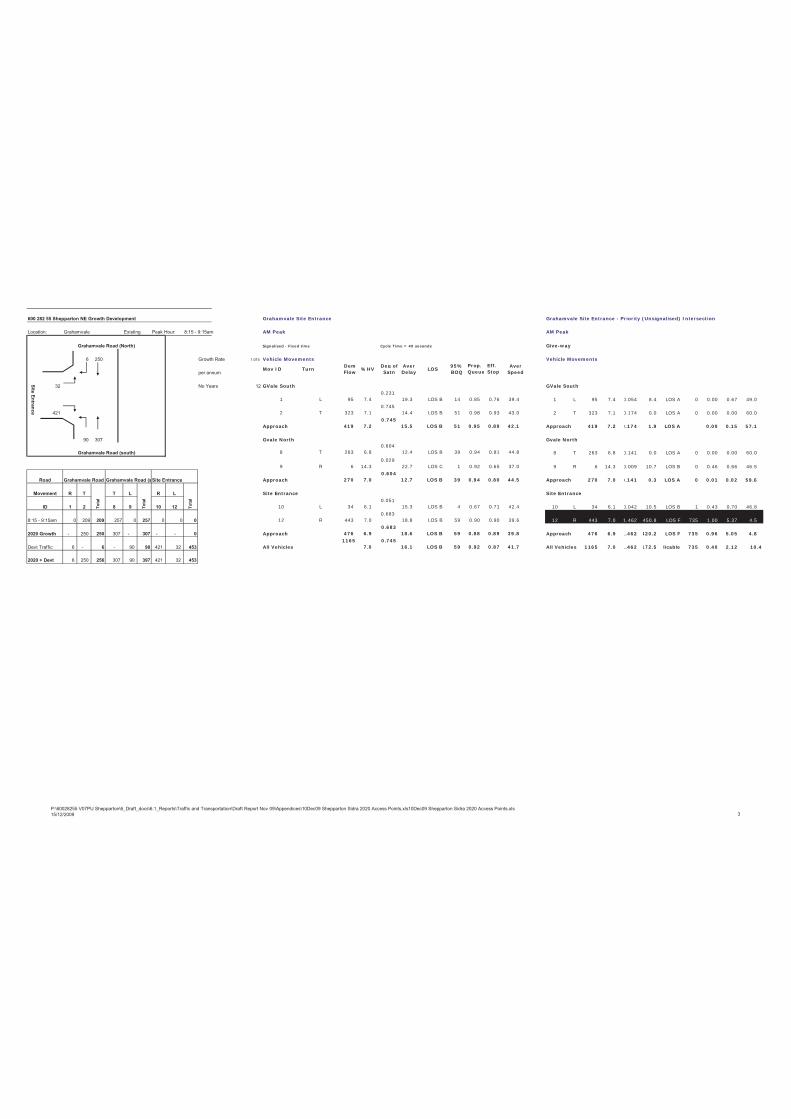
600 282 55 Shepparton NE Growth Development Grahamvale Site Entrance Grahamvale Site Entrance - Priority (Unsignalised) Intersection
Location: Grahamvale Existing Peak Hour: 8:15 - 9:15am AM Peak AM Peak
Grahamvale Road (North)
6 250 Growth Rate 1.015 Vehicle Movements Vehicle Movements
per annumMov ID Turn Dem
Flow %HV Deg ofSatn
AverDelay LOS 95%
BOQProp.Queue
Eff.Stop
AverSpeed
32 No Years 12
1 L 95 7.40.231
19.3 LOS B 14 0.85 0.76 39.4 1 L 95 7.4 0.054 8.4 LOS A 0 0.00 0.67 49.0
421 2 T 323 7.10.745
14.4 LOS B 51 0.98 0.93 43.0 2 T 323 7.1 0.174 0.0 LOS A 0 0.00 0.00 60.0
419 7.20.745
15.5 LOS B 51 0.95 0.89 42.1 419 7.2 0.174 1.9 LOS A 0.00 0.15 57.1
90 307
Grahamvale Road (south) 8 T 263 6.80.604
12.4 LOS B 39 0.94 0.81 44.8 8 T 263 6.8 0.141 0.0 LOS A 0 0.00 0.00 60.0
9 R 6 14.30.029
22.7 LOS C 1 0.92 0.65 37.0 9 R 6 14.3 0.009 10.7 LOS B 0 0.46 0.66 46.5
Grahamvale Road Grahamvale Road (sSite Entrance 270 7.00.604
12.7 LOS B 39 0.94 0.80 44.5 270 7.0 0.141 0.3 LOS A 0 0.01 0.02 59.6
R T T L R L
1 2 8 9 10 12 10 L 34 6.10.051
15.3 LOS B 4 0.67 0.71 42.4 10 L 34 6.1 0.042 10.5 LOS B 1 0.43 0.70 46.8
8:15 - 9:15am 0 209 209 257 0 257 0 0 0 12 R 443 7.00.683
18.8 LOS B 59 0.90 0.90 39.6 12 R 443 7.0 1.462 450.8 LOS F 735 1.00 5.37 4.5
2020 Growth - 250 250 307 - 307 - - 0 476 6.90.683
18.6 LOS B 59 0.88 0.89 39.8 476 6.9 1.462 420.2 LOS F 735 0.96 5.05 4.8
Devt Traffic 6 - 6 - 90 90 421 32 4531165
7.00.745
16.1 LOS B 59 0.92 0.87 41.7 1165 7.0 1.462 172.5 plicable 735 0.40 2.12 10.4
2020 + Devt 6 250 256 307 90 397 421 32 453
Give-way
GVale South
Approach
Gvale North
Approach
Site Entrance
Approach
All Vehicles
Signalised - Fixed time Cycle Time = 40 seconds
ID
GVale South
Approach
Gvale North
Road
Movement
Tota
l
Tota
l
Tota
l
Approach
Site Entrance
Approach
All Vehicles
Site Entrance
P:\60028255 V07PU Shepparton\6_Draft_docs\6.1_Reports\Traffic and Transportation\Draft Report Nov 09\Appendices\10Dec09 Shepparton Sidra 2020 Access Points.xls10Dec09 Shepparton Sidra 2020 Access Points.xls15/12/2009 3

600 282 55 Shepparton NE Growth Development Grahamvale Site Entrance
Location: Grahamvale Existing Peak Hour: PM AM Peak
Grahamvale Road (North)
21 283 Growth Rate 1.015 Vehicle Movements
per annumMov ID Turn Dem
Flow %HV Deg ofSatn
AverDelay LOS 95%
BOQProp.Queue
Eff.Stop
AverSpeed
11 No Years 12
1 L 331 7.00.734
18.2 LOS B 99 0.83 0.91 40.1
176 2 T 371 7.00.735
9.8 LOS A 99 0.83 0.80 47.3
701 7.00.734
13.8 LOS B 99 0.83 0.85 43.6
314 352
Grahamvale Road (south) 8 T 298 7.00.392
7.5 LOS A 42 0.69 0.58 49.7
9 R 22 8.70.391
16.3 LOS B 42 0.69 0.80 41.6
Grahamvale Road Grahamvale Road (sSite Entrance 321 7.20.392
8.2 LOS A 42 0.69 0.60 49.0
R T T L R L
1 2 8 9 10 12 10 L 12 8.30.635
27.0 LOS C 40 0.98 0.86 34.5
8:15 - 9:15am 0 237 237 294 0 294 0 0 0 12 R 185 7.00.637
27.3 LOS C 40 0.98 0.86 34.3
2020 Growth - 283 283 352 - 352 - - 0 197 7.10.637
27.3 LOS C 40 0.98 0.86 34.3
Devt Traffic 21 - 21 - 314 314 176 11 1871219
7.10.735
14.5 LOS B 99 0.82 0.79 43.0
2020 + Devt 21 283 304 352 314 666 176 11 187
Signalised - Fixed time
ID
GVale South
Approach
Gvale North
Road
Movement
Tota
l
Tota
l
Tota
l
Approach
Site Entrance
Approach
All Vehicles
Site Entrance
P:\60028255 V07PU Shepparton\6_Draft_docs\6.1_Reports\Traffic and Transportation\Draft Report Nov 09\Appendices\10Dec09 Shepparton Sidra 2020 Access Points.xls10Dec09 Shepparton Sidra 2020 Access Points.xls15/12/2009 4

600 282 55 Shepparton NE Growth Development Movement SummaryLocation: Ford Site Entrance Existing Peak Hour: 8:15 - 9:15am Ford Road Site Entrance
AM Peak
Growth Rate 1.015
per annum Vehicle Movements
60 78 No Years 12MovID Turn Dem
Flow %HVDegof
Satn
AverDelay LOS 95%
BOQProp.Queued
Eff.StopRate
AverSpeed
- 22
1 L 150.0 0.167
10.0 LOS A 7 0.36 0.63 47.0
3 R 1117.2 0.163
10.4 LOS B 7 0.36 0.68 46.9
- 105 1138.0 0.16
3 10.4 LOS B 7 0.36 0.68 46.9
Site Entrance
4 L 238.3 0.014
8.4 LOS A 0 0.00 0.67 49.0
Ford Road E Site Entrance Ford Road W 5 T 827.3 0.044
0.0 LOS A 0 0.00 0.00 60.0
T L R L R T 1067.5 0.04
4 1.9 LOS A 0.00 0.15 57.1
5 6 7 9 10 11
8:15 - 9:15am 65 0 65 0 0 0 0 50 50 11 T 636.3 0.034
0.0 LOS A 0 0.00 0.00 60.0
2020 Growth 78 - 78 - - - - 60 60 12 R 150.0 0.003
9.2 LOS A 0 0.25 0.62 47.6
Devt Traffic - 22 22 105 - 105 - - 657.7 0.03
4 0.3 LOS A 0 0.01 0.02 59.5
2020 + Devt 78 22 100 105 - 105 - 60 60 2847.7 0.16
7 4.9
oApplica
ble 7 0.15 0.33 53All Vehicles
Approach
New E leg
Approach
New W leg
Movement
Tota
l
Tota
l
Tota
l
ID
Approach
New S leg
Ford Road W
Ford Road E
Give-way
Road
P:\60028255 V07PU Shepparton\6_Draft_docs\6.1_Reports\Traffic and Transportation\Draft Report Nov 09\Appendices\10Dec09 Shepparton Sidra 2020 Access Points.xls10Dec09Shepparton Sidra 2020 Access Points.xls15/12/2009 5

600 282 55 Shepparton NE Growth Development Ford Road Site EntranceLocation: Ford Site Entrance Existing Peak Hour: PM PM Peak
Growth Rate 1.015 Vehicle Movements
per annumMovID Turn Dem
Flow %HV Deg ofSatn
AverDelay LOS 95%
BOQProp.Queued
Eff.StopRate
AverSpeed
49 51 No Years 11
- 84 1 L 150.0
0.069 9.7 LOS A 3 0.33 0.62 47.3
3 R 46 6.5 0.068 10.1 LOS B 3 0.33 0.66 47.2
488.3
0.068 10.1 LOS B 3 0.33 0.66 47.2
- 44
Site Entrance 4 L 88 6.8 0.050 8.4 LOS A 0 0.00 0.67 49.0
5 T 54 7.4 0.029 0.0 LOS A 0 0.00 0.00 60.0
Ford Road E Site Entrance Ford Road W 1427.0
0.050 5.2 LOS A 0.00 0.41 52.6
T L R L R T5 6 7 9 10 11 11 T 52 7.7 0.028 0.0 LOS A 0 0.00 0.00 60.0
8:15 - 9:15am 43 0 43 0 0 0 0 42 42 12 R 150.0
0.003 9.5 LOS A 0 0.30 0.62 47.5
2020 Growth 51 - 51 - - - - 49 49 549.3
0.028 0.4 LOS A 0 0.01 0.02 59.4
Devt Traffic - 84 84 44 - 44 - - 2447.8
0.069 5.1Not
Applicable 3 0.07 0.38 52.8
2020 + Devt 51 84 135 44 - 44 - 49 49
Ford Road West
Approach
All Vehicles
Site Entrance
Approach
Ford Road East
Approach
Give-way
RoadMovement
Tota
l
Tota
l
Tota
l
ID
Ford Road W
Ford Road E
P:\60028255 V07PU Shepparton\6_Draft_docs\6.1_Reports\Traffic and Transportation\Draft Report Nov 09\Appendices\10Dec09 Shepparton Sidra 2020 Access Points.xls10Dec09 SheppartonSidra 2020 Access Points.xls15/12/2009 6

AECOMShepparton North East Growth Corridor DevelopmentTraffic Impact Assessment
D R A F T
P:\60028255 V07PU Shepparton\6_Draft_docs\6.1_Reports\Traffic and Transportation\Draft Report Nov 09\1007tpe Traffic Assessment 17Dec09.docxRevision - 17 December 2009
Appendix C
Additional Traffic Movement Distribution

North East Development Growth Area Traffic Generation and Trip RatesResidential
Peak Hour 24 HourTotal Dwellings 1677 Total Dwellings 1677Peak hr movements (per dwe 90% 1509 24 Hr Traffic (movements/dwelling) 10 16770
AM PeakIn 10% 151Out 90% 1358 1509
PM PeakIn 70% 1057Out 30% 453
Retail and Community Uses
Peak Hour 24 HourTotal Retail Area 1350 sqm Total Retail Area 1350 sqm% of Passing Trade 0 % of Passing Trade 0Peak Hour Trips 13 24 Hr Trips 121Peak Hour Retail Trips 169 24 Hour Total Retail Trips 1634Peak Hour External Retail T 17 24 Hour Total Trips from Externa163
AM PeakIn 50% 8Out 50% 8
PM PeakIn 50% 8Out 50% 8
24Novt09 Traffic Distribution and Assignment 16/12/200910:34 AM

North East Development Growth Area Traffic Generation and Trip RatesTotal Peak Hour Trips
Trips In Trips Out Trips In Trips OutResidential 1342 10% 90% 70% 30%Retail 17 50% 50% 50% 50%Primary School Staff 35 100% 0% 0% 100%Primary School Students 203 50% 50% 50% 50%
Trips In Trips Out Trips In Trips OutResidential 1342 134 1208 939 403Retail 17 9 8 8 9Primary School 238 137 101 101 137Total 1597 280 1317 1048 549
AM Peak PM Peak
AM Peak PM PeakLand Use
Land Use Trips perPeak Hour
Trips perPeak Hour

North East Development Growth Area Trip Distribution
Trips In Trips Out Trips In Trips OutResidential 1342 134 1208 939 403Retail 17 9 8 8 9Primary School 238 137 101 101 137Total 1597 280 1317 1048 549
Verney MainVerney 2ndryGrahamvaleFord1 2 3 4 check
South 60% 20% 20% 20% 0% 0%West 20% 10% 5% 5% 0% 0%East 10% 0% 0% 5% 5% 0%North 10% 5% 0% 2% 3% 0%
35% 25% 32% 8%
AM Peak Hour
Trips In Trips Out Trips In Trips Out Trips In Trips Out Trips In Trips OutSouth 60% 56 263 56 263 56 263 0 0West 20% 28 132 14 66 14 66 0 0East 10% 0 0 0 0 14 66 14 66North 10% 14 66 0 0 6 26 8 40Total 98 461 70 329 90 421 22 105
559 399 511 128PM Peak Hour
Trips In Trips Out Trips In Trips Out Trips In Trips Out Trips In Trips OutSouth 60% 210 110 210 110 210 110 0 0West 20% 105 55 52 27 52 27 0 0East 10% 0 0 0 0 52 27 52 27North 10% 52 27 0 0 21 11 31 16Total 367 192 262 137 335 176 84 44
559 399 511 128
Land UseTrips per
Peak HourAM Peak PM Peak
Access Points
Access PointsVerney Road (Main) Verney Road (Secondary Grahamvale Road Ford Road
Access PointsVerney Road (Main) Verney Road (Secondary Grahamvale Road Ford RoadDistributio
n Share
DirectionDistributio
n Share
Distribution ShareDirection
Direction

AECOMShepparton North East Growth Corridor DevelopmentTraffic Impact Assessment
D R A F T
P:\60028255 V07PU Shepparton\6_Draft_docs\6.1_Reports\Traffic and Transportation\Draft Report Nov 09\1007tpe Traffic Assessment 17Dec09.docxRevision - 17 December 2009
Appendix D
Crash History Data

Road Crash Statistics: Victoria Accidents By Site Page 1Location is Town(s): SHEPPARTON, SHEPPARTON NORTH; Query: Casualty accidents; Sites: On Ford Rd between Verney Rd and , Intersection of Goulburn Valley Hwy and Brauman Street, On Dookie-Shepparton Road (2.176 km)between Apollo Drive and Drummond Road, On Dookie-Shepparton Road (2.366 km) between Drummond Road and Mcgill Street, Intersection of Pine Road and Verney Road, Intersection of Dookie-Shepparton Road and Drummond Road, Intersection of Dookie-Shepparton Road and Orr Street, Intersection of Dookie-Shepparton Road and Hawdon Street, Intersection of Goulburn Valley Highway Inbound Cwy and Hawkins Street, Intersection of Goulburn Valley Highway Inbound Cwy and Graham Street, Intersection of Graham Street and Verney Road, Intersection of Oak Street and Verney Road, Intersection of Dookie-Shepparton Road and Shepparton Alternative Rout, Intersection of Clarke Court and Verney Road, Intersection of Goulburn Valley Hwy and Goulburn Valley Hwy, Intersection of Dookie-Shepparton Road and Corio Street, Intersection of Dookie-Shepparton Road and Dunrobin Street, Intersection of Dookie-Shepparton Road and Bourchier Street, Intersection of Goulburn Valley Hwy and Ford Road, Intersection of Ford Road and Verney Road, Intersection of Goulburn Valley Hwy and Brauman Street, Intersection of Dookie-Shepparton Road and Wheeler Street, Intersection of Crestwood Grove and Verney Road, Intersection of Ann Wood Nook and Ford Road, Intersection of Dookie-Shepparton Road and Alamein Street, Intersection of Dookie-Shepparton Road and Maude Street, Intersection ofDookie-Shepparton Road and Kilpatrick Avenue, Intersection of Birch Street and Verney Road, Intersection of Dookie-Shepparton Road and Dunkirk Avenue, Intersection of Dookie-Shepparton Road and Glenn Street, On Hawdon Street (0.798 km) between Dookie-Shepparton Road / Verney Road and Annerley Avenue, On Hawkins Street (1.212 km) between Pontiac Avenue and Verney Road, On Brauman Street (0.7 km) between Fenn Street and Goulburn Valley Hwy, On Verney Road (0.143 km) between Elm Terrace and Birch Street, On Graham Street (0.05 km) between Goulburn Valley Highway Inbound Cwy and Dunlop Street, On Ford Road (1.724 km) between Ann Wood Nook and Matilda Drive, On ...Map Refs Location SEVERITY DCA GROUPS OBJECT HIT ROAD LIGHT VEHICLE NUMBERS YEARLY TRENDRoad Number (Road names) ALL FatalSeriousOther Pedes Cross Right Right Lost Rear Fence MotorKm from start injury Injury trian Traffic Near AgainstControlEnd PoleTreeWall Dry Wet Day Dark Car Truck Cycle Bike '04 '05 '06 '07 '08VCD ED7 On Brauman Street 1 1 1 2 1673 O4 btw Fenn Street114190 & Goulburn Valley Hwy0.453 KmShepparton
VCD ED7 At Goulburn Valley Highway Inbound Cwy 2 1 1 1 1 2 2 4 1 1673 P3 & Hawkins Street2640178.406 KmShepparton
VCD ED7 On Hawkins Street 1 1 1 1 2 1673 P3 btw Sali Drive151212 & Kestrel Drive0.398 KmShepparton
VCD ED7 Complex intersection 7 5 2 6 1 7 4 3 13 1 1 2 4673 P4 no. 30562640 At Goulburn Valley Hwy178.037 Km & Brauman StreetShepparton
VCD ED7 At Goulburn Valley Highway Inbound Cwy 3 3 3 2 1 5 1 1 1 1673 P5 & Graham Street2640177.463 KmShepparton
VCD ED7 On Graham Street 1 1 1 1 1 1 1 1673 P5 btw Goulburn Valley Highway Inbound Cwy146825 & Dunlop Street0.050 KmShepparton
VCD ED7 At Goulburn Valley Hwy 5 5 1 1 2 4 1 4 1 10 1 1 1 1 2673 P6 & Goulburn Valley Hwy2640176.982 KmShepparton
VCD ED7 At Dookie-Shepparton Road 1 1 1 1 1 1 1673 P6 & Orr Street54090.243 KmShepparton
VCD ED7 At Dookie-Shepparton Road 1 1 1 1 1 1 1673 P6 & Kilpatrick Avenue54090.268 KmShepparton
(c) 2004 VicRoads
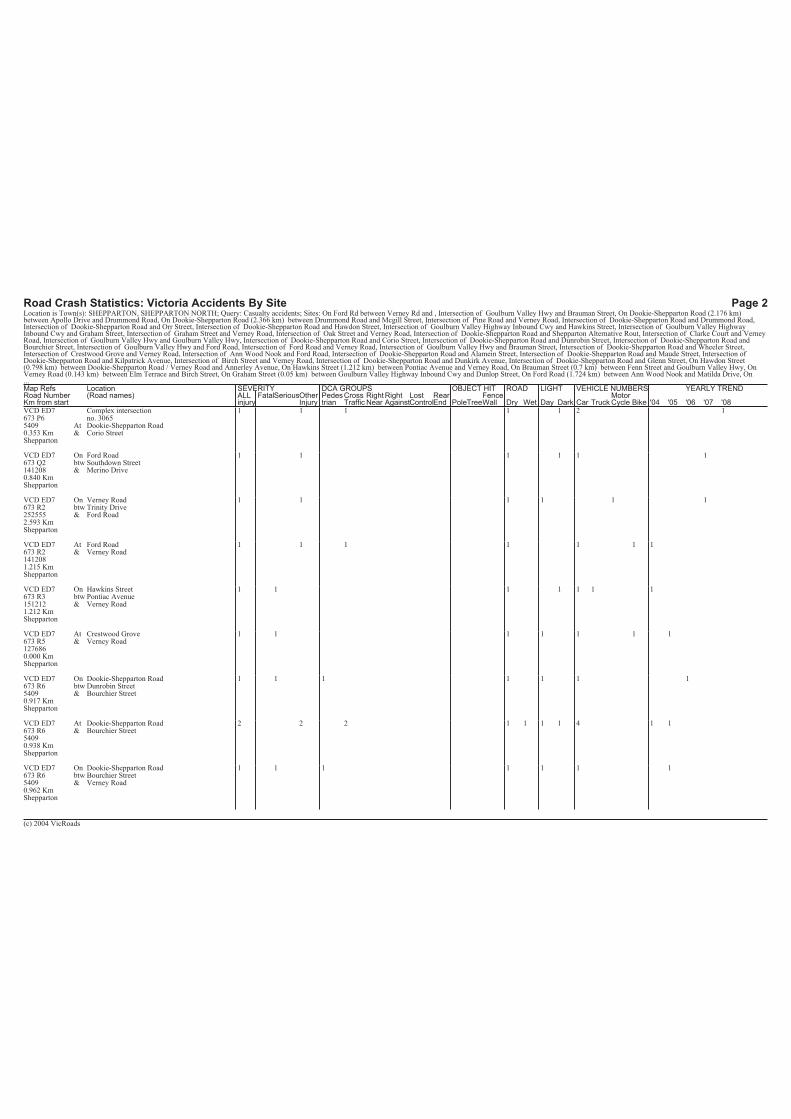
Road Crash Statistics: Victoria Accidents By Site Page 2Location is Town(s): SHEPPARTON, SHEPPARTON NORTH; Query: Casualty accidents; Sites: On Ford Rd between Verney Rd and , Intersection of Goulburn Valley Hwy and Brauman Street, On Dookie-Shepparton Road (2.176 km)between Apollo Drive and Drummond Road, On Dookie-Shepparton Road (2.366 km) between Drummond Road and Mcgill Street, Intersection of Pine Road and Verney Road, Intersection of Dookie-Shepparton Road and Drummond Road, Intersection of Dookie-Shepparton Road and Orr Street, Intersection of Dookie-Shepparton Road and Hawdon Street, Intersection of Goulburn Valley Highway Inbound Cwy and Hawkins Street, Intersection of Goulburn Valley Highway Inbound Cwy and Graham Street, Intersection of Graham Street and Verney Road, Intersection of Oak Street and Verney Road, Intersection of Dookie-Shepparton Road and Shepparton Alternative Rout, Intersection of Clarke Court and Verney Road, Intersection of Goulburn Valley Hwy and Goulburn Valley Hwy, Intersection of Dookie-Shepparton Road and Corio Street, Intersection of Dookie-Shepparton Road and Dunrobin Street, Intersection of Dookie-Shepparton Road and Bourchier Street, Intersection of Goulburn Valley Hwy and Ford Road, Intersection of Ford Road and Verney Road, Intersection of Goulburn Valley Hwy and Brauman Street, Intersection of Dookie-Shepparton Road and Wheeler Street, Intersection of Crestwood Grove and Verney Road, Intersection of Ann Wood Nook and Ford Road, Intersection of Dookie-Shepparton Road and Alamein Street, Intersection of Dookie-Shepparton Road and Maude Street, Intersection ofDookie-Shepparton Road and Kilpatrick Avenue, Intersection of Birch Street and Verney Road, Intersection of Dookie-Shepparton Road and Dunkirk Avenue, Intersection of Dookie-Shepparton Road and Glenn Street, On Hawdon Street (0.798 km) between Dookie-Shepparton Road / Verney Road and Annerley Avenue, On Hawkins Street (1.212 km) between Pontiac Avenue and Verney Road, On Brauman Street (0.7 km) between Fenn Street and Goulburn Valley Hwy, On Verney Road (0.143 km) between Elm Terrace and Birch Street, On Graham Street (0.05 km) between Goulburn Valley Highway Inbound Cwy and Dunlop Street, On Ford Road (1.724 km) between Ann Wood Nook and Matilda Drive, On ...Map Refs Location SEVERITY DCA GROUPS OBJECT HIT ROAD LIGHT VEHICLE NUMBERS YEARLY TRENDRoad Number (Road names) ALL FatalSeriousOther Pedes Cross Right Right Lost Rear Fence MotorKm from start injury Injury trian Traffic Near AgainstControlEnd PoleTreeWall Dry Wet Day Dark Car Truck Cycle Bike '04 '05 '06 '07 '08VCD ED7 Complex intersection 1 1 1 1 1 2 1673 P6 no. 30655409 At Dookie-Shepparton Road0.353 Km & Corio StreetShepparton
VCD ED7 On Ford Road 1 1 1 1 1 1673 Q2 btw Southdown Street141208 & Merino Drive0.840 KmShepparton
VCD ED7 On Verney Road 1 1 1 1 1 1673 R2 btw Trinity Drive252555 & Ford Road2.593 KmShepparton
VCD ED7 At Ford Road 1 1 1 1 1 1 1673 R2 & Verney Road1412081.215 KmShepparton
VCD ED7 On Hawkins Street 1 1 1 1 1 1 1673 R3 btw Pontiac Avenue151212 & Verney Road1.212 KmShepparton
VCD ED7 At Crestwood Grove 1 1 1 1 1 1 1673 R5 & Verney Road1276860.000 KmShepparton
VCD ED7 On Dookie-Shepparton Road 1 1 1 1 1 1 1673 R6 btw Dunrobin Street5409 & Bourchier Street0.917 KmShepparton
VCD ED7 At Dookie-Shepparton Road 2 2 2 1 1 1 1 4 1 1673 R6 & Bourchier Street54090.938 KmShepparton
VCD ED7 On Dookie-Shepparton Road 1 1 1 1 1 1 1673 R6 btw Bourchier Street5409 & Verney Road0.962 KmShepparton
(c) 2004 VicRoads

Road Crash Statistics: Victoria Accidents By Site Page 3Location is Town(s): SHEPPARTON, SHEPPARTON NORTH; Query: Casualty accidents; Sites: On Ford Rd between Verney Rd and , Intersection of Goulburn Valley Hwy and Brauman Street, On Dookie-Shepparton Road (2.176 km)between Apollo Drive and Drummond Road, On Dookie-Shepparton Road (2.366 km) between Drummond Road and Mcgill Street, Intersection of Pine Road and Verney Road, Intersection of Dookie-Shepparton Road and Drummond Road, Intersection of Dookie-Shepparton Road and Orr Street, Intersection of Dookie-Shepparton Road and Hawdon Street, Intersection of Goulburn Valley Highway Inbound Cwy and Hawkins Street, Intersection of Goulburn Valley Highway Inbound Cwy and Graham Street, Intersection of Graham Street and Verney Road, Intersection of Oak Street and Verney Road, Intersection of Dookie-Shepparton Road and Shepparton Alternative Rout, Intersection of Clarke Court and Verney Road, Intersection of Goulburn Valley Hwy and Goulburn Valley Hwy, Intersection of Dookie-Shepparton Road and Corio Street, Intersection of Dookie-Shepparton Road and Dunrobin Street, Intersection of Dookie-Shepparton Road and Bourchier Street, Intersection of Goulburn Valley Hwy and Ford Road, Intersection of Ford Road and Verney Road, Intersection of Goulburn Valley Hwy and Brauman Street, Intersection of Dookie-Shepparton Road and Wheeler Street, Intersection of Crestwood Grove and Verney Road, Intersection of Ann Wood Nook and Ford Road, Intersection of Dookie-Shepparton Road and Alamein Street, Intersection of Dookie-Shepparton Road and Maude Street, Intersection ofDookie-Shepparton Road and Kilpatrick Avenue, Intersection of Birch Street and Verney Road, Intersection of Dookie-Shepparton Road and Dunkirk Avenue, Intersection of Dookie-Shepparton Road and Glenn Street, On Hawdon Street (0.798 km) between Dookie-Shepparton Road / Verney Road and Annerley Avenue, On Hawkins Street (1.212 km) between Pontiac Avenue and Verney Road, On Brauman Street (0.7 km) between Fenn Street and Goulburn Valley Hwy, On Verney Road (0.143 km) between Elm Terrace and Birch Street, On Graham Street (0.05 km) between Goulburn Valley Highway Inbound Cwy and Dunlop Street, On Ford Road (1.724 km) between Ann Wood Nook and Matilda Drive, On ...Map Refs Location SEVERITY DCA GROUPS OBJECT HIT ROAD LIGHT VEHICLE NUMBERS YEARLY TRENDRoad Number (Road names) ALL FatalSeriousOther Pedes Cross Right Right Lost Rear Fence MotorKm from start injury Injury trian Traffic Near AgainstControlEnd PoleTreeWall Dry Wet Day Dark Car Truck Cycle Bike '04 '05 '06 '07 '08VCD ED7 On Hawdon Street 2 2 2 2 2 5 1 1673 R6 btw Dookie-Shepparton Road151138 & Annerley Avenue0.808 KmShepparton
VCD ED7 At Dookie-Shepparton Road 5 1 4 2 2 1 5 1 3 4 1 2 1 1 1 1 1673 R6 & Hawdon Street2525550.007 KmShepparton
VCD ED7 At Dookie-Shepparton Road 2 2 1 1 2 1 1 2 1 1673 S6 & Wheeler Street54091.595 KmShepparton
VCD ED7 At Dookie-Shepparton Road 1 1 1 1 1 1 1 1673 T6 & Drummond Road54092.189 KmShepparton
VCD ED7 On Dookie-Shepparton Road 1 1 1 1 1 1 1673 T5 btw Drummond Road5409 & Mcgill Street2.366 KmShepparton
VCD ED7 On Drummond Road 1 1 1 1 1 1 1 1673 T6 btw Dookie-Shepparton Road133395 & Joseph Baldwin Place1.458 KmShepparton
VCD ED7 On Dookie-Shepparton Road 1 1 1 1 1 1 1673 U5 btw Mcgill Street5409 & Shepparton Alternative Rout2.582 KmShepparton
VCD ED7 At Dookie-Shepparton Road 1 1 1 1 1 1 1673 U5 & Shepparton Alternative Rout54092.745 KmShepparton
Totals: 46 16 3 1 7 1 1 3 16 5 5 12 730 7 9 6 1 43 26 65 6 10 6 11
(c) 2004 VicRoads

Road Crash Statistics: Victoria Accidents By Site Page 4Location is Town(s): SHEPPARTON, SHEPPARTON NORTH; Query: Casualty accidents; Sites: On Ford Rd between Verney Rd and , Intersection of Goulburn Valley Hwy and Brauman Street, On Dookie-Shepparton Road (2.176 km)between Apollo Drive and Drummond Road, On Dookie-Shepparton Road (2.366 km) between Drummond Road and Mcgill Street, Intersection of Pine Road and Verney Road, Intersection of Dookie-Shepparton Road and Drummond Road, Intersection of Dookie-Shepparton Road and Orr Street, Intersection of Dookie-Shepparton Road and Hawdon Street, Intersection of Goulburn Valley Highway Inbound Cwy and Hawkins Street, Intersection of Goulburn Valley Highway Inbound Cwy and Graham Street, Intersection of Graham Street and Verney Road, Intersection of Oak Street and Verney Road, Intersection of Dookie-Shepparton Road and Shepparton Alternative Rout, Intersection of Clarke Court and Verney Road, Intersection of Goulburn Valley Hwy and Goulburn Valley Hwy, Intersection of Dookie-Shepparton Road and Corio Street, Intersection of Dookie-Shepparton Road and Dunrobin Street, Intersection of Dookie-Shepparton Road and Bourchier Street, Intersection of Goulburn Valley Hwy and Ford Road, Intersection of Ford Road and Verney Road, Intersection of Goulburn Valley Hwy and Brauman Street, Intersection of Dookie-Shepparton Road and Wheeler Street, Intersection of Crestwood Grove and Verney Road, Intersection of Ann Wood Nook and Ford Road, Intersection of Dookie-Shepparton Road and Alamein Street, Intersection of Dookie-Shepparton Road and Maude Street, Intersection ofDookie-Shepparton Road and Kilpatrick Avenue, Intersection of Birch Street and Verney Road, Intersection of Dookie-Shepparton Road and Dunkirk Avenue, Intersection of Dookie-Shepparton Road and Glenn Street, On Hawdon Street (0.798 km) between Dookie-Shepparton Road / Verney Road and Annerley Avenue, On Hawkins Street (1.212 km) between Pontiac Avenue and Verney Road, On Brauman Street (0.7 km) between Fenn Street and Goulburn Valley Hwy, On Verney Road (0.143 km) between Elm Terrace and Birch Street, On Graham Street (0.05 km) between Goulburn Valley Highway Inbound Cwy and Dunlop Street, On Ford Road (1.724 km) between Ann Wood Nook and Matilda Drive, On ...Map Refs Location SEVERITY DCA GROUPS OBJECT HIT ROAD LIGHT VEHICLE NUMBERS YEARLY TRENDRoad Number (Road names) ALL FatalSeriousOther Pedes Cross Right Right Lost Rear Fence MotorKm from start injury Injury trian Traffic Near AgainstControlEnd PoleTreeWall Dry Wet Day Dark Car Truck Cycle Bike '04 '05 '06 '07 '08
Note:
Object Hit: Only most common categories listed. An animal or object is not his in every crash.Road Condition: Only dry and wet provided, other excluded.Accident numbers are tallied within each category except for VEHICLE subsection where number and type of vehicles within the accident are tallied.
The crashes on roads that make up local government area (lga) borders are allocated to both lgas. Double counting only occurs when two or more lgas are queried separately (not together).
(c) 2004 VicRoads